Attached files
| file | filename |
|---|---|
| 8-K - 8-K - United Financial Bancorp, Inc. | a8-k20151231.htm |
| EX-99.1 - EXHIBIT 99.1 - United Financial Bancorp, Inc. | ex-99120151231.htm |

Fourth Quarter 2015 EarningsNASDAQ Global Select Market: UBNK Create Your Balance

2NASDAQ: UBNK This Presentation contains forward-looking statements that are within the meaning of the Private Securities Litigation Reform Act of 1995. Such statements are based upon the current beliefs and expectations of our management and are subject to significant risks and uncertainties. These risks and uncertainties could cause our results to differ materially from those set forth in such forward-looking statements. Forward-looking statements can be identified by the fact that they do not relate strictly to historical or current facts. Words such as “believes,” “anticipates,” “expects,” “intends,” “plans,” “estimates,” “targeted” and similar expressions, and future or conditional verbs, such as “will,” “would,” “should,” “could” or “may” are intended to identify forward-looking statements but are not the only means to identify these statements. Forward-looking statements involve risks and uncertainties. Actual conditions, events or results may differ materially from those contemplated by a forward-looking statement. Factors that could cause this difference — many of which are beyond our control — include without limitation the following: Any forward-looking statements made by or on behalf of us in this Presentation speak only as of the date of this Presentation. We do not undertake to update forward-looking statements to reflect the impact of circumstances or events that arise after the date the forward-looking statement was made. The reader should; however, consult any further disclosures of a forward-looking nature we may make in future filings. With regard to presentations compared to peer institutions, the peer companies include: BHLB, BNCL, BPFH, BRKL, CBU, CUBI, DCOM, EGBN, FCF, FFIC, INDB, KRNY, NBTB, NPBC, NWBI, PFS, SASR, STBA, TMP, TRST, WSFS Data for peers is sourced from SNL Financial LLC. NON-GAAP FINANCIAL MEASURES This presentation references non-GAAP financial measures incorporating tangible equity and related measures, and operating earnings excluding non-recurring costs. These measures are commonly used by investors in evaluating financial condition. GAAP earnings are lower than core earnings primarily due to non- recurring conversion, balance sheet restructuring and cost cutting initiative related expenses. The efficiency ratio represents the ratio of non-interest expenses to the sum of net interest income before provision for loan losses and non-interest income, exclusive of net gain (loss) on limited partnership investments. The pre-provision net revenue to average assets ratio represents the ratio of net interest income, on a fully tax-equivalent basis, fees and other non-interest income, net of non-credit-related expenses as a percent of total average assets. The pre-provision net revenue to average equity ratio represents the ratio of net interest income, on a fully tax-equivalent basis, fees and other non-interest income, net of non-credit-related expenses as a percent of total average equity. Reconciliations are in earnings releases at www.unitedfinancialinc.com. Forward Looking Statements

3NASDAQ: UBNK Corporate Contacts William H. W. Crawford, IV Chief Executive Officer Eric R. Newell, CFA Executive Vice President, Chief Financial Officer 860-291-3722 or enewell@bankatunited.com Investor Information: Marliese L. Shaw Executive Vice President, Corporate Secretary/Investor Relations Officer 860-291-3622 or mshaw@bankatunited.com

4NASDAQ: UBNK Table of Contents Page 2016 Strategic Pillars 5 Marine Finance 6 Commercial Banking Strategy 10 Wealth Management Strategy 12 Capital Management Strategy 13 Improved Core Strength 14 2016 Forecast 15 Mortgage Banking 16 Indexed Pipelines 17 Appendix 18
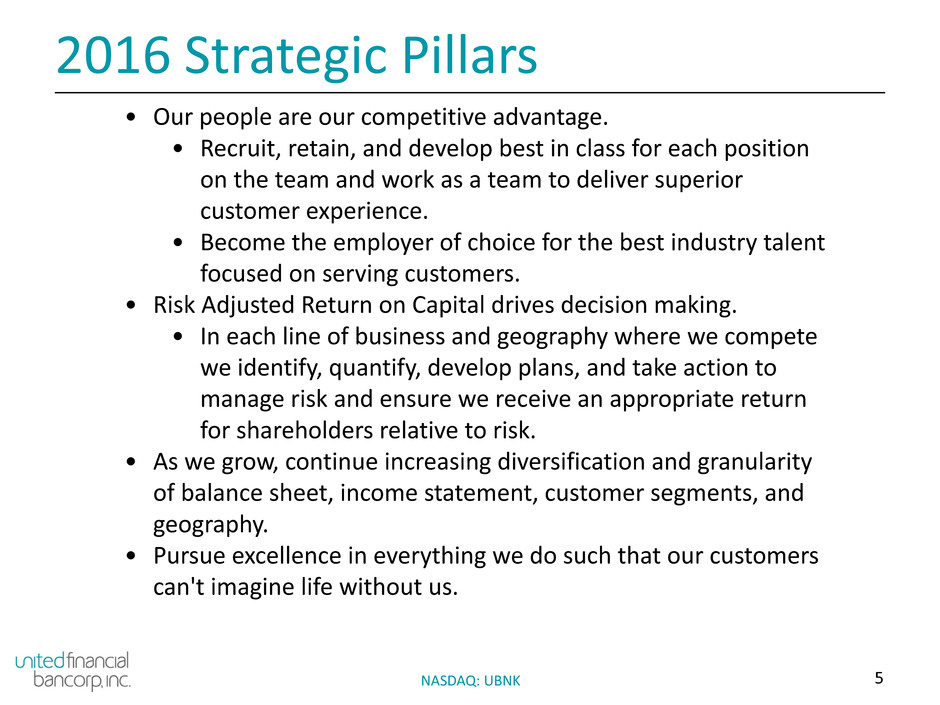
5NASDAQ: UBNK 2016 Strategic Pillars • Our people are our competitive advantage. • Recruit, retain, and develop best in class for each position on the team and work as a team to deliver superior customer experience. • Become the employer of choice for the best industry talent focused on serving customers. • Risk Adjusted Return on Capital drives decision making. • In each line of business and geography where we compete we identify, quantify, develop plans, and take action to manage risk and ensure we receive an appropriate return for shareholders relative to risk. • As we grow, continue increasing diversification and granularity of balance sheet, income statement, customer segments, and geography. • Pursue excellence in everything we do such that our customers can't imagine life without us.
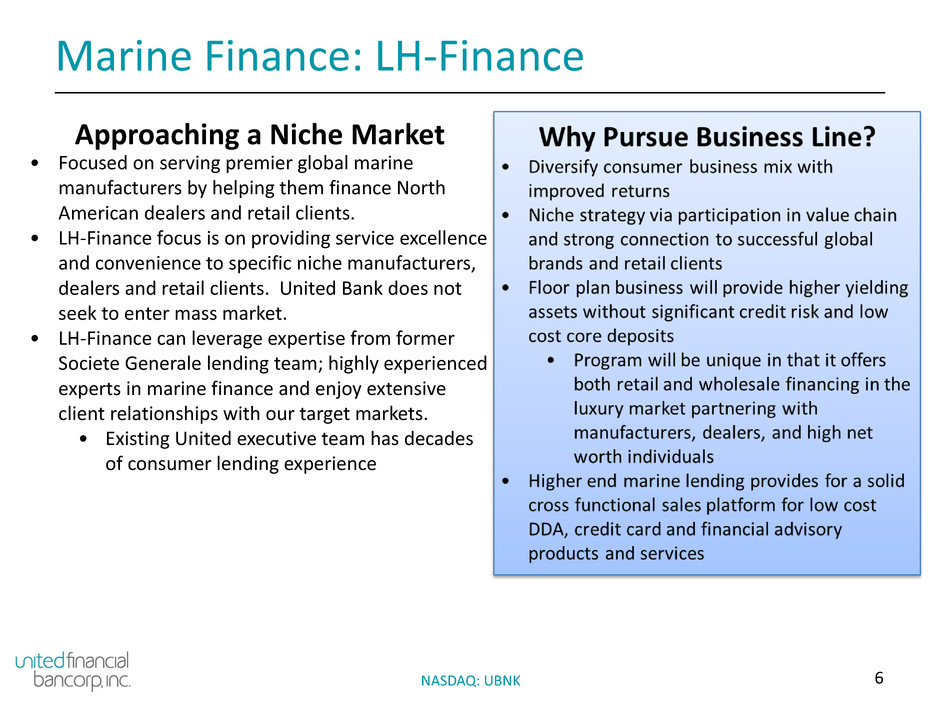
6NASDAQ: UBNK Marine Finance: LH-Finance Approaching a Niche Market • Focused on serving premier global marine manufacturers by helping them finance North American dealers and retail clients. • LH-Finance focus is on providing service excellence and convenience to specific niche manufacturers, dealers and retail clients. United Bank does not seek to enter mass market. • LH-Finance can leverage expertise from former Societe Generale lending team; highly experienced experts in marine finance and enjoy extensive client relationships with our target markets. • Existing United executive team has decades of consumer lending experience
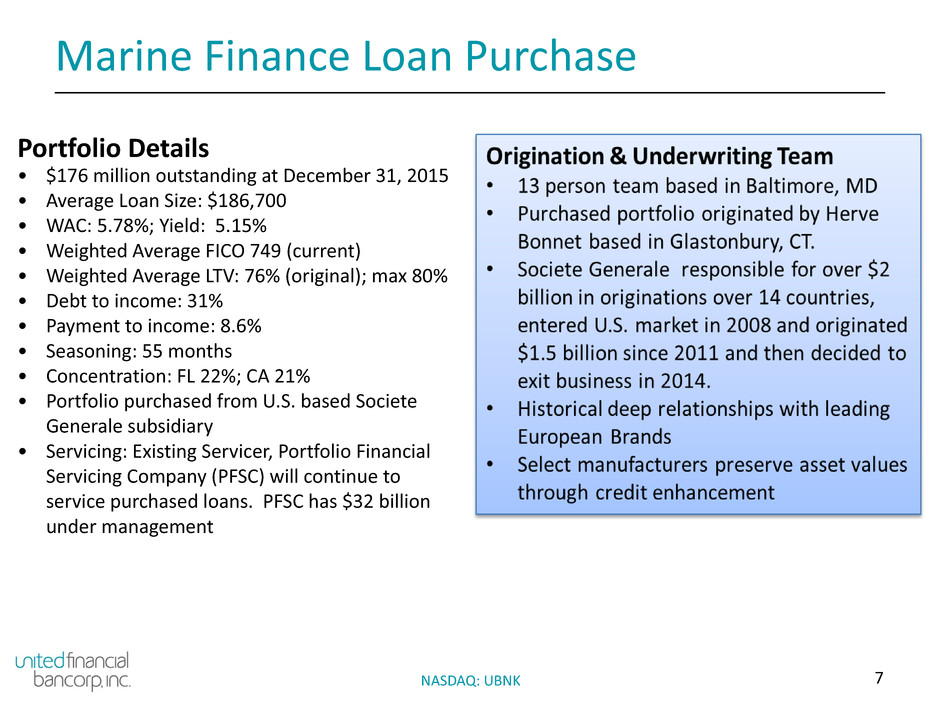
7NASDAQ: UBNK Marine Finance Loan Purchase Portfolio Details • $176 million outstanding at December 31, 2015 • Average Loan Size: $186,700 • WAC: 5.78%; Yield: 5.15% • Weighted Average FICO 749 (current) • Weighted Average LTV: 76% (original); max 80% • Debt to income: 31% • Payment to income: 8.6% • Seasoning: 55 months • Concentration: FL 22%; CA 21% • Portfolio purchased from U.S. based Societe Generale subsidiary • Servicing: Existing Servicer, Portfolio Financial Servicing Company (PFSC) will continue to service purchased loans. PFSC has $32 billion under management

8NASDAQ: UBNK Marine Finance Strategy Expectations • Starting in Q1/2016 begin retail originations based on CCO approved credit criteria • Starting in Q1/2016 develop and finalize relationships with manufacturers through floor plan originations • Business line will be managed not to exceed 10% of assets • Develop retail loan distribution channel to sell production and manage balance sheet exposure • Leverage existing cross sell initiatives to provide deposit and lending services • Credit Card, Home Equity, Auto Lending • Low cost core deposits • Financial Advisory

9NASDAQ: UBNK Marine Finance Partnerships Value Creation through Partnerships

10NASDAQ: UBNK Commercial Banking Strategy • Loan Production Focus w/ Geographical Diversification • New England Commercial & Industrial (including OOCRE) • Business Banking • New England Investor CRE • Secondary Education • Franchise Lending (National Brands) • Regional Investor CRE (Mid-Atlantic) • Shared National Credits • Cash Management to Drive Low Cost Core Deposits • Continue High Single Digit Growth • Slower CRE growth • Focus on C&I driving more favorable risk adjusted return • Focus on ROE Accretive Client Relationships • Improve Speed to Market via New Origination Platform Indexed Commercial Deposit Pipeline 160 140 120 100 80 $ (M ill io ns ) 201 5Q1 201 5Q2 201 5Q3 201 5Q4 100.0 152.2 157.6 136.6

11NASDAQ: UBNK Commercial Banking Strategy • Asset quality remains exceptional through diversification, granularity, that is accretive to risk adjusted capital

12NASDAQ: UBNK Wealth Management Strategy • New Leader of UNFA • Chris Nardone, formerly ran wealth management in New England region for First Niagara. • Shifting Retail Strategy • Moving to a series 6 (premier banker) and series 7 model in our branches • Shifting focus to assets under management (ongoing revenue) versus transactional (one-time fee) • Developing more profitable relationships with greater number of products sold per client on average • More efficiently grow deposits through assisting retail clients meet their financial management and investment goals • Meaningfully Contribute Profitability in 2H 2016

13NASDAQ: UBNK Capital Management Strategy • Drive Toward Becoming a “High Performing” Bank • Return on Assets (ROA) greater than 1.0% • Return on Equity (ROE) greater than 10.0% • Grow Book Value Per Share • Prudently Leverage Capital • Continue organic origination of ROA/ROE accretive assets • Maintain excellent asset quality • Tangible Common Equity Target = 7.50% • Maintain Ability to Repurchase Shares • Announced new 2.5% stock buyback authorization • Repurchased 8.0 million shares since March 2011

14NASDAQ: UBNK Improved Core Strength

15NASDAQ: UBNK 2016 Forecast

16NASDAQ: UBNK • Expected 4Q seasonality causing drop off of originations QoQ; but 19.9% improvement YoY • 58% of residential mortgage volume was for home purchases in full year 2015 • 35% of residential mortgage volume was ARMs in full year 2015 Mortgage Banking

17NASDAQ: UBNK Indexed Pipeline Metrics
18NASDAQ: UBNK APPENDIX

19NASDAQ: UBNK Balance Sheet Trends QoQ YoY 4Q15 vs 3Q15 4Q15 vs 4Q14 Balance Sheet ($ in thousands) 4Q2015 3Q2015 2Q2015 1Q2015 4Q2014 $ Change % Change $ Change % Change ASSETS Cash and cash equivalents $ 95,176 $ 98,310 $ 84,525 $ 89,361 $ 86,952 $ (3,134) (3.2)% $ 8,224 9.5% Securities 1,073,734 1,095,108 1,076,919 1,109,433 1,068,379 (21,374) (2.0) 5,355 0.5 Loans Held for Sale 10,136 13,511 28,017 13,002 8,220 (3,375) (25.0) 1,916 23.3 1-4 Family Residential 1,179,915 1,190,745 1,167,830 1,123,355 1,075,798 (10,830) (0.9) 104,117 9.7 Home Equity 431,282 335,220 333,983 331,206 337,941 96,062 28.7 93,341 27.6 Consumer 233,064 5,236 5,206 5,155 5,752 227,828 4,351.2 227,312 3,951.9 Residential Construction 41,084 33,648 24,306 17,840 13,258 7,436 22.1 27,826 209.9 Investor CRE 1,673,248 1,580,848 1,458,229 1,390,701 1,341,350 92,400 5.8 331,898 24.7 Owner occupied CRE 322,084 340,047 305,522 301,176 337,586 (17,963) (5.3) (15,502) (4.6) Commercial Business 603,332 576,899 634,529 603,761 613,596 26,433 4.6 (10,264) (1.7) Commercial Construction (ADC) 129,922 146,975 142,462 131,539 172,585 (17,053) (11.6) (42,663) (24.7) Loans - net 4,587,062 4,185,032 4,048,770 3,884,067 3,877,063 402,030 9.6 709,999 18.3 Deferred tax asset, net 33,094 31,554 31,822 29,956 33,833 1,540 4.9 (739) (2.2) Premises and equipment, net 54,779 55,919 57,131 57,718 57,665 (1,140) (2.0) (2,886) (5.0) Intangible Assets 122,787 123,220 123,637 124,053 124,542 (433) (0.4) (1,755) (1.4) Cash surrender value of BOLI 125,101 125,186 124,287 123,456 122,622 (85) (0.1) 2,479 2.0 OREO 755 258 227 1,711 2,239 497 192.6 (1,484) (66.3) Other Assets* 125,917 114,924 105,355 98,393 95,294 10,993 9.6 30,623 32.1 Total Assets $ 6,228,541 $5,843,022 $5,680,690 $5,531,150 $5,476,809 $ 385,519 6.6 % $ 751,732 13.7% LIABILITIES AND STOCKHOLDERS' EQUITY Liabilities: QoQ YoY Deposits: 4Q15 vs 3Q15 4Q15 vs 4Q14 Non-interest-bearing $ 672,008 $ 622,535 $ 610,279 $ 598,157 $ 602,359 $ 49,473 7.9 % $ 69,649 11.6% Interest-bearing 3,765,063 3,640,436 3,571,972 3,558,958 3,432,952 124,627 3.4 332,111 9.7 Total Deposits 4,437,071 4,262,971 4,182,251 4,157,115 4,035,311 174,100 4.1 401,760 10.0 Mortgagors' and investor escrow accounts 13,526 8,108 15,168 8,815 13,004 5,418 66.8 522 4.0 FHLB advances and other borrowings 1,099,020 893,865 825,963 707,318 777,314 205,155 23.0 321,706 41.4 Accrued expenses and other liabilities 53,403 56,626 45,313 47,779 48,772 (3,223) (5.7) 4,631 9.5 Total liabilities 5,603,020 5,221,570 5,068,695 4,921,027 4,874,401 381,450 7.3 728,619 14.9 Total stockholders' equity 625,521 621,452 611,995 610,123 602,408 4,069 0.7 23,113 3.8 Total liabilities and stockholders' equity $ 6,228,541 $5,843,022 $5,680,690 $5,531,150 $5,476,809 $ 385,519 6.6 % $ 751,732 13.7% *Other assets include FHLBB stock (at cost), accrued interest receivable, in addition to other assets

20NASDAQ: UBNK Loan Portfolio

21NASDAQ: UBNK Investment Portfolio Portfolio Stats ($ in millions) 2015Q4 2015Q3 Market Value 1,074 1,095 Yield 2.93% 2.92% Average Rating AA AA MBS Portfolio 585 602 Total Portfolio Duration (years) 3.3 3.3 Summary of Quarterly Securities Purchases 2015Q4 2015Q3 Average Yield 3.06% 3.39% Average Rating AA AA Total Securities/Assets (%) 25.0 20.0 15.0 10.0 5.0 201 3Q 1 201 3Q 2 201 3Q 3 201 3Q 4 201 4Q 1 201 4Q 2 201 4Q 3 201 4Q 4 201 5Q 1 201 5Q 2 201 5Q 3 201 5Q 4 15.4 16.3 17.3 18.2 19.3 18.8 19.4 19.5% 20.1% 19.0% 18.7% 17.2% Investment Portfolio Summary (Total) Dec 31, 2015 Corp Debt: 6% Agency CMO: 26% Gov't Agency: 1% Agency CCMO: 12% Agency CMBS: 2%CLO: 14% SBA: 1% Muni: 20% FFELP: 1% Agency MBS: 14% Preferred: 4%
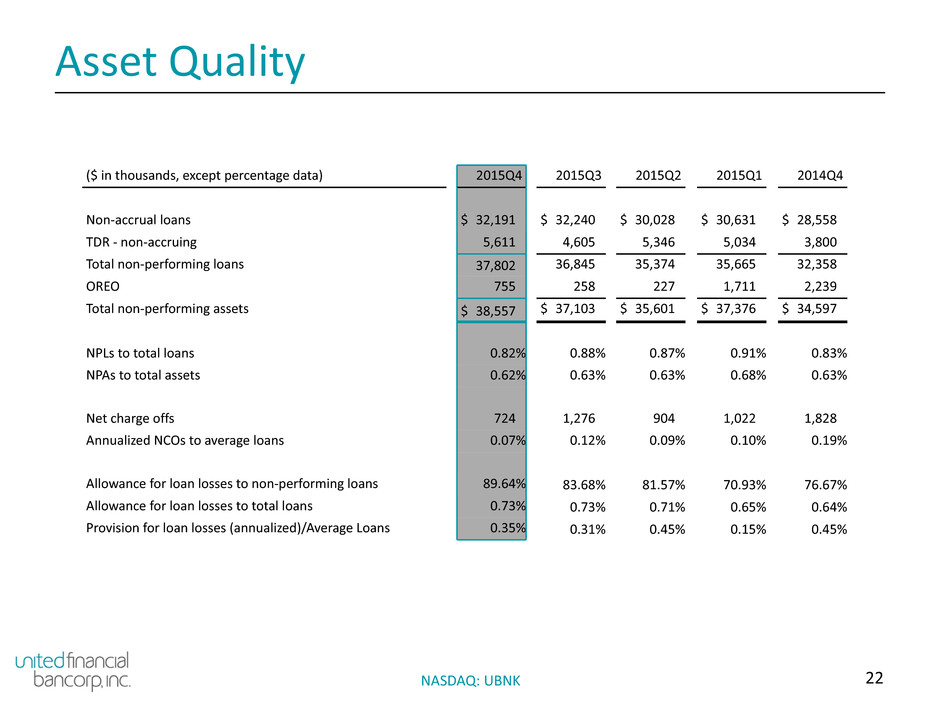
22NASDAQ: UBNK Asset Quality ($ in thousands, except percentage data) 2015Q4 2015Q3 2015Q2 2015Q1 2014Q4 Non-accrual loans $ 32,191 $ 32,240 $ 30,028 $ 30,631 $ 28,558 TDR - non-accruing 5,611 4,605 5,346 5,034 3,800 Total non-performing loans 37,802 36,845 35,374 35,665 32,358 OREO 755 258 227 1,711 2,239 Total non-performing assets $ 38,557 $ 37,103 $ 35,601 $ 37,376 $ 34,597 NPLs to total loans 0.82% 0.88% 0.87% 0.91% 0.83% NPAs to total assets 0.62% 0.63% 0.63% 0.68% 0.63% Net charge offs 724 1,276 904 1,022 1,828 Annualized NCOs to average loans 0.07% 0.12% 0.09% 0.10% 0.19% Allowance for loan losses to non-performing loans 89.64% 83.68% 81.57% 70.93% 76.67% Allowance for loan losses to total loans 0.73% 0.73% 0.71% 0.65% 0.64% Provision for loan losses (annualized)/Average Loans 0.35% 0.31% 0.45% 0.15% 0.45%

23NASDAQ: UBNK Peer Group - Total Assets $4-$10 Billion Source: SNL Financial. *Dividend Yield, Price / Tangible Book, Price / LTM EPS and Price / Median EPS Estimates calculated using 12/31/2015 closing prices **Peer Financial data as of 9/30/2015. UBNK Financial data as of 12/31/2015 . Institution Name Ticker Exchange State City Total Assets ($ thousands) Market Cap ($ millions) Dividend Yield (%) * Price/ Tangible Book (%)* Price / LTM EPS (x)* Price / Median EPS Estimates (x) * TCE/TA (%) **United Financial Bancorp, Inc. UBNK NASDAQ CT Glastonbury 6,228,541 643.2 3.42 127.9 15.5 12.0 8.66 Peer Group: National Penn Bancshares, Inc. NPBC NASDAQ PA Allentown 9,587,459 1,648.3 3.57 203.8 16.4 15.6 8.90 Northwest Bancshares, Inc. NWBI NASDAQ PA Warren 8,934,908 1,322.4 4.11 153.0 20.0 18.1 11.58 Provident Financial Services, Inc. PFS NYSE NJ Iselin 8,858,588 1,274.9 3.13 174.3 15.0 15.0 8.84 NBT Bancorp Inc. NBTB NASDAQ NY Norwich 8,161,562 1,163.4 3.08 202.1 16.3 16.2 7.63 Community Bank System, Inc. CBU NYSE NY De Witt 7,997,166 1,524.7 3.03 248.0 17.5 17.1 8.17 Berkshire Hills Bancorp, Inc. BHLB NYSE MA Pittsfield 7,804,488 852.3 2.58 165.3 17.6 13.7 7.04 Customers Bancorp, Inc. CUBI NYSE PA Wyomissing 7,599,471 690.9 — 152.8 14.7 14.2 6.10 Boston Private Financial Holdings, Inc. BPFH NASDAQ MA Boston 7,180,528 978.7 3.09 188.5 16.2 14.5 7.13 Independent Bank Corp. INDB NASDAQ MA Rockland 7,135,489 1,208.4 2.19 223.5 19.2 16.6 7.58 First Commonwealth Financial Corporation FCF NYSE PA Indiana 6,384,749 808.7 3.09 144.0 17.1 14.9 8.91 S&T Bancorp, Inc. STBA NASDAQ PA Indiana 6,215,338 1,135.6 2.34 219.4 15.7 15.2 8.10 Eagle Bancorp, Inc. EGBN NASDAQ MD Bethesda 5,888,958 1,520 — 278.7 21.6 20.4 10.34 Brookline Bancorp, Inc. BRKL NASDAQ MA Boston 5,839,529 718.8 3.04 158.5 16.9 16.4 8.94 Tompkins Financial Corporation TMP NYSE NY Ithaca 5,594,718 795.4 2.99 203.1 14.8 15.7 7.48 Flushing Financial Corporation FFIC NASDAQ NY Uniondale 5,502,075 577.2 2.91 137.1 13.8 14.6 8.35 WSFS Financial Corporation WSFS NASDAQ DE Wilmington 5,067,942 789.2 0.46 197.1 17.7 16.5 8.84 Dime Community Bancshares, Inc. DCO NASDAQ NY Brooklyn 4,832,492 628.5 3.2 151.9 13.9 14.2 9.20 Beneficial Bancorp, Inc. BNCL NASDAQ PA Philadelphia 4,728,164 1,098.3 — 112.0 46.8 43.0 21.14 TrustCo Bank Corp NY TRST NASDAQ NY Glenville 4,725,817 555.7 4.28 141.9 13.7 14.0 8.48 Sandy Spring Bancorp, Inc. SASR NASDAQ MD Olney 4,611,034 639.4 3.19 149.9 16.0 14.3 9.82 Kearny Financial Corp. KRNY NASDAQ NJ Fairfield 4,301,941 1,072.8 0.16 112.4 229.5 74.5 25.63 Average 6,521,544 1,000.2 2.40 177.0 28.1 19.7 9.91 Median 6,215,388 978.7 3.03 165.3 16.7 16.4 8.96

24NASDAQ: UBNK Management Team and Ownership • William H.W. Crawford, IV owns 529,872 shares of stock and options. • UBNK management owns 1,226,313 shares of stock and options. • UBNK and United Bank Directors own 1,149,637 shares of stock and options.
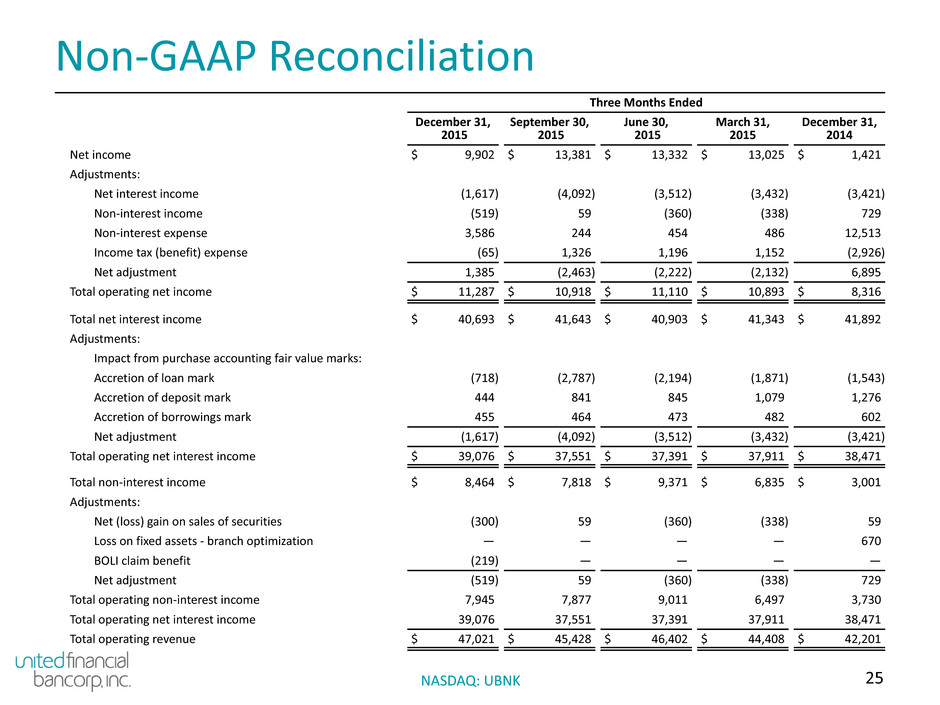
25NASDAQ: UBNK Non-GAAP Reconciliation Three Months Ended December 31, 2015 September 30, 2015 June 30, 2015 March 31, 2015 December 31, 2014 Net income $ 9,902 $ 13,381 $ 13,332 $ 13,025 $ 1,421 Adjustments: Net interest income (1,617) (4,092) (3,512) (3,432) (3,421) Non-interest income (519) 59 (360) (338) 729 Non-interest expense 3,586 244 454 486 12,513 Income tax (benefit) expense (65) 1,326 1,196 1,152 (2,926) Net adjustment 1,385 (2,463) (2,222) (2,132) 6,895 Total operating net income $ 11,287 $ 10,918 $ 11,110 $ 10,893 $ 8,316 Total net interest income $ 40,693 $ 41,643 $ 40,903 $ 41,343 $ 41,892 Adjustments: Impact from purchase accounting fair value marks: Accretion of loan mark (718) (2,787) (2,194) (1,871) (1,543) Accretion of deposit mark 444 841 845 1,079 1,276 Accretion of borrowings mark 455 464 473 482 602 Net adjustment (1,617) (4,092) (3,512) (3,432) (3,421) Total operating net interest income $ 39,076 $ 37,551 $ 37,391 $ 37,911 $ 38,471 Total non-interest income $ 8,464 $ 7,818 $ 9,371 $ 6,835 $ 3,001 Adjustments: Net (loss) gain on sales of securities (300) 59 (360) (338) 59 Loss on fixed assets - branch optimization — — — — 670 BOLI claim benefit (219) — — — — Net adjustment (519) 59 (360) (338) 729 Total operating non-interest income 7,945 7,877 9,011 6,497 3,730 Total operating net interest income 39,076 37,551 37,391 37,911 38,471 Total operating revenue $ 47,021 $ 45,428 $ 46,402 $ 44,408 $ 42,201

26NASDAQ: UBNK Non-GAAP Reconciliation (cont.) Three Months Ended December 31, 2015 September 30, 2015 June 30, 2015 March 31, 2015 December 31, 2014 Total non-interest expense $ 35,306 $ 31,876 $ 30,357 $ 30,657 $ 45,076 Adjustments: Merger related expense (1,575) — — — (10,136) Core deposit intangible amortization expense (433) (433) (449) (481) (481) Loan portfolio acquisition fees (1,572) — — — — Effect of branch lease termination agreement — 195 — — (1,888) Amortization of fixed asset fair value mark (6) (6) (5) (5) (8) Net adjustment (3,586) (244) (454) (486) (12,513) Total operating expense $ 31,720 $ 31,632 $ 29,903 $ 30,171 $ 32,563 Total loans $ 4,613,931 $ 4,209,618 $ 4,072,067 $ 3,904,733 $ 3,897,866 Non-covered loans (1) (1,448,435) (1,255,618) (1,356,259) (1,510,264) (1,658,594) Total covered loans $ 3,165,496 $ 2,954,000 $ 2,715,808 $ 2,394,469 $ 2,239,272 Allowance for loan losses $ 33,887 $ 30,832 $ 28,856 $ 25,297 $ 24,809 Allowance for loan losses to total loans 0.73% 0.73% 0.71% 0.65% 0.64% Allowance for loan losses to total covered loans 1.07% 1.04% 1.06% 1.06% 1.11% (1) As required by GAAP, the Company recorded at fair value the loans acquired in the legacy United transactions. These loans carry no allowance for loan losses for the periods reflected above.
