Attached files
| file | filename |
|---|---|
| 8-K - 8-K - UMB FINANCIAL CORP | d96364d8k.htm |
| EX-99.1 - EX-99.1 - UMB FINANCIAL CORP | d96364dex991.htm |
 Strength in Balance. Fourth Quarter 2015 UMB Financial January 26, 2016 Exhibit 99.2 |
 2 Cautionary Notice about Forward-Looking Statements This presentation contains, and our other communications may contain, forward-looking statements within the meaning of the Private
Securities Litigation Reform Act of 1995. These statements can be
identified by the fact that they do not relate strictly to historical or
current facts—such as our statements about expected cost savings and other results
of efficiency initiatives and our statements about asset sensitivity.
Forward-looking statements often use words such as “believe,” “expect,” “anticipate,” “intend,” “estimate,” “project,” “outlook,” “forecast,” “target,” “trend,” “plan,” “goal,” or other words of
comparable meaning or future-tense or conditional verbs such as
“may,” “will,” “should,” “would,” or “could.” Forward-looking statements convey our expectations, intentions, or forecasts about future events, circumstances, results, or aspirations. All forward-looking statements are subject to assumptions, risks, and uncertainties, which may change over time and many of which are
beyond our control. You should not rely on any forward-looking
statement as a prediction or guarantee about the future. Our actual future
objectives, strategies, plans, prospects, performance, condition, or results may differ
materially from those set forth in any forward- looking
statement. Some of the factors that may cause actual results or other future events, circumstances, or aspirations to differ from those in forward-looking statements are described in our Annual Report on Form 10-K for the year ended December 31, 2014, our
subsequent Quarterly Reports on Form 10-Q or Current Reports on Form
8-K, or other applicable documents that are filed or furnished with
the Securities and Exchange Commission (SEC). Any forward-looking
statement made by us or on our behalf speaks only as of the date that it was made. We do not undertake to update any forward-looking statement to reflect the impact of events, circumstances, or results that arise after the date that the statement was
made. You, however, should consult further disclosures (including
disclosures of a forward-looking nature) that we may make in any
subsequent Annual Report on Form 10-K, Quarterly Report on Form 10-Q, Current
Report on Form 8-K, or other applicable document that is filed or
furnished with the SEC. |
 4Q
2015 Performance Highlights |
 Earnings
Summary – 4Q 2015
$ in thousands, except per-share data; unaudited
4 4Q'15 4Q'14 3Q'15 vs. 4Q'14 vs. 3Q'15 Net Interest Income 114,454 $ 90,914 $ 109,895 $ 25.9 4.1 Noninterest Income 112,599 115,248 109,098 (2.3) 3.2 Pre-Provision Net Revenue 227,053 206,162 218,993 10.1 3.7 Noninterest Expense 182,080 166,397 185,279 9.4 (1.7) Income Before Provision & Taxes 44,973 39,765 33,714 13.1 33.4 Provision for loan losses 5,000 3,000 2,500 66.7 100.0 Income before Taxes 39,973 36,765 31,214 8.7 28.1 Income Tax Provision 10,330 9,825 8,763 5.1 17.9 Net Income 29,643 $ 26,940 $ 22,451 $ 10.0 32.0 Diluted EPS 0.60 $ 0.59 $ 0.46 $ 1.7 30.4 Dividends per share 0.245 0.235 0.235 4.3 4.3 WASO (diluted) 49,066,566 45,465,760 49,036,332 7.9 0.1 % variance |
 Earnings
Summary – Full-Year 2015
$ in thousands, except per-share data; unaudited
5 2015 2014 2013 '15 to '14 '14 to '13 Net Interest Income 412,067 $ 350,055 $ 333,269 $ 17.7 5.0 Noninterest Income 466,454 498,688 491,833 (6.5) 1.4 Pre-Provision Net Revenue 878,521 848,743 825,102 3.5 2.9 Noninterest Expense 703,736 665,680 623,204 5.7 6.8 Income Before Provision & Taxes 174,785 183,063 201,898 (4.5) (9.3) Provision for loan losses 15,500 17,000 17,500 (8.8) (2.9) Income before Taxes 159,285 166,063 184,398 (4.1) (9.9) Income Tax Provision 43,212 45,408 50,433 (4.8) (10.0) Net Income 116,073 $ 120,655 $ 133,965 $ (3.8) (9.9) Diluted EPS 2.44 $ 2.65 $ 3.20 $ (7.9) (17.2) Dividends per share 0.950 0.910 0.870 4.4 4.6 WASO (diluted) 47,579,334 45,445,283 41,838,580 4.7 8.6 % variance |
 Select
Balance Sheet Items 6
$ in thousands, average balances; unaudited
Three Months Ended vs. 4Q'14 vs. 3Q'15 Avg. Balance Avg. Balance Avg. Balance Assets Loans, net of unearned interest 9,199,961 $ 3.80 7,320,930 $ 3.49 8,933,775 $ 3.76 25.7 3.0 Total securities 7,401,671 1.99 7,184,075 1.90 7,343,922 1.95 3.0 0.8 Total earning assets 17,380,673 2.88 15,150,747 2.61 16,842,320 2.86 14.7 3.2 Allowance for loan losses (78,906) (77,527) (78,419) 1.8 0.6 Total assets 18,755,557 $ 16,231,622 $ 18,120,449 $ 15.5 3.5 Liabilities and Shareholders' Equity Interest-bearing deposits 8,528,207 $ 0.18 7,446,164 $ 0.16 8,532,814 $ 0.18 14.5 (0.1) Total interest-bearing liabilities 9,923,008 0.21 8,988,438 0.15 10,255,676 0.21 10.4 (3.2) Noninterest-bearing demand deposits 6,734,309 5,403,856 5,800,870 24.6 16.1 Shareholders' Equity 1,912,654 1,651,969 1,887,863 15.8 1.3 Total liabilities and shareholders' equity 18,755,557 $ 16,231,622 $ 18,120,449 $ 15.5 3.5 Net interest spread 2.67 2.46 2.65 Net interest margin 2.76 2.52 2.73 % variance December 31, 2015 December 31, 2014 September 30, 2015 Avg Yield / Rate % Avg Yield / Rate % Avg Yield / Rate % |
 Key
Performance Metrics 7
(1) Tier 1 Capital calculated under Basel III requirements beginning in 1Q’15.
4Q'15 3Q'15 2Q'15 1Q'15 4Q'14 ROAE 6.15% 4.72% 6.95% 8.18% 6.47% ROAA 0.63% 0.49% 0.70% 0.81% 0.66% Efficiency Ratio 77.21% 80.79% 76.41% 75.67% 77.31% Net Interest Margin 2.76% 2.73% 2.59% 2.46% 2.52% Noninterest Income % of revenue 49.6% 49.8% 55.1% 58.1% 55.9% Avg. Loan/Deposit Ratio 60.3% 62.3% 60.1% 56.3% 57.0% Assets Under Mgmt. (billions) 40.0 $ 40.9 $ 42.5 $ 42.3 $ 42.8 $ Tier 1 Capital Ratio 11.81% (1) 12.51% (1) 12.77% (1) 12.91% (1) 13.29% Diluted EPS 0.60 $ 0.46 $ 0.65 $ 0.74 $ 0.59 $ |
 Net
Operating Income Non-GAAP Reconciliation 8
In this presentation, we provide information using net operating income, operating
earnings per share, operating return on average equity, operating return on
average assets, operating noninterest expense, and operating efficiency ratio, all of
which are non-GAAP financial measures. This information supplements
the results that are reported according to generally accepted accounting principles (GAAP) and should not be viewed in isolation from, or as a substitute for, GAAP results. The differences between these non-GAAP financial measures and the comparable GAAP financial measures are reconciled in
the tables below and as described further on the next slide. The company
believes that these non-GAAP financial measures and the reconciliations may be useful to investors because they adjust for acquisition- and severance-related items that management does not believe reflect the company’s fundamental operating performance. Net operating income for the relevant period is defined as GAAP net income, adjusted to reflect the after-tax impact of excluding the
following: (i) the contingency reserve expense related to the acquisition
of Prairie Capital Management, LLC, (ii) fair value adjustments to contingent consideration for the acquisitions of Prairie Capital Management, LLC and Reams Asset Management Company, (iii) expenses related to the acquisition of Marquette Financial Companies, and (iv) non-acquisition severance expenses. Operating earnings per share (basic and diluted) is calculated as net operating
income, divided by the company’s average number of shares
outstanding (basic and diluted) for the relevant period. Operating return on average equity is calculated as net operating income, divided by the company’s average total shareholders’ equity for the relevant period. Operating return on average
assets is calculated as net operating income, divided by the
company’s average assets for of the relevant period. (Continued on
next page.) (unaudited, dollars in thousands except per share
data) December 31,
December 31, December 31, December 31, 2015 2014 2015 2014 Net income (GAAP) $29,643 $26,940 $116,073 $120,655 Adjustments (net of tax): Contingency reserve expense (i) - - - 12,974 Fair value adjustments on contingent consideration (ii)
300 (543) (1,925) 4,264 Acquisition expenses (iii)
2,193 1,243 6,293 1,243 Non-acquisition severance expense (iv)
2,098 181 2,919 465 Total Non-GAAP adjustments (net of tax)
4,591 881 7,287 18,946 Net Operating Income (Non-GAAP) $34,234 $27,821 $123,360 $139,601 GAAP Earnings per share - Basic $0.61 $0.60 $2.46 $2.69 Earnings per share - Diluted 0.60 0.59 2.44 2.65 Return on average assets 0.63% 0.66% 0.65% 0.75% Return on average equity 6.15% 6.47% 6.43% 7.54% Non-GAAP Operating earnings per share - Basic $0.70 $0.62 $2.62 $3.11 Operating earnings per share - Diluted 0.70 0.61 2.59 3.07 Operating return on average assets
0.72% 0.68% 0.69% 0.87% Operating return on average equity 7.10% 6.68% 6.83% 8.73% Three Months Ended Year Ended |
 9 Operating noninterest expense for the relevant period is defined as GAAP noninterest expense, adjusted to reflect the pre-tax impact of
non-GAAP adjustments described in clauses i-iv above. Operating
efficiency ratio is calculated as the company’s operating noninterest expense, less amortization of other intangibles, divided by the company’s tax equivalent net interest income plus noninterest income less gains on sales of securities available for sale. i. Represents the company's 2014 contingency reserve for the settlement of disputes related to the acquisition of Prairie Capital Management , LLC
(PCM). ii.
Represents fair value adjustments to contingent consideration for the acquisitions of
PCM and Reams Asset Management Company. iii.
Represents expenses related to the acquisition of Marquette Financial Companies
(MFC). iv.
Represents non-acquisition severance expense related to UMB-legacy employees.
Severance expense for MFC-legacy employees is included in item (iii).
v. Tax-exempt interest income has been adjusted to a tax equivalent basis. The amount of such adjustment was an addition to net interest income
of $6.5 million and $5.3 million for the three months ended December 31,
2015 and 2014, respectively, and an addition to net interest income of $23.8 million and $21.2 million for the year-ended December 31, 2015 and 2014, respectively. Operating Noninterest Expense & Efficiency Ratio Non-GAAP Reconciliation (unaudited, dollars in thousands) December 31, December 31, December 31, December 31, 2015 2014 2015 2014 Noninterest expense (GAAP) $182,080 $166,397 $703,736 $665,680 Adjustments (pre-tax): Contingency reserve expense (i) - - - 20,272 Fair value adjustments on contingent consideration (ii) 469 (848) (3,008) 6,662 Acquisition expenses (iii) 3,427 1,942 9,833 1,942 Non-acquisition severance expense (iv) 3,278 282 4,561 726 Total Non-GAAP adjustments (pre-tax) 7,174 1,376 11,386 29,602 Operating noninterest expense 174,906 165,021 692,350 636,078 Noninterest expense 182,080 166,397 703,736 665,680 Less: Amortization of other intangibles 3,283 2,974 12,090 12,193 Noninterest expense, net of amortization of other intangibles (numerator A) 178,797 163,423 691,646 653,487 Operating noninterest expense (Non-GAAP) 174,906 165,021 692,350 636,078 Less: Amortization of other intangibles 3,283 2,974 12,090 12,193 Operating expense, net of amortization of other intangibles (numerator B) 171,623 162,047 680,260 623,885 Net interest income (tax equivalent) (v) 120,966 96,200 435,852 371,289 Noninterest income 112,599 115,248 466,454 498,688 Less: Gains on sales of securities available for sale, net 1,998 62 10,402 4,127 Total (denominator A) 231,567 211,386 891,904 865,850 Efficiency ratio (numerator A/denominator A) 77.21% 77.31% 77.55% 75.47% Operating efficiency ratio (numerator B/denominator A) 74.11% 76.66% 76.27% 72.05% Three Months Ended Year Ended |
 Efficiency Initiative Update |
 Components of Efficiency Initiative
11 (1) Excludes severance costs (2) Excludes Marquette-related synergies The amounts in the 2015 and 2016 columns represent actual savings recognized or expected to be recognized, as applicable, in those years based
on the timing of actions taken as part of these efficiency initiatives.
The amounts in the annualized column represent the estimated full-year impact of those savings going forward. ($ millions) 2015 Initial Estimate 2016 Initial Estimate 2015 Actual 2016 Updated Estimate Annualized Salaries and Benefits (1) $5.2 $15.0 $7.7 $14.6 $23.4 Business Process Improvements $1.6 $7.6 $1.8 $6.4 $9.5 Total Cost Savings (2) $6.8 $22.6 $9.5 $21.0 $32.9 Key Initiatives – Drive enhanced operating leverage and improve customer experience Select Business Process Improvement Actions Centralize lockbox processing sites Continued conversion to e-statements Reduce advertising and T&E Right-size contracting and consulting expense related to technology upgrades Remove ATM locations with lower profitability Adjust or discontinue certain reward and partner programs Renegotiate or terminate various vendor contracts Eliminate participation in discretionary industry organizations and events Simplification of organizational and reporting structures Improvement in efficiency within branch operations Streamlining of back-office functions Elimination of duplication and improved distribution synergies among customer-focused businesses
Modernization of technology to better enable product delivery and operational
efficiency over time |
 The
amounts in the 2015 and 2016 columns represent actual savings recognized or expected to be recognized, as applicable, in those years based on the timing of actions taken as part of these efficiency initiatives. The amounts in the annualized column represent the estimated
full-year impact of those savings going forward.
Salaries & Benefits Details
FTE reductions No backfill of certain positions vacated in 2015 Other (reduction in hours and overtime, reduction or elimination of other programs)
Components of Salaries and Benefits Savings: Severance Expense – not included in efficiency totals: 12 (1) Excludes severance costs (2) Excludes Marquette-related severance expense ($ millions) 2015 Initial Estimate 2016 Initial Estimate 2015 Actual 2016 Updated Estimate Severance Expense (2) $4.9 $3.1 $4.1 $3.0 ($ millions) 2015 Initial Estimate 2016 Initial Estimate 2015 Actual 2016 Updated Estimate Annualized Salaries and Benefits Efficiencies (1) $5.2 $15.0 $7.7 $14.6 $23.4 |
 4Q
2015 Financials |
 Marquette Integration Update
14 Transaction Costs $ thousands 2014 1Q’15 2Q’15 3Q’15 4Q’15 Total 2014-2015 HR Costs $215.1 $121.1 $452.4 $1,909.1 $1,756.1 $4,453.8 Technology Integration - 10.3 - 2,405.0 1,658.2 4,073.5 Professional Fees 1,680.1 627.0 264.4 93.0 345.9 3,010.4 Other Integration Fees 46.4 7.3 70.2 48.4 64.7 237.0 Total Transaction Costs $1,941.6 $765.7 $787.0 $4,455.5 $3,824.9 $11,774.7 |
 Consistent Loan Growth
15 End-of-Period Total Loans 5 Year CAGR 15.5% (1) On May 31, 2015, we closed the acquisition of Marquette Financial Companies and loans with an acquired value of $980.4 million were added
to the UMB portfolio. At December 31, 2015, the acquired loans plus
production in the legacy Marquette channels totaled $1.0 billion.
(1) (1) $4.6 $5.0 $5.7 $6.5 $7.5 $8.9 $9.4 |
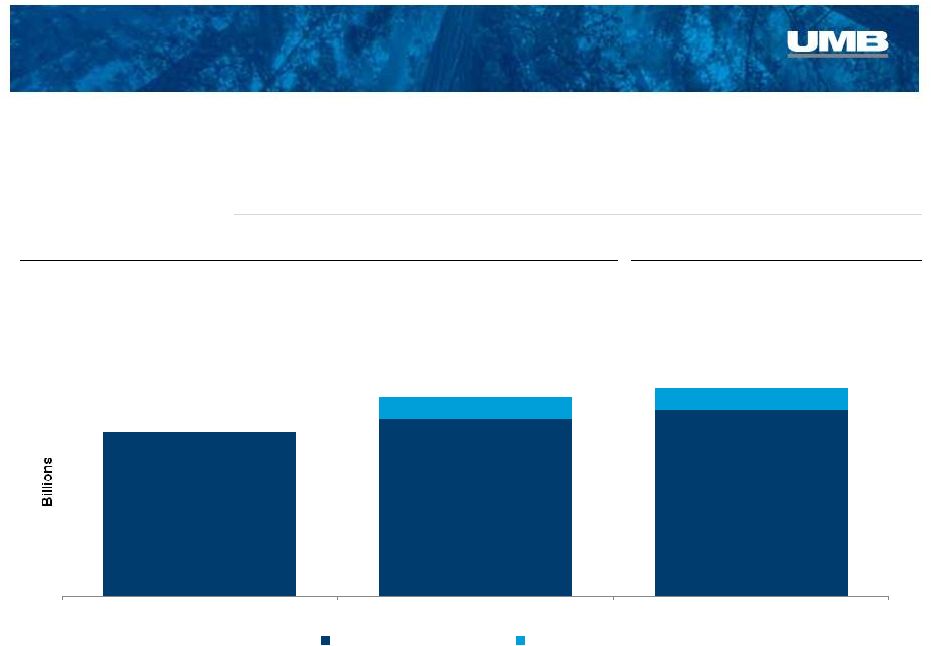 $7.5 $8.0 $8.4 $1.0 $1.0 4Q'14 3Q'15 4Q'15 Legacy UMB Legacy Marquette $ in thousands Legacy Marquette Loans December 31, 2014 September 30, 2015 December 31, 2015 vs. Dec '14 vs. Sep '15 vs. Sep '15 Legacy UMB Loans 7,465,794 $
8,041,024 $
8,448,650 $
13.2% 5.1% n/a Legacy Marquette Loans - 1,005,102 982,111 n/a n/a -2.3% Total 7,465,794 $
9,046,126 $
9,430,761 $
26.3% 4.3% Legacy UMB Loans UMB and Marquette Loans 16 $9.4 $9.0 |
 Quality
Credit Metrics Net Charge-Offs
$000’s 17 Nonperforming Loans $000’s $4,176 $1,661 $4,758 $2,192 $1,886 0.23% 0.09% 0.24% 0.10% 0.08% 4Q'14 1Q'15 2Q'15 3Q'15 4Q'15 Net Charge-offs NCOs/Avg. Loans $27,382 $29,187 $37,649 $49,955 $61,152 0.37% 0.39% 0.42% 0.55% 0.65% 4Q'14 1Q'15 2Q'15 3Q'15 4Q'15 Nonperforming Loans NPLs/Loans |
    4 th Quarter 2015 Average Balance, AFS: $6.7 billion Average Yield: 1.87% Investment Mix Securities Available for Sale $6.8 billion at December 31, 2015 Agencies High Quality Investment Portfolio 18 Corporates Municipals Mortgage-Backed Securities Treasuries AFS Portfolio Statistics Roll off Purchased ($ millions) Yield ($ millions) Yield 1Q'15 $333 2.02% $709 1.89% 2Q'15 $299 1.98% $498 1.90% 3Q'15 $278 1.88% $114 2.17% 4Q'15 $293 1.81% $633 2.05% Scheduled Cash Flow 1Q'16 $370 1.59% Next 12 months $1,658 1.37% Duration/Life
(in months) at 12/31/15 at 9/30/15 Avg. Life Total 44.80 44.15 Duration Total 36.93 37.92 Securities Gains $ in thousands 4Q'14 62 $
1Q'15 7,336 $ 2Q'15 967 $
3Q'15 101 $
4Q'15 1,998 $ 52.5% 31.4% 9.8% 5.1% 1.2% |
  $4.4 $14.3 $24.8 $16.0 $37.6 $59.2 $17.8 $41.6 $67.8 $26.7 $58.7 $90.1 +100 bps +200 bps +300 bps 12-mo Ramp - Year 1 Immediate Shock - Year 1 12-mo Ramp - Year 2 Immediate Shock - Year 2 Year 1 Year 2 Year 1 Year 2 Year 1 Year 2 Asset Sensitivity at December 31, 2015 Projected Net Interest Income Differential vs. Rates Unchanged (1) ($ millions) (1) This analysis is further described in Annual Reports on Form 10-K and Quarterly Reports on Form 10-Q under the heading “Net Interest
Income Modeling” and is subject to the assumptions, risks, and
uncertainties noted there. 19
Variable Rate Loans at 12/31/15: $4.5 billion, 48% of
loan book •
~49% of variable loans are tied to Prime for the next quarter
• ~50% of variable loans are tied to Libor for the next quarter Loan Repricing/Maturity Schedule: • 50% in 1Q 2016 • 66% in full-year 2016 |
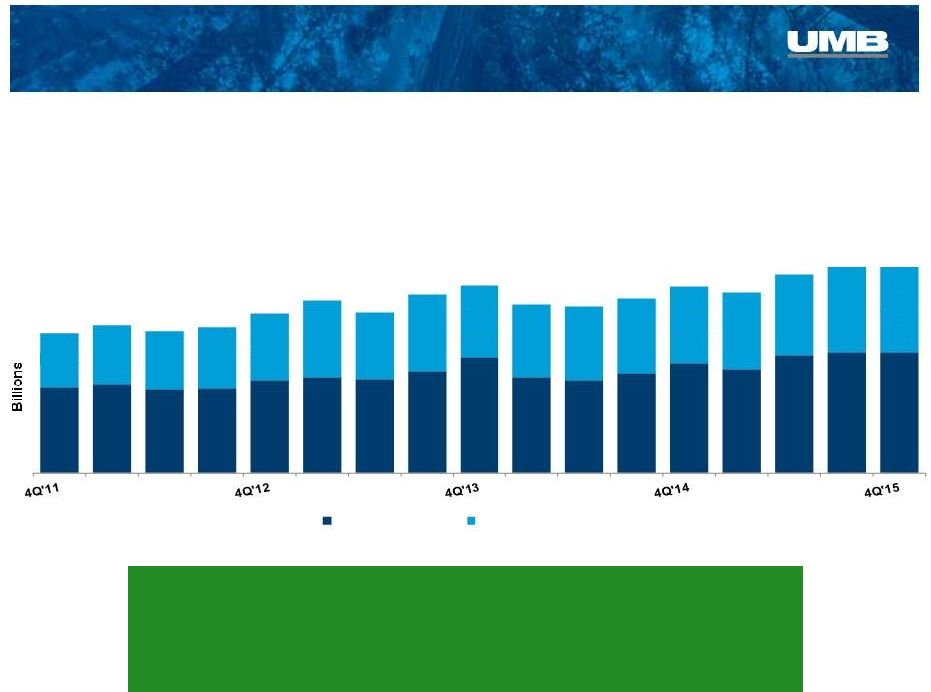 Deposit
Growth Deposits & Percent of Free Funds
Actual EOP Balances; $ billions
20 4Q 2015 Cost of Interest-Bearing Liabilities 0.21% Including DDA 0.12% $10.2 $13.6 $11.7 $13.6 $15.1 38.8% 42.2% 38.0% 41.4% 41.8% Interest Bearing Non -Interest Bearing |
  11.92
14.43 14.04 12.75 11.05 13.61 13.29 11.81 6.81 8.41 8.72 9.08 11.70 2012 2013 2014 2015 12.92% 11.70% Industry Median Balance Sheet – Strong Capital Position Common Equity Tier 1 Ratio vs. Industry 2015 21 $1.09 $1.91 4Q'10 4Q'15 Average Equity ($ billions) Capital Ratio Trends Industry Median as of 3Q15; Source: SNL Financial. (1) 2015 ratios calculated under Basel III requirements. Total Risk-Based Capital Tier 1 Capital Tier 1 Leverage Common Equity Tier 1 (1) |
 Noninterest Income – 4Q 2015 22 Noninterest income decreased $2.6 million, or 2.3%, compared to 4Q’14 Trust and securities processing income decreased $6.9 million or 10.0% compared to 4Q’14 Inst. Inv Mgmt: -$8.2MM Asset Servicing: +$155k Bank: +1.2MM Equity earnings on alternative investments had an unrealized loss of $5.2 million, compared to an unrealized loss of $4.5 million in 4Q’14 4 th Quarter ‘15 Drivers $ in thousands 4Q'15 3Q'15 2Q'15 1Q'15 4Q'14 Trust and securities processing 62,194 $ 65,182 $ 67,381 $ 67,299 $ 69,072 $ Trading and investment banking 5,559 2,969 5,568 6,122 4,840 Service charges on deposits 21,631 21,663 21,625 21,541 21,480 Insurance fees and commisions 894 480 586 570 765 Brokerage fees 3,005 2,958 2,936 2,854 2,595 Bankcard fees 17,369 17,624 18,035 16,183 17,321 Gains on sales of securities 1,998 101 967 7,336 62 Equity (loss) earnings on alt. investments (5,189) (5,032) (1,125) (842) (4,487) Other 5,138 3,153 3,577 4,144 3,600 Total noninterest income 112,599 $ 109,098 $ 119,550 $ 125,207 $ 115,248 $ |
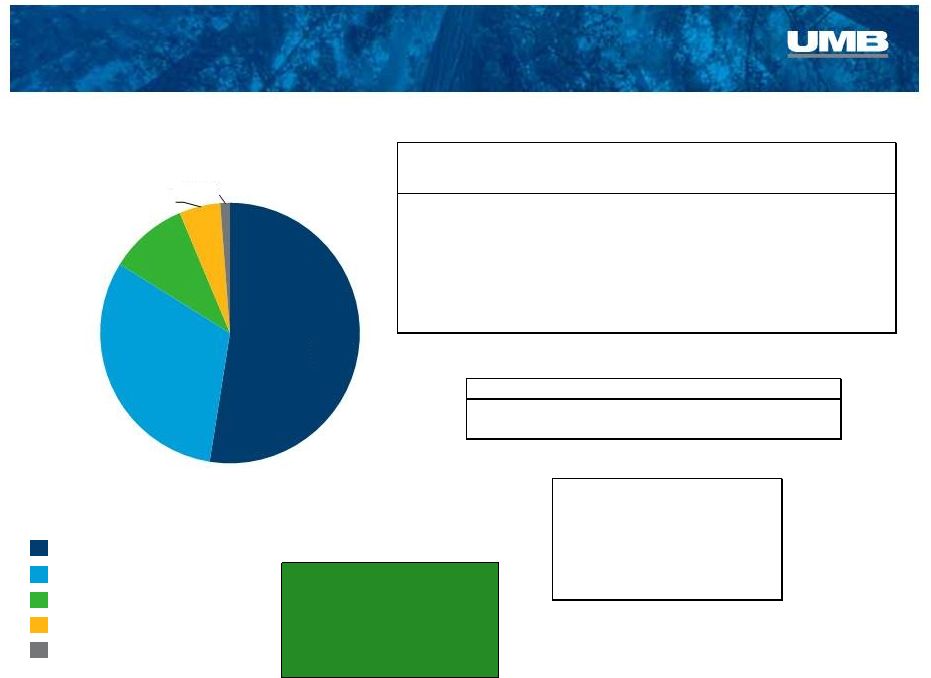
 Bankcard Fees Noninterest Income Composition – 4Q 2015 Trust & Securities Processing Revenue Trust & Securities Processing Composition:
Deposit Service Charges
Trust & Securities Processing
Gains on Sales of Securities
Other Brokerage Fees Trading & Investment Banking ($ millions) Insurance Fees 23 Source of income: 4Q’15 4Q'14 Institutional Investment Mgmt. $20.9 $29.1 Asset Servicing $22.3 $22.2 Bank (Inst. & Personal Asset Mgmt.) $19.0 $17.8 $62.2 $69.1 Excludes ($5.2MM) unrealized loss from Equity Earnings on Alternative Investments, which represents (4.6%) of noninterest income
55.2% 19.2% 15.4% 4.9% 4.6% 2.7% 1.8% 0.8% $46.3 $51.1 $58.3 $71.7 $69.1 $62.2 |
 Noninterest Income – Full-Year 2015 24 $ in thousands 2015 2014 2013 2012 2011 Trust and securities processing 262,056 $ 288,054 $ 265,948 $ 225,094 $ 208,392 $ Trading and investment banking 20,218 19,398 20,641 30,359 27,720 Service charges on deposits 86,460 85,299 84,133 78,694 74,659 Insurance fees and commisions 2,530 3,011 3,727 4,095 4,375 Brokerage fees 11,753 10,761 11,470 11,105 9,950 Bankcard fees 69,211 67,250 62,031 60,567 59,767 Gains on sales of securities 10,402 4,127 8,542 20,232 16,125 Equity (loss) earnings on alt. investments (12,188) 3,975 19,048 422 3 Other 16,012 16,813 16,293 27,554 13,341 Total noninterest income 466,454 $ 498,688 $ 491,833 $ 458,122 $ 414,332 $ Noninterest income decreased $32.2 million, or 6.5%, compared to 2014 Trust and securities processing income decreased $26.0 million or 9.0% compared to 2014 Inst. Inv Mgmt: -$34.7MM Asset Servicing: +$2.9MM Bank: +5.8MM Equity earnings on alternative investments had an unrealized loss of $12.2 million, compared to an unrealized gain of $4.0 million in 2014 Gains on sales of securities were $10.4 million, an increase of $6.3 million compared to 2014 Full-Year ‘15 Drivers |
 Bankcard Fees Noninterest Income Composition – Full Year 2015 Trust & Securities Processing Revenue Trust & Securities Processing Composition:
Deposit Service Charges
Trust & Securities Processing
Gains on Sales of Securities
Other Brokerage Fees Trading & Investment Banking ($ millions) Insurance Fees 25 Source of income: 2015 2014 Institutional Investment Mgmt. $95.8 $130.5 Asset Servicing $91.0 $88.1 Bank (inst. & personal asset mgmt.) $75.3 $69.5 $262.1 $288.1 Excludes ($12.2MM) unrealized loss from Equity Earnings on Alternative Investments, which represents (2.6%) of noninterest income
$160.4 $208.4 $225.1 $265.9 $288.1 $262.1 56.2% 18.6% 14.9% 4.3% 3.4% 2.5% 2.2% 0.5% 5 Year CAGR 10.3% |
 Noninterest Expense – 4Q 2015 26 $ in thousands 4Q'15 3Q'15 2Q'15 1Q'15 4Q'14 Salaries and employee benefits 103,617 $ 104,733 $ 99,585 $ 98,537 $ 90,115 $ Occupancy, net 11,791 11,748 10,312 10,010 10,312 Equipment 16,723 17,228 15,410 14,172 14,618 Supplies, postage and telephone 4,280 5,371 4,603 4,325 5,403 Marketing and business dev 6,816 5,766 6,530 4,618 7,182 Processing fees 13,096 12,795 12,654 12,783 13,496 Legal and consulting 7,447 8,648 5,917 4,378 7,907 Bankcard 5,301 5,266 4,953 4,768 6,812 Amortization of other intangibles 3,283 3,483 2,569 2,755 2,974 Regulatory fees 3,320 3,176 2,873 2,756 2,643 Other 6,406 7,065 6,558 5,311 4,935 Total noninterest expense 182,080 $ 185,279 $ 171,964 $ 164,413 $ 166,397 $ Noninterest expense increased $15.7 million, or 9.4%, compared to 4Q’14. Salaries and employee benefits expense increased $13.5 million, or 15.0%, year- over-year Marquette salaries were $8.4 million Marquette-related severances were $600 thousand Non-Marquette severances were $3.3 million Equipment expense increased $2.1 million year-over-year to $16.7 million related to technology projects completed and put into production for: Regulatory environment Cyber security Modernization of systems On a non-GAAP basis, operating noninterest expense was $174.9 million, an increase of 6.0% or $9.9 million compared to 4Q’14. (see reconciliation on
slides 8 and 9) 4 th Quarter ‘15 Drivers |
 Noninterest Expense – Full-Year 27 $ in thousands 2015 2014 2013 2012 2011 Salaries and employee benefits 406,472 $ 358,569 $ 339,691 $ 319,852 $ 294,756 $ Occupancy, net 43,861 40,197 39,291 37,927 38,406 Equipment 63,533 53,609 49,207 43,465 42,728 Supplies, postage and telephone 18,579 20,411 20,387 21,045 22,166 Marketing and business dev 23,730 24,148 22,703 24,604 20,150 Processing fees 51,328 56,049 57,791 51,191 49,985 Legal and consulting 26,390 20,407 18,703 17,980 15,601 Bankcard 20,288 19,594 18,381 18,154 15,600 Amortization of other intangibles 12,090 12,193 13,218 14,775 16,100 Regulatory fees 12,125 10,445 9,129 9,447 10,395 Class action litigation settlement - - - - 7,800 Contingency reserve - 20,272 - - - Other 25,340 29,786 34,703 31,229 27,987 Total noninterest expense 703,736 $ 665,680 $ 623,204 $ 589,669 $ 561,674 $ Full-Year ‘15 Drivers Noninterest expense increased $38.1 million, or 5.7%, compared to 2014. Salaries and employee benefits expense increased $47.9 million, or 13.4%, year- over-year Marquette salaries were $18.6 million Marquette-related severances were $2.4 million Non-Marquette related severances were $4.6 million Equipment expense increased $9.9 million year-over-year to $63.5 million Legal and consulting expense, which included $1.3 million in acquisition costs in 2015, increased $6.0 million Partially offsetting these increases was a $20.2 million contingency reserve expense in 2014 that did not repeat in 2015 On a non-GAAP basis, operating noninterest expense was $692.4 million, an increase of 8.8% or $56.3 million compared to 2014. (see reconciliation on
slides 8 and 9) |
 Business Segment Updates -
4Q 2015 |
 Bank 29 Loans at December 31, 2015 stood at $9.4 billion, an increase of 26.3% year-over-year
Loans produced by legacy UMB lenders increased 13.2%
year-over-year Average
loan yields for the 4 th quarter were 3.80% compared to 3.49% for the 4 th quarter of 2014 Private placement bonds, shown as held-to-maturity securities, increased 139.9% to $667.1
million compared to year-end 2014
Assets under management within the Bank segment reached $12.8 billion, an increase of
10.0% year-over-year
Highlights $ in 000s, unaudited Year Ended 3 mos Ended December 31, % Change December 31, % Change 2015 2014 Y/Y 2015 2014 Y/Y $ 348,701 $ 292,356 19.3% $ 96,658 $ 75,861 27.4% 8,541 9,175 -6.9% 2,997 1,617 85.3% 188,444 194,223 -3.0% 46,400 42,380 9.5% 446,656 404,203 10.5% 116,710 96,803 20.6% 81,948 73,201 11.9% 23,351 19,821 17.8% 22,127 24,095 -8.2% 6,016 5,427 10.9% Net income $ 59,821 $ 49,106 21.8% $ 17,335 $ 14,394 20.4% pre-tax profit margin 15.3% 15.0% 16.3% 16.8% |
 Loan
Paydowns, Payoffs, and Line Changes $ in thousands
4Q'15 3Q'15 2Q'15 1Q'15 4Q'14 End-of-Period Total Loans 9,430.8 $ 9,046.1 $ 8,916.1 $ 7,498.3 $ 7,465.8 $ Gross Loan Production 696.9 525.0 573.9 471.2 480.7 Revolving Balance Changes
32.3 (105.8) 178.8 (116.8) 107.2 Payoffs (119.9) (82.8) (77.3) (125.8) (75.5) Paydowns (224.6) (206.4) (238.0) (196.1) (149.8) Paydowns/Payoffs as a % of Loans
3.8% 3.2% 4.2% 4.3% 3.2% 30 (1) On May 31, 2015, we closed the acquisition of Marquette Financial Companies and loans with an acquired value of
$980.4 million were added to the UMB portfolio.
(1) |
 45.3% 50.9% 51.0% 51.6% 45.1% 2.3% 3.4% 4.4% 28.1% 25.2% 26.1% 25.0% 28.3% 3.7% 3.7% 4.4% 4.3% 5.2% 10.7% 10.1% 8.7% 8.6% 7.7% 6.7% 5.9% 4.9% 4.2% 3.1% 1.9% 1.0% 1.0% 1.4% 1.6% 2011 2012 2013 2014 2015 Bank – Loan Composition 31 Diverse Loan Book (Actual Loan Balances at December 31) $5.0B $5.7B $6.5B $7.5B $9.4B Commercial Credit Card Commercial & Industrial (1) HELOC Residential Real Estate Real Estate Construction Commercial Real Estate Consumer Credit Card Consumer Other 1.3% 1.0% 1.5% 2.3% 1.6% 1.4% 1.8% 1.7% 1.9% Factoring Loans Asset-Based Loans (1) Includes Leases |
 $2,433.7 $2,596.4 $2,880.3 $3,383.6 $3,759.1 $633.4 $826.2 $927.7 $962.5 $1,116.6 $502.6 $612.7 $717.9 $805.2 $933.9 $390.3 $896.7 $510.6 $550.8 $614.6 $679.7 $714.5 $390.3 $403.1 $450.1 $559.5 $558.7 $559.3 $313.2 $363.0 $333.2 $348.8 2011 2012 2013 2014 2015 Bank – Regional Lending 32 (2) Arizona loan balances include $534.6MM legacy UMB loans and $362.1MM legacy Marquette loans.
(1) Texas loan balances include $245.8 MM legacy UMB loans and $313.5MM legacy Marquette loans.
$130.1 $242.5 $129.4 $187.2 $197.4 $204.1 $294.7 $213.2 $138.6 $236.7 $5.0B $5.7B $6.5B $7.5B $9.4B Colorado Kansas City Kansas Greater MO St. Louis Arizona Texas Oklahoma Marquette Transportation Fin (Natl. Sales) Nebraska Marquette Business Credit (Natl. Sales) $215.8 $90.7 (1) (2) $68.1 Loans by Region (Actual Loan Balances at December 31) High Growth Regions 4Q’15 vs. 4Q’14 Texas +303.7% Arizona +129.8% Colorado & St. Louis +16.0% |
 Net
Charge-Off History 33
$ in thousands 2015 2014 2013 2012 2011 2010 2009 2008 2007 2006 Commerial Loans (1) 3,415 $ 6,459 $ 3,881 $ 7,310 $ 11,880 $ 6,007 $ 4,113 $ 2,943 $ 1,569 $ 2,367 $ Credit Card 6,753 8,301 8,811 9,382 11,127 14,279 12,291 6,839 4,577 3,449 Other (2) 329 851 1,483 1,399 1,128 1,411 3,854 1,973 2,127 1,176 Total Net Charge-offs $10,497 $15,611 $14,175 $18,091 $24,135 $21,697 $20,258 $11,755 $8,273 $6,992 Average Total Loans ($ billions) 8,425.1 $ 6,975.3 $ 6,221.3 $ 5,251.3 $ 4,756.2 $ 4,490.6 $ 4,383.6 $ 4,193.9 $ 3,901.9 $ 3,579.7 $ NCOs as % of Average Loans 0.12% 0.22% 0.23% 0.35% 0.51% 0.48% 0.47% 0.28% 0.21% 0.20% (1) Commercial includes Commercial & Industrial, Commercial Real Estate, Real Estate Construction loans, asset-based, and factoring
loans. (2)
Other includes Consumer, Residential Real Estate, HELOC, and DDA
Charge-offs. |
 Loan
Classification Trends 34
4.80% 2.30% 1.70% 0.80% 0.65% 0.0% 1.0% 2.0% 3.0% 4.0% 5.0% 6.0% 7.0% 8.0% Watch Special Mention Substandard Non-Performing Loans Total |
 34.4% 34.8% 33.7% 35.6% 34.0% 32.4% 28.2% 23.3% 23.0% 24.1% 8.4% 7.7% 6.4% 8.3% 7.8% 3.4% 4.4% 6.2% 7.8% 5.4% 9.9% 17.1% 6.3% 5.7% 8.5% 8.1% 6.9% 6.3% 6.1% 6.6% 10.0% 4.5% 4.7% 4.0% 3.7% 3.6% 3.0% 4.0% 4.0% 2011 2012 2013 2014 2015 Bank – Deposits 35 Diverse Sources of Deposits (Actual Deposits at December 31) $10.2B $11.7B $13.6B $13.6B $15.1B Personal Banking - Consumer Commercial Institutional - IAM Personal Banking - Private Wealth Asset Servicing Healthcare Institutional - IBIS Small Business Other 2.9% 0.2% 1.4% 0.2% 0.9% 2.1% |
 $5,366
$6,390 $7,044 $7,610 $8,659 $2,035 $2,219 $2,853 $3,603 $3,712 $188 $226 $351 $419 $421 2011 2012 2013 2014 2015 36 $7.6B $8.8B $10.2B $11.6B $12.8B $1.1B $1.2B $1.2B $1.4B $1.6B Home Equity Lines of Credit $ in millions Assets Under Management $ in millions Bank – Asset Mgmt. & Home Equity Lending (1) (1) Includes $682.0 million from Marquette Asset Management $533 $574 $566 $644 $730 $559 $608 $663 $755 $877 48.8% 48.5% 46.1% 46.0% 45.4% 2011 2012 2013 2014 2015 Balances Unused Commitments Utilization Personal Banking - Private Wealth & Institutional - IAM Prairie Capital Management Brokerage |
 Institutional Investment Management
37 $ in 000s, unaudited Year Ended 3 mos Ended December 31, % Change December 31, % Change 2015 2014 Y/Y 2015 2014 Y/Y $ 2 $ (3) 166.7% $ - $ 1 -100.0% 95,097 131,225 -27.5% 20,880 29,212 -28.5% 71,413 92,048 -22.4% 18,636 23,183 -19.6% 23,686 39,174 -39.5% 2,244 6,030 -62.8% 6,490 10,093 -35.7% 583 1,559 -62.6% Net income $ 17,196 $ 29,081 -40.9% $ 1,661 $ 4,471 -62.8% pre-tax profit margin 24.9% 29.9% 10.7% 20.6% Scout assets under management stood at $27.2 billion on December 31, 2015; 78% fixed
income / 22% equity Net flows for 4Q were +$262.1 million in fixed income and -$1.1 billion in equity
Two funds recently reached their 3-year anniversary—Scout Low Duration and
Scout Emerging Markets
4 th Quarter Statistics |
 Total
AUM $27.2B
$19.7B $23.5B Institutional Investment Management 38 $31.2B $31.2B $0.6 $0.9 $3.2 $2.4 $2.0 $10.3 $11.4 $12.6 $18.1 $18.9 $0.6 $0.8 $2.8 $2.9 $2.4 2011 2012 2013 2014 2015 Equity Mutual Funds Equity Institutional & Other Fixed Income Institutional & Other Fixed Income Mutual Funds $8.2 $10.4 $12.6 $7.8 $3.9 |
  AUM
Drivers $ in millions
($567.7) ($570.7) Total Change ($millions) $30,039.7 $30,607.4 Total AUM ($millions) Institutional Investment Management 39 $550.7 $31,178.1 ($2,027.5) $28,012.2 ($830.9) $27,181.3 4Q’15 3Q’15 2Q’15 1Q’15 4Q’14 ($2,314.6) ($1,111.0) ($682.1) ($1,354.3) ($1,078.6) ($166.3) $447.5 ($51.0) ($745.4) $207.2 $2,976.0 ($79.3) $262.6 $37.7 $262.1 $55.6 $172.0 ($97.2) $34.5 ($221.6) -$2,500 -$1,500 -$500 $500 $1,500 $2,500 $3,500 Equity Flows Equity Market Impact Fixed Income Flows Fixed Income Market Impact |
 AUM by
Strategy – As of December 31, 2015
40 Equity Fixed Income Equity Strategies Mid Cap International International ADR Emerging Markets Global Small Cap Other: Equity Opportunity Fixed Income Strategies Core Plus Low Duration Long Duration Core Real Return Unconstrained Intermediate Other: Global Aggregate Unconstrained UCITS 47.4% 42.8% 5.1% 3.9% 0.8% 78% 22% 31.2% 27.8% 18.7% 13.3% 4.3% 4.7% |
 Morningstar Ratings MORNINGSTAR RATING: The Overall Morningstar Rating™ for a fund is derived from the weighted-average of the performance figures associated with its 3-, 5- and 10-year (if applicable) Morningstar Rating metrics. For each fund with at least a 3-year history, Morningstar calculates a Morningstar Rating™ based on a Morningstar
Risk-Adjusted Return measure that accounts for variations in a fund's
monthly performance (including the effects of sales charges, loads and redemption fees), placing more emphasis on downward variations and rewarding consistent performance. The top 10% of the funds in a broad asset class receive 5 stars, the next 22.5% receive 4 stars, the next 35% receive 3 stars, the next 22.5% receive 2 stars and the bottom 10% receive 1 star. (Each share class is counted as a fraction of one fund within this scale and rated
separately, which may cause slight variations in the distribution
percentages.) As
of Dec. 31, 2015, the Scout Emerging Markets Fund received the following star ratings among U.S. domiciled Diversified Emerging Mkts Funds for the following time periods: 4 stars (among 578 funds) for the 3 year period. As of Dec. 31, 2015, the Scout Global Equity Fund received the following star ratings among U.S. domiciled World Stock Funds for the following time periods: 4 stars (among 984 funds) for the 3 year period. As of Dec. 31, 2015, the Scout Small Cap Fund received the following star ratings among U.S. domiciled Small Growth Funds for the following time periods: 4 stars (among 660 funds) for the 3 year, 4 stars (among 588 funds) for the 5 year and 3 stars (among 423 funds) for the 10 year periods.
As of Dec. 31, 2015, the Scout Core Bond Fund - Institutional Class received the following star ratings among U.S. domiciled Intermediate-Term Bond Funds for the following time periods: 3 stars (among 947 funds) for the 3 year, 3 stars (among 829 funds) for the 5 year and 4 stars (among 595 funds) for the 10 year
periods. As
of Dec. 31, 2015, the Scout Core Plus Bond Fund - Institutional Class received the following star ratings among U.S. domiciled Intermediate-Term Bond Funds for the following time periods: 2 stars (among 947 funds) for the 3 year, 4 stars (among 829 funds) for the 5 year and 5 stars (among 595 funds) for the 10 year periods. As of Dec. 31, 2015, the Scout Low Duration Bond Fund received the following star ratings among U.S. domiciled Short-Term Bond Funds for the
following time periods: 4 stars (among 493 funds) for the 3 year
period. The
funds may have experienced negative performance during one or more of the time periods represented by the Morningstar rating shown. © 2016 Morningstar, Inc. All Rights Reserved. The information contained herein: (1) is proprietary to Morningstar and/or its content
providers; (2) may not be copied or distributed; and (3) is not warranted
to be accurate, complete or timely. Neither Morningstar nor its content providers are responsible for any damages or losses arising from any use of this information. Past performance is no guarantee of future results. The Morningstar Rating may differ among share classes of a
mutual fund as a result of different sales loads and/or expense
structures. It may be based, in part, on the performance of a predecessor Fund. The Scout Funds are distributed by UMB Distribution Services LLC, an affiliate of UMB Financial Corporation, and managed by Scout Investments,
Inc., a subsidiary of UMB Financial Corporation.
NOT FDIC INSURED • NO BANK GUARANTEE • MAY LOSE VALUE
Fund Name Category Funds in Category Scout Emerging Markets Diversified Emerging Mrkts 578 Scout Global Equity World Stock 984 Scout Small Cap Small Growth 660 Scout Core Bond - Institutional Class Intermediate-Term Bond 947 Scout Core Plus Bond - Institutional Class Intermediate-Term Bond 947 Scout Low Duration Bond Short-Term Bond 493 Morningstar ratings based on a risk-adjusted performance as of December 31,2015
Overall Rating 41 |
 Each
Fund’s Prospectus or Summary Prospectus, available by calling 800.996.2862 or visiting scoutinv.com, includes investment objectives, risks, fees, expenses and other important information. Please read and consider carefully before investing.
Risk considerations: Stock fund values fluctuate and
investors may lose principal value. Small-cap and mid-cap stocks are more
susceptible to market volatility due to risks such as lack of
management experience, product diversification, financial resources, competitive strength and liquidity. Real Estate Investment Trusts (REITS) may be affected by economic conditions including credit risk, interest rate risk and other
factors that affect property values, rents or occupancies of real
estate. Groups of stocks, such as value and growth, go in and out of favor, which may cause certain funds to underperform other equity funds. Foreign investments present additional risk due to currency fluctuations, economic and political factors, government regulations, differences in
accounting standards, and other factors. Investments in emerging markets
involve even greater risks. Focusing on particular countries, regions,
industries, sectors or types of investments may cause greater risk of adverse
developments in certain funds. The return of principal in a fixed income
fund is not guaranteed. Fixed income funds have the same issuer, interest rate, inflation and credit risks that are associated with underlying fixed income securities owned by the fund. Mortgage- and Asset-Backed Securities are subject to prepayment risk and the risk of default on the underlying mortgages or other assets. High yield securities involve greater risk than investment
grade securities and tend to be more sensitive to economic conditions and
credit risk. An unconstrained investment approach can create considerable
exposure to certain types of securities, such as derivatives, that present significant volatility, particularly over short periods of time. Derivatives, such as options, futures contracts, currency forwards or swap agreements, may involve greater risks than if the Fund invested in
the referenced obligation directly. Derivatives are subject to risks,
such as market risk, liquidity risk, interest rate risk, credit risk and
management risk. Derivative investments could lose more than the principal amount invested. Certain funds may use derivative for hedging purposes or as part of the fund's investment strategy. The use of leverage, derivatives and short sales could accelerate losses to the Fund.
These losses could exceed the original amount invested.
Certain funds may, at times, experience higher-than-average portfolio turnover, which may generate significant taxable gains and increased trading expenses, which, in turn, may lower the fund’s return. Important Disclosures 42 |
 Payment
Solutions 43
Payment Solutions Segment Results $ in 000s,
unaudited Year Ended
3 mos Ended December 31, % Change December 31, % Change 2015 2014 Y/Y 2015 2014 Y/Y Net interest income $ 58,288 $ 52,251 11.6% $ 16,028 $ 14,003 14.5% Provision for loan losses 6,959 7,825 -11.1% 2,003 1,383 44.8% Noninterest income 91,326 84,478 8.1% 22,802 21,479 6.2% Noninterest expense 106,016 93,915 12.9% 27,887 26,473 5.3% NI before taxes 36,639 34,989 4.7% 8,940 7,626 17.2% Income tax provision 10,043 7,791 28.9% 2,325 1,967 18.2% Net income $ 26,596 $ 27,198 -2.2% $ 6,615 $ 5,659 16.9% pre-tax profit margin 24.5% 25.6% 23.0% 21.5% Total debit and credit card purchase volume was $9.3 billion for the full year 2015, an
increase of 10.2% compared to 2014
HSA accounts grew to 805 thousand at year-end, for a 36.8% year-over-year
increase HSA deposits stood at $1.2 billion, on December 31, 2015 an
increase of 39.5% compared to year-end 2014
Since inception in 3
rd quarter 2015, the HSA Saver product has moved $9.0 million dollars of HSA deposits into investment assets Highlights |
 19.3% 17.9% 14.7% 11.1% 9.7% 21.1% 21.7% 19.3% 17.1% 18.2% 30.3% 28.3% 24.4% 19.5% 17.6% 27.7% 30.7% 39.8% 50.7% 53.1% $14.2 $15.7 $15.9 $18.0 $19.9 4Q '11 4Q '12 4Q '13 4Q '14 4Q '15 Payment Solutions Total Card Purchase Volume & Interchange Revenue 44 Commercial Credit Consumer Credit Consumer Debit Healthcare Debit Institutional Banking – IBIS Debit Interchange ($millions) $2.3B $1.3B $1.4B $1.6B $2.1B 1.6% 1.4% 1.8% 1.6% 1.4% |
 Payment Solutions – Healthcare Services 45 Healthcare Purchase Volume Trends $millions 23.4% 22.7% 32.5% 37.7% 41.0% 29.0% 34.3% 38.6% 36.7% $350.0 $393.8 $536.4 $448.0 $421.4 $881.3 $748.6 $680.2 $649.1 $1,150.0 $1,152.1 $1,082.9 $1,052.3 $1,393.0 $1,379.7 $1,290.5 $1,195.9 Virtual Card Volume Other Healthcare Volume |
 $298.4 $399.6 $595.0 $841.7 $1,174.1 $24.9 $30.9 $47.4 $75.8 $118.3 2011 2012 2013 2014 2015 HSA Deposits HSA Investment Assets Payment Solutions – Healthcare Services 46 Healthcare Deposits and Assets $millions $323.3 $430.5 $642.4 $917.5 $1,292.4 Investment assets as a 2011 2012 2013 2014 2015 % of total healthcare deposits & assets 7.7% 7.2% 7.4% 8.3% 9.2% Healthcare provided 7.8% of Total Company Deposits in 4Q’15 |
 We
offer a modular and configurable platform of applications and services that deliver the underlying core banking functionality to our healthcare partners.
Broker/Employer TPAs Health Plans Tech Cos Payment Aggregators Healthcare Partners HSA Applications SSO Web Services Contributions Enrollment BIN Sponsor HCS Saver Partner Portal Core Banking Systems 47 Multi-Channel Healthcare Strategy |
 Asset
Servicing 48
Assets Under Administration
$billions Investment Management Series Trusts continue to grow, with 81 active funds and $12.8 billion in assets at December 31, 2015 Added 31 net new funds and increased assets under administration by 20.6% in the alternative space in the past 12 months Highlights Asset Servicing Segment Results $ in 000s, unaudited Year Ended 3 mos Ended December 31, % Change December 31, % Change 2015 2014 Y/Y 2015 2014 Y/Y Net interest income $ 5,076 $ 5,451 -6.9% $ 1,768 $ 1,049 68.5% Noninterest income 91,587 88,762 3.2% 22,517 22,177 1.5% Noninterest expense 79,651 75,514 5.5% 18,847 19,938 -5.5% NI before taxes 17,012 18,699 -9.0% 5,438 3,288 65.4% Income tax provision 4,552 3,429 32.8% 1,406 872 61.2% Net income $ 12,460 $ 15,270 -18.4% $ 4,032 $ 2,416 66.9% pre-tax profit margin 17.6% 19.8% 22.4% 14.2% $179.3 $185.6 |
 $115.6 $54.9 $68.0 $62.4 $57.0 499 443 411 454 478 2011 2012 2013 2014 2015 Assets Under Administration # of Custody Accounts $24.7 $26.3 $27.9 $31.5 $38.1 467 532 514 579 610 2011 2012 2013 2014 2015 Assets Under Administration # of Funds Serviced 802.4 946.8 1,280.1 1,111.2 1,083.4 256 270 301 349 386 2011 2012 2013 2014 2015 # of Shareholders # of Funds Serviced $35.9 $44.1 $63.0 $72.1 $60.8 160 179 219 249 253 2011 2012 2013 2014 2015 Assets Under Administration # of Funds Serviced Asset Servicing 49 Fund Accounting & Administration Alternative Asset Servicing Custody Transfer Agency |
 Strength in balance –
today and tomorrow. Fourth Quarter 2015 UMB Financial |