Attached files
| file | filename |
|---|---|
| EX-23.1 - EXHIBIT 23.1 - VASCULAR SOLUTIONS INC | ex23_1.htm |
| EX-31.2 - EXHIBIT 31.2 - VASCULAR SOLUTIONS INC | ex31_2.htm |
| EX-32.2 - EXHIBIT 32.2 - VASCULAR SOLUTIONS INC | ex32_2.htm |
| EX-31.1 - EXHIBIT 31.1 - VASCULAR SOLUTIONS INC | ex31_1.htm |
| EX-32.1 - EXHIBIT 32.1 - VASCULAR SOLUTIONS INC | ex32_1.htm |
UNITED STATES SECURITIES AND EXCHANGE COMMISSION
WASHINGTON, D.C. 20549
FORM 10-K
|
(Mark One)
|
|||
|
☒
|
ANNUAL REPORT PURSUANT TO SECTION 13 OR 15(d) OF THE SECURITIES EXCHANGE ACT OF 1934
|
||
| For the fiscal year ended December 31, 2015 | |||
| OR | |||
|
☐
|
TRANSITION REPORT PURSUANT TO SECTION 13 OR 15(d) OF THE SECURITIES EXCHANGE ACT OF 1934
|
||
|
For the transition period from _______ to ________
|
|||
Commission file number: 0-27605
VASCULAR SOLUTIONS, INC.
(Exact name of registrant as specified in its charter)
|
Minnesota
|
41-1859679
|
|
|
(State or other jurisdiction of incorporation or organization)
|
(IRS Employer Identification No.)
|
6464 Sycamore Court North
Minneapolis, Minnesota 55369
(Address of principal executive offices, including zip code)
(763) 656-4300
(Registrant’s telephone number, including area code)
Securities registered pursuant to Section 12(b) of the Act:
|
Title of each class:
|
Name of each exchange on which registered:
|
|
|
Common Stock, par value $.01 per share
|
The NASDAQ Global Select Market
|
Securities registered pursuant to Section 12(g) of the Act: None
Indicate by check mark if the registrant is a well-known seasoned issuer, as defined in Rule 405 of the Securities Act. Yes ☐ No ☒
Indicate by check mark if the registrant is not required to file reports pursuant to Section 13 or Section 15(d) of the Act. Yes ☐ No ☒
Indicate by check mark whether the registrant (1) has filed all reports required to be filed by Section 13 or 15(d) of the Securities Exchange Act of 1934 during the preceding 12 months (or for such shorter period that the registrant was required to file such reports), and (2) has been subject to such filing requirements for the past 90 days. Yes ☒ No ☐
Indicate by check mark whether the registrant has submitted electronically and posted on its corporate Website, if any, every Interactive Data File required to be submitted and posted pursuant to Rule 405 of Regulation S-T (§229.405 of this chapter) during the preceding 12 months (or for such shorter period that the registrant was required to submit and post such files). Yes ☒ No ☐
Indicate by check mark if disclosure of delinquent filers pursuant to Item 405 of Regulation S-K (section 229.406 of this chapter) is not contained herein, and will not be contained, to the best of registrant’s knowledge, in definitive proxy or information statements incorporated by reference in Part III of this Form 10-K or any amendment to this Form 10-K. ☒
Indicate by check mark whether the registrant is a large accelerated filer, an accelerated filer, a non-accelerated, or a smaller reporting company. See the definitions of “large accelerated filer,” accelerated filer,” and smaller reporting company” in Rule 12b-2 of the Exchange Act.
|
Large accelerated filer ☐
|
Accelerated filer ☒
|
Non-accelerated filer ☐
|
Smaller reporting company ☐
|
Indicate by check mark whether the registrant is a shell company (as defined in Rule 12b-2 of the Act). Yes ☐ No ☒
The aggregate market value of voting and non-voting common equity held by non-affiliates computed by reference to the price at which the common equity was last sold on June 30, 2015 was $576,467,340.
As of January 18, 2016, the number of shares outstanding of the registrant’s common stock was 17,356,911.
DOCUMENTS INCORPORATED BY REFERENCE
Portions of the Registrant’s Proxy Statement for its 2016 Annual Meeting of Shareholders to be held on April 29, 2016 are incorporated by reference in Part III of this Annual Report on Form 10-K.
PART I
Overview
Vascular Solutions, Inc. (we, us, the company, or Vascular Solutions) is an innovative medical device company focused on bringing clinically advanced solutions to the market for treating coronary and peripheral vascular disease. The company’s product line consists of more than 90 devices and services that are sold to interventional cardiologists, interventional radiologists, electrophysiologists, and vein practices worldwide.
As a vertically-integrated company, we generate ideas, create new minimally-invasive medical devices, and then deliver these products and related services to the physicians who treat vascular disease. In the United States, we sell our products through a 103-person direct sales force. Outside the U.S., we work through a network of 41 independent distribution companies that cover 57 countries.
We intend to continue to develop and market a vast array of products that serve the needs of interventional physicians. Currently, we have a particular focus in our R&D and corporate development programs on three areas: complex interventions, radial artery catheterizations, and embolization procedures. We believe these three segments of the vascular interventions market have the greatest need for new specialized products and also represent some of the best opportunities for growth.
One of our highest-priority R&D programs is a collaboration with the United States Army to develop freeze-dried plasma for the treatment of battlefield trauma. The product we have developed, RePlas™ freeze-dried plasma, is the result of our long-standing expertise in the lyophilization (freeze-drying) of biologic materials. The U.S. Army has agreed to sponsor, conduct, and fund the clinical development of RePlas, and we will retain all rights to market the product after FDA approval.
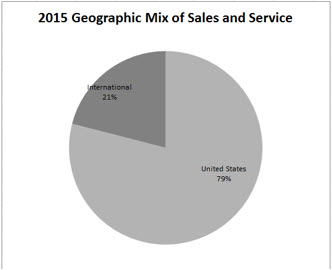
During 2015, approximately 79% of our product and service sales were generated in the U.S., while international sales accounted for approximately 21%.
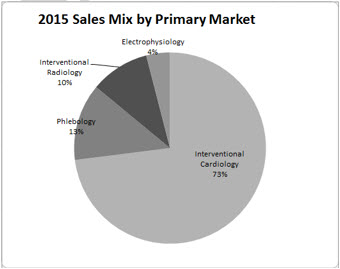
We estimate that during 2015 approximately 73% of our sales were of products and services used in the interventional cardiology market, 13% in the phlebology market, 10% in the interventional radiology market, and 4% in the electrophysiology market.
2
History
We were incorporated in the state of Minnesota in December 1996 and began operations in February 1997. In 2000, we received FDA clearance for our first product, the Duett™ sealing device, which was used to seal the puncture site following catheterization procedures. In 2001, we made the strategic decision to develop additional products and to de-emphasize our Duett product, which we discontinued during 2013. We have grown from net revenue of $6.2 million in 2000 solely from sales of our Duett product to net revenue of $147.2 million in 2015 from sales of over 90 additional products we have developed, licensed, or acquired since our inception. This increase in revenue represents a compound annual growth rate of 24% and is driven by our commitment to the development and launch of multiple new devices to diagnose and treat vascular conditions.
Interventional Cardiology and Interventional Radiology Industry Background
According to data from the United States Centers for Disease Control and Prevention (CDC), an estimated 80 million Americans have one or more types of cardiovascular disease—diseases of the heart and blood vessels. The CDC data indicate that cardiovascular disease is the number one cause of death in the United States and is replacing infectious disease as the world’s pre-eminent health risk. Advances in medicine have enabled physicians to perform an increasing number of diagnostic and therapeutic treatments of cardiovascular disease using minimally invasive methods, such as catheters placed inside the arteries, instead of highly invasive open surgery.
Cardiologists and radiologists use diagnostic procedures, such as angiography, to confirm, and interventional procedures, such as angioplasty and stenting, to treat, diseases of the coronary and peripheral arteries. Each angiographic procedure using a catheter requires a puncture in an artery, usually the femoral artery in the groin area and sometimes the radial artery in the wrist, to gain access for the catheter. The catheter then is deployed through an introducer sheath into the vessel to be diagnosed or treated. Upon completion of the procedure and removal of the catheter, the physician must seal this puncture in the artery and the tissue tract that leads from the skin surface to the artery to stop bleeding. Based on industry statistics, we estimate that cardiologists and radiologists performed over nine million diagnostic and interventional catheterization procedures worldwide in 2015.
During the past few years, the number of catheterization procedures performed worldwide has been declining gradually due to a number of factors – among them, the effects of weak economies on overall health care utilization rates, efforts by third-party payers to lower costs associated with medical procedures, investigations by government agencies into potential over-utilization of procedures, the implementation by hospitals of policies designed to reduce the incidence of unnecessary procedures in the wake of these outside investigations, and new diagnostic imaging and functional assessment modalities that more effectively screen patients to determine the need for treatment. Although worldwide demographic factors, including the growing incidence of cardiovascular disease, seem to favor long-term growth in the number of interventional procedures, we believe that the recent structural pressures on utilization rates are likely to continue and to result in relatively flat catheterization volumes for the foreseeable future. Based on our analysis of the publicly-available sales figures from selected companies that participate in the cardiovascular device sector, we estimate the worldwide market for interventional medical devices used in cardiovascular procedures in 2015 exceeded $15 billion.
The interventional medical device industry is characterized by intense competition, cost-containment efforts by hospitals and payors, rapidly-evolving technology, and a high degree of government regulation. To grow our business, we have focused on continually developing and commercializing new products and services. Looking ahead, we expect our business may be impacted by the following trends and opportunities:
| · | The future regulatory approval of newly-developed products. Any new product that we develop must be approved by the Food and Drug Administration (FDA) in the United States and by similar regulatory bodies in other countries before it can be sold. The requirements for obtaining product approval have undergone change, and the FDA frequently implements changes to the product approval process. We monitor the changing regulatory landscape and modify our regulatory submissions as necessary to obtain product approvals. |
3
| · | Successfully integrating acquired and distributed products and services into our existing operations. The acquisition of products, product distribution rights and services complementary to our existing product portfolio and customer call points provides an additional business opportunity, but is dependent on the successful integration of the acquired or distributed products into our existing business structure. Since 2010, we have acquired or licensed more than 10 products and services. |
| · | Managing intellectual property. The interventional medical device industry is characterized by numerous patent filings and litigation claims made to protect new and evolving product ideas. To maximize the profitability of new product ideas, we seek patent protection for those product design and method concepts which we believe have the potential to provide substantial product revenue. On October 14, 2013, we reached an agreement with Terumo Corporation and Terumo Medical Corporation (Terumo) to settle a patent and trademark infringement lawsuit brought by Terumo against us related to a prior version of our Vasc Band™ radial compression device in exchange for a one-time payment to Terumo in the amount of $812,500. On July 30, 2014, we reached an agreement with Boston Scientific Corporation to settle a patent and copyright infringement lawsuit brought by us against Boston Scientific Corporation related to a competitive product to our GuideLiner® guide extension product on confidential terms. Managing intellectual property assets and claims is a significant challenge for our business. |
| · |
Managing greater government regulation and scrutiny. Our products and business activities are subject to rigorous regulation, including by the U.S. FDA, Department of Justice, and numerous other federal, state, and foreign governmental authorities. These authorities have been increasing scrutiny of our industry and enforcement actions related to companies in it. Managing compliance with existing and future regulation of our industry and fulfilling regulatory disclosure requirements is a significant challenge for our business.
|
Products and Services
Since the company’s inception, we have launched more than 100 products and services that we sell to interventional cardiologists, interventional radiologists, electrophysiologists, and vein specialists through our direct U.S. sales force and international independent distributor network. The competitive advantages of our products and services are enhanced by the experience of our sales and marketing teams, the experience of our management, and our dedication to bringing clinically unique solutions to the markets we serve.
For information about our revenue, profits and total assets, see our Consolidated Financial Statements included in Item 8 of Part II of this Annual Report on Form 10-K for the year ended December 31, 2015.
Top Products
In order to provide a detailed product-specific revenue analysis, in the first quarter of 2015 we began reporting net revenue for each of our top product lines. During 2015, our top eight products represented 79% of our total revenue and grew by 16% on a year-over-year basis. The following table sets forth, for the periods indicated, net revenue by product line along with the percentage change from the previous period presented for each of our top products by net revenue:
|
Year ended December 31,
|
|||||||||||||
|
2015
|
2014
|
||||||||||||
|
Product
|
Primary Market
|
Net Revenue
|
Percent
Change
|
Net Revenue
|
|||||||||
|
(dollars in thousands)
|
|||||||||||||
|
GuideLiner catheters
|
Interventional cardiology
|
$
|
45,409
|
43
|
%
|
$
|
31,836
|
||||||
|
Pronto® catheters
|
Interventional cardiology
|
14,970
|
(17
|
%)
|
17,998
|
||||||||
|
Vein catheter reprocessing
|
Phlebology
|
12,602
|
23
|
%
|
10,207
|
||||||||
|
Micro-introducer kits
|
Interventional radiology
|
12,337
|
18
|
%
|
10,416
|
||||||||
|
Hemostatic patches
|
Interventional cardiology
|
11,998
|
(3
|
%)
|
12,416
|
||||||||
|
Radial access products
|
Interventional cardiology
|
7,436
|
27
|
%
|
5,839
|
||||||||
|
Langston® catheters
|
Interventional cardiology
|
6,590
|
8
|
%
|
6,109
|
||||||||
|
D-Stat® Flowable hemostat
|
Electrophysiology
|
5,322
|
(3
|
%)
|
5,462
|
||||||||
4
GuideLiner catheters
Our highest-selling product is the GuideLiner guide extension catheter device, which had 2015 sales of $45.4 million, representing growth of 43% from the 2014 level of $31.8 million. With the introduction of the GuideLiner catheter in 2009, Vascular Solutions pioneered the interventional technique of rapid exchange guide extension. The GuideLiner catheter is designed to greatly increase backup support and allow deep-seating of the guide catheter for coaxial alignment, distal device delivery, and selective delivery of contrast. The device is especially useful in complex interventions. Based on our belief that GuideLiner could be applicable to approximately 10% of all cardiac catheterization procedures, we estimate the annual worldwide market opportunity for GuideLiner to be approximately $75 million.
We received CE Mark and launched GuideLiner in Europe in October 2009, and we received 510(k) clearance and launched the device in the U.S. in November 2009. In December 2011, we launched the second generation of our GuideLiner catheter with increased flexibility, a smaller size version, and a longer extension. In August 2013, we launched the third generation version, GuideLiner V3, which features a polymer “half-pipe” collar to enhance stent and wire deployment. In December 2013, our Japanese distributor, Japan Lifeline, received Shonin approval from the Japanese Ministry of Health, Labour and Welfare (MHLW) to permit sales of the GuideLiner in Japan. Japan Lifeline commenced sales to Japanese hospitals in January of 2014.
Pronto catheters
Our Pronto extraction catheters are designed to remove fresh, soft thrombus and emboli from the arteries of patients suffering a heart attack. The Pronto catheters feature a proprietary distal tip and large extraction lumen that can be delivered into arteries to remove blood clots using simple vacuum suction. Sales of Pronto in 2015 were $15.0 million, a decline of 17% from the 2014 level of $18.0 million. The market for extraction catheters is mature, with numerous competitors and significant price erosion. Based on industry data, we believe the worldwide annual market potential for manual extraction catheters is approximately $50 million.
The original Pronto extraction catheter was developed by Dr. Pedro Silva of Milan, Italy, who exclusively licensed the design to us in 2002. We received CE Mark approval and commenced international sales of the Pronto in August 2003, and received FDA clearance in December 2003 and commenced sales in the United States in early 2004. In the fourth quarter of 2005, we launched the third generation design of Pronto, named the Pronto V3. In January 2011, we commenced the launch of the Pronto V4, which utilizes an embedded longitudinal wire for maximum extraction with enhanced deliverability and kink resistance. On January 6, 2012, we purchased the intellectual property relating to the Pronto extraction catheter from Dr. Silva and his affiliates in exchange for $3.25 million, which thereby eliminated royalty payments on sales of Pronto catheters occurring after December 31, 2011.
In addition to the Pronto V3 and V4, we have developed and launched four additional versions of extractions catheters: the Pronto-Short, Pronto 035, Pronto LP, and Pronto XL. The Pronto-Short is a shorter catheter with a larger diameter, designed for use in clotted dialysis grafts, which was launched in August 2005. The Pronto 035 is a larger version, designed for use in large vessels, which was launched in August 2007. The Pronto LP is a low-profile version, designed for use in smaller vessels, which was launched in January 2008. The Pronto XL extraction catheter is an even larger version with either a straight or pigtail tip, designed for use in very large vessels, which was launched in January 2012.
Vein catheter reprocessing
Sales from our vein catheter reprocessing service for radiofrequency vein ablation catheters were $12.6 million during 2015, an increase of 23% from the 2014 level of $10.2 million. We estimate the annual worldwide market potential for our RF vein ablation service to be approximately $20 million.
On December 22, 2011, we entered into an exclusive license agreement with Northeast Scientific, Inc. (NES), under which we sell a reprocessing service to customers utilizing the ClosureFAST® radiofrequency catheter in the treatment of varicose veins in the United States. We commenced marketing this service to vein clinics in the U.S. in January of 2012. The ClosureFAST catheter is owned and marketed by a subsidiary of Medtronic plc, and our reprocessing service is not licensed by or associated with Medtronic. Under the reprocessing service provided by NES, the customer sends used ClosureFAST catheters to NES, where they are inspected, cleaned, tested, repackaged, resterilized, and shipped back to the customer. In addition to this basic reprocessing service, we also purchase used ClosureFAST catheters from vein clinics and have them reprocessed by NES for sale to customers in the U.S.
5
In August of 2015, we signed a revised agreement with NES that grants us exclusive rights to market the ClosureFAST reprocessing service in the U.S. through December 31, 2021. From the inception of our ClosureFAST reprocessing service in January 2012 through December 31, 2015, NES had successfully reprocessed more than 100,000 ClosureFAST catheters for our customers.
Micro-Introducer Kits
Sales of micro-introducer kits in 2015 were $12.3 million, representing growth of 18% from the 2014 level of $10.4 million. Micro-introducers are access kit products used to gain percutaneous access to the vasculature for performing arterial and venous catheterization procedures. Based on industry data, we estimate the annual worldwide market potential for micro-introducers to be approximately $75 million.
In July 2003, we launched a variety of introducer products, including a full line of kits and a variety of specialty guidewires. In recent years, our focus has been on transitioning our micro-introducer business to internal manufacturing, cost reductions, and product line expansion. This strategy has resulted in lower prices for our customers and increased gross margins and higher market share for Vascular Solutions.
Hemostatic patches
Sales of hemostatic patches in 2015 were $12.0 million, representing a decline of 3% from $12.4 million in 2014. Based on industry data, we believe the annual worldwide market for hemostat patches used in catheterization procedures is approximately $50 million. The market for hemostat patches, used to stop bleeding of femoral artery punctures, is mature, with multiple competitors and ongoing pricing pressures. In addition, two trends are negatively affecting the demand for our D-Stat® and Thrombix® patches: the recent slowdown in growth of catheterization procedures in general and the movement toward greater reliance on using the radial artery in the arm, rather than the femoral artery in the leg, as the access site for diagnostic and interventional procedures.
Our hemostat products primarily utilize thrombin, a powerful bovine-derived blood clotting protein, to deliver a rapid seal of bleeding with a variety of shelf-stable configurations. We have developed a proprietary manufacturing process to terminally sterilize our thrombin-based hemostats, which has resulted in our ability to create unique advantages in storage, shipping, preparation, and application of our hemostat products.
Our most popular hemostat product is the D-Stat Dry hemostat bandage. In September 2003, we received regulatory clearance and commenced sales of our D-Stat Dry hemostat bandage in the United States and international markets. The D-Stat Dry is a version of our proprietary blood clotting substance that is lyophilized (freeze-dried) into a gauze pad and combined with an adhesive bandage for application. D-Stat Dry is used as an adjunct to manual compression for managing bleeding after catheterization procedures.
In the third quarter of 2006, we received FDA clearance of our claim that the D-Stat Dry product reduces the time-to-hemostasis in diagnostic catheterizations. This claim was based on our 376-patient, five-center randomized clinical study that demonstrated a 50% reduction in the median time-to-hemostasis when using the D-Stat Dry bandage compared to simple manual compression alone. In the first quarter of 2008, we received FDA clearance and began selling two new versions of the original D-Stat Dry. The first, D-Stat Dry Clear, is packaged with a clear bandage that allows for better visibility of the puncture site while the bandage is in place. The second, Thrombix, uses a lower-cost manufacturing process that offers price flexibility within the product line.
6
In the first quarter of 2009, we received FDA clearance and began selling a new version of the original D-Stat Dry bandage, D-Stat Dry Wrap, which contains a pre-cut slit in the bandage, specifically designed for the control of bleeding around indwelling lines. In May 2011, we received FDA clearance and began selling a new version of our D-Stat Dry bandages with silver chloride impregnated into the gauze pad to help prevent the colonization of microorganisms on the pad. In January 2014, we received FDA clearance and launched in the U.S. our ThrombiDisc™ topical hemostat, a thrombin-based pad used as an adjunct to manual compression to control surface bleeding from vascular access sites and percutaneous catheters or tubes up to 12F in diameter. ThrombiDisc also contains the antimicrobial ingredient silver chloride, designed to prevent microorganisms commonly encountered in the clinical setting from colonizing on the pad.
Radial Access Products
During 2015, sales of our products used in radial artery access catheterizations totaled $7.4 million, an increase of 27% from the 2014 level of $5.8 million. Based on industry data, we estimate that our collection of products for the radial catheterization market addresses an annual U.S. market opportunity of approximately $90 million.
Radial artery access, otherwise known as transradial access, is undergoing rapid adoption in the U.S. According to industry data, the proportion of U.S. procedures performed using radial artery access grew from just 1% during the first quarter of 2007 to 16% by the third quarter of 2013. The level of penetration for radial access in the U.S. is still far behind most other parts of the world – such as Canada at nearly 60%, Japan at 60%, and the average throughout Europe at approximately 50%. Based on projected continued growth in radial access, we believe the number of radial artery access procedures performed in the U.S. will grow to approximately one million by the end of 2016, representing approximately 27% of all diagnostic and interventional cardiac catheterizations.
During 2012, we implemented our strategy of launching products that address the significant growth opportunity in the radial access market. In June 2012, we acquired the Accumed™ wrist positioning splint device from Accumed Systems, Inc. The Accumed wrist positioning splint consists of a molded plastic brace that simplifies access to the radial artery by holding the hand, wrist, and forearm in an appropriate, comfortable position. In May of 2013, we launched the Vasc Band radial compression device under an exclusive U.S. distribution agreement with LePu Medical Technology (Beijing) Co., Ltd. (“LePu Medical”). The Vasc Band is placed around the patient’s wrist after a radial catheterization procedure and uses an inflatable compression band to assist hemostasis. In December 2014, we expanded our relationship with LePu Medical to include exclusive U.S. distribution rights to a line of introducer sheaths designed for use in radial catheterizations. LePu Medical manufactures the product, which we sell in the U.S. under the name VSI Radial™ Introducer Sheath. In April of 2015, we entered into an agreement with All Of It Scandinavia AB to distribute a radial arm board in the U.S. under the name Xtend™ Radial Arm Board.
Langston catheters
Sales of our Langston catheter in 2015 were $6.6 million, an increase of 8% from the 2014 level of $6.1 million. We believe the annual sales opportunity for this device is in excess of $10 million.
We received regulatory clearance in the United States for the Langston dual lumen pigtail catheter during the third quarter of 2004. The Langston catheter is used for the measurement of intravascular pressure gradients, primarily to diagnose aortic valve stenosis. We believe our Langston catheter is the only dual lumen pigtail catheter on the U.S. market that is designed specifically for this clinical purpose. In March 2011, we launched a second version of the Langston catheter with improved pressure measurement and reduced kinking. With the current growth in percutaneous aortic valve replacement procedures, our Langston catheter continues to benefit from an expanding market.
7
D-Stat Flowable hemostat
In 2015, sales of our D-Stat Flowable hemostat were $5.3 million, which represented a 3% decrease from the $5.5 million in 2014. We estimate the annual sales potential for D-Stat Flowable at approximately $10 million.
We began selling D-Stat Flowable worldwide in February 2002. This hemostat product is a thick yet flowable mixture of collagen, thrombin, and diluent that can be used to control active bleeding. In December 2006, we received FDA approval of our premarket approval (PMA) supplement for the use of D-Stat Flowable in the prepectoral pockets created in pacemaker and implantable cardioverter defibrillator (ICD) implants. Our PMA supplement was supported by the results of our 269-patient “Pocket Protector” clinical study that demonstrated a 48% reduction in the incidence of clinically relevant hematomas through the use of D-Stat Flowable compared to the standard of care. We discontinued international sales of D-Stat Flowable in 2015 for commercial business reasons.
The amount of total revenue contributed by geographic areas for the last three fiscal years is set forth in Note 10 to our Consolidated Financial Statements in Item 8 of Part II of this Annual Report on Form 10-K for the year ended December 31, 2015.
Agreements with King Pharmaceuticals, Inc.
In January 2007, we entered into a License Agreement with King Pharmaceuticals, Inc. (King), which is now a subsidiary of Pfizer, Inc. Under the terms of the License Agreement, we granted to King an exclusive, royalty-free, fully-paid up, perpetual, worldwide right and license to all of our patents and know-how relating to the development, manufacture, use, sale, importation or other exploitation of our Thrombi-Pad™ trauma bandage, Thrombi-Gel® hemostats, Thrombi-Paste ™ hemostat (collectively, the “Products”) and all future medical devices having application in the Field (as defined below) and intended to produce hemostasis by accelerating the clotting process of blood (a “hemostat device”). The “Field” is defined as all applications of hemostat devices in all areas other than catheterization laboratories (cardiac and peripheral), electrophysiology laboratories and holding and recovery rooms for such laboratories. Upon execution of the License Agreement, King paid us a one-time payment of $6.0 million. No other payments are due from King to us under the License Agreement. The term of the License Agreement commenced on January 9, 2007 and continues until the later of the expiration of each licensed patent or King’s relinquishment of its license rights under the licensed know-how.
Also in January 2007, we entered into a Thrombin-JMI® Supply Agreement with King. Under the terms of the Thrombin-JMI Supply Agreement, King agreed to manufacture and supply thrombin to us on a non-exclusive basis. King agreed to supply us with such quantity of thrombin as we may order for use in devices not intended for sale by King in the Field at a fixed price throughout the term of the Thrombin-JMI Supply Agreement as adjusted for inflation, variations in potency and other factors. King also agreed to provide thrombin to us under the Thrombin-JMI Supply Agreement at no cost for incorporation into Products and hemostat devices intended for sale in the Field by King. The Thrombin-JMI Supply Agreement has an initial term of 10 years, followed by successive automatic one-year extensions, subject to termination by the parties under certain circumstances, including (1) termination by King without cause any time after the fifth anniversary of its execution upon five years prior written notice to us and (2) termination by us without cause any time after the fifth anniversary of its execution upon five years prior written notice to King, provided that a Device Supply Agreement we entered into with King in January 2007 has expired on its terms or the parties have agreed to terminate it.
8
Business Strategy
Our primary objective is to establish ourselves as a leading supplier of clinically superior medical devices and services for substantial, unique opportunities within interventional medicine worldwide. The key steps in achieving our primary objective are the following:
| · | Maintain and Improve our Clinically-Oriented Direct Sales Force in the United States. During 2000, we commenced sales of our products in the United States through a direct sales force of clinically trained account managers who sell and train interventional cardiologists, radiologists and catheterization laboratory personnel on the use of our products. As our product lines have increased, we have increased the size of our sales force to 103 at the end of 2015, which provides substantially complete geographic coverage of the United States. |
| · | Expand the Markets and Revenue of our International Distribution. We sell our products into international markets through 41 independent distributors that cover 57 countries at the end of 2015. Our sales in markets outside the United States increased from 18% of our revenue in 2014 to 21% of our revenue in 2015. Over time, we expect to increase our international sales as a percentage of revenue by continuing to increase the number of countries where our products are sold and increasing the volume of our products sold in international markets. |
| · | Develop New Devices and Services to be Sold to our Existing Customers. Since we launched our initial product, we have created and developed over 100 new medical devices sold to and used by interventional physicians. We intend to continue to leverage our direct sales force and international distributor organization by creating, developing and launching additional new products and services for interventional physicians. |
| · | Acquire Additional Products or Services to be Sold to our Existing Customers. We intend to continue to leverage our distribution capabilities by offering additional new products and services through acquisitions and distribution agreements. Over the past three years, we have acquired products, product distribution rights and services from multiple companies (see Note 14 to our Consolidated Financial Statements in Item 8 of Part II of this Annual Report on Form 10-K for the year ended December 31, 2015), and we expect to continue to acquire complementary products and services and to enter into distribution agreements for the distribution of other companies’ products. |
| · | Explore Corporate Relationships to Augment our Distribution Capabilities. When we develop versions of our products that are intended to be used by physicians outside of our target market, (such as our Thrombi-Gel and Thrombi-Pad products) and in other situations where we believe synergistic sales can result from an expanded distribution network, we intend to enter into corporate relationships to broaden our products’ reach and increase our revenues without distracting our sales force. |
Sales, Marketing and Distribution
In 2000, we commenced sales of our first product, the Duett sealing device, in the United States through our direct sales organization. As of December 31, 2015, our U.S. direct sales force consisted of 103 employees, all of whom sell our entire line of products and services. We believe that the majority of interventional catheterization procedures in the United States are performed in high volume catheterization laboratories, and that these institutions can be served by our focused direct sales force.
Our international sales and marketing strategy has been to sell to interventional cardiologists and interventional radiologists through established independent distributors in major international markets, subject to required regulatory approvals. As of December 31, 2015, we have agreements with 41 independent distributors that cover 57 countries. We have entered into multi-year written distribution agreements with each of our independent distributors, and we ship our products to these distributors upon receipt of purchase orders. Each of our independent distributors has the exclusive right to sell our products within a defined territory. These distributors also market other medical products, although generally they have agreed not to sell directly competitive products. Our independent distributors purchase our products from us at a discount from list price and resell the device to hospitals and clinics. Sales to international distributors are denominated in United States dollars, with the exception of sales of our Guardian valve product from our subsidiary in Ireland and sales to our German distributor, which are both denominated in Euros. The end-user price is determined by the distributor and varies from country to country.
9
As part of our sales strategy, our direct U.S. sales force and international independent distributors are clinically trained to be able to train physicians and other healthcare personnel on the use of our products and services. We believe that effective training is a key factor in encouraging physicians to use interventional medical devices and services. We have created, and will continue to work to improve, an in-the-field training program for the use of all of our products and services. We also develop and maintain close working relationships with our customers to continue to receive input concerning our product and service development plans.
We are focused on building market awareness and acceptance of our products and services. Our marketing department provides a wide range of programs, materials and events that support our sales force. These include product and service training, conference and trade show appearances and sales literature and promotional materials.
New Product and Service Development
Our growth depends in large part on the continuous introduction of new and innovative products and services, together with ongoing enhancements to our existing products and services, through internal product development, technology licensing and strategic alliances. We recognize the importance of, and intend to continue to make investments in, research and development. We incurred expenses of $18,358,000 in 2015, $13,441,000 in 2014, and $13,191,000 in 2013 for research and development activities, which constituted 12.5%, 11%, and 12%, respectively, of net sales. R&D activities include research, product development and intellectual property development. We expect that our R&D expenditures will be approximately 11.5 to 12.5% of net sales in 2016.
Our research and product development group works closely with our sales force to incorporate customer feedback into our development and design process. We believe that we have a reputation within interventional cardiology and interventional radiology as a good partner for product and service development because of our tradition of close physician collaboration, dedicated market focus, responsiveness and execution capabilities for product and service development and commercialization.
To further leverage our efficiencies, our research and development group continues to develop in-house capabilities to manufacture several components currently produced by outside vendors.
We expect our research and development activities to continue to expand to include evaluation of new concepts, products and services for the interventional cardiology and interventional radiology field. We believe that there are many potential new interventional products and services that would fit within the development, clinical, manufacturing and distribution network we have created for our existing products and services.
Manufacturing
We manufacture our products in our facilities located in the suburbs of Minneapolis, Minnesota and in the country of Ireland. Manufacturing and packaging processes occur in controlled environments and most sterile product manufacturing and packaging processes occur in a certified clean room environment. Our quality system, manufacturing facilities and processes have been certified to be compliant with the European Medical Device Directive 93/42/EEC, EN/ISO 13485:2012, the Canadian Medical Device Regulations SOR/98-282, and they comply with FDA Quality System Regulations.
10
We purchase components from various suppliers and rely on single sources for several parts of our products. We purchase our thrombin (a component in all of the D-Stat products) for use in manufacturing products sold in the U.S. under the Thrombin-JMI® Supply Agreement with King. To date, we have not experienced any significant adverse effects resulting from shortages of components.
The manufacture and sale of our products entails significant risk of product liability claims. Although we have product liability insurance coverage in an amount which we consider reasonable, it may not be adequate to cover potential claims. Any product liability claims asserted against us could result in costly litigation, reduced sales and significant liabilities and divert the attention of our technical and management personnel away from the development and marketing of our products for significant periods of time.
Competition
We encounter significant competition across our product lines and in each market in which our products are sold. These markets are characterized by rapid change resulting from technological advances and scientific discoveries. We face competitors ranging from large manufacturers with multiple business lines to small manufacturers that offer a limited selection of products.
Our primary competitors include: Medtronic plc., Boston Scientific Corporation, Merit Medical Systems, Inc., Marine Polymer Technologies, Inc., Cook Medical Inc., the Abbott Vascular division of Abbott Laboratories, Asahi Intecc Co., Ltd., AngioDynamics, Inc., and Terumo Corporation.
Many of our competitors have substantially greater financial, technological, research and development, regulatory, marketing, sales and personnel resources than we do. Competitors may also have greater experience in developing products, obtaining regulatory approvals, and manufacturing and marketing such products. Additionally, competitors may obtain patent protection or regulatory approval or clearance, or achieve product commercialization before us, any of which could materially adversely affect us. We compete on the basis of our clinically differentiated products and services and focused opportunities within this interventional medical device and service market.
In each of our product and service areas, we believe that several other companies are developing new devices and services. The medical device industry is characterized by rapid and significant technological changes as well as the frequent emergence of new technologies. There are likely to be research and development projects related to these market areas of which we are currently unaware. A new technology, product or service may emerge that results in a reduced need for our products and services or results in a product or service that renders our product or service noncompetitive.
Regulatory Requirements
United States
Our products and services are regulated in the United States as medical devices by the FDA under the Federal Food, Drug and Cosmetic Act. The FDA classifies medical devices and services into one of three classes based upon controls the FDA considers necessary to reasonably ensure their safety and effectiveness. Class I devices are subject to general controls such as labeling, adherence to good manufacturing practices and maintenance of product complaint records, and are usually exempt from premarket notification requirements. Class II devices are subject to the same general controls and also are subject to special controls such as performance standards, require premarket notification (510k clearance) prior to commercialization, and may also require clinical testing prior to clearance. Class III devices are subject to the highest level of controls because they are used in life-sustaining or life-supporting implantable devices. Class III devices require rigorous clinical testing prior to their approval and generally require a premarket approval (PMA) or supplement application prior to commercialization.
11
If a medical device manufacturer can establish that a device is “substantially equivalent” to a legally marketed Class I or Class II device, or to an unclassified device, or to a Class III device for which the FDA has not called for PMAs, the manufacturer may seek clearance from the FDA to market the device by filing a 510(k) premarket notification. The 510(k) notification must be supported by appropriate data establishing the claim of substantial equivalence to the satisfaction of the FDA.
Manufacturers must file an investigational device exemption (IDE) application if human clinical studies of a device are required and if the FDA considers experimental use of the device to represent significant risk to the patient. The IDE application must be supported by data, typically including the results of animal and mechanical testing of the device. If the IDE application is approved by the FDA, human clinical studies may begin at a specific number of investigational sites with a maximum number of patients, as approved by the FDA. The clinical studies must be conducted under the review of an independent institutional review board to ensure the protection of patient rights.
Generally, upon completion of human clinical studies, a manufacturer seeks approval of a Class III medical device from the FDA by submitting a PMA application. A PMA application must be supported by extensive data, including the results of the clinical studies, as well as literature to establish the safety and effectiveness of the device.
Our D-Stat Flowable is classified as both a Class III and Class II device based on the three distinct indications for use that have been assigned to this product.
Our remaining products generally are classified as Class II products and therefore require FDA clearance of a 510(k) notification prior to being sold in the United States. Each of our Class II product lines was initially subject to a 510(k) notification and determined to be “substantially equivalent” to a legally marketed predicate device by the FDA, thereby allowing commercial marketing in the United States. In some instances, we are able to launch a modified product without filing a new 510(k) with the FDA.
We also are subject to FDA regulations concerning manufacturing processes and reporting obligations. These regulations require that manufacturing operations be performed according to FDA standards and in accordance with documentation, control and testing standards. We are subject to inspection by the FDA on an on-going basis. We are required to provide information to the FDA on adverse events and maintain a document and record keeping system in accordance with FDA regulations. The advertising of our products is subject to both FDA and Federal Trade Commission jurisdiction. If the FDA believes that we are not in compliance with any aspect of the law, it can institute proceedings to detain or seize products, issue a recall, stop future violations and assess civil and criminal penalties against us, our officers and our employees.
International
The European Union has adopted rules which require that medical products receive the right to affix the CE mark, an international symbol of adherence to quality standards and compliance with applicable European medical device directives. As part of CE mark certification, manufacturers are required to comply with certain product-essential requirements and quality systems standards. We received CE mark certification for our first product and certification of our quality system in July 1998, and we have subsequently received CE mark certification for other products we distribute in the European Union.
Our hemostatic products contain bovine-derived thrombin and are subject to additional regulatory review within the European Union to minimize the risk of exposure to viral and Bovine Spongiform Encephalopathy (BSE) pathogens. The regulations in this area continue to evolve and our products may be subject to additional regulatory scrutiny in the future.
International sales of our products are subject to the regulatory requirements of each country in which we sell. These requirements vary from country to country, but generally are less stringent than those in the United States. Regulatory approvals are obtained, usually by our distributors, where required to sell our products in those countries.
12
Third Party Reimbursement
In the United States, healthcare providers that purchase medical devices generally rely on third-party payors, principally the Centers for Medicare and Medicaid Services or CMS and private health insurance plans, to reimburse all or part of the cost of catherization procedures. We believe that in the current United States reimbursement system, all of our products are subject to reimbursement rules depending on the specific medical procedure in which they are utilized.
Market acceptance of our products in international markets is dependent in part upon the availability of reimbursement from healthcare payment systems. Reimbursement and healthcare payment systems in international markets vary significantly by country. The main types of healthcare payment systems in international markets are government-sponsored healthcare and private insurance. Countries with government-sponsored healthcare, such as the United Kingdom, have a centralized, nationalized healthcare system. New devices are brought into the system through negotiations between departments at individual hospitals at the time of budgeting. In most foreign countries, there are also private insurance systems that may offer payments for alternative therapies.
Intellectual Property: Patents, Trade Secrets, and Trademarks
We file and prosecute patent applications to protect technological innovations related to new medical devices and improvements on existing medical devices that are significant to the development of our business, and we use trade secrets and trademarks to supplement this protection and protect other areas of our business. We currently own or exclusively license 29 issued U.S. patents and 26 additional U.S. patent applications relating to our GuideLiner catheters, Pronto extraction catheters, Langston dual lumen catheters, Venture catheters, Turnpike® catheters, Replas freeze-dried plasma and multiple other products on the market or in development. We also have obtained issued international patents and are currently pursuing additional international patent applications. Our 29 issued U.S. patents have expiration dates ranging from May 2018 to April 2033.
The interventional medical device market is characterized by frequent and substantial intellectual property litigation. Intellectual property litigation in recent years has proven to be complex and expensive, and the outcome of such litigation is difficult to predict. The interpretation of patents, for example, involves complex and evolving legal and factual questions.
Currently, we are not involved in any patent litigation. We may become the subject of intellectual property litigation in the future related to our products or services. Our defense of any intellectual property litigation claims, regardless of the merits of the complaint, could divert the attention of our technical and/or management personnel away from the development and marketing of our products and services for significant periods of time. The costs incurred to defend these claims could be substantial and adversely affect us, even if we are ultimately successful. Similarly, if we assert any of our intellectual property against a third party, the attention of our technical and/or management personnel may be diverted and substantial costs could be incurred.
We rely on trade secret protection for certain aspects of our technology. We typically require our employees, consultants and vendors for major components to execute confidentiality agreements upon their commencing services with us or before we disclose confidential information to them. These agreements generally provide that all confidential information developed or otherwise made known to the other party, during the course of that party’s relationship with us, is to be kept confidential and not disclosed to third parties, except in special circumstances. The agreements with our employees also provide that all inventions conceived or developed in the course of providing services to us shall be our exclusive property.
13
We register trademarks for certain products in the United States and use unregistered trademarks for other products. We current own 33 active U.S. registered trademarks and 25 unregistered trademarks. United States trademark registrations are generally for a term of 10 years, renewable every 10 years as long as the trademark is used in the regular course of business.
We also use certain third party trademarks in association with products or services that we sell. “ClosureFAST” is a registered trademark of Covidien LP. “OptiSeal” is a registered trademark of Greatbatch Ltd. “PolarCath” is a trademark of NuCryo Vascular LLC. “VeinSite” is a registered trademark of VueTek Scientific LLC. “Xtend” is a trademark of All of It Scandinavia AB. “ZigiWire” is a trademark of Vadiswire Corp.
Employees
As of December 31, 2015, we had 568 full-time employees. Of these employees, 259 were in manufacturing activities, 150 were in sales and marketing activities, 38 were in regulatory, quality assurance and clinical research activities, 77 were in research and development activities, and 44 were in general and administrative functions. We have never had a work stoppage and none of our employees are covered by collective bargaining agreements. We believe our employee relations are good. We are an Equal Opportunity Employer.
Executive Officers of the Registrant
Our executive officers as of January 22, 2016 are as follows:
|
Name
|
Age
|
Position
|
|
Howard Root
|
55
|
Chief Executive Officer and Director
|
|
James Hennen
|
43
|
Chief Financial Officer and Senior Vice President of Finance
|
|
Brent Binkowski
|
47
|
Senior Vice President of Operations
|
|
Chad Kugler
|
44
|
Senior Vice President of Research and Development
|
|
Carrie Powers
|
41
|
Senior Vice President of Marketing
|
|
William Rutstein
|
63
|
Senior Vice President of International Sales
|
|
Charmaine Sutton
|
56
|
Senior Vice President, Regulatory & Quality Assurance
|
Howard Root has served as Chief Executive Officer and a member of our Board of Directors since he co-founded Vascular Solutions in February 1997. From 1990 to 1995, Mr. Root was employed by ATS Medical, Inc., a mechanical heart valve company, most recently as Vice President and General Counsel. Prior to joining ATS Medical, Mr. Root practiced corporate law, specializing in representing emerging growth companies, at the law firm of Dorsey & Whitney LLP for over five years.
James Hennen has served as our Chief Financial Officer since January 2004. Mr. Hennen served as our Controller & Director of Finance from February 2002 through December 2003. Prior to joining us, Mr. Hennen served in various accounting positions, most recently as International Controller with WAM!NET, Inc., a globally networked information technology company for media transfer, where he worked from December 1997 through February 2002. From October 1995 through December 1997, Mr. Hennen was an auditor for Ernst & Young, LLP. Mr. Hennen is a Certified Public Accountant (inactive).
Brent Binkowski has served as our Senior Vice President of Operations since June 2015. Prior to joining us, Mr. Binkowski served as Vice President of Operations for CeloNova BioSciences, Inc., a medical device company focused on embolization and vascular devices, from February 2013 to June 2015. Mr. Binkowski was employed by American Medical Systems, a medical device company focused principally on the urology market, since 2003, serving as Senior Director of Operations from January 2011 to February 2013, and Value Stream Director from February 2008 to January 2011.
Chad Kugler has served as our Senior Vice President of Research and Development since March 2014. Prior to joining us, he was the Co-Founder, President and General Manager of BridgePoint Medical, a company that developed a proprietary, catheter-based system to treat coronary chronic total occlusions, from 2005 until its acquisition by Boston Scientific in 2012. From 2003 to 2005 Mr. Kugler was part of the founding team at Torax Medical, which developed a treatment for acid reflux disease. From 1997 to 2001 Mr. Kugler was the Director of Research and Development at Teramed, an aortic endovascular graft company acquired by Cordis in 2001. Mr. Kugler began his career as an engineer with SCIMED/Boston Scientific in 1992.
14
Carrie Powers has served as our Senior Vice President of Marketing since January 2016. Ms. Powers previously served as our Vice President of Marketing from July 2009 to December 2015, Senior Director of Product Management and Training from July 2008 to June 2009, Director of Training from March 2007 to July 2008, Product Manager for the Hemostasis Product Line from July 2006 to March 2007 and began her employment with us as an Associate Product Manager for the Hemostasis Product Line from January 2006 to July 2006. Prior to joining us, Ms. Powers was employed by St. Mary’s Hospital in Madison, Wisconsin from 2002 to 2006, most recently as a Registered Nurse in the Interventional Cardiac Catheterization Lab.
William Rutstein has served as our Senior Vice President of International Sales since January 2015. Mr. Rutstein previously served as our Senior Vice President of Worldwide Sales from July 2010 to January 2015, Vice President of International Sales from October 2008 to July 2010, Senior Director of International Sales from January 2008 to October 2008, and Director of International Sales upon joining Vascular Solutions in August 1999 until January 2008. Prior to joining us, Mr. Rutstein was the Business Unit Director for the cardiosurgery division of Minntech Corporation, a medical device company, from April 1997 to July 1999. From November 1988 to March 1997, Mr. Rutstein worked for Daig Corporation (a St. Jude Medical Company), a medical device company specializing in cardiology and electrophysiology catheters, where he served as Regional Sales Manager, National Sales Manager, OEM Sales Manager and International Sales Manager.
Charmaine Sutton has served as our Senior Vice President, Regulatory & Quality Assurance since August 2015. Ms. Sutton served as our Senior Vice President of Operations from March 2010 to August 2015. Ms. Sutton previously served on our Board of Directors from July 2007 to March 2010. From 1991 to 2011, Ms. Sutton was principal consultant and co-founder of The Tamarack Group, an association of consultants assisting developers and manufacturers of medical devices, diagnostics, pharmaceuticals, biologics and combination products with regulatory and quality system activities. Prior to co-founding The Tamarack Group, Ms. Sutton held Director and VP level Engineering, Regulatory, Quality and Clinical positions in start-up companies, and was a research scientist in the laser fusion program at Lawrence Livermore National Laboratory. From 2006 to 2011 Ms. Sutton was an adjunct instructor for the Regulatory Affairs and Services graduate program at St. Cloud State University.
Available Information
We make available free of charge on or through our website at www.vasc.com our Annual Reports on Form 10-K, quarterly reports on Form 10-Q, current reports on Form 8-K, required Interactive Data files and amendments to these reports filed or furnished pursuant to Section 13(a) or 15(d) of the Securities Exchange Act of 1934 as soon as reasonably practicable after we electronically file such material with, or furnish it to, the Securities and Exchange Commission.
ITEM 1A. RISK FACTORS
The risks and uncertainties described below are not the only ones facing our company. Additional risks and uncertainties not presently known to us or that we currently deem immaterial may also impair our business operations. If any of the following risks occur, our business, financial condition or results of operations could be seriously harmed.
15
We will not be successful if the interventional medical device community does not adopt our new products or services.
We have launched over 100 new products or services since our inception. Our success will depend on the continued launch of new products and services and the medical community’s acceptance of our new products and services. We cannot predict how quickly, if at all, the medical community will accept our new products and services, or, if accepted, the continuation or extent of their use. Our potential customers must:
| · | believe that our products or services offer benefits compared to the methodologies and/or devices that they are currently using; |
| · | use our products or services and obtain acceptable clinical outcomes; |
| · | believe that our products or services are worth the price that they will be asked to pay; and |
| · | be willing to commit the time and resources required to change their current methodology. |
Because we are often selling a new technology, we have limited ability to predict the level of growth or timing of sales of these products or services. If we encounter difficulties in growing our sales of our new medical devices or services, our business will be seriously harmed.
We and our Chief Executive Officer are defendants in a criminal indictment that could result in a substantial disruption to our business.
The products and business activities of medical device companies are subject to rigorous regulation by the FDA and other federal, state and international governmental authorities under statutes and regulations governing health care fraud. The U.S. Attorney’s Offices have increased their scrutiny over the medical device industry in recent years. The U.S. Congress, Department of Justice, Office of Inspector General of the Department of Health and Human Services, and Department of Defense have all issued subpoenas and other requests for information to conduct investigations of, and commenced civil and criminal litigation against, medical device manufacturers, primarily related to financial arrangements with health care providers, regulatory compliance and product promotional practices.
During 2012, the U.S. Attorney’s Office for the Western District of Texas intervened in a qui tam civil lawsuit initiated against us involving allegations of off-label promotion of our Vari-Lase Short Kit endovenous laser product (see Item 3 – Legal Proceedings: Government Litigation of Part I of this Annual Report on Form 10-K for the year ended December 31, 2015). Subsequently, we learned that the U.S. Attorney’s Office also had commenced a criminal investigation of the same matter. On January 22, 2014, we agreed with the U.S. Attorney’s Office to settle the civil lawsuit, and the settlement agreement was executed on July 28, 2014. Under the terms of the settlement agreement, we made a payment of $520,000, we made no admission of fault or liability, and the U.S. Attorney’s Office dismissed the civil lawsuit with prejudice and released all civil claims brought against us in the civil lawsuit.
Settlement of the civil lawsuit had no effect upon the criminal investigation, and on November 13, 2014, the U.S. Department of Justice filed a criminal indictment in the United States District Court for the Western District of Texas related to the Vari-Lase Short Kit investigation. The original indictment alleged that we and our Chief Executive Officer introduced adulterated and misbranded medical devices into interstate commerce and conspired to introduce adulterated and misbranded medical devices into interstate commerce through the alleged off-label promotion of the Vari-Lase Short Kit product. On December 2, 2015, a superseding indictment was issued that removed the allegations related to introducing adulterated medical devices. We believe the remaining allegations are false and are contesting them vigorously.
16
A trial on the indictment is scheduled to commence on February 1, 2016 in San Antonio, Texas. Continuing to defend ourselves against the indictment entails costs that are material and requires significant attention from our management. If we were to be convicted of the crimes alleged in the indictment, remedies could include fines, penalties, forfeitures and compliance conditions. We cannot estimate the amount or range of loss if we were to be convicted; however, it would likely be material. If we were to be convicted of a crime related to the delivery of an item or service under Title XVIII of the Social Security Act, or a felony related to health care fraud, we would become automatically excluded by the Department of Health and Human Services (“HHS”) from participation in U.S. government health care programs, including Medicare and Medicaid. If we were to be convicted of a misdemeanor related to health care fraud, we could be immediately excluded by HHS from participation in U.S. government health care programs, including Medicare and Medicaid. Exclusion from participation in U.S. government health care programs would substantially prevent us from continuing to sell our products in the U.S., and thereby would seriously damage our business. Conviction of our Chief Executive Officer of a crime under statutes related to misbranding and health care fraud could require the termination of his employment with us. The consequences of the current criminal litigation, as well as consequences of any future governmental investigation or lawsuit of any related or unrelated matter, could have a material adverse effect on our business, results of operations and stock price.
We may become subject to shareholder litigation, which could divert the attention of management from the day-to-day operation of our business or result in us incurring substantial costs and liabilities.
Following the announcement on November 13, 2014 of the criminal indictment of Vascular Solutions and our Chief Executive Officer, several law firms publicly stated that they were conducting investigations of us or our officers and directors for potential securities law and shareholder derivative action lawsuits. Such investigations often result in litigation. Although no securities law or shareholder derivative action lawsuit has been filed against the Company to date, such a lawsuit may be filed in the future. If securities or shareholder derivative litigation were to be commenced against us, our defense of such litigation could divert the attention of management from the day-to-day operation of our business or result in us incurring substantial costs and liabilities, irrespective of the merits of the litigation.
We may face intellectual property litigation, which could prevent us from manufacturing and selling our products or services or result in us incurring substantial costs and liabilities.
The interventional medical device industry is characterized by numerous patent filings. As a result, participants in the industry frequently experience substantial intellectual property litigation. While we are not currently involved in any intellectual property litigation, in the recent past we have been involved in litigation concerning multiple products.
Some companies in the interventional medical device industry have employed intellectual property litigation in an attempt to gain a competitive advantage. In addition, non-practicing patent assertion entities have accumulated patent rights related to the medical device industry and are asserting them against operating companies in attempt to collect settlements or licensing fees. Intellectual property litigation has proven to be very complex, and the outcome of such litigation is difficult to predict. While we do not believe that any of our products or services infringe any existing patent or other intellectual property right, we previously have been involved in substantial intellectual property litigation and expect to continue to become subject to intellectual property claims with respect to our new or existing products or services.
An adverse determination in any intellectual property litigation or interference proceedings against us could prohibit us from selling a product or service, subject us to significant immediate payments to third parties and require us to seek licenses from third parties. The costs associated with these license arrangements may be substantial and could include substantial up-front payments and ongoing royalties. Furthermore, the necessary licenses may not be available to us on satisfactory terms, if at all. Adverse determinations in a judicial or administrative proceeding or failure to obtain necessary licenses could prevent us from manufacturing and selling a product or service.
Our involvement in any future intellectual property claims, regardless of the merits of any asserted claim against us, could divert the attention of our technical and management personnel away from the development and marketing of our products and services for significant periods of time. Furthermore, the penalties involved with an adverse outcome may be severe, and the costs incurred related to defending such claims could have a material adverse effect on our results of operations or financial condition, even if we ultimately prevail in them.
17
Our future operating results are difficult to predict and may vary significantly from quarter to quarter, which may adversely affect the price of our common stock.
The ongoing introduction of new products and services that affect our overall product mix make the prediction of future operating results difficult. You should not rely on our past revenue growth as any indication of future growth rates or operating results. The price of our common stock will likely fall in the event that our operating results do not meet the expectations of analysts and investors. Comparisons of our operating results between quarters are an unreliable indication of our future performance because they are likely to vary significantly based on many factors, including:
| · | the level of sales of our products and services in our markets; |
| · | our ability to introduce new products or services and enhancements in a timely manner; |
| · | the demand for, and acceptance of, our products and services; |
| · | the success of our competition and the introduction of alternative products or services; |
| · | our ability to command favorable pricing for our products and services; |
| · | the growth of the market for our products and services; |
| · | the expansion and rate of success of our direct sales force in the United States and our independent distributors internationally; |
| · | actions relating to ongoing FDA compliance; |
| · | the effects of intellectual property disputes; |
| · | the effects of government investigations and litigation; |
| · | the size and timing of orders from independent distributors or customers; |
| · | the attraction and retention of key personnel, particularly in sales and marketing, regulatory, manufacturing and research and development; |
| · | unanticipated delays or an inability to control costs; |
| · | general economic conditions, as well as those specific to our customers and markets; and |
| · | seasonal fluctuations in revenue due to the elective nature of some procedures. |
We may face product liability claims that could result in costly litigation and significant liabilities.
The manufacture and sale of medical products entails significant risk of product liability claims. Any product liability claims, with or without merit, could result in costly litigation, reduced sales, cause us to incur significant liabilities and divert our management’s time, attention and resources. We cannot be sure that our product liability insurance coverage is adequate or that it will continue to be available to us on acceptable terms, if at all.
18
The market for interventional medical devices and services is highly competitive and will likely become more competitive, and our competitors may be able to respond more quickly to new or emerging technologies and changes in customer requirements that may render our products or services obsolete.
The existing market for interventional medical devices and services is intensely competitive. We expect competition to increase further as companies develop new products and services or modify their existing products and services to compete directly with ours. Each of our products and services encounters competition from several medical device companies, including Medtronic plc., Boston Scientific Corporation, Terumo Corporation, and Cook Medical Inc., the Abbott Vascular division of Abbott Laboratories, and Asahi Intecc Co., Ltd. Each of these companies has:
| · | better name recognition; |
| · | broader product lines; |
| · | greater sales, marketing and distribution capabilities; |
| · | significantly greater financial resources; |
| · | larger research and development staffs and facilities; and |
| · | existing relationships with some of our potential customers. |
We may not be able to effectively compete with these companies. In addition, broad product lines may allow our competitors to negotiate exclusive, long-term supply contracts and offer comprehensive pricing for their products or services. Broader product lines may also provide our competitors with a significant advantage in marketing competing products or services to group purchasing organizations and other managed care organizations that are increasingly seeking to reduce costs through centralized purchasing. Greater financial resources and product development capabilities may allow our competitors to respond more quickly to new or emerging technologies and changes in customer requirements that may render our products or services obsolete.
We rely on continued development and improvement of our products and service, which if not successful, may have an adverse effect on our financial condition and results of operations.
We are continually engaged in developing new products and services and improving our existing products and services. New or improved products and services represent a significant component of our sales growth. We dedicate significant financial and managerial resources to product and services development and improvement. We may not achieve our development objectives within our schedule and budget, or at all, due to technical or operational challenges. Failure to achieve our development objectives on schedule may increase our development expenses and adversely impact our revenues. If we do achieve our development objectives, we may not be able to obtain regulatory approval for new or improved products or services, and we may not be successful in marketing and selling such products or services. Failure to obtain regulatory approval or successfully market and sell new or improved products and services could adversely impact our revenues and results of operations.
Constraints or interruption in production from any of our key suppliers may have a material adverse effect on our business, financial condition and results of operations.
In the interest of operational efficiency and due to quality considerations, we obtain some of the components for the products that we manufacture from a sole source. If the availability of components from a sole source of supply is constrained or interrupted, there is no assurance that we could find an alternative source of supply quickly and cost effectively, if at all. In addition, due to the stringent regulations and requirements of the FDA and equivalent regulatory entities regarding the manufacture of our products, we may not be able to quickly establish additional or replacement sources for some components or materials. Unavailability of components could have a material adverse effect on our ability to manufacture and sell products and our results of operations.
19
We also distribute finished products that are available only from their manufacturer. In addition, the reprocessing services that we offer are performed by a single provider. Operational, quality or regulatory issues of the manufacturers of the products we distribute, or the provider of our reprocessing services, could constrain or interrupt the availability of those products or services. Any constraint or interruption in supply of finished products that we distribute, or the reprocessing services that we offer, could have a material adverse effect on our ability to sell products and services to customers, our financial condition and our results of operations.
Our international sales are subject to a number of risks that could seriously harm our ability to successfully commercialize our products and services in any international market.
Our international sales are subject to several risks, including:
| · | the ability of our independent distributors to sell our products and services; |
| · | the impact of recessions in economies outside the United States; |
| · | greater difficulty in collecting accounts receivable and longer collection periods; |
| · | unexpected changes in regulatory requirements, tariffs or other trade barriers; |
| · | potential exposure to legal liabilities under the Foreign Corrupt Practices Act and other anticorruption laws for the action of our international business associates; |
| · | weaker intellectual property rights protection in some countries; |
| · | potentially adverse tax consequences; and |
| · | political and economic instability. |
The occurrence of any of these events could seriously harm our future international sales and our ability to successfully commercialize our products and services in any international market.
We depend on information technology and communications systems to operate our business and unauthorized access to, or breaches or other failures of, these systems could have a material adverse effect on our business.
We rely on information technology systems to process, transmit and store electronic information in our day-to-day operations and for communication with our direct domestic sales force. Our information technology systems require an ongoing commitment of significant resources to maintain and protect the integrity and confidentiality of our proprietary data. Third-party cyber-attacks are becoming more sophisticated and frequent. Any successful cyber-attack against us could result in the theft of intellectual property, misappropriation of employee or customer information or of our other assets, and disruption of our communication with our direct domestic sales force, or otherwise compromise our confidential or proprietary information and disrupt our operations. If we fail to maintain or protect our information technology systems and data integrity effectively or fail to anticipate, plan for or manage significant disruptions to these systems, we could be subject to increases in operating expenses, incur expenses or lose revenues as a result of a data privacy breach or theft of intellectual property, lose existing customers, have difficulty preventing, detecting, and controlling fraud, be subject to regulatory sanctions or penalties, or suffer other adverse consequences, any of which could have a material adverse effect on our business, results of operations, financial condition and cash flows.
20
Our business and results of operations may be seriously harmed by changes in third-party reimbursement policies and healthcare industry cost-containment measures.
We could be seriously harmed by changes in reimbursement policies of governmental or private healthcare payors, particularly to the extent any changes affect reimbursement for catheterization procedures in which our products or services are used. Failure by physicians, hospitals and other users of our products or services to obtain sufficient reimbursement from healthcare payors for procedures in which our products or services are used, or adverse changes in governmental and private third-party payors’ policies toward reimbursement for such procedures, would seriously harm our business.
In the United States, healthcare providers, including hospitals and clinics that purchase medical devices or services such as our products and services, generally rely on third-party payors, principally federal Medicare, state Medicaid and private health insurance plans, to reimburse all or part of the cost of catheterization procedures. Any changes in this reimbursement system could seriously harm our business.
In an effort to reduce costs, many existing and potential customers for our products in the United States have become members of group purchasing organization (GPOs) and integrated delivery networks (IDNs). GPOs and IDNs negotiate pricing arrangements with medical device manufacturers and offer the negotiated prices to affiliated hospitals and other members. GPOs and IDNs typically award contracts on a category-by-category basis through a competitive bidding process. Bids generally are solicited from multiple manufacturers with the intention of driving down pricing. The increasing leverage of organized buying groups may reduce market prices for our products, thereby reducing our profitability.
In international markets, acceptance of our products and services is dependent in part upon the availability of reimbursement within prevailing healthcare payment systems. Reimbursement and healthcare payment systems in international markets vary significantly by country. Our failure to receive international reimbursement approvals could have a negative impact on market acceptance of our products and services in the markets in which these approvals are sought.
Our products and services and our manufacturing activities are subject to extensive governmental regulation that could prevent us from selling our products or services in the United States or introducing new and improved products or services.
Our products and services and our manufacturing activities are subject to extensive regulation by a number of governmental agencies, including the FDA and comparable international agencies. We are required to:
| · | obtain the clearance of the FDA and international agencies before we can market and sell our products and services; |
| · | satisfy these agencies’ content requirements for all of our labeling, sales and promotional materials; and |
| · | undergo rigorous inspections by these agencies. |
Compliance with the regulations of these agencies may delay or prevent us from introducing any new model of our existing products or other new products or services. Furthermore, we may be subject to sanctions, including temporary or permanent suspension of operations, product recalls and marketing restrictions if we fail to comply with the laws and regulations pertaining to our business.
We are also required to demonstrate compliance with the FDA’s quality system regulations. The FDA enforces its quality system regulations through pre-approval and periodic post-approval inspections. These regulations relate to product testing, vendor qualification, design control and quality assurance, as well as the maintenance of records and documentation. If we are unable to conform to these regulations, the FDA may take actions which could seriously harm our business. In addition, government regulation may be established that could prevent, delay, modify or rescind regulatory clearance or approval of our products or services.
Our industry is experiencing greater scrutiny and regulation by governmental authorities, which may have an adverse impact on our business.
Our products and business activities are subject to rigorous regulation, including by the U.S. FDA, Department of Justice, and numerous other federal, state, and foreign governmental authorities. These authorities have been increasing scrutiny of our industry and enforcement actions related to companies in it. In addition, certain state governments and the federal government have enacted legislation that requires disclosure of certain of our interactions with health care providers. As a result, we are required by law to disclose payments and other transfers of value to health care providers licensed by certain states and to all U.S. physicians and U.S. teaching hospitals at the federal level. Any failure to comply with these legal and regulatory requirements could impact our business. In addition, we may continue to devote substantial additional time and financial resources to further develop and implement policies, systems, and processes to comply with enhanced legal and regulatory requirements, which may also impact our business. We anticipate that governmental authorities will continue to scrutinize our industry closely, and that additional regulation may increase compliance and legal costs, exposure to litigation, and other adverse effects to our operations.
21
ITEM 1B. UNRESOLVED STAFF COMMENTS
None.
ITEM 2. PROPERTIES
We conduct our operations principally in four facilities, three of which are owned by us and one of which is leased. The three facilities that we own are an office building and two adjacent manufacturing facilities, in Maple Grove, a suburb of Minneapolis, Minnesota.
| · | In November 2012, we purchased an office building and currently occupy approximately 24,000 square feet of the office building as general office space and approximately 26,000 square feet as research and development space. The remaining 26,000 square feet of the office building is under lease to third-party tenants. |
| · | In December 2014, we purchased our primary manufacturing facility, consisting of 79,000 square feet, and began to renovate it during 2015. We expect to complete the renovations to this facility in 2016. |
| · | In March 2015, we purchased a manufacturing and office building of approximately 26,000 square feet located adjacent to our primary manufacturing facility. We began renovating this facility for our manufacturing use in 2015 and expect to complete the renovations in 2016. |
| · | Our principal warehouse facility is a 32,000 square foot facility that we lease in suburban Minneapolis, Minnesota. The lease for this facility expires in October 2020. |
In addition to the four facilities listed above, we also lease a 26,000 square foot warehouse facility in suburban Minneapolis, Minnesota. The lease for this facility expires on December 31, 2016, and we do not intend to renew it.
We lease 5,000 square feet in Galway, Ireland for our Irish subsidiary.
ITEM 3. LEGAL PROCEEDINGS
Governmental Litigation
On June 28, 2011, we received a subpoena from the U.S. Attorney’s Office for the Western District of Texas under the Health Insurance Portability & Accountability Act of 1996 (HIPAA) requesting the production of documents related to Vari-Lase products, and in particular the use of the Vari-Lase Short Kit for the treatment of perforator veins. Subsequently, we learned that the U.S. Attorney’s Office also had commenced a criminal investigation of the same matter. The Vari-Lase Short Kit was sold under a 510(k) clearance for the treatment of incompetence and reflux of superficial veins in the lower extremity from 2007 until we voluntarily withdrew the product from the market in July 2014, with total U.S. sales of approximately $534,000 (0.1% of our total U.S. sales for such period). The Vari-Lase Short Kit has not been the subject of any reported serious adverse clinical event. On August 14, 2012, the United States District Court for the Western District of Texas unsealed a qui tam complaint that had been filed on November 19, 2010 by Desalle Bui, a former sales employee of Vascular Solutions, which was the basis for the U.S. Attorney’s civil investigation, to which the federal government, after three extensions of time, elected to intervene. The complaint contained allegations of off-label promotion of Vari-Lase products for the treatment of perforator veins, re-use of single-use Vari-Lase products and kickbacks to physicians, resulting in alleged damages to the government of approximately $20 million. An amended complaint limited to allegations of off-label promotion of the Vari-Lase Short Kit resulting in an unspecified amount of damages and penalties was filed by the U.S. Attorney’s Office in December 2012. On January 22, 2014, we agreed with the U.S. Attorney’s Office to settle the civil lawsuit, and the settlement agreement was executed on July 28, 2014. Under the terms of the settlement agreement, we made a payment of $520,000, we made no admission of fault or liability, and the U.S. Attorney’s Office dismissed the civil lawsuit with prejudice and released all civil claims brought against us in the civil lawsuit. Settlement of the civil lawsuit had no effect upon the criminal investigation.
22
On November 13, 2014, a criminal indictment was issued in the United States District Court for the Western District of Texas related to the Vari-Lase Short Kit investigation. The original indictment alleged that we and our Chief Executive Officer introduced adulterated and misbranded medical devices into interstate commerce and conspired to introduce adulterated and misbranded medical devices into interstate commerce through the alleged off-label promotion of the Vari-Lase Short Kit. On December 2, 2015, a superseding indictment was issued that removed the allegations related to introducing adulterated medical devices. We believe the remaining allegations are false and are contesting them vigorously.
A trial on the indictment is scheduled to commence on February 1, 2016 in San Antonio, Texas. Continuing to defend ourselves against the indictment will entail costs that are expected to be material and will require significant attention from our management. If we were to be convicted of the crimes alleged in the indictment, remedies could include fines, penalties, forfeitures and compliance conditions. We cannot estimate the amount or range of loss if we were to be convicted; however, it would likely be material. If we were to be convicted of a crime related to the delivery of an item or service under Title XVIII of the Social Security Act, or a felony related to health care fraud, we would become automatically excluded by the Department of Health and Human Services (“HHS”) from participation in U.S. government health care programs, including Medicare and Medicaid. If we were to be convicted of a misdemeanor related to health care fraud, we could be immediately excluded by HHS from participation in U.S. government health care programs, including Medicare and Medicaid. Exclusion from participation in U.S. government health care programs would prevent us from continuing to sell our products in the U.S., and thereby would seriously damage our business. Conviction of our Chief Executive Officer of a crime under statutes related to misbranding and health care fraud could require the termination of his employment with us.
From time to time we are involved in legal proceedings arising in the normal course of our business. As of the date of this report we are not a party to any legal proceedings not described in this section in which an adverse outcome would reasonably be expected to have a material adverse effect on our results of operations or financial condition.
ITEM 4. MINE SAFETY DISCLOSURES
Not applicable.
23
PART II
ITEM 5. MARKET FOR REGISTRANT’S COMMON EQUITY, RELATED STOCKHOLDER
MATTERS AND ISSUER PURCHASES OF EQUITY SECURITIES
Our common stock is traded on the NASDAQ Global Select Market under the symbol “VASC”. The following table sets forth, for the periods indicated, the high and low sales prices for our common stock as reported by the NASDAQ Global Select Market.
|
High
|
Low
|
|||||||
|
2015
|
||||||||
|
First Quarter
|
$
|
31.74
|
$
|
25.41
|
||||
|
Second Quarter
|
35.98
|
29.08
|
||||||
|
Third Quarter
|
40.33
|
31.26
|
||||||
|
Fourth Quarter
|
37.50
|
31.33
|
||||||
|
2014
|
||||||||
|
First Quarter
|
$
|
28.21
|
$
|
21.05
|
||||
|
Second Quarter
|
27.00
|
18.42
|
||||||
|
Third Quarter
|
25.82
|
21.15
|
||||||
|
Fourth Quarter
|
30.96
|
22.92
|
||||||
Purchases of Equity Securities by the Issuer and Affiliated Purchasers
The following table provides information about the shares repurchased through December 31, 2015:
|
Date
|
Total Number of Shares Purchased(1)
|
Average Price Paid per Share
|
Total Number of Shares Purchased as Part of Publicly Announced Plans or Programs
|
Maximum Value of Shares that May Yet be Purchased Under the Plans or Programs(2)
|
||||||||||||
|
October 1 – 31, 2015
|
851
|
$
|
33.25
|
–
|
$
|
19,181,029
|
||||||||||
|
November 1 – 30, 2015
|
–
|
–
|
–
|
$
|
19,181,029
|
|||||||||||
|
December 1 – 31, 2015
|
–
|
–
|
–
|
$
|
19,181,029
|
|||||||||||
|
Total
|
851
|
$
|
33.25
|
–
|
$
|
19,181,029
|
||||||||||
(1) In October 2015, at the election of award recipients and pursuant to the terms of their Stock Option and Restricted Stock Awards and the Stock Option and Stock Award Plan, we purchased 851 shares of common stock issued pursuant to such awards at the fair market value of the common stock on the day of vesting to satisfy income tax withholding obligations of the award recipients.
(2) On November 13, 2014, we announced that our Board of Directors had approved a common stock repurchase plan, under which we may repurchase up to $20 million of our common stock on the open market at market prices through September 30, 2016.
Holders
As of December 31, 2015, we had 483 shareholders of record. Such number of record holders does not reflect shareholders who beneficially own common stock held in nominee or street name.
Dividends
We have paid no cash dividends on our common stock, and do not intend to pay cash dividends on our common stock in the foreseeable future.
24
Performance Graph
The following graph shows a comparison of cumulative total returns for our common stock, the NASDAQ U.S. Benchmark TR Index and the NASDAQ OMX Medical Supplies Index, assuming the investment of $100 in our common stock and each index on December 31, 2010 and the reinvestment of dividends, if any.
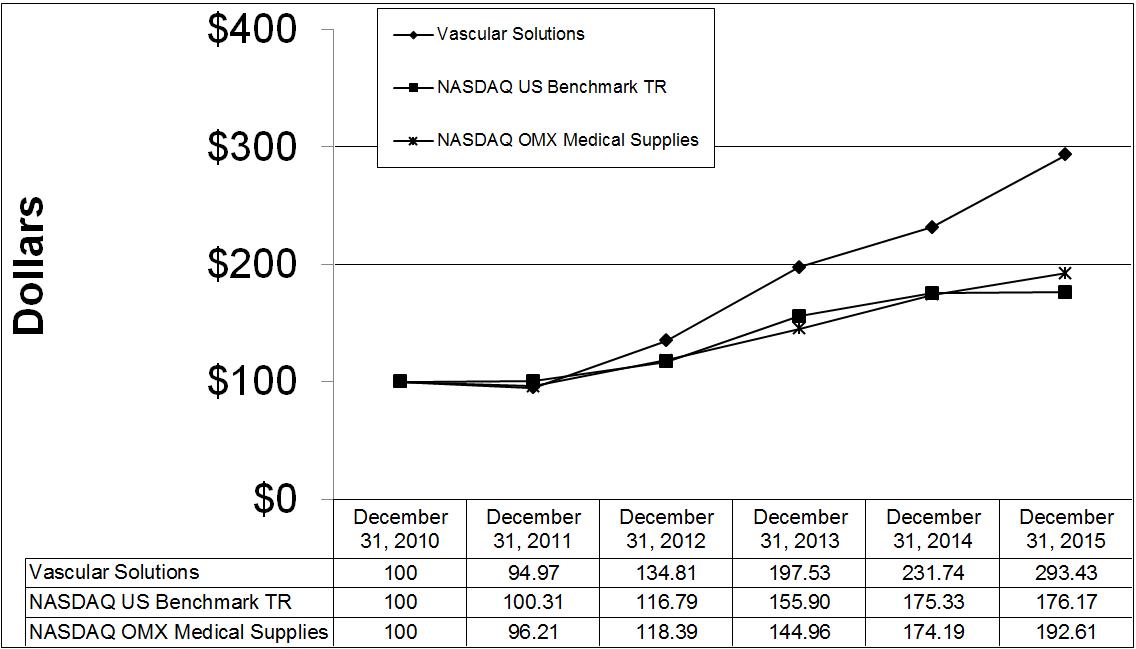
25
ITEM 6. SELECTED FINANCIAL DATA
The following selected financial data as of December 31, 2015 and 2014 and for the three years ended December 31, 2015, 2014 and 2013 are derived from, and should be read together with, our consolidated financial statements included elsewhere in this Form 10-K. The following selected financial data as of December 31, 2013, 2012 and 2011 and for the fiscal years ended December 31, 2012 and 2011 are derived from consolidated financial statements not included herein. The information set forth below should be read in conjunction with “Management’s Discussion and Analysis of Financial Condition and Results of Operations,” the Consolidated Financial Statements and Notes thereto and other financial information included elsewhere in this Form 10-K.
|
Year Ended December 31,
|
||||||||||||||||||||
|
2015
|
2014
|
2013
|
2012
|
2011
|
||||||||||||||||
|
(in thousands, except per share amounts)
|
||||||||||||||||||||
|
Statements of Operations Data:
|
||||||||||||||||||||
|
Net revenue:
|
||||||||||||||||||||
|
Product revenue
|
$
|
146,616
|
$
|
125,666
|
$
|
110,197
|
$
|
98,036
|
$
|
86,589
|
||||||||||
|
License, royalty and collaboration revenue
|
584
|
433
|
301
|
350
|
3,367
|
|||||||||||||||
|
Total net revenue
|
147,200
|
126,099
|
110,498
|
98,386
|
89,956
|
|||||||||||||||
|
Product costs and operating expenses:
|
||||||||||||||||||||
|
Cost of goods sold
|
48,903
|
41,699
|
36,156
|
32,561
|
29,844
|
|||||||||||||||
|
Collaboration expenses
|
141
|
165
|
60
|
-
|
-
|
|||||||||||||||
|
Research and development
|
18,358
|
13,441
|
13,191
|
11,870
|
10,240
|
|||||||||||||||
|
Clinical and regulatory
|
6,323
|
4,979
|
4,408
|
4,358
|
4,332
|
|||||||||||||||
|
Sales and marketing
|
34,085
|
29,825
|
27,372
|
25,777
|
24,126
|
|||||||||||||||
|
General and administrative
|
22,583
|
12,986
|
8,991
|
6,522
|
4,997
|
|||||||||||||||
|
Litigation settlement
|
-
|
-
|
1,332
|
-
|
-
|
|||||||||||||||
|
Medical device excise tax
|
1,593
|
1,435
|
1,319
|
-
|
-
|
|||||||||||||||
|
Amortization of purchased technology and intangibles
|
1,615
|
1,642
|
1,572
|
1,393
|
831
|
|||||||||||||||
|
Total product costs and operating expenses
|
133,601
|
106,172
|
94,401
|
82,481
|
74,370
|
|||||||||||||||
|
Operating earnings
|
13,599
|
19,927
|
16,097
|
15,905
|
15,586
|
|||||||||||||||
|
Other earnings (expenses)
|
42
|
(15
|
)
|
(14
|
)
|
(13
|
)
|
113
|
||||||||||||
|
Earnings before income taxes
|
13,641
|
19,912
|
16,083
|
15,892
|
15,699
|
|||||||||||||||
|
Income tax expense
|
(3,177
|
)
|
(7,178
|
)
|
(4,941
|
)
|
(5,983
|
)
|
(5,960
|
)
|
||||||||||
|
Net earnings
|
$
|
10,464
|
$
|
12,734
|
$
|
11,142
|
$
|
9,909
|
$
|
9,739
|
||||||||||
|
Net earnings per common share – Basic
|
$
|
0.61
|
$
|
0.75
|
$
|
0.68
|
$
|
0.62
|
$
|
0.59
|
||||||||||
|
Net earnings per common share – Diluted
|
$
|
0.58
|
$
|
0.72
|
$
|
0.65
|
$
|
0.60
|
$
|
0.57
|
||||||||||
|
Weighted average number of basic common shares outstanding
|
17,104
|
16,892
|
16,412
|
16,004
|
16,638
|
|||||||||||||||
|
Weighted average number of diluted common shares
|
18,048
|
17,711
|
17,025
|
16,456
|
17,184
|
|||||||||||||||
26
|
As of December 31,
|
||||||||||||||||||||
|
2015
|
2014
|
2013
|
2012
|
2011
|
||||||||||||||||
|
(in thousands)
|
||||||||||||||||||||
|
Balance Sheet Data:
|
||||||||||||||||||||
|
Cash, cash equivalents and available-for-sale securities
|
$
|
41,491
|
$
|
36,461
|
$
|
30,785
|
$
|
11,554
|
$
|
13,726
|
||||||||||
|
Working capital
|
70,421
|
61,682
|
(1)
|
56,355
|
38,016
|
38,650
|
||||||||||||||
|
Total assets
|
144,873
|
126,607
|
(1)
|
108,141
|
88,002
|
76,483
|
||||||||||||||
|
Total shareholders’ equity
|
128,144
|
113,340
|
96,350
|
76,867
|
66,706
|
|||||||||||||||
| (1) | The impact of the prior period reclassification is the result of adopting Financial Accounting Standards Board (FASB) Accounting Standard Update (ASU) 2015-17 which resulted in a $3,681,000 reduction of current assets and working capital at December 31, 2014. |
ITEM 7. MANAGEMENT’S DISCUSSION AND ANALYSIS OF FINANCIAL CONDITION AND
RESULTS OF OPERATIONS
The following discussion of our financial condition and results of operations should be read in conjunction with our Consolidated Financial Statements and Notes thereto, and the other financial information included elsewhere in this Form 10-K. This Management’s Discussion and Analysis of Financial Condition and Results of Operations contains descriptions of our expectations regarding future trends affecting our business. These forward-looking statements and other forward-looking statements made elsewhere in this document that are not strictly historical facts are made in reliance upon safe harbor provisions of the Private Securities Litigation Reform Act of 1995. Forward-looking statements are based on management’s current expectations as of the date of this report but involve risks, uncertainties and other factors which may cause actual results to differ materially from those contemplated by such forward looking statements. Item 1A of Part I of this Annual Report on Form 10-K for the year ended December 31, 2015, sets forth certain factors we believe could cause actual results to differ materially from those contemplated by the forward-looking statements. We do not intend to update any of these forward-looking statements after the date of this Form 10-K to conform them to actual results.
Overview
Our product portfolio includes a broad spectrum of over 90 products consisting of over 900 stock keeping units (SKUs) covering a wide array of blood clotting devices, extraction catheters, access catheters, guide extension catheters, micro-introducer kits, guidewires, snare and retrieval devices, a reprocessing service for radiofrequency catheters and a laser and procedure kits for the treatment of varicose veins. We have corporate infrastructure and direct sales capabilities in the United States and have established distribution relationships in most major international markets. In order to drive sales growth, we have invested not only in the expansion of our global distribution system, but also new product development and clinical trials to obtain regulatory approvals. A significant portion of our net revenue historically has been, and we expect will continue to be, attributable to new and enhanced products and services. We expect to continue to further validate the clinical and competitive benefits of our technology platforms to drive utilization of our current products and the development of new and enhanced products and services.
27
Results of Operations
The following table sets forth, for the periods indicated, certain items from our statements of operations expressed as a percentage of net sales:
|
Year Ended December 31,
|
||||||||||||
|
2015
|
2014
|
2013
|
||||||||||
|
Net revenue:
|
||||||||||||
|
Product revenue
|
100
|
%
|
100
|
%
|
100
|
%
|
||||||
|
License, royalty and collaboration revenue
|
-
|
-
|
-
|
|||||||||
|
Total net revenue
|
100
|
%
|
100
|
%
|
100
|
%
|
||||||
|
Product costs and operating expenses:
|
||||||||||||
|
Cost of goods sold
|
33
|
%
|
33
|
%
|
33
|
%
|
||||||
|
Collaboration expenses
|
-
|
-
|
-
|
|||||||||
|
Research and development
|
13
|
%
|
11
|
%
|
12
|
%
|
||||||
|
Clinical and regulatory
|
4
|
%
|
4
|
%
|
4
|
%
|
||||||
|
Sales and marketing
|
23
|
%
|
24
|
%
|
25
|
%
|
||||||
|
General and administrative
|
16
|
%
|
10
|
%
|
8
|
%
|
||||||
|
Litigation settlement
|
-
|
-
|
1
|
%
|
||||||||
|
Medical device excise tax
|
1
|
%
|
1
|
%
|
1
|
%
|
||||||
|
Amortization of purchased technology and intangibles
|
1
|
%
|
1
|
%
|
1
|
%
|
||||||
|
Total product costs and operating expenses
|
91
|
%
|
84
|
%
|
85
|
%
|
||||||
|
Operating earnings
|
9
|
%
|
16
|
%
|
15
|
%
|
||||||
|
Interest earnings/expense and foreign exchange loss, net
|
-
|
-
|
-
|
|||||||||
|
Earnings before income taxes
|
9
|
%
|
16
|
%
|
15
|
%
|
||||||
|
Income tax expense
|
(2
|
%)
|
(6
|
%)
|
(5
|
%)
|
||||||
|
Net earnings
|
7
|
%
|
10
|
%
|
10
|
%
|
||||||
In order to present a more detailed product-specific revenue analysis, in the first quarter of 2015, we began reporting net revenue for each of our top products in each of our primary markets. The following tables set forth, for the periods indicated, net revenue by product along with the percent change from the previous period for each of our top eight products by net revenue:
|
Year ended December 31,
|
|||||||||||||||||||||
|
2015
|
2014
|
2013
|
|||||||||||||||||||
|
Product
|
Primary Market
|
Net Revenue
|
Percent Change
|
Net Revenue
|
Percent Change
|
Net Revenue
|
|||||||||||||||
|
(dollars in thousands)
|
|||||||||||||||||||||
|
GuideLiner catheters
|
Interventional cardiology
|
$
|
45,409
|
43
|
%
|
$
|
31,836
|
53
|
%
|
$
|
20,782
|
||||||||||
|
Pronto® catheters
|
Interventional cardiology
|
14,970
|
(17
|
%)
|
17,998
|
(11
|
%)
|
20,272
|
|||||||||||||
|
Vein catheter reprocessing
|
Phlebology
|
12,602
|
23
|
%
|
10,207
|
24
|
%
|
8,204
|
|||||||||||||
|
Micro-introducer kits
|
Interventional radiology
|
12,337
|
18
|
%
|
10,416
|
17
|
%
|
8,894
|
|||||||||||||
|
Hemostatic patches
|
Interventional cardiology
|
11,998
|
(3
|
%)
|
12,416
|
(5
|
%)
|
13,068
|
|||||||||||||
|
Radial access products
|
Interventional cardiology
|
7,436
|
27
|
%
|
5,839
|
34
|
%
|
4,347
|
|||||||||||||
|
Langston® catheters
|
Interventional cardiology
|
6,590
|
8
|
%
|
6,109
|
6
|
%
|
5,781
|
|||||||||||||
|
D-Stat® Flowable hemostat
|
Electrophysiology
|
5,322
|
(3
|
%)
|
5,462
|
(4
|
%)
|
5,697
|
|||||||||||||
28
Year ended December 31, 2015 compared to the years ended December 31, 2014 and December 31, 2013.
Net revenue increased 17% to $147,200,000 for the year ended December 31, 2015 from $126,099,000 for the year ended December 31, 2014. This increase consists of the following components:
|
% Increase (Decrease)
|
||||
|
Volume of existing products and services sold (including sales of new versions of existing products and services)
|
18
|
%
|
||
|
Pricing of existing products and services sold
|
(3
|
%)
|
||
|
Revenue from new products or services, defined as products and services that had no revenue in 2014
|
2
|
%
|
||
|
17
|
%
|
|||
Approximately 79% of our net revenue was earned in the United States and 21% of our net revenue was earned in international markets for the year ended December 31, 2015.
Net revenue increased 14% to $126,099,000 for the year ended December 31, 2014 from $110,498,000 for the year ended December 31, 2013. This increase consists of the following components:
|
% Increase (Decrease)
|
||||
|
Volume of existing products and services sold (including sales of new versions of existing products and services)
|
17
|
%
|
||
|
Pricing of existing products and services sold
|
(3
|
%)
|
||
|
Revenue from new products or services, defined as products and services that had no revenue in 2013
|
-
|
%
|
||
|
14
|
%
|
|||
Approximately 82% of our net revenue was earned in the United States and 18% of our net revenue was earned in international markets for the year ended December 31, 2014.
We recognized $584,000 of license, royalty and collaboration revenue during the year ended December 31, 2015, compared to $433,000 during the year ended December 31, 2014 and $301,000 during the year ended December 31, 2013, respectively, due to our license and device supply agreements and our royalty agreement with a third party. Collaboration expense of $141,000 was recognized during the year ended December 31, 2015 compared to $165,000 during the year ended December 31, 2014 and $60,000 during the year ended December 31, 2013, respectively, as a result of an agreement we entered into in April 2013 to develop a new hemostatic device for a third party. License, royalty and collaboration revenue is expected to be approximately $500,000 to $600,000 for the full year 2016.
Gross margin remained constant at 67% for each of the years ended December 31, 2015, December 31, 2014 and December 31, 2013. We expect product gross margins to be in the range of 66.0% to 67.0% in 2016, subject to variations in our selling mix between United States and international markets and between our lower margin products such as the Vari-Lase products and our higher margin products such as the D-Stat Dry and GuideLiner.
Research and development expense for the year ended December 31, 2015 totaled $18,358,000 or 12.5% of revenue, compared to $13,441,000 or 11% of revenue for the year ended December 31, 2014 and $13,191,000, or 12% of revenue for the year ended December 31, 2013. Research and development expenses have increased on both a percentage and dollar basis compared to the years ended December 31, 2014 and December 31, 2013, due to headcount additions during the second half of 2014 and the first half of 2015. We expect our continuing research and development expense to be approximately 11.5% to 12.5% of revenue in 2016 as we continue to pursue additional new products and move our longer term development projects forward.
29
Clinical and regulatory expense for the year ended December 31, 2015 totaled $6,323,000, or 4% of revenue, compared to $4,979,000, or 4% of revenue for the year ended December 31, 2014 and $4,408,000, or 4% of revenue for the year ended December 31, 2013. Clinical and regulatory expenses have increased on a dollar basis, but have remained consistent as a percentage of revenue compared to the years ended December 31, 2014 and December 31, 2013, due to headcount additions. We expect clinical and regulatory expense to be approximately 4.5% to 5.5% of revenue in 2016.
Sales and marketing expense for the year ended December 31, 2015 totaled $34,085,000, or 23% of revenue, compared to $29,825,000, or 24% of revenue for the year ended December 31, 2014 and $27,372,000, or 25% of revenue for the year ended December 31, 2013. The decline in sales and marketing expense as a percentage of revenue was due to increasing sales in all our markets and an only minor increase in the size of our U.S. field sales organization. As a result, we expect our sales and marketing expense to continue to decrease as a percentage of revenue to approximately 22.0% to 23.0% of revenue in 2016.
General and administrative expense for the year ended December 31, 2015 totaled $22,583,000, or 15.5% of revenue, compared to $12,986,000, or 10% of revenue for the year ended December 31, 2014 and $8,991,000, or 8% of revenue for the year ended December 31, 2013. General and administrative expense increased in 2015 on a dollar and percentage basis due to an additional $7,559,000 of legal expenses, related to the Short Kit litigation (see Note 13 to our Consolidated Financial Statements), as well as $1,764,000 of expense realized upon the termination of our distribution of the PolarCath peripheral dilation products and transfer of the PolarCath inventory and distribution rights to NuCryo Vascular LLC. General and administrative expense increased in 2014 on a dollar and percentage basis due to an additional $3,700,000 of legal expenses in 2014, primarily related to the Short Kit litigation and the patent infringement lawsuit with Boston Scientific. While legal expenses are difficult to forecast, we expect legal expenses to continue to be substantial through the completion of the criminal trial related to the Short Kit litigation, which currently is scheduled to commence on February 1, 2016. We expect general and administrative expense, other than expenses related to the Short Kit litigation, to be approximately 5.5% to 6.5% of revenue during 2016.
Litigation settlement expense was $-0- for the years ended December 31, 2015 and 2014, and $1,332,000 for the year ended December 31, 2013. Litigation settlement expense in 2013 consisted of $812,500 incurred in the third quarter and paid on December 13, 2013 in connection with the settlement of the patent infringement lawsuit brought by Terumo Corporation and $520,000 incurred in the fourth quarter of 2013 and paid in 2014 related to settlement of the qui tam litigation (see Note 13 to our Consolidated Financial Statements).
Medical device excise taxes for the year ended December 31, 2015 totaled $1,593,000, or 1.1% of revenue, compared to $1,435,000, or 1.1% of revenue for the year ended December 31, 2014, and $1,319,000, or 1.2% of revenue for the year ended December 31, 2013. An excise tax on the sale of medical devices in the U.S. became effective on January 1, 2013. The statutory rate of the medical device excise tax is 2.3% of revenues on initial sales of finished medical products sold in the United States. The tax does not apply to service revenues. The Company’s effective rate for this tax is less than the statutory rate due to international sales, service revenues and sales of purchased finished goods (where the original seller is responsible for paying the tax). In December 2015, legislation was enacted that suspends the medical device excise taxes for fiscal years 2016 and 2017.
Amortization of purchased technology and other intangibles was $1,615,000 for the year ended December 31, 2015, compared to $1,642,000 for the year ended December 31, 2014, and $1,572,000 for the year ended December 31, 2013. The amortization resulted from our product acquisitions. As part of these asset purchases and licensing agreements, we allocated $16,000,000 to purchased technology and other intangibles that are being amortized over a period of 9 to 11 years (see Notes 3 and 14 to our Consolidated Financial Statements).
30
We recorded income tax expense of $3,177,000 for the year ended December 31, 2015, compared to income tax expense of $7,178,000 for the year ended December 31, 2014 and $4,941,000 for the year ended December 31, 2013. This represents an income tax rate of 23% for the year ended December 31, 2015, 36% for the year ended December 31, 2014, and 31% for the year ended December 31, 2013. The reduced effective tax rate of 23% for the year ended December 31, 2015 was due primarily to the impact of releasing approximately $959,000 of reserves against prior years’ research and development credits following the completion of an Internal Revenue Service examination of our 2013 and 2014 federal returns, combined with a higher research and development credit being generated in 2015 and the favorable impacts of increased income being generated by our Irish subsidiary. The effective tax rate of 36% for the year ended December 31, 2014 consists of a graduated federal rate slightly higher than 34% and state taxes. We expect our income tax rate will be between 33.0% and 34.0% in 2016.
As of December 31, 2015, we had a total of $4,797,000 of net deferred tax assets for U.S. jurisdictions and a long term deferred tax liability of $72,000 for foreign jurisdictions on our balance sheet. In addition, at December 31, 2015, we had $1,750,000 of federal and state research and development tax credit carryforwards, which will begin to expire in 2016. We have recorded an allowance of approximately $1,092,000 against the state research and development tax credit carryforwards, reflecting the amount of these research and development tax credit carryforwards expected to expire prior to being utilized.
Based on current assumptions, we project our income tax expense to be between $8,500,000 and $9,500,000 in 2016. Of this total, we expect to be able to utilize approximately $2,500,000 of 2016 generated and prior year deferred tax assets to offset our tax payments, resulting in our use of between $6,000,000 and $7,000,000 in cash to pay state and federal taxes in 2016.
Liquidity and Capital Resources
Our cash and cash equivalents totaled $41,491,000 at December 31, 2015, compared to $36,461,000 at December 31, 2014, an increase of $5,030,000. The majority of our cash is maintained in operating accounts. A portion of our cash equivalents are invested in a money market fund invested in high quality, short-term money market instruments denominated in U.S. dollars such as debt instruments guaranteed by the governments of the United States, Western Europe, Australia, Japan and Canada, high quality corporate issuers and bank obligations. The money market fund’s assets are rated in the highest short-term category by nationally recognized rating agencies, such as Moody’s or Standard & Poor’s.
Cash provided by operations. We generated $17,754,000 of cash from operations during the year ended December 31, 2015, primarily resulting from our net earnings of $10,464,000, non-cash depreciation and amortization expense of $5,996,000, non-cash stock-based compensation of $4,126,000 and non-cash taxes of $1,051,000. Cash from operations increased by $5,667,000 due to a decrease in prepaid expenses, an increase in accounts payable, and an increase in accrued expenses, and decreased by $8,273,000 due to an increase in accounts receivable and inventory. Finished goods inventory increased by $3,037,800 from December 31, 2014 to December 31, 2015 due to increased sales and increased stocking levels related to ongoing renovation and expansion of our manufacturing facilities. Accounts receivable day’s sales outstanding at December 31, 2015 and December 31, 2014 were 47 days and 50 days, respectively.
Cash used for investing activities. We used $13,353,000 of cash in investing activities during the year ended December 31, 2015, consisting of $10,605,000 for capital expenditures related to building improvements and the purchase of manufacturing, computer and research and development equipment, and $2,748,000 to purchase an additional manufacturing facility located adjacent to our existing facilities, which expanded our manufacturing capacity. The cash used in investing activities for building improvements is primarily due to ongoing renovation and expansion of our manufacturing facilities, which we expect to complete in 2016.
Cash used for financing activities. We generated $675,000 of cash in financing activities during the year ended December 31, 2015, primarily due to the receipt of $1,648,000 in exchange for the sale of common stock pursuant to our Employee Stock Purchase Plan, the recognition of $942,000 of tax benefits from stock based awards, and the receipt of $418,000 upon the exercise of outstanding stock options. These amounts were reduced by $2,333,000 of cash used to repurchase 81,984 shares of our common stock that vested under outstanding restricted stock awards. These shares were repurchased to satisfy income tax withholding obligations of the award recipients.
31
The following table summarizes our contractual cash commitments as of December 31, 2015:
|
Payments Due by Period
|
||||||||||||||||||||
|
Contractual Obligations
|
Total
|
Less than 1 year
|
1 - 3 years
|
3 - 5 years
|
More than 5 years
|
|||||||||||||||
|
(in thousands)
|
||||||||||||||||||||
|
Facility operating leases
|
$
|
1,311
|
$
|
486
|
$
|
432
|
$
|
393
|
$
|
-
|
||||||||||
|
Product license rights
|
400
|
400
|
-
|
-
|
-
|
|||||||||||||||
|
Total
|
$
|
1,711
|
$
|
886
|
$
|
432
|
$
|
393
|
$
|
-
|
||||||||||
We do not have any other significant cash commitments related to supply agreements, nor do we have any significant commitments for capital expenditures.
Off-balance sheet arrangements. We do not have any off-balance sheet arrangements, as defined by the rules and regulations of the Securities and Exchange Commission, that have or are reasonably likely to have a material effect on our financial condition, changes in financial condition, revenues or expenses, results of operations, liquidity, capital expenditures or capital resources. As a result, we are not materially exposed to any financing, liquidity, market or credit risk that could arise if we had engaged in these arrangements.
We currently anticipate that we will experience positive cash flow from our normal operating activities for the foreseeable future. We currently believe that our working capital of $70.4 million at December 31, 2015 will be sufficient to meet all of our operating and capital requirements for the foreseeable future. However, our actual liquidity and capital requirements will depend upon numerous unpredictable factors, including the amount of revenues from sales of our existing and new products; litigation expense; the cost of maintaining, enforcing and defending patents and other intellectual property rights; competing technological and market developments; developments related to regulatory and third party reimbursement matters; and other factors.
Critical Accounting Policies
Management’s Discussion and Analysis of Financial Condition and Results of Operations addresses our consolidated financial statements, which have been prepared in accordance with accounting principles generally accepted in the United States. The preparation of our consolidated financial statements requires that we make estimates and assumptions that affect the reported amounts of assets and liabilities and the disclosure of contingent assets and liabilities at the date of the consolidated financial statements and the reported amounts of revenues and expenses during the reporting period. On an on-going basis, we evaluate these estimates and judgments. We base our estimates and judgments on historical experience and on various other factors that we believe to be reasonable under the circumstances, the results of which form the basis for making judgments about the carrying value of assets and liabilities that are not readily apparent from other sources. Actual results may differ from these estimates under different assumptions or conditions.
Our accounting policies are described in Note 2 to the Consolidated Financial Statements included in Item 8 of Part II of this Annual Report on 10-K for the year ended December 31, 2015. We set forth below those material accounting policies that we believe are the most critical to an investor’s understanding of our financial results and condition and that require complex management judgment.
Inventory
We state our inventory at the lower of cost (weighted average first-in, first-out method) or market. The estimated value of excess, obsolete and slow-moving inventory as well as inventory with a carrying value in excess of its net realizable value is established by us on a quarterly basis through review of inventory on hand and assessment of future demand, anticipated release of new products into the market, historical experience and product expiration. Our stated value of inventory could be materially different if demand for our products decreased because of competitive conditions or market acceptance, or if products become obsolete because of advancements in the industry.
32
Revenue Recognition
We recognize revenue in accordance with generally accepted accounting principles as outlined in ASC 605-10-S99, Revenue Recognition, which requires that four basic criteria be met before revenue can be recognized: (i) persuasive evidence of an arrangement exists; (ii) the price is fixed or determinable; (iii) collectability is reasonably assured; and (iv) product delivery has occurred or services have been rendered. We recognize revenue as products are shipped based on FOB shipping point terms when title passes to customers. We negotiate credit terms on a customer-by-customer basis and products are shipped at an agreed upon price and revenue is recorded on a gross basis. All product returns must be pre-approved and, if approved, customers are subject to a 20% restocking charge.
We generate revenue from license agreements and research collaborations and recognize these revenues when earned. In accordance with ASC 605, for deliverables which contain multiple deliverables, we separate the deliverables into separate accounting units if they meet the following criteria: (i) the delivered items have a stand-alone value to the customer; (ii) the fair value of any undelivered items can be reliably determined; and (iii) if the arrangement includes a general right of return, delivery of the undelivered items is probable and substantially controlled by the seller. Deliverables that do not meet these criteria are combined with one or more other deliverables into one accounting unit. Revenue from each accounting unit is recognized based on the applicable accounting literature, primarily ASC 605-10-S99.
We also generate revenue from the ClosureFAST catheter reprocessing service rights acquired from NES in December 2011. In accordance with ASC 605-45, the reprocessing revenue is reported as our revenue and the amount paid to NES is reported as our cost of sales (see Note 2 to our Consolidated Financial Statements in Item 8 of Part II of this Annual Report on Form 10-K for the year ended December 31, 2015).
On January 9, 2007, we entered into three separate agreements with King, consisting of a License Agreement, a Device Supply Agreement and a Thrombin-JMI Supply Agreement. We licensed the exclusive rights to our products Thrombi-Pad, Thrombi-Gel and Thrombi-Paste to King in exchange for a cash payment of $7 million. As part of the Device Supply Agreement, we agreed to complete the development and conduct clinical studies for Thrombi-Gel and Thrombi-Paste, with the costs related to these activities to be paid by King. We recognized collaboration revenue as it was earned under the agreements with King. On July 6, 2011, King notified us that it was terminating the development of the Thrombi-Paste products and terminating efforts to obtain the surgical indication for the Thrombi-Gel products. As a result of King making this decision not to proceed, we recognized revenue of $2,762,000 in the third quarter of 2011, which represented the remaining deferred license revenue originally allocated to the Thrombi-Paste products and the surgical indication of the Thrombi-Gel products as part of the King agreements. We are amortizing the remaining license fee on a straight-line basis over 10 years. We continue to manufacture and sell the licensed products to King under the Device Supply Agreement.
In addition, we have reviewed the provisions of ASC 808, Collaborative Arrangements, and believe the adoption of this ASC has had no impact on the amounts recorded under these agreements.
We analyze the rate of historical returns when evaluating the adequacy of the allowance for sales returns, which is included with the allowance for doubtful accounts on our balance sheet. At December 31, 2015, this reserve was $75,000 compared to $80,000 at December 31, 2014. If the historical data we use to calculate these estimates does not properly reflect future returns, revenue could be overstated.
33
Allowance for Doubtful Accounts
We maintain allowances for doubtful accounts for estimated losses resulting from the inability of our customers to make required payments. This allowance is regularly evaluated by us for adequacy by taking into consideration factors such as past experience, credit quality of the customer base, age of the receivable balances, both individually and in the aggregate, and current economic conditions that may affect a customer’s ability to pay. At December 31, 2015, this reserve was $285,000 compared to $220,000 at December 31, 2014. If the financial condition of our customers were to deteriorate, resulting in an impairment of their ability to make payments, additional allowances may be required.
Income Taxes
The carrying value of our net deferred tax assets assumes that we will be able to generate sufficient taxable earnings in the United States based on estimates and assumptions. We record a valuation allowance to reduce the carrying value of our net deferred tax asset to the amount that is more likely than not to be realized. For the year ended December 31, 2015, we have a valuation allowance recorded on our state research and development credits and net operating loss carryforwards of $1,440,000 related to our gross deferred tax assets of $6,309,000. In addition, at December 31, 2015, we have a reserve for uncertain tax positions in the amount of $379,000 relating to federal and state research and development credits. At December 31, 2015, we have accrued $-0- for the payment of tax related interest and there was no tax interest or penalties recognized in the statements of operations. We continue to assess the potential realization of our deferred tax assets on an annual basis, or on an interim basis if circumstances warrant.
Legal Contingency Accrual
We record losses for claims in earnings at the lime and to the extent they are probable and estimable. In accordance with ASC Topic 450, Contingencies, we accrue anticipated costs of settlement, damages, losses for general product liability claims and, under certain conditions, costs of defense, based on historical experience or to the extent specific losses are probable and estimable. We expense legal costs as incurred. If the estimate of a probable loss is a range and no amount within the range is more likely, we accrue the minimum amount of the range.
Recently Issued Accounting Pronouncements
In May 2014, the FASB issued guidance creating ASC 606, “Revenue from Contracts with Customers.” The new section will replace ASC 605, “Revenue Recognition” and creates modifications to various other revenue accounting standards for specialized transactions and industries. The new ASC is intended to conform United States revenue accounting principles with concurrently issued International Financial Reporting Standards. Prior to the guidance, revenue recognition differed between United States practice and those of much of the rest of the world. The guidance also is intended to enhance disclosures related to disaggregated revenue information. The updated guidance is effective for annual reporting periods beginning on or after December 15, 2017, and interim periods within those annual periods. We will adopt the new provisions of this accounting standard at the beginning of fiscal year 2018 and we do not expect adoption will have a material impact on the consolidated financial statements.
In November 2014 the FASB issued ASU 2015-17, Income Taxes (Topic 740) Related to the Balance Sheet Classification of Deferred Taxes which will require entities to present deferred tax assets (DTAs) and deferred tax liabilities (DTLs) as noncurrent in a classified balance sheet. The ASU simplifies the current guidance (ASC 740-10-45-4), which requires entities to separately present DTAs and DTLs as current and noncurrent in a classified balance sheet. The ASU is effective for annual reporting periods beginning on or after December 15, 2016, and interim periods within those annual periods. The Board decided to allow all entities to early adopt the ASU for financial statements that had not been issued. Therefore, we adopted this ASU at December 31, 2015, and have reclassified all prior periods to be consistent with the requirements outlined in the ASU. The impact of the prior period reclassification was a $3,681,000 reduction of current assets and working capital at December 31, 2014.
In July 2015, the FASB issued ASU 2015-11, Inventory (Topic 330) Related to Simplifying the Measurement of Inventory which applies to all inventory except inventory that is measured using last-in, first-out (“LIFO”) or the retail inventory method. Inventory measured using first-in, first-out (“FIFO”) or average cost is covered by the new amendments. Inventory within the scope of the new guidance should be measured at the lower of cost and net realizable value. Net realizable value is the estimated selling prices in the ordinary course of business, less reasonably predictable costs of completion, disposal, and transportation. Subsequent measurement is unchanged for inventory measured using LIFO or the retail inventory method. The amendments will take effect for public business entities for fiscal years beginning after December 15, 2016, including interim periods within those fiscal years. The new guidance should be applied prospectively, and earlier application is permitted as of the beginning of an interim or annual reporting period. We are evaluating the impact of the standard on our consolidated financial statements.
34
ITEM 7A. QUANTITATIVE AND QUALITATIVE DISCLOSURES ABOUT MARKET RISK
Financial instruments that potentially subject us to concentrations of credit risk consist primarily of cash and cash equivalents and accounts receivables. We maintain our accounts for cash and cash equivalents principally at one major bank and one investment firm in the United States. We have a formal written investment policy that restricts the placement of investments to issuers evaluated as creditworthy. We have not experienced any losses on our deposits of our cash and cash equivalents.
With respect to accounts receivable, we perform credit evaluations of our customers and do not require collateral. There have been no material losses on accounts receivables.
In the United States, we sell our products directly to hospitals and clinics. In international markets, we sell our products to independent distributors who, in turn, sell to medical clinics. We sell our product in these countries through independent distributors denominated in United States dollars, with the exception of sales from our subsidiary in Ireland and sales to our distributor in Germany, where sales are denominated in Euros.
We distribute certain products on behalf of certain U.S. and international manufacturers. We pay for all distributed products in United States dollars.
We do not believe our operations are currently subject to significant market risks for interest rates, foreign currency exchange rates, commodity prices or other relevant market price risks of a material nature. A change of 0.1 in the Euro exchange rate would result in an increase or decrease of approximately $34,000 in the amount of United States dollars we receive in payment on accounts receivable from our German distributor Nicolai, and $21,000 in accounts receivable due our subsidiary in Ireland. Under our current policies, we do not use foreign currency derivative instruments to manage exposure to fluctuations in the Euro exchange rate.
We currently have no exposure to interest rate changes on indebtedness. Under our current policies, we do not use interest rate derivative instruments to manage exposure to interest rate changes. However, we are exposed to declines in the interest rates paid on deposited funds. A 0.1% decline in the current market interest rates paid on deposits would result in interest earnings being reduced by approximately $41,000 on an annual basis.
ITEM 8. FINANCIAL STATEMENTS AND SUPPLEMENTARY DATA
The Consolidated Financial Statements and Notes thereto required pursuant to this Item begin on page 43 of this Annual Report on Form 10-K for the year ended December 31, 2015.
ITEM 9. CHANGES IN AND DISAGREEMENTS WITH ACCOUNTANTS ON ACCOUNTING AND FINANCIAL DISCLOSURE
None.
ITEM 9A. CONTROLS AND PROCEDURES
Evaluation of Disclosure Controls and Procedures.
Under the supervision and with the participation of our management, including our Chief Executive Officer and Chief Financial Officer, we evaluated the effectiveness of the design and operation of our disclosure controls and procedures (as defined in Rule 13a-15(e) under the Exchange Act). Based upon that evaluation, the Chief Executive Officer and Chief Financial Officer concluded that, as of the end of the period covered by this report, our disclosure controls and procedures were effective.
35
Changes in Internal Controls.
During the fiscal quarter ended December 31, 2015, there has been no change in our internal control over financial reporting (as defined in Rule 13a-15(f) under the Exchange Act) that has materially affected, or is reasonably likely to materially affect, our internal control over financial reporting.
Management’s Report on Internal Control Over Financial Reporting.
Our management is responsible for establishing and maintaining adequate internal control over financial reporting, as such term is defined in Exchange Act Rule 13a-15(f). Our internal control system was designed to provide reasonable assurance to our management and board of directors regarding the preparation and fair presentation of published financial statements. All internal control systems, no matter how well designed, have inherent limitations. Therefore, even those systems determined to be effective can provide only reasonable assurance with respect to financial statement preparation and presentation.
Under the supervision and with the participation of our management, including our Chief Executive Officer and Chief Financial Officer, we conducted an evaluation of the effectiveness of our internal control over financial reporting based on the Internal Control - Integrated Framework issued by the Committee of Sponsoring Organizations (COSO) of the Treadway Commission (2013 framework). Based on our evaluation under the framework in Internal Control — Integrated Framework, our management concluded that our internal control over financial reporting was effective as of December 31, 2015.
Attestation Report of Independent Registered Public Accounting Firm.
Baker Tilly Virchow Krause, LLP, an independent registered public accounting firm, has issued an attestation report on our internal control over financial reporting as of December 31, 2015. The attestation report of Baker Tilly Virchow Krause, LLP on our internal control over financial reporting as of December 31, 2015 is included on page 42 and incorporated by reference herein.
ITEM 9B. OTHER INFORMATION
None.
PART III
ITEM 10. DIRECTORS, EXECUTIVE OFFICERS AND CORPORATE GOVERNANCE
The disclosure under the headings “Proposal 1: Election of Directors,” “Corporate Governance - Committees of the Board of Directors” and “Section 16(a) Beneficial Ownership Reporting Compliance” contained in the Proxy Statement for our 2016 Annual Meeting of Shareholders to be filed with the Securities and Exchange Commission within 120 days of the close of the year ended December 31, 2015, is incorporated herein by reference.
See the section under the heading “Executive Officers of the Registrant” in Item 1 of Part I herein for information regarding our executive officers.
36
Code of Ethics
We have adopted a code of ethics that applies to all of our directors, officers (including our chief executive officer, chief financial officer, chief accounting officer, and any person performing similar functions) and employees. We have posted our Code of Ethics in the “Corporate Governance” section of our website, http://www.vasc.com.
ITEM 11. EXECUTIVE COMPENSATION
The disclosure under the headings “Director Compensation” and “Executive Compensation”, contained in the Proxy Statement for our 2016 Annual Meeting of Shareholders to be filed with the Securities and Exchange Commission within 120 days of the close of the year ended December 31, 2015, is incorporated herein by reference.
ITEM 12. SECURITY OWNERSHIP OF CERTAIN BENEFICIAL OWNERS AND MANAGEMENT AND RELATED STOCKHOLDER MATTERS
The disclosure under the heading “Security Ownership of Certain Beneficial Owners and Management”, contained in the Proxy Statement for our 2016 Annual Meeting of Shareholders to be filed with the Securities and Exchange Commission within 120 days of the close of the year ended December 31, 2015, is incorporated herein by reference.
Equity Compensation Plans
The following table sets forth the securities authorized to be issued under our current equity compensation plans as of December 31, 2015:
|
Plan category
|
Number of securities to be issued upon exercise of outstanding options and rights
|
Weighted-average
exercise price of outstanding options and rights
|
Number of securities remaining available for future issuance under equity compensation plans (excluding outstanding options and rights)
|
|||||||||
|
Equity compensation plans approved by security holders
|
622,500
|
$
|
12.18
|
1,513,000
|
(1)(2)
|
|||||||
|
Equity compensation plans not approved by security holders
|
None
|
None
|
None
|
|||||||||
|
Total
|
622,500
|
$
|
12.18
|
1,513,000
|
||||||||
| (1) | Includes 741,000 shares reserved and available for issuance under our Stock Option and Stock Award Plan. |
| (2) | Includes 772,000 shares reserved and available for issuance under our Employee Stock Purchase Plan. The shares available for issuance under our Employee Stock Purchase Plan automatically increases on an annual basis through 2020, by the lesser of: |
| · | 200,000 shares; |
| · | 2% of the common-equivalent shares outstanding at the end of our prior fiscal year; or |
| · | a smaller amount determined by our Board of Directors or the committee administering the plan. |
37
ITEM 13. CERTAIN RELATIONSHIPS AND RELATED TRANSACTIONS, AND DIRECTOR INDEPENDENCE
The disclosure under the headings “Related Person Transaction Policy and Related Person Transactions,” “Proposal 1: Election of Directors,” and “Corporate Governance – Committees of the Board of Directors”, contained in the Proxy Statement for our 2016 Annual Meeting of Shareholders to be filed with the Securities and Exchange Commission within 120 days of the close of the year ended December 31, 2015, is incorporated herein by reference.
ITEM 14. PRINCIPAL ACCOUNTANT FEES AND SERVICES
The disclosure under the heading “Additional Information about our Independent Registered Public Accounting Firm”, contained in the Proxy Statement for our 2016 Annual Meeting of Shareholders to be filed with the Securities and Exchange Commission within 120 days of the close of the year ended December 31, 2015, is incorporated herein by reference.
PART IV
ITEM 15. EXHIBITS AND FINANCIAL STATEMENT SCHEDULES
(a) Documents filed as part of this Report.
| (1) | The following financial statements are filed herewith in Item 8 in Part II of this Annual Report on Form 10-K for the year ended December 31, 2015. |
| (i) | Report of Independent Registered Public Accounting Firm |
| (ii) | Consolidated Balance Sheets |
| (iii) | Consolidated Statements of Earnings |
| (iv) | Consolidated Statements of Comprehensive Earnings |
| (v) | Consolidated Statements of Changes in Shareholders’ Equity |
| (vi) | Consolidated Statements of Cash Flows |
| (vii) | Notes to Consolidated Financial Statements |
| (2) | Financial Statement Schedule |
Schedule II – Valuation and Qualifying Accounts. Such schedule should be read in conjunction with the consolidated financial statements. All other supplemental schedules are omitted because of the absence of conditions under which they are required.
| (3) | Exhibits |
|
Exhibit
Number
|
Description
|
|
|
3.1
|
Amended and Restated Articles of Incorporation of Vascular Solutions, Inc. (incorporated by reference to Exhibit 3.1 to Vascular Solutions’ Form 10-Q for the quarter ended September 30, 2000 (File No. 0-27605)).
|
|
|
3.2
|
Amended and Restated Bylaws of Vascular Solutions, Inc. (incorporated by reference to Exhibit 3.1 of Vascular Solutions’ Form 8-K dated October 19, 2007 (File No. 0-27605)).
|
38
|
4.1
|
Specimen of Common Stock certificate (incorporated by reference to Exhibit 4.1 of Vascular Solutions’ Registration Statement on Form S-1 (File No. 333-84089)).
|
|
|
10.1**
|
Form of Employment Agreement by and between Vascular Solutions, Inc. and each of its executive officers (incorporated by reference to Exhibit 10.5 of Vascular Solutions’ Form 10-Q for the quarter ended March 31, 2004 (File No. 0-27605)).
|
|
|
10.2**
|
Form of Incentive Stock Option Agreement (incorporated by reference to Exhibit 10.1 of Vascular Solutions’ Form 8-K dated September 22, 2004 (File No. 0-27605)).
|
|
|
10.3**
|
Form of Nonqualified Stock Option Agreement (incorporated by reference to Exhibit 10.2 of Vascular Solutions’ Form 8-K dated September 22, 2004 (File No. 0-27605)).
|
|
|
10.4**
|
Form of Board of Directors Stock Option Agreement, as amended December 9, 2005 (incorporated by reference to Exhibit 10.2 of Vascular Solutions’ Form 8-K dated December 9, 2005 (File No. 0-27605)).
|
|
|
10.5**
|
Form of Restricted Stock Award Agreement (incorporated by reference to Exhibit 10.3 of Vascular Solutions’ Form 8-K dated December 9, 2005 (File No. 0-27605)).
|
|
|
10.6**
|
Amended and restated Employee Stock Purchase Plan (incorporated by reference to Exhibit 10.1 of Vascular Solutions’ Form 8-K dated April 22, 2010 (File No. 0-27605)).
|
|
|
10.7
|
License agreement dated January 9, 2007 by and between Vascular Solutions and King Pharmaceuticals, Inc. (incorporated by reference to Exhibit 10.22 of Vascular Solutions’ Form 10-K for the year ended December 31, 2006 (File No. 0-27605)).
|
|
|
10.8***
|
Device Supply agreement dated January 9, 2007 by and between Vascular Solutions and King Pharmaceuticals, Inc. (incorporated by reference to Exhibit 10.23 of Vascular Solutions’ Form 10-K for the year ended December 31, 2006 (File No. 0-27605)).
|
|
|
10.9***
|
Thrombin-JMI® Supply Agreement dated January 9, 2007 by and between Vascular Solutions and King Pharmaceuticals, Inc. (incorporated by reference to Exhibit 10.24 of Vascular Solutions’ Form 10-K for the year ended December 31, 2006 (File No. 0-27605)).
|
|
|
10.10***
|
Settlement Agreement dated June 2, 2008 among VNUS Medical Technologies, Inc. (acquired by Covidien), AngioDynamics, Inc. and Vascular Solutions, Inc. (incorporated by reference to Exhibit 10.2 of Vascular Solutions’ Form 10-Q for the quarter ended June 30, 2008 (File No. 0-27605)).
|
|
|
10.11**
|
Chairman of the Board Agreement dated as of May 1, 2011 (incorporated by reference to Exhibit 10.1 of Vascular Solutions’ Form 8-K dated April 22, 2011 (File No. 0-27605)).
|
|
|
10.12**
|
Chairman of the Board Stock Option Agreement dated April 22, 2011 (incorporated by reference to Exhibit 10.3 of Vascular Solutions’ Form 8-K dated April 22, 2011 (File No. 0-27605)).
|
|
|
10.13**
|
Vascular Solutions, Inc. Stock Option and Stock Award Plan, as amended April 21, 2015 (incorporated by reference to Exhibit 10.1 of Vascular Solutions’ Form 8-K dated April 22, 2015 (File No. 0-27605)).
|
|
|
10.14**
|
Vascular Solutions, Inc. Restricted Stock Award Program for Non-Employee Directors (incorporated by reference to Exhibit 10.3 of Vascular Solutions’ Form 10-Q for the quarter ended September 30, 2012 (File No. 0-27605)).
|
|
|
10.15**
|
Form of Restricted Stock Award Agreement for Non-Employee Directors (incorporated by reference to Exhibit 10.4 of Vascular Solutions’ Form 10-Q for the quarter ended September 30, 2012 (File No. 0-27605)).
|
|
|
10.16**
|
Employment Agreement by and between Vascular Solutions, Inc. and its Chief Executive Officer dated as of January 27, 2012 (incorporated by reference to Exhibit 10.1 of Vascular Solutions’ Form 10-Q for the quarter ended March 31, 2012 (File No. 0-27605)).
|
|
|
10.17**
|
Chief Executive Officer Stock Option Agreement dated as of January 27, 2012 (incorporated by reference to Exhibit 10.2 of Vascular Solutions’ Form 10-Q for the quarter ended March 31, 2012 (File No. 0-27605)).
|
|
|
10.18**
|
Form of Executive Compensation Recoupment Agreement (incorporated by reference to Exhibit 10.26 of Vascular Solutions’ Form 10-K for the year ended December 31, 2013 (File No. 0-27605)).
|
39
|
10.19
|
Agreement for Sale and Purchase of Property made as of February 18, 2014 by and between IRET-Plymouth, LLC and Vascular Solutions, Inc. (incorporated by reference to Exhibit 10.1 of Vascular Solutions’ Form 8-K dated February 18, 2014 (File No. 0-27605)).
|
|
|
10.20
|
Agreement for Sale and Purchase of Property made as of January 26, 2015 by and between IRET – LEXCOM, LLC and Vascular Solutions, Inc. (incorporated by reference to Exhibit 10.1 of Vascular Solutions’ Form 8-K dated January 26, 2015 (File No. 0-27605)).
|
|
|
10.21**
|
Form of Restricted Stock and Cash Election Award Agreement (incorporated by reference to Exhibit 10.22 of Vascular Solutions’ Form 10-K for the year ended December 31, 2014 (File No. 0-27605)).
|
|
|
Consent of Baker Tilly Virchow Krause, LLP.
|
||
|
24.1
|
Power of Attorney (included on signature page).
|
|
|
Certification of Chief Executive Officer pursuant to Section 302 of the Sarbanes-Oxley Act of 2002.
|
||
|
Certification of Chief Financial Officer pursuant to Section 302 of the Sarbanes-Oxley Act of 2002.
|
||
|
Certification of Chief Executive Officer pursuant to Section 906 of the Sarbanes-Oxley Act of 2002.
|
||
|
Certification of Chief Financial Officer pursuant to Section 906 of the Sarbanes-Oxley Act of 2002.
|
||
|
101.INS*
|
XBRL Instance Document
|
|
|
101.SCH*
|
XBRL Taxonomy Extension Schema
|
|
|
101.CAL*
|
XBRL Taxonomy Extension Calculation Linkbase
|
|
|
101.DEF*
|
XBRL Taxonomy Extension Definition Linkbase
|
|
|
101.LAB*
|
XBRL Taxonomy Extension Label Linkbase
|
|
|
101.PRE*
|
XBRL Taxonomy Extension Presentation Linkbase
|
* Filed herewith.
**Management contract or compensatory plan or arrangement required to be filed as an Exhibit to this Form 10-K.
*** Pursuant to Rule 24b-2 of the Securities Exchange Act of 1934, as amended, confidential portions of these exhibits have been deleted and filed separately with the Securities and Exchange Commission pursuant to a request for confidential treatment.
40
SIGNATURES
Pursuant to the requirements of Section 13 or 15(d) of the Securities Exchange Act of 1934, the registrant has duly caused this report to be signed on its behalf by the undersigned, thereunto duly authorized, on the 22nd day of January 2016.
|
VASCULAR SOLUTIONS, INC.
|
|||
|
By:
|
/s/ Howard Root
|
||
|
Howard Root
|
|||
|
Chief Executive Officer and Director
|
|||
KNOW ALL PERSONS BY THESE PRESENTS, that each person whose signature appears below constitutes and appoints each of Howard Root, James Hennen and Gordon Weber (with full power to act alone), as his true and lawful attorneys-in-fact and agents, with full powers of substitution and resubstitution, for him and in his name, place and stead, in any and all capacities, to sign any and all amendments to the Annual Report on Form 10-K of Vascular Solutions, Inc. for the year ended December 31, 2015, and to file the same, with all exhibits thereto, and other documents in connection therewith, with the Securities and Exchange Commission, granting unto said attorneys-in-fact and agents full power and authority to do and perform each and every act and thing requisite or necessary to be done in and about the premises, as fully to all intents and purposes as he might or could do in person, hereby ratifying and confirming all that said attorneys-in-fact and agents, or their substitute or substitutes, lawfully do or cause to be done by virtue hereof.
Pursuant to the requirements of the Securities Exchange Act of 1934, this report has been signed on the 22nd day of January 2016, by the following persons in the capacities indicated.
|
Signature
|
Title
|
|
|
/s/ Howard Root
|
Chief Executive Officer and Director
|
|
|
Howard Root
|
(principal executive officer)
|
|
|
/s/ James Hennen
|
Senior Vice President, Finance and Chief Financial Officer
|
|
|
James Hennen
|
(principal financial officer)
|
|
|
/s/ Timothy Slayton
|
Controller
|
|
|
Timothy Slayton
|
(principal accounting officer)
|
|
|
/s/ Richard Nigon
|
Director
|
|
|
Richard Nigon
|
||
|
/s/ Richard Kramp
|
Director
|
|
|
Richard Kramp
|
||
|
/s/ Paul O’Connell
|
Director
|
|
|
Paul O’Connell
|
||
|
/s/ John Erb
|
Director
|
|
|
John Erb
|
||
|
/s/ Jorge Saucedo
|
Director
|
|
|
Jorge Saucedo
|
||
|
/s/ Martin Emerson
|
Director
|
|
|
Martin Emerson
|
41
REPORT OF INDEPENDENT REGISTERED PUBLIC ACCOUNTING FIRM
To the Shareholders, Audit Committee and Board of Directors
Vascular Solutions, Inc.
Minneapolis, MN
We have audited the accompanying consolidated balance sheets of Vascular Solutions, Inc. as of December 31, 2015 and 2014, and the related consolidated statements of earnings, comprehensive earnings, changes in shareholders' equity and cash flows for the years ended December 31, 2015, 2014 and 2013. We also have audited Vascular Solutions, Inc.'s internal control over financial reporting as of December 31, 2015, based on criteria established in Internal Control ‑ Integrated Framework issued by the Committee of Sponsoring Organizations of the Treadway Commission (COSO) (2013 framework). These consolidated financial statements are the responsibility of the company's management. Our responsibility is to express an opinion on these consolidated financial statements and an opinion on the company's internal control over financial reporting based on our audits.
We conducted our audits in accordance with the standards of the Public Company Accounting Oversight Board (United States). Those standards require that we plan and perform the audit to obtain reasonable assurance about whether the consolidated financial statements are free of material misstatement and whether effective internal control over financial reporting was maintained in all material respects. Our audits of the consolidated financial statements include examining, on a test basis, evidence supporting the amounts and disclosures in the consolidated financial statements, assessing the accounting principles used and significant estimates made by management, and evaluating the overall consolidated financial statement presentation. Our audit of internal control over financial reporting included obtaining an understanding of internal control over financial reporting, assessing the risk that a material weakness exists, and testing and evaluating the design and operating effectiveness of internal control based on the assessed risk. Our audits also included performing such other procedures as we considered necessary in the circumstances. We believe that our audits provide a reasonable basis for our opinions.
A company’s internal control over financial reporting is a process designed to provide reasonable assurance regarding the reliability of financial reporting and the preparation of consolidated financial statements for external purposes in accordance with generally accepted accounting principles. A company's internal control over financial reporting includes those policies and procedures that (1) pertain to the maintenance of records that, in reasonable detail, accurately and fairly reflect the transactions and dispositions of the assets of the company; (2) provide reasonable assurance that transactions are recorded as necessary to permit preparation of consolidated financial statements in accordance with generally accepted accounting principles, and that receipts and expenditures of the company are being made only in accordance with authorizations of management and directors of the company; and (3) provide reasonable assurance regarding prevention or timely detection of unauthorized acquisition, use, or disposition of the company's assets that could have a material effect on the consolidated financial statements.
Because of its inherent limitations, internal control over financial reporting may not prevent or detect misstatements. Also, projections of any evaluation of effectiveness to future periods are subject to the risk that controls may become inadequate because of changes in conditions, or that the degree of compliance with the policies or procedures may deteriorate.
In our opinion, the consolidated financial statements referred to above present fairly, in all material respects, the financial position of Vascular Solutions, Inc. as of December 31, 2015 and 2014 and the results of their operations and cash flows for the years ended December 31, 2015, 2014 and 2013, in conformity with accounting principles generally accepted in the United States of America. Also in our opinion, Vascular Solutions, Inc. maintained, in all material respects, effective internal control over financial reporting as of December 31, 2015, based on criteria established in Internal Control ‑ Integrated Framework issued by the Committee of Sponsoring Organizations of the Treadway Commission (COSO) (2013 framework).
The supplemental information has been subjected to audit procedures performed in conjunction with the audit of Vascular Solutions, Inc. consolidated financial statements. The supplemental information is the responsibility of the company's management. Our audit procedures included determining whether the supplemental information reconciles to the consolidated financial statements or the underlying accounting and other records, as applicable, and performing procedures to test the completeness and accuracy of the information presented in the supplemental information. In forming our opinion on the supplemental information, we evaluated whether the supplemental information, including its form and content, is presented in conformity with accounting principles generally accepted in the United States of America. In our opinion, the supplemental information is fairly stated, in all material respects, in relation to the consolidated financial statements as a whole.
As discussed in Note 2 to the consolidated financial statements, effective December 31, 2015, the Company adopted Accounting Standards Update 2015‑17 “Income Taxes – Balance Sheet Classification of Deferred Taxes”.
/s/ Baker Tilly Virchow Krause, LLP
Minneapolis, Minnesota
January 22, 2016
42
Vascular Solutions, Inc.
Consolidated Balance Sheets
(dollars in thousands, except per share amounts)
|
December 31,
|
||||||||
|
2015
|
2014
|
|||||||
|
Assets
|
||||||||
|
Current assets:
|
||||||||
|
Cash and cash equivalents
|
$
|
41,491
|
$
|
36,461
|
||||
|
Accounts receivable, net of reserves of $360 and $300 at December 31, 2015 and 2014, respectively
|
19,121
|
17,105
|
||||||
|
Inventories
|
22,105
|
15,908
|
||||||
|
Prepaid expenses and other
|
4,361
|
5,231
|
||||||
|
Total current assets
|
87,078
|
74,705
|
||||||
|
Property, plant and equipment, net
|
34,508
|
25,665
|
||||||
|
Goodwill
|
10,045
|
10,259
|
||||||
|
Intangible assets, net
|
8,445
|
10,164
|
||||||
|
Deferred tax assets, net of liabilities
|
4,797
|
5,814
|
||||||
|
Total assets
|
$
|
144,873
|
$
|
126,607
|
||||
|
Liabilities and shareholders’ equity
|
||||||||
|
Current liabilities:
|
||||||||
|
Accounts payable
|
$
|
5,830
|
$
|
4,806
|
||||
|
Accrued compensation
|
6,702
|
4,580
|
||||||
|
Accrued expenses
|
3,626
|
3,016
|
||||||
|
Accrued royalties
|
226
|
230
|
||||||
|
Current portion of deferred revenue
|
273
|
391
|
||||||
|
Total current liabilities
|
16,657
|
13,023
|
||||||
|
Long-term deferred revenue, net of current portion
|
–
|
202
|
||||||
|
Long-term deferred tax liabilities
|
72
|
42
|
||||||
|
Total long-term liabilities
|
72
|
244
|
||||||
|
Commitments and contingencies
|
||||||||
|
Shareholders’ equity:
|
||||||||
|
Common stock, $0.01 par value: Authorized shares – 40,000,000 Issued and outstanding shares – 17,386,853 – 2015; 17,202,365 – 2014
|
174
|
172
|
||||||
|
Additional paid-in capital
|
102,123
|
97,324
|
||||||
|
Other
|
(1,186
|
)
|
(725
|
)
|
||||
|
Accumulated earnings
|
27,033
|
16,569
|
||||||
|
Total shareholders’ equity
|
128,144
|
113,340
|
||||||
|
Total liabilities and shareholders’ equity
|
$
|
144,873
|
$
|
126,607
|
||||
See accompanying notes.
43
Vascular Solutions, Inc.
Consolidated Statements of Earnings
(in thousands, except per share amounts)
|
Year Ended December 31,
|
||||||||||||
|
2015
|
2014
|
2013
|
||||||||||
|
Net revenue:
|
||||||||||||
|
Product revenue
|
$
|
146,616
|
$
|
125,666
|
$
|
110,197
|
||||||
|
License, royalty and collaboration revenue
|
584
|
433
|
301
|
|||||||||
|
Total revenue
|
147,200
|
126,099
|
110,498
|
|||||||||
|
Product costs and operating expenses:
|
||||||||||||
|
Cost of goods sold
|
48,903
|
41,699
|
36,156
|
|||||||||
|
Collaboration expenses
|
141
|
165
|
60
|
|||||||||
|
Research and development
|
18,358
|
13,441
|
13,191
|
|||||||||
|
Clinical and regulatory
|
6,323
|
4,979
|
4,408
|
|||||||||
|
Sales and marketing
|
34,085
|
29,825
|
27,372
|
|||||||||
|
General and administrative
|
22,583
|
12,986
|
8,991
|
|||||||||
|
Litigation settlement
|
–
|
–
|
1,332
|
|||||||||
|
Medical device excise taxes
|
1,593
|
1,435
|
1,319
|
|||||||||
|
Amortization of purchased technology and intangibles
|
1,615
|
1,642
|
1,572
|
|||||||||
|
Total product costs and operating expenses
|
133,601
|
106,172
|
94,401
|
|||||||||
|
Operating earnings
|
13,599
|
19,927
|
16,097
|
|||||||||
|
Other income (expenses)
|
42
|
(15
|
)
|
(14
|
)
|
|||||||
|
Earnings before income taxes
|
13,641
|
19,912
|
16,083
|
|||||||||
|
Income tax expense
|
(3,177
|
)
|
(7,178
|
)
|
(4,941
|
)
|
||||||
|
Net earnings
|
$
|
10,464
|
$
|
12,734
|
$
|
11,142
|
||||||
|
Basic net earnings per common share
|
$
|
0.61
|
$
|
0.75
|
$
|
0.68
|
||||||
|
Diluted net earnings per common share
|
$
|
0.58
|
$
|
0.72
|
$
|
0.65
|
||||||
|
Shares used in computing basic net earnings per common share
|
17,104
|
16,892
|
16,412
|
|||||||||
|
Shares used in computing diluted net earnings per common share
|
18,048
|
17,711
|
17,025
|
|||||||||
See accompanying notes.
44
Vascular Solutions, Inc.
Consolidated Statements of Comprehensive Earnings
(in thousands)
|
Year Ended December 31,
|
||||||||||||
|
2015
|
2014
|
2013
|
||||||||||
|
Net earnings
|
$
|
10,464
|
$
|
12,734
|
$
|
11,142
|
||||||
|
Other comprehensive earnings (loss), net of tax of $0: Foreign currency translation adjustments
|
(461
|
)
|
(724
|
)
|
149
|
|||||||
|
Comprehensive earnings
|
$
|
10,003
|
$
|
12,010
|
$
|
11,291
|
||||||
See accompanying notes.
45
Vascular Solutions, Inc.
Consolidated Statements of Changes in Shareholders’ Equity
(dollars in thousands)
|
Common Stock
|
Additional
Paid-In
Capital
|
Other
|
Accumulated
Earnings (Deficit)
|
Total
|
||||||||||||||||||||
|
Shares
|
Amount
|
|||||||||||||||||||||||
|
Balance at December 31, 2012
|
16,378,923
|
$
|
164
|
$
|
84,160
|
$
|
(150
|
)
|
$
|
(7,307
|
)
|
$
|
76,867
|
|||||||||||
|
Exercise of stock options
|
354,300
|
4
|
2,780
|
–
|
–
|
2,784
|
||||||||||||||||||
|
Issuance of common stock under the Employee Stock Purchase Plan
|
124,098
|
1
|
1,191
|
–
|
–
|
1,192
|
||||||||||||||||||
|
Stock-based compensation
|
183,034
|
2
|
3,341
|
–
|
–
|
3,343
|
||||||||||||||||||
|
Repurchase and cancellation of common stock upon the vesting of restricted shares
|
(75,402
|
)
|
(1
|
)
|
(1,210
|
)
|
–
|
–
|
(1,211
|
)
|
||||||||||||||
|
Tax benefit from stock-based awards
|
–
|
–
|
2,084
|
–
|
–
|
2,084
|
||||||||||||||||||
|
Comprehensive earnings:
|
||||||||||||||||||||||||
|
Net earnings
|
–
|
–
|
–
|
–
|
11,142
|
11,142
|
||||||||||||||||||
|
Translation adjustment
|
–
|
–
|
–
|
149
|
–
|
149
|
||||||||||||||||||
|
Total comprehensive earnings
|
11,291
|
|||||||||||||||||||||||
|
Balance at December 31, 2013
|
16,964,953
|
$
|
170
|
$
|
92,346
|
$
|
(1
|
)
|
$
|
3,835
|
$
|
96,350
|
||||||||||||
|
Exercise of stock options
|
102,000
|
1
|
970
|
–
|
–
|
971
|
||||||||||||||||||
|
Issuance of common stock under the Employee Stock Purchase Plan
|
103,467
|
1
|
1,434
|
–
|
–
|
1,435
|
||||||||||||||||||
|
Stock-based compensation
|
165,911
|
1
|
3,881
|
–
|
–
|
3,882
|
||||||||||||||||||
|
Repurchase and cancellation of common stock upon the vesting of restricted shares
|
(100,565
|
)
|
(1
|
)
|
(2,311
|
)
|
–
|
–
|
(2,312
|
)
|
||||||||||||||
|
Repurchase of common stock under stock repurchase agreement
|
(33,401
|
)
|
–
|
(819
|
)
|
–
|
–
|
(819
|
)
|
|||||||||||||||
|
Tax benefit from stock-based awards
|
–
|
–
|
1,823
|
–
|
–
|
1,823
|
||||||||||||||||||
|
Comprehensive earnings:
|
||||||||||||||||||||||||
|
Net earnings
|
–
|
–
|
–
|
–
|
12,734
|
12,734
|
||||||||||||||||||
|
Translation adjustment
|
–
|
–
|
–
|
(724
|
)
|
–
|
(724
|
)
|
||||||||||||||||
|
Total comprehensive earnings
|
12,010
|
|||||||||||||||||||||||
|
Balance at December 31, 2014
|
17,202,365
|
$
|
172
|
$
|
97,324
|
$
|
(725
|
)
|
$
|
16,569
|
$
|
113,340
|
||||||||||||
|
Exercise of stock options
|
52,000
|
1
|
417
|
–
|
–
|
418
|
||||||||||||||||||
|
Issuance of common stock under the Employee Stock Purchase Plan
|
89,170
|
1
|
1,647
|
–
|
–
|
1,648
|
||||||||||||||||||
|
Stock-based compensation
|
125,302
|
1
|
4,125
|
–
|
–
|
4,126
|
||||||||||||||||||
|
Repurchase and cancellation of common stock upon the vesting of restricted shares
|
(81,984
|
)
|
(1
|
)
|
(2,332
|
)
|
–
|
–
|
(2,333
|
)
|
||||||||||||||
|
Tax benefit from stock-based awards
|
–
|
–
|
942
|
–
|
–
|
942
|
||||||||||||||||||
|
Comprehensive earnings:
|
||||||||||||||||||||||||
|
Net earnings
|
–
|
–
|
–
|
–
|
10,464
|
10,464
|
||||||||||||||||||
|
Translation adjustment
|
–
|
–
|
–
|
(461
|
)
|
–
|
(461
|
)
|
||||||||||||||||
|
Total comprehensive earnings
|
10,003
|
|||||||||||||||||||||||
|
Balance at December 31, 2015
|
17,386,853
|
$
|
174
|
$
|
102,123
|
$
|
(1,186
|
)
|
$
|
27,033
|
$
|
128,144
|
||||||||||||
See accompanying notes.
46
Vascular Solutions, Inc.
Consolidated Statements of Cash Flows
(in thousands)
|
Year Ended December 31,
|
||||||||||||
|
2015
|
2014
|
2013
|
||||||||||
|
Operating activities
|
||||||||||||
|
Net earnings
|
$
|
10,464
|
$
|
12,734
|
$
|
11,142
|
||||||
|
Adjustments to reconcile net earnings to net cash provided by operating activities:
|
||||||||||||
|
Depreciation
|
4,381
|
3,257
|
2,861
|
|||||||||
|
Amortization
|
1,615
|
1,642
|
1,572
|
|||||||||
|
Stock-based compensation
|
4,126
|
3,882
|
3,343
|
|||||||||
|
Deferred taxes, net
|
1,051
|
1,971
|
3,138
|
|||||||||
|
Tax benefit from stock-based awards
|
(942
|
)
|
(1,823
|
)
|
(2,084
|
)
|
||||||
|
Gain on disposal of fixed assets
|
–
|
(24
|
)
|
(17
|
)
|
|||||||
|
Change in fair value of contingent consideration
|
–
|
–
|
(79
|
)
|
||||||||
|
Change in accounts receivable allowance
|
60
|
100
|
15
|
|||||||||
|
Changes in operating assets and liabilities:
|
||||||||||||
|
Accounts receivable
|
(2,092
|
)
|
(2,741
|
)
|
(713
|
)
|
||||||
|
Inventories
|
(6,256
|
)
|
(1,909
|
)
|
(435
|
)
|
||||||
|
Prepaid expenses and other
|
1,857
|
(948
|
)
|
158
|
||||||||
|
Accounts payable
|
1,063
|
1,086
|
(86
|
)
|
||||||||
|
Accrued compensation and expenses
|
2,747
|
622
|
485
|
|||||||||
|
Amortization of deferred license fees and other deferred revenue
|
(320
|
)
|
(370
|
)
|
86
|
|||||||
|
Net cash provided by operating activities
|
17,754
|
17,479
|
19,386
|
|||||||||
|
Investing activities
|
||||||||||||
|
Purchase of property and equipment
|
(10,605
|
)
|
(5,681
|
)
|
(4,234
|
)
|
||||||
|
Purchase of building and land
|
(2,748
|
)
|
(7,123
|
)
|
–
|
|||||||
|
Proceeds from the sale of equipment
|
–
|
28
|
22
|
|||||||||
|
Cash paid for acquisitions
|
–
|
–
|
(820
|
)
|
||||||||
|
Net cash used in investing activities
|
(13,353
|
)
|
(12,776
|
)
|
(5,032
|
)
|
||||||
|
Financing activities
|
||||||||||||
|
Net proceeds from the exercise of stock options
|
418
|
971
|
2,784
|
|||||||||
|
Net proceeds from the sale of common stock, employee stock purchase plan
|
1,648
|
1,435
|
1,192
|
|||||||||
|
Tax benefit from stock-based awards
|
942
|
1,823
|
2,084
|
|||||||||
|
Repurchase of common shares
|
(2,333
|
)
|
(3,131
|
)
|
(1,211
|
)
|
||||||
|
Net cash provided by financing activities
|
675
|
1,098
|
4,849
|
|||||||||
|
Effect of exchange rate changes on cash and cash equivalents
|
(46
|
)
|
(125
|
)
|
28
|
|||||||
|
Increase in cash and cash equivalents
|
5,030
|
5,676
|
19,231
|
|||||||||
|
Cash and cash equivalents at beginning of year
|
36,461
|
30,785
|
11,554
|
|||||||||
|
Cash and cash equivalents at end of year
|
$
|
41,491
|
$
|
36,461
|
$
|
30,785
|
||||||
|
Supplemental disclosure of cash flow
|
||||||||||||
|
Cash paid for interest
|
$
|
–
|
$
|
3
|
$
|
13
|
||||||
|
Cash paid for federal and state income taxes
|
$
|
2,490
|
$
|
3,769
|
$
|
1,673
|
||||||
See accompanying notes
47
1. Description of Business
Vascular Solutions, Inc. (the Company) is a medical device company focused on bringing clinically advanced solutions to interventional cardiologists and interventional radiologists. In order to provide a detailed product-specific revenue analysis, in the first quarter of 2015 the Company began reporting net revenue of the top product lines. The top product lines in 2015 were as follows:
| 1. | GuideLiner® catheter, used to access discrete regions of the coronary anatomy. |
| 2. | Pronto® extraction catheters, used in treating acute myocardial infarction. |
| 3. | Vein catheter reprocessing service for the ClosureFAST® radiofrequency vein ablation catheter. |
| 4. | Micro-introducer kits, used to gain percutaneous access to the vasculature to perform minimally invasive procedures. |
| 5. | Hemostatic patches, consisting principally of blood clotting products, such as the D-Stat® Dry hemostat, a topical thrombin-based pad with a bandage used to control surface bleeding. |
| 6. | Radial access products, includes products such as the Accumed™ wrist positioning splints and Vasc Band™ inflatable compression bands. |
| 7. | Langston® catheters, used for the measurement of intravascular pressure gradients, primarily to diagnose aortic valve stenosis. |
| 8. | D-Stat® Flowable hemostat, a thick yet flowable thrombin-based mixture for preventing bleeding in subcutaneous pockets. |
As a vertically-integrated medical device company, the Company generates ideas and creates new minimally invasive devices or services and then delivers these products and services to the physicians through a direct domestic sales force and an international distribution network. The Company was incorporated in the state of Minnesota in December 1996 and began operations in February 1997.
2. Summary of Significant Accounting Policies
Basis of Consolidation
The consolidated financial statements include the accounts of Vascular Solutions, Inc. and its wholly-owned subsidiary Vascular Solutions Zerusa Limited, after elimination of intercompany accounts and transactions.
Segment Reporting
The Company’s chief operating decision maker ("CODM") is its Chief Executive Officer. A business segment is a distinguishable component of an enterprise that is engaged in providing an individual product or service or a group of related products or services and that is subject to risks and returns that are different from those of other business segments. The Company’s segments have similar economic characteristics and are similar in the nature of the products sold, type of customers, methods used to distribute the Company’s products and regulatory environment. Management believes that the Company meets the criteria for aggregating its operating segments into a single reporting segment.
48
2. Summary of Significant Accounting Policies (Continued)
The following tables set forth, for the periods indicated, net revenue by product line along with the percentage change from the previous period for each of the Company’s top products by net revenue:
|
Year ended December 31,
|
|||||||||||||||||||||
|
2015
|
2014
|
2013
|
|||||||||||||||||||
|
Product
|
Primary Market
|
Net
Revenue
|
Percent
Change
|
Net
Revenue
|
Percent
Change
|
Net
Revenue
|
|||||||||||||||
|
(dollars in thousands)
|
|||||||||||||||||||||
|
GuideLiner catheters
|
Interventional cardiology
|
$
|
45,409
|
43
|
%
|
$
|
31,836
|
53
|
%
|
$
|
20,782
|
||||||||||
|
Pronto catheters
|
Interventional cardiology
|
14,970
|
(17
|
%)
|
17,998
|
(11
|
%)
|
20,272
|
|||||||||||||
|
Vein catheter reprocessing
|
Phlebology
|
12,602
|
23
|
%
|
10,207
|
24
|
%
|
8,204
|
|||||||||||||
|
Micro-introducer kits
|
Interventional radiology
|
12,337
|
18
|
%
|
10,416
|
17
|
%
|
8,894
|
|||||||||||||
|
Hemostatic patches
|
Interventional cardiology
|
11,998
|
(3
|
%)
|
12,416
|
(5
|
%)
|
13,068
|
|||||||||||||
|
Radial access products
|
Interventional cardiology
|
7,436
|
27
|
%
|
5,839
|
34
|
%
|
4,347
|
|||||||||||||
|
Langston catheters
|
Interventional cardiology
|
6,590
|
8
|
%
|
6,109
|
6
|
%
|
5,781
|
|||||||||||||
|
D-Stat Flowable hemostat
|
Electrophysiology
|
5,322
|
(3
|
%)
|
5,462
|
(4
|
%)
|
5,697
|
|||||||||||||
Foreign Currency Translation and Transactions
The functional currency of the company's foreign operations is the applicable local currency. The functional currency is translated into U.S. dollars for balance sheet accounts using current exchange rates in effect as of the balance sheet date and for revenue and expense accounts using a weighted-average exchange rate during the fiscal year. The translation adjustments are deferred as a component of other comprehensive income within the consolidated statements of comprehensive income and the consolidated statements of shareholders’ equity. Gains or losses resulting from transactions denominated in foreign currencies are included in other income, net in the consolidated statements of earnings.
The Company sells products to an international distributor in Germany at prices denominated in Euros. As a result, the Company is exposed to foreign exchange movements during the time between the shipment of the product and payment. The Company currently has terms of net 60 days with this distributor under the agreement providing for payment in Euros.
Comprehensive Earnings
The components of comprehensive earnings are net earnings and the effects of foreign currency translation adjustments. The accumulated other comprehensive earnings for the foreign currency translation adjustment at December 31, 2015 and 2014 was ($1,186,000) and ($725,000), respectively.
Fair Value of Financial Instruments
The carrying amount for cash and cash equivalents, accounts receivable, accounts payable, and accrued expenses approximates fair value due to the immediate or short-term maturity of these financial instruments.
Use of Estimates
The preparation of financial statements in conformity with accounting principles generally accepted in the United States requires management to make estimates and assumptions that affect the reported amounts of deferred tax assets and liabilities, as well as other amounts in the financial statements and accompanying notes. Actual results could differ from those estimates.
49
2. Summary of Significant Accounting Policies (Continued)
Cash and Cash Equivalents
The Company classifies all highly liquid investments with initial maturities of three months at the date of purchase or less as cash equivalents. Cash equivalents consist of cash and money market funds and are stated at cost, which approximates market value. The Company deposits its cash in high quality financial institutions. The balances, at times, may exceed federally insured limits.
Credit Risk and Allowance for Doubtful Accounts
The Company maintains allowances for doubtful accounts for estimated losses resulting from the inability of its customers to make required payments. This allowance is regularly evaluated by the Company for adequacy by taking into consideration factors such as past experience, credit quality of the customer base, age of the receivable balances, both individually and in the aggregate, and current economic conditions that may affect a customer’s ability to pay. Accounts receivable over 60 days past due are considered past due. The Company does not accrue interest on past due accounts receivable. Receivables are written off only after all collection attempts have failed and are based on individual credit evaluation and the specific circumstances of the customer. At December 31, 2015 and 2014, the allowance for doubtful accounts was $285,000 and $220,000, respectively.
All product returns must be pre-approved and, if approved, customers are subject to a 20% restocking charge. The Company analyzes the rate of historical returns when evaluating the adequacy of the allowance for sales returns, which is included with the allowance for doubtful accounts on its balance sheet. At December 31, 2015 and 2014, the sales and return allowance was $75,000 and $80,000, respectively.
Accounts receivable are shown net of the combined total of the allowance for doubtful accounts and allowance for sales returns of $360,000 and $300,000 at December 31, 2015 and 2014, respectively.
Inventories
Inventories are stated at the lower of cost (weighted average first-in, first-out method) or market. Appropriate consideration is given to deterioration, obsolescence and other factors in evaluating net realizable value. Inventories are comprised of the following at December 31:
|
2015
|
2014
|
|||||||
|
(in thousands)
|
||||||||
|
Raw materials
|
$
|
10,760
|
$
|
8,251
|
||||
|
Work-in-process
|
1,789
|
1,139
|
||||||
|
Finished goods
|
9,556
|
6,518
|
||||||
|
$
|
22,105
|
$
|
15,908
|
|||||
Property, Plant and Equipment
Property, plant and equipment are stated at cost. Depreciation is provided on a straight-line basis over the estimated useful lives of the assets as follows:
|
Manufacturing equipment
|
1 to 10 years
|
|
Office and computer equipment
|
1 to 5 years
|
|
Furniture and fixtures
|
3 to 8 years
|
|
Leasehold improvements
|
Shorter of useful life or remaining term of the lease
|
|
Research and development equipment
|
2 to 7 years
|
|
Building improvements
|
1 to 30 years
|
|
Building
|
30 years
|
50
2. Summary of Significant Accounting Policies (Continued)
Impairment of Long-Lived Assets
The Company will record impairment losses on long-lived assets when indicators of impairment are present and the undiscounted cash flows estimated to be generated by those assets are less than the assets’ carrying amount. The amount of impairment loss recorded will be measured as the amount by which the carrying value of the assets exceeds the fair value of the assets. To date, the Company has determined that no impairment of long-lived assets exists.
Revenue Recognition
In the United States, the Company sells its products and services directly to hospitals and clinics. Revenue is recognized in accordance with generally accepted accounting principles as outlined in Accounting Standards Codification (“ASC”) 605-10-S99, Revenue Recognition, which requires that four basic criteria be met before revenue can be recognized: (i) persuasive evidence of an arrangement exists; (ii) the price is fixed or determinable; (iii) collectability is reasonably assured; and (iv) product delivery has occurred or services have been rendered. The Company recognizes revenue as products are shipped based on FOB shipping point terms when title passes to customers. The Company negotiates credit terms on a customer-by-customer basis and products are shipped at an agreed-upon price.
In all international markets, the Company sells its products to international distributors which subsequently resell the products to hospitals and clinics. The Company has agreements with each of its distributors that provide that title and risk of loss pass to the distributor upon shipment of the products to the distributor. The Company warrants that its products are free from manufacturing defects at the time of shipment to the distributor. Revenue is recognized upon shipment of products to distributors following the receipt and acceptance of a distributor’s purchase order and is reported on a gross basis. Allowances are provided for estimated returns and costs at the time of shipment. Sales and use taxes are reported on a net basis, excluding them from revenue.
The Company’s revenues from license agreements and research collaborations are recognized when earned (see Note 13). In accordance with ASC 605, for revenues which contain multiple deliverables, the Company separates the deliverables into separate accounting units if they meet the following criteria: (i) the delivered items have a stand-alone value to the customer; (ii) the fair value of any undelivered items can be reliably determined; and (iii) if the arrangement includes a general right of return, delivery of the undelivered items is probable and substantially controlled by the seller. Deliverables that do not meet these criteria are combined with one or more other deliverables into one accounting unit. Revenue from each accounting unit is recognized based on the applicable accounting literature, primarily ASC 605.
The Company currently has a license agreement with King Pharmaceuticals, Inc. (King), now a subsidiary of Pfizer, Inc., under which the Company licensed the exclusive rights of Thrombi-Pad™, Thrombi-Gel® and Thrombi-Paste ™ products to King in exchange for a license fee. The Company is amortizing the license fees on a straight-line basis over the projected 10 year economic life of the products. The Company determines the economic life of the products under its license agreements by evaluating similar products the Company has launched or other similar products in the medical industry. In addition, the Company had a five-year license agreement with Nicolai, GmbH in which the Company was amortizing the license fee on a straight-line basis over the five-year life of the agreement. This agreement was fully amortized during 2013.
Starting in January 2012, the Company began to generate revenue from selling a reprocessing service for ClosureFAST radiofrequency catheters. In accordance with ASC 605-45, the Company recognizes this revenue gross, with the amount paid to the supplier of the reprocessing service reflected as cost of sales.
In addition, the Company has reviewed the provisions of ASC 808, Collaborative Arrangements, and the adoption of this ASC has had no impact on the amounts recorded under these agreements.
51
2. Summary of Significant Accounting Policies (Continued)
Shipping and Handling Costs
In accordance with the ASC 605-45-45, the Company includes shipping and handling revenues in net revenue and shipping and handling costs in cost of goods sold.
Research and Development Costs
All research and development costs are charged to operations as incurred.
Warranty Costs
Certain of the Company’s products are covered by warranties against defects in material and workmanship for periods of up to 24 months. The Company records a liability for warranty claims at the time of sale. The amount of the liability is based on the amount the Company is charged from its original equipment manufacturer to cover the warranty period. The original equipment manufacturers include a one year warranty with each product sold to the Company. The Company records a liability for the uncovered warranty period offered to a customer, provided the warranty period offered exceeds the initial one year warranty period covered by the original equipment manufacturers. Each of the Company’s manufacturer’s warranties covers the first year of service and as a result the Company’s exposure to uncovered warranty periods was minimal at December 31, 2015.
Warranty provisions and claims for the years ended December 31, 2015, 2014 and 2013, were as follows:
|
2015
|
2014
|
2013
|
||||||||||
|
(in thousands)
|
||||||||||||
|
Beginning balance
|
$
|
19
|
$
|
23
|
$
|
29
|
||||||
|
Warranty provisions
|
75
|
63
|
69
|
|||||||||
|
Warranty claims
|
(76
|
)
|
(67
|
)
|
(75
|
)
|
||||||
|
Ending balance
|
$
|
18
|
$
|
19
|
$
|
23
|
||||||
Advertising Costs
The Company follows the policy of charging production costs of advertising to expense as incurred. Advertising expense was $129,000, $127,000 and $119,000 for the years ended December 31, 2015, 2014 and 2013, respectively.
Stock-Based Compensation
The Company has various types of stock-based compensation plans. These plans are administered by the Compensation Committee of the Board of Directors, which selects persons to receive awards and determines the number of shares subject to each award and the terms, conditions, performance measures and other provisions of the award. Refer to Notes 7 and 8 for additional information related to these stock-based compensation plans.
52
2. Summary of Significant Accounting Policies (Continued)
The following amounts have been recognized as stock-based compensation expense in the Consolidated Statements of Operations:
|
2015
|
2014
|
2013
|
||||||||||
|
(in thousands)
|
||||||||||||
|
Stock-based compensation included in:
|
||||||||||||
|
Cost of goods sold
|
$
|
355
|
$
|
282
|
$
|
196
|
||||||
|
Research and development
|
551
|
493
|
373
|
|||||||||
|
Clinical and regulatory
|
399
|
363
|
322
|
|||||||||
|
Sales and marketing
|
830
|
901
|
858
|
|||||||||
|
General and administrative
|
1,991
|
1,843
|
1,594
|
|||||||||
|
$
|
4,126
|
$
|
3,882
|
$
|
3,343
|
|||||||
The Company uses the Black-Scholes option-pricing model to estimate fair value of stock-based awards with the following weighted average assumptions:
|
2015
|
2014
|
2013
|
||||||||||
|
Employee Stock Purchase Plan:
|
||||||||||||
|
Expected life (years)
|
2.0
|
2.0
|
2.0
|
|||||||||
|
Expected volatility
|
35
|
%
|
27
|
%
|
29
|
%
|
||||||
|
Dividend yield
|
0
|
%
|
0
|
%
|
0
|
%
|
||||||
|
Risk-free interest rate
|
0.64
|
%
|
0.44
|
%
|
0.32
|
%
|
||||||
Restricted stock awards fair value is calculated as the market price on the date of grant for the years ended December 31, 2015, 2014 and 2013 and the fair value is amortized on a straight-line basis over the requisite service period of four or nine years for employee awards and one year for board of director awards. The weighted average fair value of restricted stock awards granted during 2015, 2014 and 2013 was $28.38, $24.24, and $16.31, respectively.
There were no stock option grants during 2015, 2014 and 2013.
The Company calculates expected volatility for stock options and awards using historical volatility over a period most closely associated with the expected life of the stock option or award. The Company uses a 10% forfeiture rate for key employees and a 15% forfeiture rate for non-key employees for stock options and awards. The Company calculates expected volatility for employee stock purchase plan shares using historical volatility over a two-year period. A two-year period is used to coincide with the maximum two-year offering period under the employee stock purchase plan. The risk-free rates for the expected terms of the stock options and awards and the employee stock purchase plan is based on the U.S. Treasury yield curve in effect at the time of grant.
Income Taxes
Income taxes are accounted for under the liability method. Deferred income taxes are provided for temporary differences between the financial reporting and the tax bases of assets and liabilities. Deferred tax assets are reduced by a valuation allowance to the extent that realization of the related deferred tax asset is not assured. If the Company determines in the future that it is more likely than not that the Company will realize all or a portion of the deferred tax assets, the Company will adjust the valuation allowance in the period the determination is made (see Note 6).
53
2. Summary of Significant Accounting Policies (Continued)
When tax returns are filed, it is highly likely that some positions taken would be sustained upon examination by the taxing authorities, while others are subject to uncertainty about the merits of the position taken or the amount of the position that would be ultimately sustained. The benefit of a tax position is recognized in the financial statements in the period during which, based on all available evidence, management believes it is more-likely-than-not that the position will be sustained upon examination, including the resolution of appeals or litigation processes, if any. Tax positions taken are not offset or aggregated with other positions. Tax positions that meet the more-likely-than-not recognition threshold are measured as the largest amount of tax benefit that is more than 50 percent likely of being realized upon settlement with the applicable taxing authority. The portion of the benefits associated with tax positions taken that exceeds the amount measured as described above is reflected as a liability for unrecognized tax benefits in the accompanying balance sheet along with any associated interest and penalties that would be payable to the taxing authorities upon examination.
The Company has recorded ASC 740, Income Taxes, reserves of $379,000 and $1,262,000 at December 31, 2015 and 2014. The decrease of $883,000 in the ASC 740 reserve for uncertain tax positions was due to a reduction in the reserve recorded following completion of IRS exams of tax years 2013 and 2014. The impact of tax related interest and penalties is recorded as a component of income tax expense. At December 31, 2015, the Company has recorded $-0- for the payment of tax related interest and there were no tax penalties or interest recognized in the consolidated statements of earnings.
Net Earnings Per Common Share
In accordance with ASC 260, Earnings Per Share, basic net earnings per common share is computed by dividing net earnings by the weighted average common shares outstanding during the periods presented. Diluted net earnings per common share is computed by dividing net earnings by the weighted average common and potential dilutive common shares outstanding computed in accordance with the treasury stock method.
The number of shares used in earnings per share computations is as follows for the years ended December 31:
|
2015
|
2014
|
2013
|
||||||||||
|
Weighted average common shares outstanding— basic
|
17,103,613
|
16,891,643
|
16,412,322
|
|||||||||
|
Effect of dilutive securities
|
944,048
|
818,919
|
612,768
|
|||||||||
|
Weighted average common shares outstanding— diluted
|
18,047,661
|
17,710,562
|
17,025,090
|
|||||||||
The above table related to the weighted average common shares outstanding basic, excludes unvested restricted stock awards of 215,114, 264,298 and 317,072 for the years ended December 31, 2015, 2014 and 2013, respectively.
The effect of dilutive securities in the above table excludes no options for which the exercise price was higher than the average market price for the three years ended December 31, 2015, 2014 and 2013, respectively.
Goodwill and Other Intangible Assets
Goodwill is reviewed for impairment annually on December 31st or more frequently if changes in circumstances or the occurrence of events suggest impairment exists using a two-step process. In step 0, the Company can elect to perform an optional quantitative analysis and based on the results, skip the remaining two steps. Consistent with prior years, in the current year the Company chose to skip step 0 and perform a quantitative analysis in step 1. In step 1, the fair value of each reporting unit is compared to its carrying value, including goodwill. If the fair value exceeds the carrying value, no further work is required and no impairment loss is recognized. If the carrying value exceeds the fair value, the goodwill of the reporting unit is potentially impaired and the Company would then complete step 2 in order to measure the impairment loss. In step 2, the Company would calculate the implied fair value of goodwill by deducting the fair value of all tangible and intangible net assets (including unrecognized intangible assets) of the reporting unit from the fair value of the reporting unit. If the implied fair value of goodwill is less than the carrying value of goodwill, the Company would recognize an impairment loss, in the period identified, equal to the difference. The Company has concluded that no impairment of goodwill existed as of December 31, 2015.
54
2. Summary of Significant Accounting Policies (Continued)
Other intangible assets consist of purchased technology, trademark/tradename, developed technology, customer relationships and purchased licenses. The Company reviewed intangible assets for impairment as changes in circumstances or the occurrence of events suggested the remaining value was not recoverable.
Amortization on the intangibles is provided on a straight-line basis over the estimated useful lives of the assets as follows:
|
Trademark/tradename
|
10 to 11 years
|
|
Purchased and developed technology
|
9 to 11 years
|
|
Customer relationships
|
9 years
|
|
Licenses
|
5 to 10 years
|
Leases and Deferred Rent
On March 2, 2015, the Company closed on the purchase of a manufacturing and office building containing approximately 26,000 square feet located adjacent to the Company’s primary manufacturing facility.
On December 1, 2014, the Company closed on the purchase of its primary manufacturing facility containing 79,000 square-feet. This building was leased by the Company prior to the purchase.
On November 30, 2012, the Company closed on the purchase of an office building located next to its primary manufacturing facility. The Company occupies approximately 50,000 square feet of the building and leases the remaining 26,000 square feet of the building to third-party tenants.
During the years ended December 31, 2015 and 2014, the Company leased additional warehouse and manufacturing space. Leases are accounted for under the provisions of ASC 840, Leases, which requires that leases be evaluated and classified as operating or capital leases for financial reporting purposes. As of both December 31, 2015 and 2014, all of the Company’s leases were accounted for as operating leases. For leases that contain rent escalations, the Company records the total rent payable during the lease term on a straight-line basis over the term of the lease and records the difference between the rents paid and the straight-line rent as a deferred rent. For any lease incentives the Company receives for items such as leasehold improvements, the Company records a deferred credit for the amount of the lease incentive and amortizes it over the lease term, which may or may not equal the amortization period of the leasehold improvements in accordance with ASC 840-20.
Recently Issued Accounting Pronouncements
In May 2014, the Financial Accounting Standards Board (FASB) issued guidance creating ASC 606, “Revenue from Contracts with Customers.” The new section will replace ASC 605, “Revenue Recognition” and creates modifications to various other revenue accounting standards for specialized transactions and industries. The new ASC is intended to conform United States revenue accounting principles with concurrently issued International Financial Reporting Standards. Prior to the guidance, revenue recognition differed between United States practice and those of much of the rest of the world. The guidance also is intended to enhance disclosures related to disaggregated revenue information. The updated guidance is effective for annual reporting periods beginning on or after December 15, 2017, and interim periods within those annual periods.
55
2. Summary of Significant Accounting Policies (Continued)
The Company will adopt the new provisions of this accounting standard at the beginning of fiscal year 2018. The Company does not expect adoption will have a material impact on the consolidated financial statements.
In November 2015 the FASB issued Accounting Standards Update (ASU) 2015-17, Income Taxes (Topic 740) Related to the Balance Sheet Classification of Deferred Taxes which will require entities to present deferred tax assets (DTAs) and deferred tax liabilities (DTLs) as noncurrent in a classified balance sheet. The ASU simplifies the current guidance (ASC 740-10-45-4), which requires entities to separately present DTAs and DTLs as current and noncurrent in a classified balance sheet. The ASU is effective for annual reporting periods beginning on or after December 15, 2016, and interim periods within those annual periods. The Board decided to allow all entities to early adopt the ASU for financial statements that had not been issued. Therefore, the Company has adopted this ASU at December 31, 2015, and has reclassified all prior periods to be consistent with the requirements outlined in the ASU. The impact of the prior period reclassification was a $3,681,000 reduction of current assets and working capital at December 31, 2014.
In July 2015, the FASB issued Accounting Standards Update (“ASU”) 2015-11, Inventory (Topic 330) Related to Simplifying the Measurement of Inventory which applies to all inventory except inventory that is measured using last-in, first-out (“LIFO”) or the retail inventory method. Inventory measured using first-in, first-out (“FIFO”) or average cost is covered by the new amendments. Inventory within the scope of the new guidance should be measured at the lower of cost and net realizable value. Net realizable value is the estimated selling prices in the ordinary course of business, less reasonably predictable costs of completion, disposal, and transportation. Subsequent measurement is unchanged for inventory measured using LIFO or the retail inventory method. The amendments will take effect for public business entities for fiscal years beginning after December 15, 2016, including interim periods within those fiscal years. The new guidance should be applied prospectively, and earlier application is permitted as of the beginning of an interim or annual reporting period. The Company is evaluating the impact of the standard on its consolidated financial statements.
Reclassification
Certain prior period disclosures have been reclassified to conform to current year presentation. These reclassifications are considered immaterial.
3. Goodwill and Other Intangible Assets
The Company acquired trademark/tradename, developed technology and customer relationships most recently from the following companies:
| · | Accumed Systems, Inc. (Accumed) in June 2012, |
| · | St. Jude Medical in August 2012, and |
| · | Shepherd Scientific, Inc. (Shepherd Scientific) in December 2012 |
The Company is amortizing these intangibles over their useful lives of 9 to 11 years. The goodwill acquired in the same transactions will not be amortized. In January 2012, the Company acquired the rights, patents and intellectual property relating to a two-lumen catheter for distal protection and material extraction used in the Company’s Pronto catheters. In September 2013, the Company entered into a services agreement with Northeast Scientific, Inc. to obtain FDA approval for reprocessing another medical device (see Note 14). Amortization expense was $1,615,000, $1,642,000 and $1,572,000 for the years ended December 31, 2015, 2014 and 2013, respectively.
56
3. Goodwill and Other Intangible Assets (Continued)
Balances of acquired intangible assets as of December 31, 2015 were as follows:
|
Carrying Amount
|
Accumulated
Amortization
|
Net
|
||||||||||
|
(in thousands)
|
||||||||||||
|
Amortizing intangibles:
|
||||||||||||
|
Purchased and developed technology
|
$
|
8,140
|
$
|
3,996
|
$
|
4,144
|
||||||
|
Purchased licenses
|
5,050
|
2,020
|
3,030
|
|||||||||
|
Trademark / tradename
|
2,210
|
960
|
1,250
|
|||||||||
|
Customer relationships
|
640
|
276
|
364
|
|||||||||
|
Foreign currency translation adjustments
|
(352
|
)
|
(9
|
)
|
(343
|
)
|
||||||
|
$
|
15,688
|
$
|
7,243
|
$
|
8,445
|
|||||||
Balances of acquired intangible assets as of December 31, 2014 were as follows:
|
Carrying Amount
|
Accumulated
Amortization
|
Net
|
||||||||||
|
(in thousands)
|
||||||||||||
|
Amortizing intangibles:
|
||||||||||||
|
Purchased and developed technology
|
$
|
8,140
|
$
|
3,216
|
$
|
4,924
|
||||||
|
Purchased licenses
|
5,050
|
1,515
|
3,535
|
|||||||||
|
Trademark / tradename
|
2,210
|
806
|
1,404
|
|||||||||
|
Customer relationships
|
640
|
204
|
436
|
|||||||||
|
Foreign currency translation adjustments
|
(190
|
)
|
(55
|
)
|
(135
|
)
|
||||||
|
$
|
15,850
|
$
|
5,686
|
$
|
10,164
|
|||||||
Based on the intangibles assets as of December 31, 2015, future amortization expense will be as follows:
|
(in thousands)
|
||||
|
2016
|
$
|
1,817
|
||
|
2017
|
1,644
|
|||
|
2018
|
1,644
|
|||
|
2019
|
1,352
|
|||
|
2020
|
1,059
|
|||
|
Thereafter
|
929
|
|||
|
$
|
8,445
|
|||
The following table provides a summary of additions and disposals of goodwill for each reporting period:
|
( in thousands)
|
||||
|
Balance at December 31, 2013
|
$
|
10,532
|
||
|
Foreign currency translation adjustments
|
(273
|
)
|
||
|
Balance at December 31, 2014
|
$
|
10,259
|
||
|
Foreign currency translation adjustments
|
(214
|
)
|
||
|
Balance at December 31, 2015
|
$
|
10,045
|
||
57
4. Property, Plant and Equipment
Property, plant and equipment consist of the following at December 31:
|
2015
|
2014
|
|||||||
|
Plant and equipment:
|
(in thousands)
|
|||||||
|
Manufacturing equipment
|
$
|
16,555
|
$
|
13,198
|
||||
|
Buildings
|
10,715
|
9,930
|
||||||
|
Office and computer equipment
|
4,576
|
3,647
|
||||||
|
Research and development equipment
|
4,532
|
3,404
|
||||||
|
Building improvements
|
4,353
|
790
|
||||||
|
Leasehold improvements
|
2,585
|
2,526
|
||||||
|
Construction-in-process
|
2,051
|
2,212
|
||||||
|
Furniture and fixtures
|
1,665
|
1,146
|
||||||
|
47,032
|
36,853
|
|||||||
|
Less accumulated depreciation and amortization
|
(19,688
|
)
|
(16,389
|
)
|
||||
|
Net plant and equipment
|
27,344
|
20,464
|
||||||
|
Land
|
7,164
|
5,201
|
||||||
|
Net property, plant and equipment
|
$
|
34,508
|
$
|
25,665
|
||||
5. Leases
The Company leases two buildings in Minnesota totaling approximately 58,000 square-feet under operating leases. One lease in Minnesota, for 26,000 square-feet, expires in December 2016 and the Company does not intend to renew it. The second lease in Minnesota, for 32,000 square-feet, continues to remain in effect through October 2020. The Company also leases one building in Ireland, totaling approximately 5,000 square feet, which continues to remain in effect until July 2020. Rent expense related to the operating leases was approximately $270,000, $1,010,000 and $1,350,000 for the years ended December 31, 2015, 2014, and 2013, respectively.
Future minimum lease commitments under the operating leases as of December 31, 2015 are as follows:
|
(in thousands)
|
||||
|
2016
|
$
|
486
|
||
|
2017
|
214
|
|||
|
2018
|
218
|
|||
|
2019
|
222
|
|||
|
2020
|
171
|
|||
|
$
|
1,311
|
|||
6. Income Taxes
At December 31, 2015, the Company had recorded the following components of deferred taxes with a finite life:
|
2015
|
Expiration
Date
|
||||
|
(in thousands)
|
|||||
|
Federal and Minnesota research and development tax credit carryforwards
|
$
|
1,750
|
Beginning in 2016
|
||
The Company has recorded an allowance of approximately $1,092,000 relating to those research and development tax credit carryforwards expected to expire prior to utilization.
58
6. Income Taxes (Continued)
The Company is subject to income tax in numerous jurisdictions and at various rates and the use of estimates is required in determining the provision for income taxes. For the year ended December 31, 2015, the Company recorded tax expense of $3,177,000 on earnings before tax of $13,641,000 resulting in an effective income tax rate of 23%. For the year ended December 31, 2015, income before taxes relating to U.S. operations was $13,185,000, while income from foreign operations was $456,000. For the year ended December 31, 2014, the Company recorded tax expense of $7,178,000 on earnings before tax of $19,912,000 resulting in an effective income tax rate of 36%. For the year ended December 31, 2014, income before taxes relating to U.S. operations was $19,488,000, while income from foreign operations was $424,000. For the year ended December 31, 2013, the Company recorded tax expense of $4,941,000 on earnings before tax of $16,083,000 resulting in an effective income tax rate of 31%. For the year ended December 31, 2013, income before taxes relating to U.S. operations was $16,080,000, while income before taxes from foreign operations was $3,000.
The Company is subject to income tax examinations in the U.S. Federal jurisdiction, as well as in the Republic of Ireland and various state jurisdictions. U.S. Federal and state tax years that remain open to examination at December 31, 2015 are 2013 through 2015.
A reconciliation of the beginning and ending amount of unrecognized tax benefit is as follows:
|
(in thousands)
|
||||
|
Balance at December 31, 2013
|
$
|
1,268
|
||
|
Increases as a result of tax positions taken during a prior period
|
87
|
|||
|
Increases as a result of tax positions taken during the current period
|
97
|
|||
|
Reductions as a result of lapse of the applicable statute of limitations
|
(32
|
)
|
||
|
Decreases as a result of state credits expected to expire unutilized
|
(158
|
)
|
||
|
Balance at December 31, 2014
|
$
|
1,262
|
||
|
Increases as a result of tax positions taken during a prior period
|
-
|
|||
|
Increases as a result of tax positions taken during the current period
|
277
|
|||
|
Reductions as a result of lapse of the applicable statute of limitations
|
(17
|
)
|
||
|
Reductions as a result of completing federal and state tax examinations
|
(959
|
)
|
||
|
Decreases as a result of state credits expected to expire unutilized
|
(184
|
)
|
||
|
Balance at December 31, 2015
|
$
|
379
|
||
A significant portion of the total of $379,000 relates to unrecognized tax benefits related to research and development credit carryforwards. Therefore, $72,000 has been reflected as a reduction of the related research and development credit carryforward deferred tax asset.
59
6. Income Taxes (Continued)
The components of the Company’s deferred tax assets and liabilities as of December 31, 2015 and 2014 are as follows:
|
2015
|
2014
|
|||||||
|
(in thousands)
|
||||||||
|
Deferred tax assets:
|
||||||||
|
Stock-based compensation
|
$
|
2,454
|
$
|
2,322
|
||||
|
Accrued compensation
|
1,554
|
636
|
||||||
|
Research and development (R&D) credit carryforwards
|
1,750
|
2,681
|
||||||
|
Federal and state AMT credits
|
991
|
993
|
||||||
|
Depreciation and amortization
|
759
|
158
|
||||||
|
Net operating loss carryforwards
|
512
|
471
|
||||||
|
Inventory reserve
|
267
|
522
|
||||||
|
Deferred revenue
|
75
|
154
|
||||||
|
Foreign operations net operating loss carryforwards and timing differences
|
46
|
53
|
||||||
|
Other
|
169
|
104
|
||||||
|
Gross deferred tax assets
|
8,577
|
8,094
|
||||||
|
Deferred tax liability relating to depreciation and amortization
|
(2,340
|
)
|
(803
|
)
|
||||
|
Net deferred taxes assets before reserve for uncertain tax positions and valuation allowances
|
6,237
|
7,291
|
||||||
|
Reserve for uncertain tax positions
|
(72
|
)
|
(346
|
)
|
||||
|
Less valuation allowances
|
(1,440
|
)
|
(1,173
|
)
|
||||
|
Net deferred tax assets
|
$
|
4,725
|
$
|
5,772
|
||||
| 2015 | 2014 | |||||||
|
Deferred taxes recorded on the balance sheet:
|
||||||||
|
Deferred tax assets – U.S.
|
$
|
4,797
|
$
|
5,814
|
||||
|
Deferred tax liabilities – Foreign
|
72
|
42
|
||||||
|
Net deferred tax assets
|
$
|
4,725
|
$
|
5,772
|
||||
The Company regularly assesses the likelihood that the deferred tax assets will be recovered from future taxable earnings. At December 31, 2015 and 2014, the valuation allowance was $1,440,000 and $1,173,000, respectively. The increase (decrease) in the valuation allowance was $267,000, $1,029,000, and ($1,290,000) for the years ended December 31, 2015, 2014 and 2013, respectively. For the year ended December 31, 2014, based upon the Company’s assessment of all available evidence, including estimates of future profitability, the Company’s overall prospects of future business and the apportionment of the Company’s income to the State of Minnesota based on current apportionment methods, the Company determined that it is more likely than not that the Company will not be able to realize all remaining deferred tax assets relating to the Minnesota research and development credits and the Minnesota net operating loss carryforwards prior to their expirations. As a result, the Company recorded additional income tax expense of $867,000 during the third quarter ended September 30, 2014 as a discrete adjustment to the valuation allowance for its deferred tax assets. The Company continues to assess the potential realization of deferred tax assets on a quarterly basis. If the Company’s actual results and updated projections vary significantly from the projections used as a basis for this determination, the Company may need to increase or decrease the valuation allowance against the gross deferred tax assets. The Company does not anticipate the total unrecognized tax benefits will change significantly prior to December 31, 2016. The Company will adjust earnings for the deferred tax in the period in which the determination is made.
60
6. Income Taxes (Continued)
For the years ended December 31, 2015, 2014 and 2013, the Company recorded stock option and employee stock purchase plan tax benefits against “additional paid-in capital” and reduced taxes payable by a corresponding amount of $942,000, $1,823,000 and $2,084,000, respectively.
Reconciliation of the statutory federal income tax rate to the Company’s effective tax rate is as follows:
|
2015
|
2014
|
2013
|
||||||||||
|
U.S. tax at federal statutory rate
|
35.0
|
%
|
35.0
|
%
|
34.0
|
%
|
||||||
|
State income taxes, net of federal benefit
|
2.1
|
2.8
|
4.4
|
|||||||||
|
Permanent differences
|
–
|
(1.3
|
)
|
(0.8
|
)
|
|||||||
|
Change in valuation reserve
|
1.9
|
4.0
|
0.2
|
|||||||||
|
R&D credits generated
|
(7.2
|
)
|
(2.4
|
)
|
(4.2
|
)
|
||||||
|
Reserve for uncertain tax positions
|
0.5
|
(1.8
|
)
|
0.9
|
||||||||
|
Foreign operations tax rate difference
|
(0.9
|
)
|
(0.8
|
)
|
(0.5
|
)
|
||||||
|
Release of R&D credit reserves following federal examinations
|
(7.0
|
)
|
–
|
–
|
||||||||
|
Disallowed federal R&D credits
|
–
|
–
|
(1.9
|
)
|
||||||||
|
Marginal rate versus effective rate differential
|
(0.7
|
)
|
–
|
–
|
||||||||
|
Other adjustments
|
(0.4
|
)
|
0.5
|
(1.0
|
)
|
|||||||
|
Effective income tax rate
|
23.3
|
%
|
36.0
|
%
|
31.1
|
%
|
||||||
|
2015
|
2014
|
2013
|
||||||||||
|
Current taxes
|
19.3
|
%
|
29.6
|
%
|
26.8
|
%
|
||||||
|
Deferred taxes
|
7.7
|
9.9
|
6.6
|
|||||||||
|
Benefit from foreign operation tax rates
|
(0.9
|
)
|
(0.8
|
)
|
(0.5
|
)
|
||||||
|
Benefit from domestic manufacturers deduction
|
(2.8
|
)
|
(2.7
|
)
|
(1.8
|
)
|
||||||
|
Effective income tax rate
|
23.3
|
%
|
36.0
|
%
|
31.1
|
%
|
||||||
7. Stock Options and Restricted Shares
Stock Option and Stock Award Plan
The Company has a stock option and stock award plan (the Stock Option Plan) that provides for the granting of stock options, restricted shares and stock appreciation rights to employees, directors, and consultants. Incentive stock options may be granted only to employees of the Company. Options that do not qualify as incentive stock options and awards of restricted shares may be granted to both employees and to non-employee directors and consultants. As of December 31, 2015, the Company had reserved 5,500,000 shares of common stock under the Stock Option Plan. Under the Stock Option Plan, stock options must be granted at an exercise price not less than the fair market value of the Company’s common stock on the grant date. Vesting requirements of all awards under this plan are time based and vary by individual grant. The options expire on the date determined by the Board of Directors, but may not extend more than 10 years from the grant date. The incentive stock options generally become exercisable over a four-year period and the nonqualified stock options generally become exercisable over a one-year period. Vested and unexercised options are canceled three-months after termination, and unvested awards are canceled on the date of termination of employment and become available under the Stock Option Plan for future grants.
Prior to 2013, the Company granted annual stock options to its directors under the Stock Option Plan. The ten-year options issued to the Company’s directors vested over a one-year period based on the continuation of service as a director of the Company. The Company used a 0% forfeiture rate for all director options granted.
61
7. Stock Options and Restricted Shares (Continued)
In January 2012, the Company granted stock options to the chief executive officer under the Stock Option Plan. The ten-year options issued to the Company’s chief executive officer vest over five successive one-year periods based on the continuation of service with the Company and contain a $1 per share escalation in the exercise price each year. The Company used a 0% forfeiture rate for this option grant.
Option activity is summarized as follows:
|
Shares
Available
for Grant
(less restricted
|
Plan Options
|
Exercise
|
Weighted Average Exercise
|
Aggregate
Intrinsic
|
||||||||||||||
|
shares issued)
|
Outstanding
|
Price
|
Price
|
Value
|
||||||||||||||
|
Balance at December 31, 2012
|
1,927,000
|
1,143,000
|
$
|
0.78–$15.03
|
$
|
10.38
|
||||||||||||
|
Shares reserved
|
500,000
|
–
|
–
|
–
|
||||||||||||||
|
Granted
|
–
|
–
|
–
|
–
|
||||||||||||||
|
Exercised
|
–
|
(354,000
|
)
|
0.78– 11.72
|
7.86
|
|||||||||||||
|
Forfeited
|
–
|
–
|
–
|
–
|
||||||||||||||
|
Expired
|
1,000
|
(1,000
|
)
|
0.84– 5.74
|
5.38
|
|||||||||||||
|
Balance at December 31, 2013
|
2,428,000
|
788,000
|
$
|
6.36–$15.03
|
$
|
11.52
|
||||||||||||
|
Shares reserved
|
–
|
–
|
–
|
–
|
||||||||||||||
|
Granted
|
–
|
–
|
–
|
–
|
||||||||||||||
|
Exercised
|
–
|
(102,000
|
)
|
6.74– 10.89
|
9.52
|
|||||||||||||
|
Forfeited
|
–
|
–
|
–
|
–
|
||||||||||||||
|
Expired
|
4,000
|
(4,000
|
)
|
6.74– 10.10
|
8.61
|
|||||||||||||
|
Balance at December 31, 2014
|
2,432,000
|
682,000
|
$
|
6.36–$15.03
|
$
|
11.84
|
||||||||||||
|
Shares reserved
|
–
|
–
|
–
|
–
|
||||||||||||||
|
Granted
|
–
|
–
|
–
|
–
|
||||||||||||||
|
Exercised
|
–
|
(52,000
|
)
|
6.36– 9.88
|
8.04
|
|||||||||||||
|
Forfeited
|
–
|
–
|
–
|
–
|
||||||||||||||
|
Expired
|
7,000
|
(7,000
|
)
|
8.90– 10.28
|
9.45
|
|||||||||||||
|
Balance at December 31, 2015
|
2,439,000
|
623,000
|
$
|
6.36–$15.03
|
$
|
12.18
|
$ 13,823,000
|
|||||||||||
|
Exercisable at December 31, 2015
|
443,000
|
$
|
11.22
|
$ 10,248,000
|
||||||||||||||
The shares available for grant number disclosed in the table above includes 1,698,000 common shares that have been issued in the form of restricted shares. The restricted shares issued reduce the number of common shares available for the grant of future stock awards, which is limited to 741,000 common shares.
The weighted average remaining contractual term of options exercisable at December 31, 2015, was 5.4 years. The total intrinsic value of options exercised during fiscal 2015, 2014 and 2013, was $1,249,000, $1,595,000 and $3,057,000, respectively.
The following table summarizes information about stock options outstanding at December 31, 2015:
|
Options Outstanding
|
Options Exercisable
|
|||||||||||||||||||||
|
Range of
Exercise Prices
|
Outstanding
as of December 31, 2015
|
Weighted Average Remaining Contractual Life
|
Weighted Average Exercise Price
|
Exercisable
as of
December 31,
2015
|
Weighted Average Exercise Price
|
|||||||||||||||||
|
$
|
6.36–$ 9.58
|
53,000
|
2.1
|
$
|
7.40
|
53,000
|
$
|
7.40
|
||||||||||||||
|
9.59– 10.98
|
40,000
|
4.3
|
9.95
|
40,000
|
9.95
|
|||||||||||||||||
|
10.99– 11.72
|
170,000
|
5.9
|
11.33
|
170,000
|
11.33
|
|||||||||||||||||
|
11.73– 12.03
|
90,000
|
6.1
|
12.03
|
90,000
|
12.03
|
|||||||||||||||||
|
12.04– 13.03
|
90,000
|
6.1
|
13.03
|
90,000
|
13.03
|
|||||||||||||||||
|
13.04– 15.03
|
180,000
|
6.1
|
14.53
|
–
|
–
|
|||||||||||||||||
|
623,000
|
5.6
|
$
|
12.18
|
443,000
|
$
|
11.22
|
||||||||||||||||
62
7. Stock Options and Restricted Shares (Continued)
As of December 31, 2015, there was $445,000 of total unrecognized compensation costs related to the outstanding stock options, which is expected to be recognized over a weighted average period of 0.6 years.
The holder of a restricted share award is generally entitled at all times on and after the date of issuance of the restricted shares to exercise the rights of a shareholder of the Company, including the right to vote the shares and the right to receive dividends on the shares. These shareholders do not have the ability to sell, transfer or otherwise encumber the restricted share awards until they fully vest. During 2015, 2014 and 2013, the Company granted restricted shares to directors and employees under the Stock Option Plan. The restricted shares granted to employees of the Company vest over a four-year or nine-year period based on the continuation of employment. The restricted shares granted to the Company’s director’s vest over a one-year period based on the continuation of service as a director.
Restricted share activity is summarized as follows:
|
Shares
Outstanding
|
Weighted Average Grant Date Fair
Value
|
|||||||
|
Balance at December 31, 2012
|
613,000
|
$
|
10.39
|
|||||
|
Granted
|
199,000
|
16.31
|
||||||
|
Vested
|
(208,000
|
)
|
9.96
|
|||||
|
Forfeited
|
(16,000
|
)
|
11.22
|
|||||
|
Balance at December 31, 2013
|
588,000
|
$
|
12.52
|
|||||
|
Granted
|
175,000
|
24.24
|
||||||
|
Vested
|
(247,000
|
)
|
11.00
|
|||||
|
Forfeited
|
(9,000
|
)
|
17.23
|
|||||
|
Balance at December 31, 2014
|
507,000
|
$
|
17.24
|
|||||
|
Granted
|
134,000
|
28.38
|
||||||
|
Vested
|
(216,000
|
)
|
14.01
|
|||||
|
Forfeited
|
(9,000
|
)
|
23.41
|
|||||
|
Balance at December 31, 2015
|
416,000
|
$
|
22.37
|
|||||
As of December 31, 2015, there was $2,701,000 of total unrecognized compensation costs related to the outstanding restricted shares, which is expected to be recognized over a weighted average period of 1.6 years.
The Company estimates the forfeiture rate for restricted stock using 0% for directors, 10% for key employees and 15% for non-key employees.
8. Employee Stock Purchase Plan
The Company has an Employee Stock Purchase Plan (the Purchase Plan) under which 2,700,000 shares of common stock have been reserved for issuance. Eligible employees may contribute 1% to 10% of their compensation to purchase shares of the Company’s common stock at a discount of 15% of the market value at certain plan-defined dates, up to a maximum of 2,000 shares per purchasing period. The Purchase Plan terminates in April 2020. In fiscal 2015, 2014 and 2013, 89,200 shares, 103,500 shares, and 124,100 shares, respectively, were issued under the Purchase Plan. At December 31, 2015, 772,000 shares were available for issuance under the Purchase Plan.
As of December 31, 2015, there was $549,000 of total unrecognized compensation costs related to the Purchase Plan, which is expected to be recognized over a weighted average period of 0.8 years.
63
9. Employee Retirement Savings Plan
The Company has an employee 401(k) retirement savings plan (the Plan). The Plan provides eligible employees with an opportunity to make tax-deferred contributions into a long-term investment and savings program. All employees over the age of 21 are eligible to participate in the Plan beginning with the first quarterly open enrollment date following start of employment. The Plan allows eligible employees to contribute up to 50% of their annual compensation, subject to a maximum limit determined by the Internal Revenue Service, with the Company contributing an amount equal to 25% of the first 10% contributed to the Plan. The Company recorded an expense of $484,000, $408,000 and $243,000 for contributions to the Plan for the years ended December 31, 2015, 2014, and 2013, respectively.
10. Concentrations of Credit and Other Risks
In the United States, the Company sells its products directly to hospitals and clinics. In all international markets, the Company sells its products to distributors who, in turn, sell to hospitals and clinics. Loss, termination, or ineffectiveness of distributors to effectively promote the Company’s product could have a material adverse effect on the Company’s financial condition and results of operations.
No customer represented more than 10% of total revenue for any year ended December 31, 2015, 2014 or 2013. No foreign country represents more than 10% of total revenue for any year ended December 31, 2015, 2014 or 2013.
The Company performs credit evaluations of its customers and does not require collateral to extend credit to an account. No customer represented more than 10% of gross accounts receivable at December 31, 2015 or 2014. There have been no material losses on customer receivables.
There is no concentration of long-lived assets in foreign countries.
Sales by geographic location are based on the location of the customer. Product revenue by geographic destination as a percentage of total product revenues were as follows for the years ended December 31:
|
2015
|
2014
|
2013
|
||||||||||
|
Domestic
|
79
|
%
|
82
|
%
|
85
|
%
|
||||||
|
Foreign
|
21
|
18
|
15
|
|||||||||
11. Related Party Activity
During the years ended December 31, 2015, 2014 and 2013, the Company sold $311,000, $311,000 and $361,000, respectively, of product to a company of which a board member of the Company is an officer. As of December 31, 2015 and 2014, the Company had an accounts receivable balance due of $-0- and $35,000, respectively, from this related party. In addition, the Company purchases product from this related party. During the years ended December 31, 2015, 2014 and 2013, the Company purchased $21,000, $18,000 and $10,000, respectively, of product from this related party. As of both December 31, 2015 and 2014, the Company had an accounts payable balance due of $-0- to this related party.
64
12. Dependence on Key Suppliers
King Pharmaceuticals
The Company purchases certain key components from single-source suppliers. Any significant component delay or interruption could require the Company to qualify new sources of supply, if available, and could have a material adverse effect on the Company’s financial condition and results of operations. The Company purchases its requirements for thrombin (a component in the Hemostat products) under a Thrombin-JMI Supply Agreement entered into with King Pharmaceuticals, Inc. (King) on January 9, 2007. King was acquired by Pfizer, Inc. on February 28, 2011. Under the terms of the Thrombin-JMI Supply Agreement, King agrees to manufacture and supply thrombin to the Company on a non-exclusive basis. The Thrombin-JMI Supply Agreement does not contain any minimum purchase requirements. King agrees to supply the Company with such quantity of thrombin as the Company may order at a fixed price throughout the term of the Thrombin-JMI Supply Agreement as adjusted for inflation, variations in potency and other factors. The Thrombin-JMI Supply Agreement has an initial term of 10 years, followed by successive automatic one-year extensions, subject to termination by the parties under certain circumstances, including: (i) termination by King without cause any time after the fifth anniversary of the date of the Thrombin-JMI Supply Agreement upon five years prior written notice to the Company, and (ii) termination by the Company without cause any time after the fifth anniversary of the date of the Thrombin-JMI Supply Agreement upon five years prior written notice to King provided that the Device Supply Agreement, which the Company also entered into with King on January 9, 2007, has expired on its terms or the parties have agreed to terminate it.
13. Commitments and Contingencies
All legal cost related to litigation are charged to operations as incurred, except settlements which are expensed when a claim is probable and estimable.
Boston Scientific Corporation Litigation
On May 16, 2013, the Company filed a patent infringement complaint in the United States District Court for the District of Minnesota against Boston Scientific Corporation (Boston Scientific). The complaint alleged that Boston Scientific infringed three of the Company’s patents concerning rapid exchange guide extension technology by manufacturing and selling its Guidezilla™ guide extension catheter. On July 11, 2013, Boston Scientific filed its answer and counterclaim, alleging the Company’s patents are invalid, that the Guidezilla catheter does not infringe, and that the Company’s manufacture and sale of its GuideLiner catheter violates a U.S. patent owned by Boston Scientific that expired in June 2013. On July 30, 2014, the Company agreed with Boston Scientific to settle the patent lawsuit and counterclaim. As part of the settlement agreement, all litigation relating to guide extension was dismissed and the Company will receive an ongoing royalty from Boston Scientific in exchange for a license of the Company’s patents. The terms of the settlement agreement are confidential.
Governmental Proceedings
On June 28, 2011, the Company received a subpoena from the U.S. Attorney’s Office for the Western District of Texas under the Health Insurance Portability & Accountability Act of 1996 (HIPAA) requesting the production of documents related to Vari-Lase products, and in particular the use of the Vari-Lase Short Kit for the treatment of perforator veins. Subsequently, the Company learned that the U.S. Attorney’s Office also had commenced a criminal investigation of the same matter. The Vari-Lase Short Kit was sold under a 510(k) clearance for the treatment of incompetence and reflux of superficial veins in the lower extremity from 2007 until it was voluntarily withdrawn from the market in July 2014 with total U.S. sales of approximately $534,000 (0.1% of the Company’s total U.S. sales for such period) and has not been the subject of any reported serious adverse clinical event. On August 14, 2012, the United States District Court for the Western District of Texas unsealed a qui tam complaint that had been filed on November 19, 2010 by Desalle Bui, a former sales employee of the Company, which was the basis for the U.S. Attorney’s civil investigation, to which the federal government, after three extensions of time, elected to intervene. The complaint contained allegations of off-label promotion of Vari-Lase products for the treatment of perforator veins, re-use of single-use Vari-Lase products and kickbacks to physicians, resulting in alleged damages to the government of approximately $20 million. An amended complaint limited to allegations of off-label promotion of the Vari-Lase Short Kit resulting in an unspecified amount of damages and penalties was filed by the U.S. Attorney’s Office in December 2012. On January 22, 2014, the Company agreed with the U.S. Attorney’s Office to settle the civil lawsuit, and the settlement agreement was executed on July 28, 2014. Under the terms of the settlement agreement, the Company made a payment of $520,000, the Company made no admission of fault or liability, and the U.S. Attorney’s Office dismissed the civil lawsuit with prejudice and released all civil claims brought against the Company in the civil lawsuit. Settlement of the civil lawsuit had no effect upon the criminal investigation.
65
13. Commitments and Contingencies (Continued)
On November 13, 2014, a criminal indictment was issued in the United States District Court for the Western District of Texas related to the Vari-Lase Short Kit investigation. The original indictment alleged that the Company and its Chief Executive Officer introduced adulterated and misbranded medical devices into interstate commerce and conspired to introduce adulterated and misbranded medical devices into interstate commerce through the alleged off-label promotion of the Vari-Lase Short Kit. On December 2, 2015, a superseding indictment was issued that removed the allegations related to introducing adulterated medical devices. The Company believes the remaining allegations are false and intends to contest them vigorously. Defending the Company against the indictment will entail costs that are expected to be material and will require significant attention from the Company’s management. If the Company were to be convicted of the crimes alleged in the indictment, remedies could include fines, penalties, forfeitures and compliance conditions. The Company cannot estimate the amount or range of loss if the Company were to be convicted; however, it would likely be material. If the Company were to be convicted of a crime related to the delivery of an item or service under Title XVIII of the Social Security Act, or a felony related to health care fraud, it would become automatically excluded by the Department of Health and Human Services (“HHS”) from participation in U.S. government health care programs, including Medicare and Medicaid. If the Company were to be convicted of a misdemeanor related to health care fraud, it could be immediately excluded by HHS from participation in U.S. government health care programs, including Medicare and Medicaid. Exclusion from participation in U.S. government health care programs would prevent the Company from continuing to sell its products in the U.S., and thereby would seriously damage the Company’s ability to continue to conduct its business. Conviction of the Company’s chief executive officer of a crime under statutes related to misbranding and health care fraud could require the termination of his employment with the Company.
From time to time, the Company is involved in additional legal proceedings arising in the normal course of business. As of the date of this report the Company is not a party to any legal proceeding not described in this Note in which an adverse outcome would reasonably be expected to have a material adverse effect on the Company’s results of operations or financial condition.
King Agreements
On January 9, 2007, the Company entered into a License Agreement and a Device Supply Agreement with King (see Note 12). King was acquired by Pfizer, Inc. on February 28, 2011. Under the License Agreement, the Company licensed the exclusive rights to the Company’s products Thrombi-Pad, Thrombi-Gel and Thrombi-Paste to King in exchange for a one-time license fee. Under the Device Supply Agreement, the Company agreed to manufacture the licensed products for sale to King in exchange for an initial payment. The unamortized license fee was $201,000, $406,000, and $610,000 at December 31, 2015, 2014 and 2013, respectively. Amortization of the deferred revenue will be $204,000 per year for the remainder of the 10-year license period. The amortization of license fee was $205,000, $204,000, and $205,000 for the years ended December 31, 2015, 2014 and 2013, respectively.
66
13. Commitments and Contingencies (Continued)
Nicolai, GmbH Agreement
Effective April 1, 2008, the Company entered into a five-year distribution agreement with Nicolai GmbH. In connection with this distribution agreement, the Company received 500,000 Euros from Nicolai GmbH, which was deferred and was being recognized ratably over the five-year term of the distribution agreement. The agreement included provisions requiring the Company to pay Nicolai GmbH specific amounts if the Company terminated the distribution agreement prior to the end of the five-year term. The Company did not terminate the distribution agreement prior to the termination date. The unamortized license fee was $-0- at December 31, 2015, 2014 and 2013, respectively. The amortization of license fee was $-0-, $-0-, and $36,000 for the years ended December 31, 2015, 2014 and 2013, respectively.
Stock Repurchase Plan
On November 14, 2014, the Company’s Board of Directors approved a Common Stock Repurchase Plan (the “Repurchase Plan”), which provides the option to repurchase shares of the Company’s common stock with a maximum purchase price of $20,000,000 on the open market at market prices through September 30, 2016. During the years ended December 31, 2015 and December 31, 2014, the Company repurchased a total of -0- common shares and 33,401 common shares at an average price of $24.52 under the plan, respectively.
14. Asset Acquisition
Northeast Scientific
On September 17, 2013, the Company entered into an eight-year reprocessing services agreement with Northeast Scientific, Inc. (NES), a FDA-registered reprocessor of medical devices, whereby the Company paid NES a non-refundable amount of $500,000 for the exclusive right to offer NES’ reprocessing services in the United States for a commercial medical device. NES is pursuing FDA approval for its reprocessing services for the device. If FDA approval is obtained, the Company is required to pay NES a non-refundable amount of $400,000. The agreement has an annual minimum unit termination clause, allowing NES to terminate the agreement if the Company does not meet certain annual minimums following FDA approval.
The Company has accounted for the transaction as a non-business asset acquisition in the third quarter of 2013. In accordance with ASC 805, the purchase price of $900,000 was assigned to an intangible and no goodwill was recognized. The Company recorded a $400,000 accrual in the third quarter of 2013 in addition to the $500,000 payment, and since FDA approval has not occurred, $400,000 remains in accruals at both December 31, 2015 and 2014. The Company will begin amortizing the intangible asset on a per unit basis over the remaining term of the agreement once the Company begins to send units to NES to be reprocessed following FDA approval.
67
15. Quarterly Financial Data (unaudited, in thousands, except per share data)
|
2015
|
Fourth
Quarter
|
Third
Quarter
|
Second
Quarter
|
First
Quarter
|
||||||||||||
|
Net revenue:
|
||||||||||||||||
|
Product
|
$
|
37,950
|
$
|
36,827
|
$
|
37,398
|
$
|
34,441
|
||||||||
|
License, royalty & collaboration
|
135
|
127
|
152
|
170
|
||||||||||||
|
Total net revenue
|
38,085
|
36,954
|
37,550
|
34,611
|
||||||||||||
|
Selected costs and expenses:
|
||||||||||||||||
|
Costs of goods sold
|
12,814
|
12,133
|
12,660
|
11,296
|
||||||||||||
|
Operating earnings
|
160
|
4,368
|
5,648
|
3,423
|
||||||||||||
|
Net earnings
|
1,557
|
2,973
|
3,727
|
2,207
|
||||||||||||
|
Basic net earnings per share
|
$
|
0.09
|
$
|
0.17
|
$
|
0.22
|
$
|
0.13
|
||||||||
|
Diluted net earnings per share
|
$
|
0.09
|
$
|
0.16
|
$
|
0.21
|
$
|
0.12
|
||||||||
|
2014
|
Fourth
Quarter
|
Third
Quarter
|
Second
Quarter
|
First
Quarter
|
||||||||||||
|
Net revenue:
|
||||||||||||||||
|
Product
|
$
|
33,449
|
$
|
31,766
|
$
|
30,606
|
$
|
29,845
|
||||||||
|
License
|
137
|
163
|
71
|
62
|
||||||||||||
|
Total net revenue
|
33,586
|
31,929
|
30,677
|
29,907
|
||||||||||||
|
Selected costs and expenses:
|
||||||||||||||||
|
Costs of goods sold
|
11,542
|
10,291
|
10,283
|
9,583
|
||||||||||||
|
Operating earnings
|
5,312
|
5,213
|
5,031
|
4,371
|
||||||||||||
|
Net earnings
|
4,160
|
2,570
|
3,205
|
2,799
|
||||||||||||
|
Basic net earnings per share
|
$
|
0.24
|
$
|
0.15
|
$
|
0.19
|
$
|
0.17
|
||||||||
|
Diluted net earnings per share
|
$
|
0.23
|
$
|
0.15
|
$
|
0.18
|
$
|
0.16
|
||||||||
16. Subsequent Events
The Company has evaluated subsequent events occurring after the date of the consolidated financial statements for events requiring recording or disclosure in the financial statements.
68
Vascular Solutions, Inc.
SCHEDULE II
VALUATION AND QUALIFYING ACCOUNTS
YEARS ENDED DECEMBER 31, 2015, 2014 AND 2013
|
Description
|
Balance at
Beginning
of Year
|
Additions
Charged
to Costs
and
Expenses
|
Less
Deductions
|
Balance at
End of
Year
|
||||||||||||
|
(in thousands)
|
||||||||||||||||
|
YEAR ENDED DECEMBER 31, 2015:
|
||||||||||||||||
|
Sales return allowance
|
$
|
80
|
$
|
35
|
$
|
(40
|
)
|
$
|
75
|
|||||||
|
Allowance for doubtful accounts
|
220
|
285
|
(220
|
)
|
285
|
|||||||||||
|
Tax valuation allowance
|
1,173 | 284 | (17 | ) | 1,440 | |||||||||||
|
Total
|
$
|
1,473
|
$
|
604
|
$
|
(277
|
)
|
$
|
1,800
|
|||||||
|
YEAR ENDED DECEMBER 31, 2014:
|
||||||||||||||||
|
Sales return allowance
|
$
|
50
|
$
|
65
|
$
|
(35
|
)
|
$
|
80
|
|||||||
|
Allowance for doubtful accounts
|
150
|
185
|
(115
|
)
|
220
|
|||||||||||
|
Tax valuation allowance
|
144 | 1,061 | (32 | ) | 1,173 | |||||||||||
|
Total
|
$
|
344
|
$
|
1,311
|
$
|
(182
|
)
|
$
|
1,473
|
|||||||
|
YEAR ENDED DECEMBER 31, 2013:
|
||||||||||||||||
|
Sales return allowance
|
$
|
55
|
$
|
20
|
$
|
(25
|
)
|
$
|
50
|
|||||||
|
Allowance for doubtful accounts
|
130
|
90
|
(70
|
)
|
150
|
|||||||||||
|
Tax valuation allowance
|
1,434 | 53 | (1,343 | ) | 144 | |||||||||||
|
Total
|
$
|
1,619
|
$
|
163
|
$
|
(1,438
|
)
|
$
|
344
|
|||||||
69