Attached files
| file | filename |
|---|---|
| 8-K - CAROLINA FINANCIAL CORP | e00026_caro-8k.htm |
| EX-99.1 - CAROLINA FINANCIAL CORP | e00026_ex99-1.htm |

Fourth Quarter 2015 Earnings Release Investor Presentation NASDAQ: CARO January 26, 2016

2 Disclaimer Certain statements in this presentation contain “forward - looking statements” within the meaning of the Private Securities Litigation Reform Act of 1995 , such as statements relating to future plans and expectations, and are thus prospective . Such forward - looking statements include but are not limited to statements with respect to plans, objectives, expectations, and intentions and other statements that are not historical facts, and other statements identified by words such as “believes,” “expects,” “anticipates,” “estimates,” “intends,” “plans,” “targets,” and “projects,” as well as similar expressions . Such statements are subject to risks, uncertainties, and other factors which could cause actual results to differ materially from future results expressed or implied by such forward - looking statements . Although we believe that the assumptions underlying the forward - looking statements are reasonable, any of the assumptions could prove to be inaccurate . Therefore, we can give no assurance that the results contemplated in the forward - looking statements will be realized . The inclusion of this forward - looking information should not be construed as a representation by Carolina Financial Corporation or any person that such future events, plans, or expectations will occur or be achieved . In addition to factors previously disclosed in the reports filed by Carolina Financial Corporation with the Securities and Exchange Commission (the “SEC”), additional risks and uncertainties may include, but are not limited to : ( 1 ) competitive pressures among depository and other financial institutions may increase significantly and have an effect on pricing, spending, third - party relationships and revenues ; ( 2 ) the strength of the United States economy in general and the strength of the local economies in which we conduct operations may be different than expected resulting in, among other things, a deterioration in the credit quality or a reduced demand for credit, including the resultant effect on the Company’s loan portfolio and allowance for loan losses ; ( 3 ) the rate of delinquencies and amounts of charge - offs, the level of allowance for loan loss, the rates of loan growth, or adverse changes in asset quality in our loan portfolio, which may result in increased credit risk - related losses and expenses ; ( 4 ) the risk that the preliminary financial information reported herein and our current preliminary analysis will be different when our review is finalized ; ( 5 ) changes in the U . S . legal and regulatory framework including, but not limited to, the Dodd - Frank Act and regulations adopted thereunder ; ( 6 ) adverse conditions in the stock market, the public debt market and other capital markets (including changes in interest rate conditions) could have a negative impact on the Company ; ( 7 ) the businesses of the Company and Congaree Bancshares, Inc . (“Congaree”) may not be integrated successfully or such integration may take longer to accomplish than expected ; ( 8 ) the expected cost savings and any revenue synergies from the acquisition may not be fully realized within the expected timeframes ; ( 9 ) disruption from the acquisition may make it more difficult to maintain relationships with clients, associates, or suppliers ; ( 10 ) the required governmental approvals of the acquisition may not be obtained on the proposed terms and schedule ; and ( 11 ) the shareholders of Congaree may not approve the acquisition . Additional factors that could cause our results to differ materially from those described in the forward - looking statements can be found in the reports (such as our Annual Report on Form 10 - K, Quarterly Reports on Form 10 - Q and Current Reports on Form 8 - K) filed with the SEC and available at the SEC’s Internet site (http : //www . sec . gov) . All subsequent written and oral forward - looking statements concerning the company or any person acting on its behalf is expressly qualified in its entirety by the cautionary statements above . We do not undertake any obligation to update any forward - looking statement to reflect circumstances or events that occur after the date the forward - looking statements are made .

3 Disclaimer (continued) Additional Information About the Congaree Acquisition and Where to Find It The Company intends to file relevant documents concerning the Congaree acquisition with the SEC, including a registration statement on Form S - 4 which will include a proxy statement/prospectus . Shareholders of Congaree will be able to obtain a free copy of the proxy statement/prospectus, as well as other filings by the Company, at the SEC’s internet site (http : //www . sec . gov) . Copies of the proxy statement/prospectus and the filings with the SEC that will be incorporated by reference in the proxy statement/ prospectus can also be obtained, without charge, by directing a request to Carolina Financial Corporation, 288 Meeting Street, Charleston, SC 29401 , Attention : William A . Gehman, III, Executive Vice President and Chief Financial Officer . SHAREHOLDERS OF CONGAREE ARE URGED TO READ THE PROXY STATEMENT/PROSPECTUS AND OTHER RELEVANT DOCUMENTS WHEN THEY ARE FILED WITH THE SEC REGARDING THE PROPOSED TRANSACTION WHEN THEY BECOME AVAILABLE, BECAUSE THEY WILL CONTAIN IMPORTANT INFORMATION . The directors and executive officers of Congaree and other persons may be deemed to be participants in the solicitation of proxies from Congaree’s shareholders in connection with the proposed acquisition . Information regarding Congaree’s directors and executive officers is available in its definitive proxy statement (DEF 14 A) and additional definitive proxy soliciting materials filed with the SEC for Congaree’s 2015 annual shareholder meeting . Other information regarding the participants in the Congaree proxy solicitation and a description of their direct and indirect interests, by security holdings or otherwise, will be contained in the proxy statement/prospectus and other relevant materials to be filed with the SEC when they become available .

4 0 60,000 120,000 180,000 240,000 300,000 360,000 $8.00 $10.00 $12.00 $14.00 $16.00 $18.00 $20.00 Jan-15 Apr-15 Jul-15 Oct-15 Jan-16 CARO Volume CARO Price Nasdaq Bank Indexed to CARO Fourth Quarter Highlights • 2015Q4 net income of $3.6 million, or $0.36 per diluted share (1) – Increase of approximately 110% compared to $1.7 million, or $0.22 per diluted share, for 2014Q4 • 2015 net income of $14.4 million, or $1.48 per diluted share (1) – Increased approximately 74% compared to $8.3 million, or $0.87 per diluted share, for FY 2014 (prior year results include pre - tax expenses of $1.4 million related to branch acquisitions completed in 2014) • Tangible book value per share of $11.66 at 12/31/15 compared to $9.67 at 12/31/14 (1) • Completed $32.1 million (net) follow - on offering to fund organic and strategic growth initiatives • Announced acquisition of Columbia, S.C. - headquartered Congaree Bancshares, Inc. (Assets: $117MM), which provides entry to the attractive Columbia MSA Stock Price Performance Since January 1, 2015 $16.56 12/9/15: Completed $32.1 million common stock offering (2) $11.87 (1) This information is preliminary and based on Company data available at the time of the presentation (2) Full underwriters’ overallotment subsequently exercised for total net proceeds from the offering of $32.1 million Note: Market data as of January 19, 2016 Source: SNL Financial LC

5 North Carolina South Carolina Greenville Charlotte Raleigh Greensboro Myrtle Beach Wilmington Charleston Columbia Augusta Savannah Florence Winston Salem Asheville Congaree Acquisition Overview Branch (27) Loan Production Office (2) CNRB Branch (2) • Important step in Carolina Financial’s mission to be “The Trusted Community Bank of Choice” and the leading community banking franchise in the Carolinas – Market expansion to demographically attractive and contiguous Columbia, SC MSA • Financially compelling acquisition – Immediate and meaningful EPS accretion – Tangible book value dilution earned back in less than three years (2) – Internal rate of return greater than 20% – Pro forma regulatory ratios above “well - capitalized” guidelines • Attractive target with strong core deposit base • Cultural fit – similar customers and familiar management team • Opportunity for substantial upside – Ability to introduce Carolina Financial’s products and services to the Columbia market and existing Congaree customers Financially & Strategically Compelling Transaction Attractive Market Expansion (1) Includes the assumption of $1.6 million of preferred stock (2) Uses the “cross - over” methodology Source: SNL Financial LC Congaree Acquisition • Carolina Financial executed a definitive agreement to acquire Congaree Bancshares, Inc. – $117 million asset bank headquartered in Cayce, South Carolina – Deal price of $8.10 per share (~$16.3 million aggregate (1) ) equal to 119% of tangible book value per share – Consideration comprised of 60% stock and 40% cash Deal Overview (Announced on January 6, 2016)

6 Commercial Banking Results

7 $1.8 $3.3 ($4.9) ($3.4) $5.0 $7.3 $11.4 (0.58%) (0.41%) 0.56% 0.73% 0.87% (0.90%) (0.60%) (0.30%) 0.00% 0.30% 0.60% 0.90% ($6.0) ($3.0) $0.0 $3.0 $6.0 $9.0 $12.0 Total Bank Segment Earnings ($MMs) Q4 Bank Segment Earnings ($MMs) Bank Segment Earnings / Avg. Consolidated Assets (%) Strong, Improving Bank Segment Results Bank Segment Earnings (1) • Bank segment earnings continued to increase with 2015Q4 net income of $3.3 million versus $1.8 million for 2014Q4 and 2015 net income of $11.4 million versus $7.3 million for 2014 • The 2014 results include pre - tax acquisition - related expenses associated with the completion of branch acquisitions of $1.4 million • The improvement in bank segment earnings was a result of continued high - quality asset growth, expanding fee income and leveraging of expenses • Bank segment earnings as a percentage of consolidated assets improved from 0.73% for 2014 to 0.87% for 2015 2011Y 2012Y 2013Y 2014Y 2015Y ($20.0) ($18.7) (2.00%) (1.84%) (1) Bank segment earnings as reported in public filings (includes intersegment revenues and expenses and excludes holding company expenses). The 2015 information is preliminary and based on Company data available at the time of the presentation.

8 Expanding Net Interest Margin 5.43% 5.28% 4.91% 4.90% 4.78% 3.45% 3.61% 3.41% 3.62% 3.68% 1.39% 0.98% 0.72% 0.63% 0.56% 0.00% 1.00% 2.00% 3.00% 4.00% 5.00% 6.00% 2011Y 2012Y 2013Y 2014Y 2015Y Yield on Loans Net Interest Margin (1) Cost of Funds (1) Tax - equivalent net interest margin (2) The 2015 information is preliminary and based on Company data available at the time of the presentation ( 2 )

9 Strong Core Fee Income Stream • The bank segment’s core fee income is primarily derived from deposit service charges, retail mortgage income and BOLI earnings • These core fee income categories increased from $3.6 million for 2014 to $5.9 million for 2015 • Deposit service charges increased from $2.1 million in 2014 to $3.5 million in 2015, which was supported by the acquisition of the First Community branches • Retail mortgage banking income also accelerated from $0.8 million in 2014 to $1.7 million in 2015 $1.6 $1.6 $1.6 $2.1 $3.5 $0.5 $0.6 $0.6 $0.8 $1.7 $0.4 $0.7 $0.7 $2.1 $2.2 $2.5 $3.6 $5.9 $- $1.0 $2.0 $3.0 $4.0 $5.0 $6.0 $7.0 2011Y 2012Y 2013Y 2014Y 2015Y Deposit Service Charges Retail Mortgage Income BOLI Banking Segment Core Noninterest Income ($MMs) (1) (1) The 2015 information is preliminary and based on Company data available at the time of the presentation
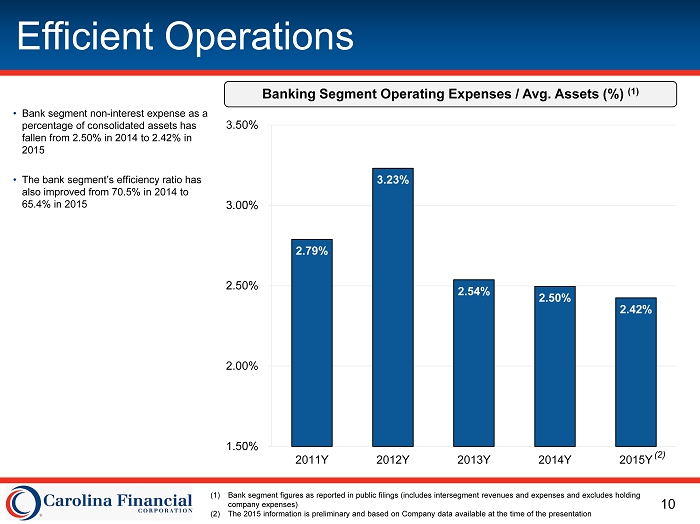
10 Efficient Operations • Bank segment non - interest expense as a percentage of consolidated assets has fallen from 2.50% in 2014 to 2.42% in 2015 • The bank segment’s efficiency ratio has also improved from 70.5% in 2014 to 65.4% in 2015 Banking Segment Operating Expenses / Avg. Assets (%) (1) (1) Bank segment figures as reported in public filings (includes intersegment revenues and expenses and excludes holding company expenses) (2) The 2015 information is preliminary and based on Company data available at the time of the presentation 2.79% 3.23% 2.54% 2.50% 2.42% 1.50% 2.00% 2.50% 3.00% 3.50% 2011Y 2012Y 2013Y 2014Y 2015Y ( 2 )
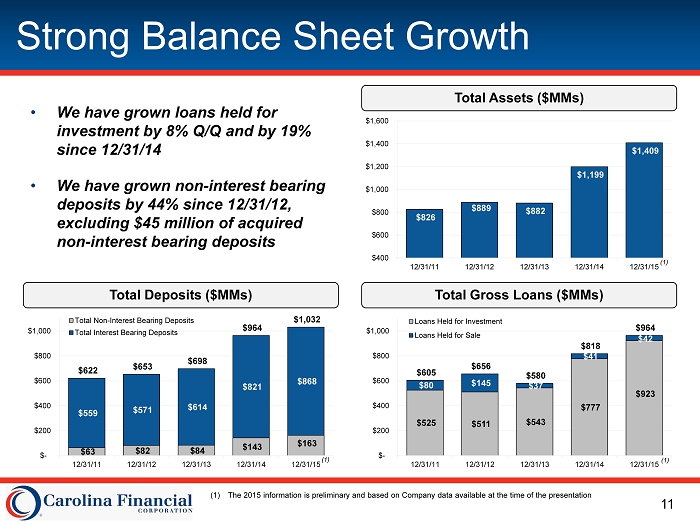
11 Strong Balance Sheet Growth • We have grown loans held for investment by 8 % Q/Q and by 19% since 12/31/14 • We have grown non - interest bearing deposits by 4 4% since 12/31/12, excluding $45 million of acquired non - interest bearing deposits Total Deposits ($MMs) Total Gross Loans ($MMs) Total Assets ($MMs) $525 $511 $543 $777 $923 $80 $145 $37 $41 $42 $605 $656 $580 $818 $964 $- $200 $400 $600 $800 $1,000 12/31/11 12/31/12 12/31/13 12/31/14 12/31/15 Loans Held for Investment Loans Held for Sale $63 $82 $84 $143 $163 $559 $571 $614 $821 $868 $622 $653 $698 $964 $1,032 $- $200 $400 $600 $800 $1,000 12/31/11 12/31/12 12/31/13 12/31/14 12/31/15 Total Non-Interest Bearing Deposits Total Interest Bearing Deposits $826 $889 $882 $1,199 $1,409 $400 $600 $800 $1,000 $1,200 $1,400 $1,600 12/31/11 12/31/12 12/31/13 12/31/14 12/31/15 (1) (1) (1) (1) The 2015 information is preliminary and based on Company data available at the time of the presentation

12 Diversified Loan Mix and Solid Asset Quality NPAs (Excl. TDRs) / Assets (%) (1) • We have a diversified loan mix, with a focus on lower risk assets • Our asset quality has improved significantly over the past few years, with NPA’s / assets of 0.47% at 12/31/15 • We have experienced net recoveries in the past two years (1) Excludes performing troubled debt restructurings (TDRs ) (2) The 2015 information is preliminary and based on Company data available at the time of the presentation NCOs / Average Loans (%) Loan Composition (12/31/15) (2) 2.38% 1.05% 0.11% (0.15%) (0.13%) (1.00%) 0.00% 1.00% 2.00% 3.00% 4.00% 5.00% 2011Y 2012Y 2013Y 2014Y 2015Y Net Recoveries 4.87% 2.42% 1.97% 0.47% 0.47% 0.00% 1.00% 2.00% 3.00% 4.00% 5.00% 6.00% 12/31/11 12/31/12 12/31/13 12/31/14 12/31/15 1 - 4 Family 37% Home Equity 2% CRE 37% C&D 10% Consumer 1% C&I 13% FY 2015 Yield on Loans: 4.78% ( 2 ) ( 2 )

13 Noninterest - bearing Demand 16% Interest - bearing Demand 15% Money Market & Savings 26% Time Deposits 43% Improving Deposit Mix Deposit Composition (12/31/15 ) (1) Checking Accounts • Focus on increasing checking accounts as evidenced by the growth of non - interest bearing accounts from $37.5 million at 12/31/09 to $163.1 million at 12/31/15 (including $45.2 million acquired) • Improved deposit mix has resulted in a lower cost of funds FY 2015 Cost of Funds: 0.56% 11,597 13,339 14,814 29,322 32,564 - 5,000 10,000 15,000 20,000 25,000 30,000 35,000 12/31/11 12/31/12 12/31/13 12/31/14 12/31/15 (1) The 2015 information is preliminary and based on Company data available at the time of the presentation ( 1 )

14 Attractive Wholesale Mortgage Platform

15 Wholesale Mortgage Platform $1,319 $2,196 $1,618 $949 $987 $1,436 $2,044 $1,755 $1,122 $1,450 146 240 184 118 160 0 50 100 150 200 250 $ - $500 $1,000 $1,500 $2,000 $2,500 2011Y 2012Y 2013Y 2014Y 2015Y bps CMC Originations ($MMs) National Originations ($B) Gain on Sale & Fees (bps) Strong, Scalable Mortgage Platform • Despite a challenging operating environment, Crescent Mortgage Company (“CMC”) produced significantly higher earnings in 2015 versus 2014 • CMC earned $3.8 million in 2015 versus $1.9 million for 2014 • National volumes increased in 2015, and CMC also reported an increase in volumes despite the implementation of new regulations in the mortgage industry • CMC’s gross yield expanded significantly in 2015 when compared to 2014 increasing from 118bps to 160bps Mortgage Banking Earnings Contribution (1) (2) (1) Mortgage segment earnings as reported in public filings (includes intersegment revenues and expenses and excludes holding company expenses); (2) Mortgage EPS equals segment earnings divided by weighted average diluted shares; (3) The 2015 information is preliminary and based on Company data available at the time of the presentation // Source: Mortgage Bankers Association $4.2 $21.0 $12.4 $1.9 $3.8 $0.46 $2.28 $1.31 $0.19 $0.39 $- $0.50 $1.00 $1.50 $2.00 $2.50 $ - $5.0 $10.0 $15.0 $20.0 $25.0 2011Y 2012Y 2013Y 2014Y 2015Y Mortgage Earnings ($MMs) Mortgage Segment EPS ($) ( 3 ) ( 3 )

16 Strategic Opportunity

17 Focus on Shareholder Results • We focus on being high performing financial institution • Our ROAA increased from 0.84% in 2014 to 1.11% in 2015, and our ROAE increased from 9.4% in 2014 to 14.2% in 2015 • Earnings per share for 2015 increased to $1.48 from $0.88 for 2014 • We have grown our tangible book value by a 23.9% CAGR since December 31, 2011 • We began paying a quarterly cash dividend to common shareholders in July 2013 • We paid $0.11 of dividends in 2015, representing a 7.4% payout of earnings Consolidated ROAA & ROAE Tangible Book Value per Share & Earnings per Share (0.11%) 2.02% 1.89% 0.84% 1.11% (2.1%) 31.3% 22.0% 9.4% 14.2% (5.0%) 0.0% 5.0% 10.0% 15.0% 20.0% 25.0% 30.0% 35.0% (0.50%) 0.00% 0.50% 1.00% 1.50% 2.00% 2.50% ROAA (%) ROAE (%) $4.96 $7.33 $8.91 $9.67 $11.66 $(0.11) $1.83 $1.77 $0.88 $1.48 $(0.50) $ - $0.50 $1.00 $1.50 $2.00 $(3.00) $ - $3.00 $6.00 $9.00 $12.00 2011Y 2012Y 2013Y 2014Y 2015Y Tangible Book Value per Share ($) Earnings per Share ($) 2011Y 2012Y 2013Y 2014Y 2015Y (1) (1) (1) The 2015 information is preliminary and based on Company data available at the time of the presentation

18 Investment Considerations x Focus on increasing shareholder value as evidenced by 24% compound annual growth in TBV per share from 12/31/11 to 12/31/15 x Scarcity value – large foothold in the high growth Charleston and Myrtle Beach markets x Strong markets to support continued growth x Experienced, accomplished management team driving results x Profitability increasing in community banking segment x Track - record of improving deposit mix x Demonstrated acquisition experience, success and focus x Scalable mortgage platform provides an opportunity to generate earnings in changing markets