Attached files
| file | filename |
|---|---|
| 8-K - FORM 8-K - UNIFI INC | ufi20160119_8k.htm |
| EX-99.1 - EXHIBIT 99.1 - UNIFI INC | ex99-1.htm |

Preliminary Results For the Second Quarter Ended December 27, 2015 Conference Call Slide Presentation Exhibit 99.2

2 Cautionary Statement Certain statements included herein contain forward-looking statements within the meaning of federal securities laws about the financial condition and results of operations of Unifi, Inc. (the “Company”) that are based on management’s beliefs, assumptions and expectations about our future economic performance, considering the information currently available to management. The words “believe,” “may,” “could,” “will,” “should,” “would,” “anticipate,” “estimate,” “project,” “expect,” “intend,” “seek,” “strive,” and words of similar import, or the negative of such words, identify or signal the presence of forward-looking statements. These statements are not statements of historical fact; they involve risk and uncertainties that may cause our actual results, performance or financial condition to differ materially from the expectations of future results, performance or financial condition that we express or imply in any forward-looking statement. Factors that could contribute to such differences include, but are not limited to: the competitive nature of the textile industry and the impact of worldwide competition; changes in the trade regulatory environment and governmental policies and legislation; the availability, sourcing and pricing of raw materials; general domestic and international economic and industry conditions in markets where the Company competes, such as recession and other economic and political factors over which the Company has no control; changes in consumer spending, customer preferences, fashion trends and end-uses; the financial condition of the Company’s customers; the loss of a significant customer; the success of the Company’s strategic business initiatives; the continuity of the Company’s leadership; volatility of financial and credit markets; the ability to service indebtedness and fund capital expenditures and strategic initiatives; availability of and access to credit on reasonable terms; changes in currency exchange, interest and inflation rates; the ability to reduce production costs; the ability to protect intellectual property; employee relations; the impact of environmental, health and safety regulations; the operating performance of joint ventures and other equity investments; and the accurate financial reporting of information from equity method investees. All such factors are difficult to predict, contain uncertainties that may materially affect actual results and may be beyond our control. New factors emerge from time to time, and it is not possible for management to predict all such factors or to assess the impact of each such factor on the Company. Any forward-looking statement speaks only as of the date on which such statement is made, and we do not undertake any obligation to update any forward-looking statement to reflect events or circumstances after the date on which such statement is made, except as may be required by federal securities law. The above and other risks and uncertainties are described in the Company’s most recent annual report on Form 10-K, and additional risks or uncertainties may be described from time to time in other reports filed by the Company with the Securities and Exchange Commission pursuant to the Securities Exchange Act of 1934, as amended. Unifi, Inc. Second Qtr. Conf. Call January 21, 2016 (Unaudited)

3 Q2 - Income Before Income Taxes (Dollars in Millions) Unifi, Inc. Second Qtr. Conf. Call January 21, 2016 (Unaudited) Note: The above graphic represents management’s analysis of the amounts which drove changes in income before income taxes for the noted comparative periods. (1) – Approximates the change from the comparative period due to devaluation of the Brazilian Real. (1)

4 YTD - Income Before Income Taxes (Dollars in Millions) Unifi, Inc. Second Qtr. Conf. Call January 21, 2016 (Unaudited) Note: The above graphic represents management’s analysis of the amounts which drove changes in income before income taxes for the noted comparative periods. (1) – Approximates the change from the comparative period due to devaluation of the Brazilian Real. (1)

5 Net Sales and Gross Profit Highlights (1) (Dollars in Thousands) Unifi, Inc. Second Qtr. Conf. Call January 21, 2016 (Unaudited) Quarter over Quarter Year over Year For the Three Months Ended For the Six Months Ended December 27, 2015 vs. December 28, 2014 December 27, 2015 vs. December 28, 2014 Volume Price Volume Price Net Sales: Polyester 1.0% (1.7%) 1.1% (2.7%) Nylon 2.8% 0.1% (2.2%) (1.2%) International (11.0%) (15.0%) (8.4%) (14.2%) Subtotal (2.4%) (2.6%) (2.1%) (4.3%) For the Three Months Ended For the Six Months Ended December 27, 2015 December 28, 2014 December 27, 2015 December 28, 2014 Gross Profit: Polyester $11,813 $12,332 $21,102 $22,608 Nylon 5,714 5,628 11,896 10,777 International 4,381 5,077 9,972 10,390 Subtotal $21,908 $23,037 $42,970 $43,775 (1) Excludes presentation of All Other.
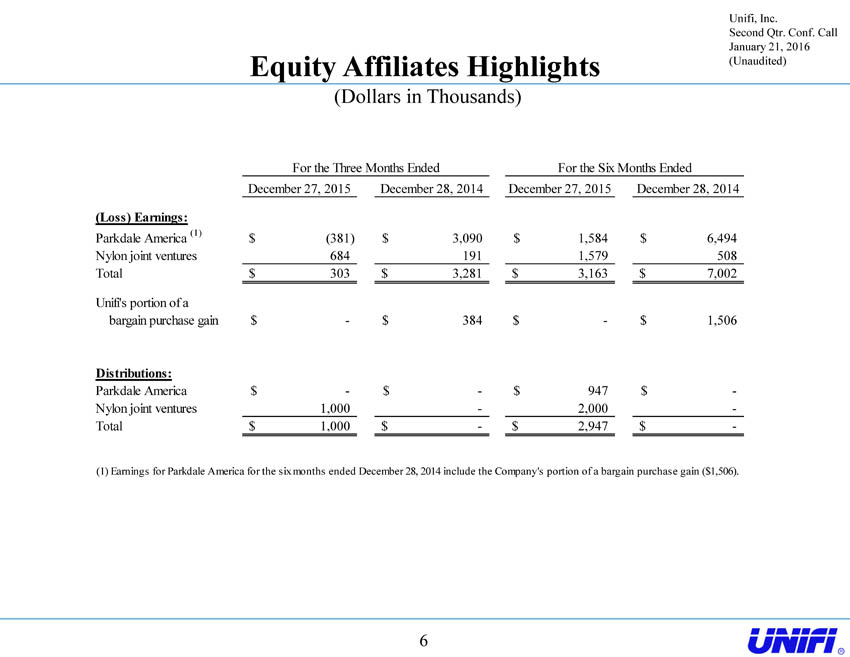
6 Equity Affiliates Highlights (Dollars in Thousands) Unifi, Inc. Second Qtr. Conf. Call January 21, 2016 (Unaudited) For the Three Months Ended For the Six Months Ended December 27, 2015 December 28, 2014 December 27, 2015 December 28, 2014 (Loss) Earnings: Parkdale America (1) $(381) $3,090 $1,584 $6,494 Nylon joint ventures 684 191 1,579 508 Total $303 $3,281 $3,163 $7,002 Unifi's portion of a bargain purchase gain $- $384 $- $1,506 Distributions: Parkdale America $- $- $947 $- Nylon joint ventures 1,000 - 2,000 - Total $1,000 $- $2,947 $- (1) Earnings for Parkdale America for the six months ended December 28, 2014 include the Company's portion of a bargain purchase gain ($1,506).

7 Reconciliations of Net Income to Adjusted EBITDA (Dollars in Thousands) Unifi, Inc. Second Qtr. Conf. Call January 21, 2016 (Unaudited) For the Three Months Ended For the Six Months Ended December 27, 2015 December 28, 2014 December 27, 2015 December 28, 2014 Net income attributable to Unifi, Inc. $6,464 $9,418 $14,489 $16,495 Interest expense, net 641 900 1,462 1,402 Provision for income taxes 2,088 3,193 6,028 7,354 Depreciation and amortization expense 4,151 4,308 8,392 8,649 EBITDA 13,344 17,819 30,371 33,900 Non-cash compensation expense 1,268 1,272 1,552 1,897 Other 573 6 608 751 Adjusted EBITDA Including Equity Affiliates 15,185 19,097 32,531 36,548 Equity in loss (earnings) of Parkdale America, LLC 381 (3,090) (1,584) (6,494) Adjusted EBITDA (1) $15,566 $16,007 $30,947 $30,054 (1) Adjusted EBITDA, for the periods shown, includes the Company's portion of income (loss) before income taxes for Repreve Renewables, LLC and equity in earnings of the Company's nylon joint ventures.

8 Reconciliations of GAAP Results To Adjusted Results (Dollars in Thousands, Except Per Share Amounts) Unifi, Inc. Second Qtr. Conf. Call January 21, 2016 (Unaudited) For the Three Months Ended December 27, 2015 For the Three Months Ended December 28, 2014 Income Before Income Taxes Net Income Basic EPS Income Before Income Taxes Net Income Basic EPS GAAP results $8,282 $6,464 $0.36 $12,315 $9,418 $0.52 Executive transition costs 637 414 0.02 - - - Bargain purchase gain adjustment for an equity affiliate - - - (384) (384) (0.02) Adjusted results (1) (2) $8,919 $6,878 $0.38 $11,931 $9,034 $0.50 For the Six Months Ended December 27, 2015 For the Six Months Ended December 28, 2014 Income Before Income Taxes Net Income Basic EPS Income Before Income Taxes Net Income Basic EPS GAAP results $20,008 $14,489 $0.81 $23,151 $16,495 $0.90 Executive transition costs 637 414 0.02 - - - Bargain purchase gain for an equity affiliate - - - (1,506) (1,506) (0.08) Adjusted results (1) (2) $20,645 $14,903 $0.83 $21,645 $14,989 $0.82 (1) Adjusted Net Income represents Net income attributable to Unifi, Inc. calculated under GAAP, adjusted for the approximate after-tax impact of certain events or transactions referenced in the reconciliation which management believes do not reflect the ongoing operations and performance of the Company. (2) Adjusted EPS represents Adjusted Net Income divided by the Company’s basic weighted average common shares outstanding.

9 Working Capital Highlights (Dollars in Thousands) Unifi, Inc. Second Qtr. Conf. Call January 21, 2016 (Unaudited) December 27, 2015 September 27, 2015 June 28, 2015 Receivables, net $78,149 $84,960 $83,863 Inventories 108,975 112,778 111,615 Accounts payable (36,455) (42,398) (45,023) Accrued expenses (1) (11,065) (13,504) (16,482) Adjusted Working Capital $139,604 $141,836 $133,973 Adjusted Working Capital $139,604 $141,836 $133,973 Cash 19,417 9,954 10,013 Other current assets 7,762 5,950 7,473 Accrued interest (189) (144) (158) Other current liabilities (15,705) (15,952) (13,061) Working capital $150,889 $141,644 $138,240 (1) Excludes accrued interest

Capital Structure (Dollars in Thousands) Unifi, Inc. Second Qtr. Conf. Call January 21, 2016 (Unaudited) 10 December 27, 2015 September 27, 2015 June 28, 2015 ABL Revolver $16,200 $28,000 $5,000 ABL Term Loan 95,000 79,875 82,125 Other 25,687 20,350 16,985 Total debt $136,887 $128,225 $104,110 Cash 19,417 9,954 10,013 Net debt $117,470 $118,271 $94,097 Cash $19,417 $9,954 $10,013 Revolver availability, net 65,125 57,089 75,933 Total liquidity $84,542 $67,043 $85,946
11 Non-GAAP Financial Measures Certain non-GAAP financial measures included herein are designed to complement the financial information presented in accordance with generally accepted accounting principles in the United States of America ("GAAP") because management believes such measures are useful to investors. These non-GAAP financial measures include, Earnings Before Interest, Taxes, Depreciation and Amortization (“EBITDA”), Adjusted EBITDA Including Equity Affiliates, Adjusted EBITDA, Adjusted Net Income and Adjusted EPS. EBITDA represents Net income or loss attributable to Unifi, Inc. before net interest expense, income tax expense, and depreciation and amortization expense. Adjusted EBITDA Including Equity Affiliates represents EBITDA adjusted to exclude non-cash compensation expense, losses on extinguishment of debt and certain other adjustments. Such other adjustments include restructuring charges and start-up costs, gains or losses on sales or disposals of property, plant and equipment, currency and derivative gains or losses, and other operating or non-operating income or expense items necessary to understand and compare the underlying results of the Company. Adjusted EBITDA represents Adjusted EBITDA Including Equity Affiliates adjusted to exclude equity in loss (earnings) of Parkdale America, LLC. Adjusted Net Income excludes certain amounts which management believes do not reflect the ongoing operations and performance of the Company. Adjusted Net Income represents Net income attributable to Unifi, Inc. calculated under GAAP, adjusted to exclude the approximate after-tax impact of certain income or expense items (as well as specific impacts to the provision for income taxes) necessary to understand and compare the underlying results of the Company. Such amounts are excluded from Adjusted Net Income in order to better reflect the Company’s underlying operations and performance. Adjusted EPS represents Adjusted Net Income divided by the Company’s basic weighted average common shares outstanding. EBITDA, Adjusted EBITDA Including Equity Affiliates, Adjusted EBITDA, Adjusted Net Income and Adjusted EPS are alternative views of performance used by management, and we believe that investors’ understanding of our performance is enhanced by disclosing these performance measures. We believe that the use of EBITDA, Adjusted EBITDA Including Equity Affiliates, Adjusted EBITDA, Adjusted Net Income and Adjusted EPS as operating performance measures provides investors and analysts with a measure of operating results unaffected by differences in capital structures, capital investment cycles, and ages of related assets, among otherwise comparable companies. The Company may, from time to time, change the items included within Adjusted EBITDA, Adjusted Net Income and Adjusted EPS. Management uses Adjusted EBITDA: (i) as a measurement of operating performance because it assists us in comparing our operating performance on a consistent basis, as it removes the impact of (a) items directly related to our asset base (primarily depreciation and amortization) and (b) items that we would not expect to occur as a part of our normal business on a regular basis; (ii) for planning purposes, including the preparation of our annual operating budget; (iii) as a valuation measure for evaluating our operating performance and our capacity to incur and service debt, fund capital expenditures and expand our business; and (iv) as one measure in determining the value of other acquisitions and dispositions. Adjusted EBITDA is also a key performance metric utilized in the determination of variable compensation. Unifi, Inc. Second Qtr. Conf. Call January 21, 2016 (Unaudited)
12 Non-GAAP Financial Measures - continued We also believe Adjusted EBITDA is an appropriate supplemental measure of debt service capacity, because cash expenditures on interest are, by definition, available to pay interest, and tax expense is inversely correlated to interest expense because tax expense decreases as deductible interest expense increases; and depreciation and amortization are non-cash charges. Equity in earnings of Parkdale America, LLC is excluded because such earnings do not reflect our operating performance. The other items excluded from Adjusted EBITDA, Adjusted Net Income and Adjusted EPS are excluded in order to better reflect the performance of our continuing operations. In evaluating EBITDA, Adjusted EBITDA Including Equity Affiliates, Adjusted EBITDA, Adjusted Net Income and Adjusted EPS, you should be aware that, in the future, we may incur expenses similar to the adjustments included herein. Our presentation of EBITDA, Adjusted EBITDA Including Equity Affiliates, Adjusted EBITDA, Adjusted Net Income and Adjusted EPS should not be construed as indicating that our future results will be unaffected by unusual or non-recurring items. EBITDA, Adjusted EBITDA Including Equity Affiliates, Adjusted EBITDA, Adjusted Net Income and Adjusted EPS are not determined in accordance with GAAP and should not be considered as substitutes for net income, operating income, earnings per share or any other performance measures determined in accordance with GAAP or as an alternative to cash flow from operating activities as a measure of our liquidity. Each of our EBITDA, Adjusted EBITDA Including Equity Affiliates, Adjusted EBITDA, Adjusted Net Income and Adjusted EPS measures has limitations as an analytical tool, and you should not consider it in isolation or as a substitute for analysis of our results as reported under GAAP. Some of these limitations are: • it is not adjusted for all non-cash income or expense items that are reflected in our statements of cash flows; • it does not reflect the impact of earnings or charges resulting from matters we consider not indicative of our ongoing operations; • it does not reflect changes in, or cash requirements for, our working capital needs; • it does not reflect the cash requirements necessary to make payments on our debt; • it does not reflect our future requirements for capital expenditures or contractual commitments; • it does not reflect limitations on or costs related to transferring earnings from our subsidiaries to us; and • other companies in our industry may calculate this measure differently than we do, limiting its usefulness as a comparative measure. Because of these limitations, EBITDA, Adjusted EBITDA Including Equity Affiliates, and Adjusted EBITDA should not be considered as a measure of discretionary cash available to us to invest in the growth of our business or as a measure of cash that will be available to us to meet our obligations, including those under our outstanding debt obligations. You should compensate for these limitations by relying primarily on our GAAP results and using these measures only as supplemental information. Unifi, Inc. Second Qtr. Conf. Call January 21, 2016 (Unaudited)
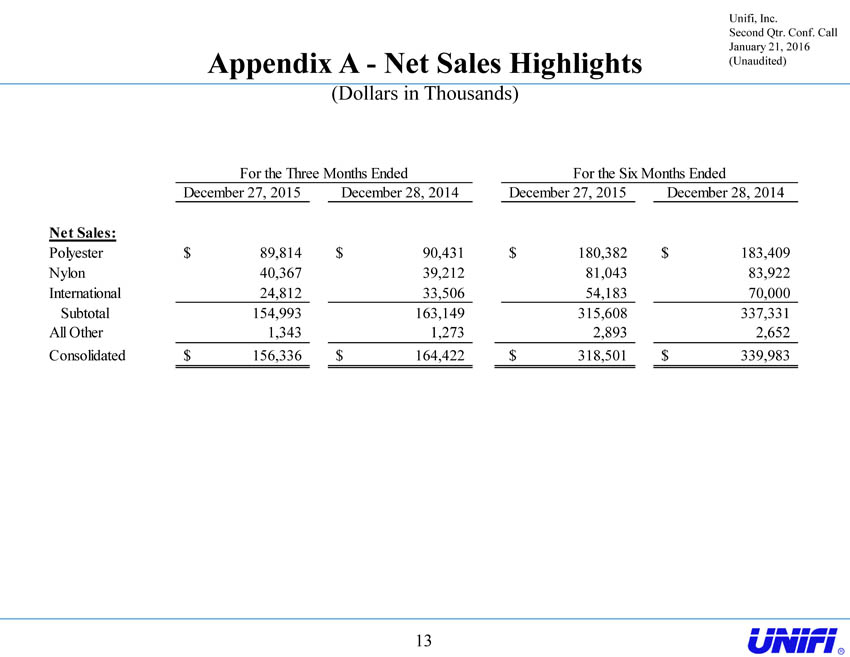
13 Appendix A - Net Sales Highlights (Dollars in Thousands) Unifi, Inc. Second Qtr. Conf. Call January 21, 2016 (Unaudited) For the Three Months Ended For the Six Months Ended December 27, 2015 December 28, 2014 December 27, 2015 December 28, 2014 Net Sales: Polyester $89,814 $90,431 $180,382 $183,409 Nylon 40,367 39,212 81,043 83,922 International 24,812 33,506 54,183 70,000 Subtotal 154,993 163,149 315,608 337,331 All Other 1,343 1,273 2,893 2,652 Consolidated $156,336 $164,422 $318,501 $339,983