Attached files
| file | filename |
|---|---|
| 8-K - FORM 8-K - BlackRock Inc. | d117210d8k.htm |
| EX-99.1 - EARNINGS RELEASE DATED JANUARY 15, 2016 - BlackRock Inc. | d117210dex991.htm |
Exhibit 99.2
BLACKROCK®
Q4 2015 Earnings Earnings Release Supplement: Results presented on an “as adjusted” basis, unless otherwise noted January 15, 2016
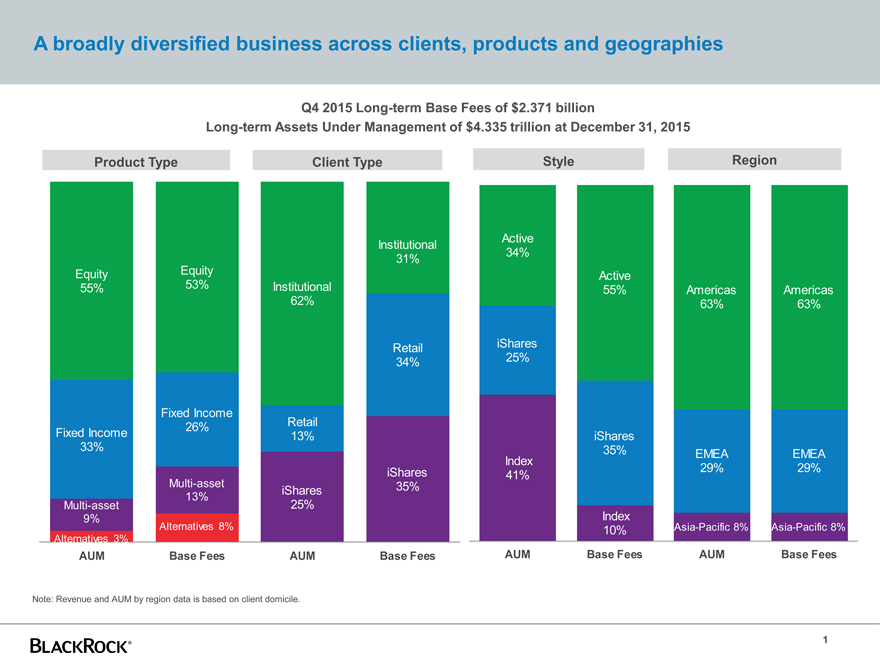
A broadly diversified business across clients, products and geographies Q4 2015 Long-term Base Fees of $2.371 billion Long-term Assets Under Management of $4.335 trillion at December 31, 2015 Product Type Client Type Style Region Alternatives 3%Alternatives 8%Multi-asset9%Multi-asset13%Fixed Income33%Fixed Income26%Equity55%Equity53%iShares25%iShares35%Retail13%Retail34%Institutional62%Institutional31%AUMBase FeesAUMBase FeesIndex41%Index10%iShares25%iShares35%Asia-Pacific 8%Asia-Pacific 8%EMEA29%EMEA29%Americas63%Americas63%Active34%Active55%AUMBase FeesAUMBase Fees Note: Revenue and AUM by region data is based on client domicile. 1 BLACKROCK®
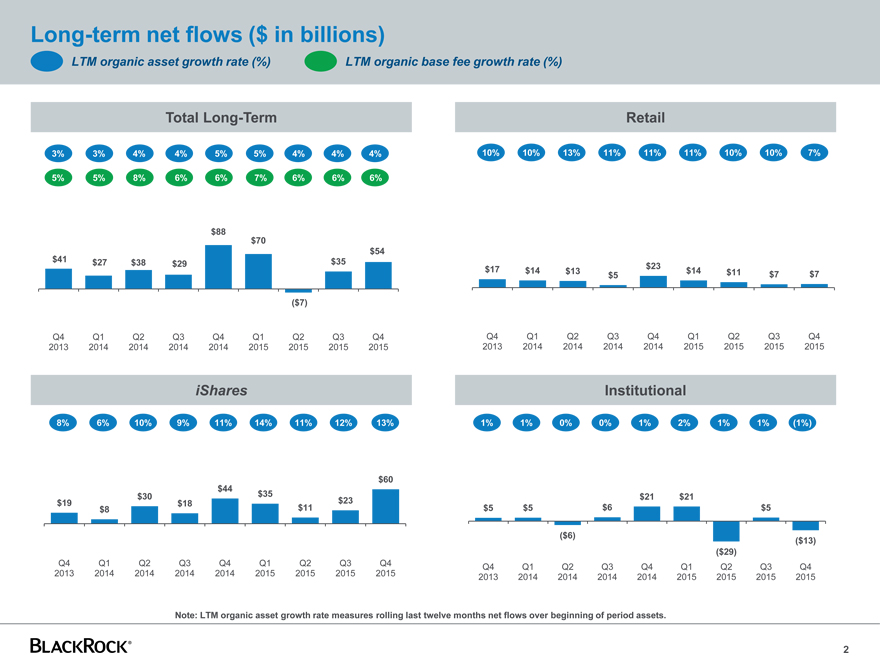
Long-term net flows ($ in billions) 6% 4% 4% $41 $27 $38 $29 $88 $70 ($7) $35 $54 Q4 2013 Q1 2014 Q2 2014 Q3 2014 Q4 2014 Q1 2015 Q2 2015 Q3 2015 Q4 2015 3% 3% 4% 4% 5% Total Long-Term Retail iShares Institutional $17 $14 $13 $5 $23 $14 $11 $7 $7 Q4 2013 Q1 2014 Q2 2014 Q3 2014 Q4 2014 Q1 2015 Q2 2015 Q3 2015 Q4 2015 $19 $8 $30 $18 $44 $35 $11 $23 $60 Q4 2013 Q1 2014 Q2 2014 Q3 2014 Q4 2014 Q1 2015 Q2 2015 Q3 2015 Q4 2015 $5 $5 ($6) $6 $21 $21 ($29) $5 ($13) Q4 2013 Q1 2014 Q2 2014 Q3 2014 Q4 2014 Q1 2015 Q2 2015 Q3 2015 Q4 2015 LTM organic asset growth rate (%) LTM organic base fee growth rate (%) 4% BLACKROCK®
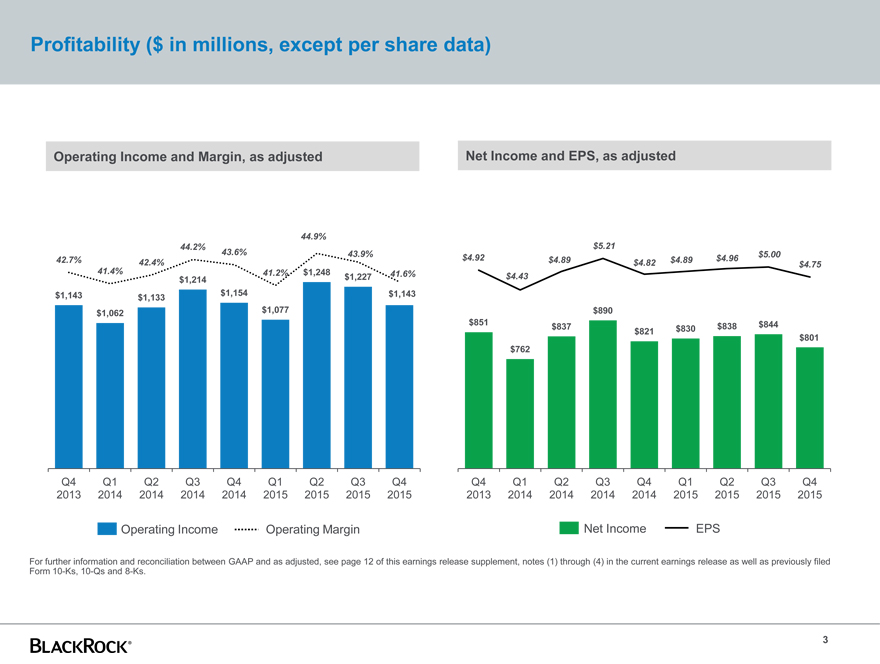
Profitability ($ in millions, except per share data) Net Income and EPS, as adjusted Operating Income and Margin, as adjusted For further information and reconciliation between GAAP and as adjusted, see page 12 of this earnings release supplement, notes (1) through (4) in the current earnings release as well as previously filed Form 10-Ks, 10-Qs and 8-Ks.
Operating Income Operating Margin Net Income EPS
$851 $762 $837 $890 $821 $830 $838 $844 $801 $4.92 $4.43 $4.89 $5.21 $4.82 $4.89 $4.96 $5.00 $4.75 $0.00 $1.00 $2.00 $3.00 $4.00 $5.00 $6.00 $400 $500 $600 $700 $800 $900 $1,000 $1,100 $1,200 Q4 2013 Q1 2014 Q2 2014 Q3 2014 Q4 2014 Q1 2015 Q2 2015 Q3 2015 Q4 2015 $1,143 $1,062 $1,133 $1,214 $1,154 $1,077 $1,248 $1,227 $1,143 42.7% 41.4% 42.4% 44.2% 43.6% 41.2% 44.9% 43.9% 41.6% 20.0% 25.0% 30.0% 35.0% 40.0% 45.0% $400 $500 $600 $700 $800 $900 $1,000 $1,100 $1,200 $1,300 $1,400 $1,500 Q4 2013 Q1 2014 Q2 2014 Q3 2014 Q4 2014 Q1 2015 Q2 2015 Q3 2015 Q4 2015 3 BLACKROCK®
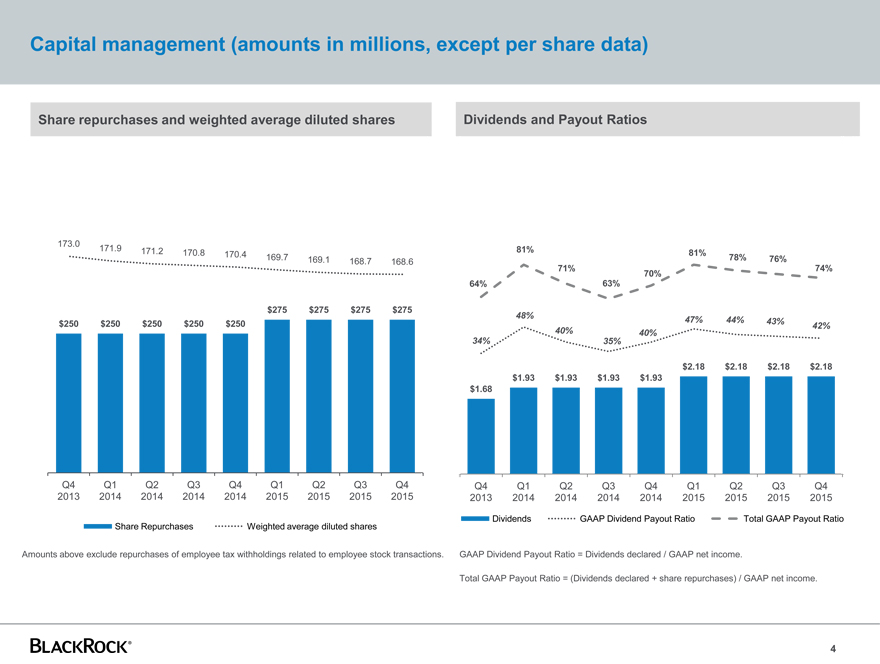
Capital management (amounts in millions, except per share data)
$1.68 $1.93 $1.93 $1.93 $1.93 $2.18 $2.18 $2.18 $2.18 34% 48% 40% 35% 40% 47% 44% 43% 42% 64% 81% 71% 63% 70% 81% 78% 76% 74% -30% -10% 10% 30% 50% 70% 90% 110% 130% 150% $0.00 $0.50 $1.00 $1.50 $2.00 $2.50 $3.00 $3.50 $4.00 $4.50 $5.00 $5.50 $6.00 $6.50 $7.00 $7.50 $8.00 Q4 2013 Q1 2014 Q2 2014 Q3 2014 Q4 2014 Q1 2015 Q2 2015 Q3 2015 Q4 2015 Dividends GAAP Dividend Payout Ratio Total GAAP Payout Ratio $275 $275 $275 $275 $250 $250 $250 $250 $250 168.6 168.7 169.1 169.7 170.4 170.8 171.2 171.9 173.0 Q4 2015 Q3 2015 Q2 2015 Q1 2015 Q4 2014 Q3 2014 Q2 2014 Q1 2014 Q4 2013 Share Repurchases Weighted average diluted shares Amounts above exclude repurchases of employee tax withholdings related to employee stock transactions. GAAP Dividend Payout Ratio = Dividends declared / GAAP net income. Total GAAP Payout Ratio = (Dividends declared + share repurchases) / GAAP net income. Share repurchases and weighted average diluted shares Dividends and Payout Ratios 4 BLACKROCK®
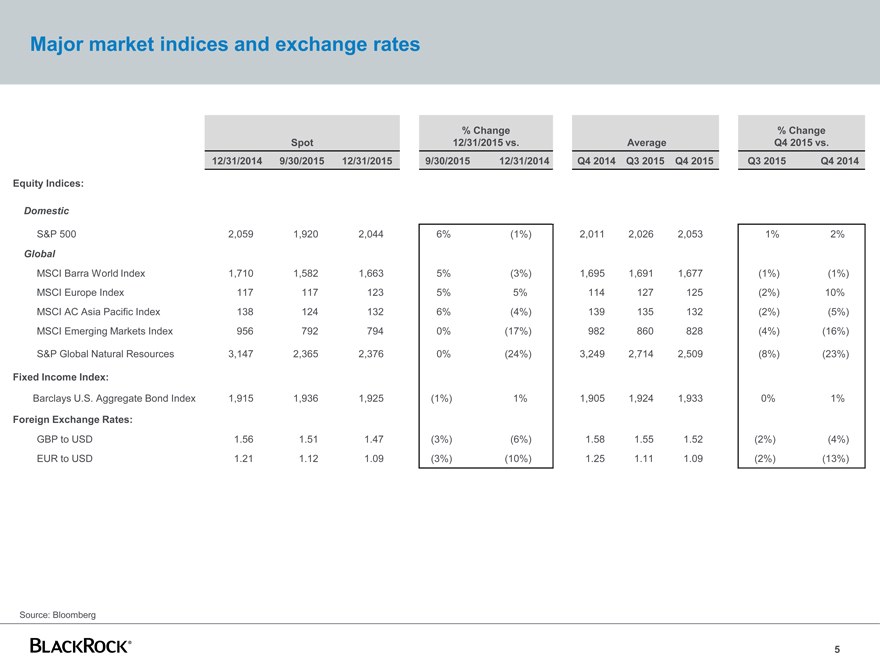
Major market indices and exchange rates Spot % Change 12/31/2015 vs. Average % Change Q4 2015 vs. 12/31/2014 9/30/2015 12/31/2015 9/30/2015 12/31/2014 Q4 2014 Q3 2015 Q4 2015 Q3 2015 Q4 2014 Equity Indices: Domestic S&P 500 2,059 1,920 2,044 6% (1%) 2,011 2,026 2,053 1% 2% Global MSCI Barra World Index 1,710 1,582 1,663 5% (3%) 1,695 1,691 1,677 (1%) (1%) MSCI Europe Index 117 117 123 5% 5% 114 127 125 (2%) 10% MSCI AC Asia Pacific Index 138 124 132 6% (4%) 139 135 132 (2%) (5%) MSCI Emerging Markets Index 956 792 794 0% (17%) 982 860 828 (4%) (16%) S&P Global Natural Resources 3,147 2,365 2,376 0% (24%) 3,249 2,714 2,509 (8%) (23%) Fixed Income Index: Barclays U.S. Aggregate Bond Index 1,915 1,936 1,925 (1%) 1% 1,905 1,924 1,933 0% 1% Foreign Exchange Rates: GBP to USD 1.56 1.51 1.47 (3%) (6%) 1.58 1.55 1.52 (2%) (4%) EUR to USD 1.21 1.12 1.09 (3%) (10%) 1.25 1.11 1.09 (2%) (13%) BLACKROCK®
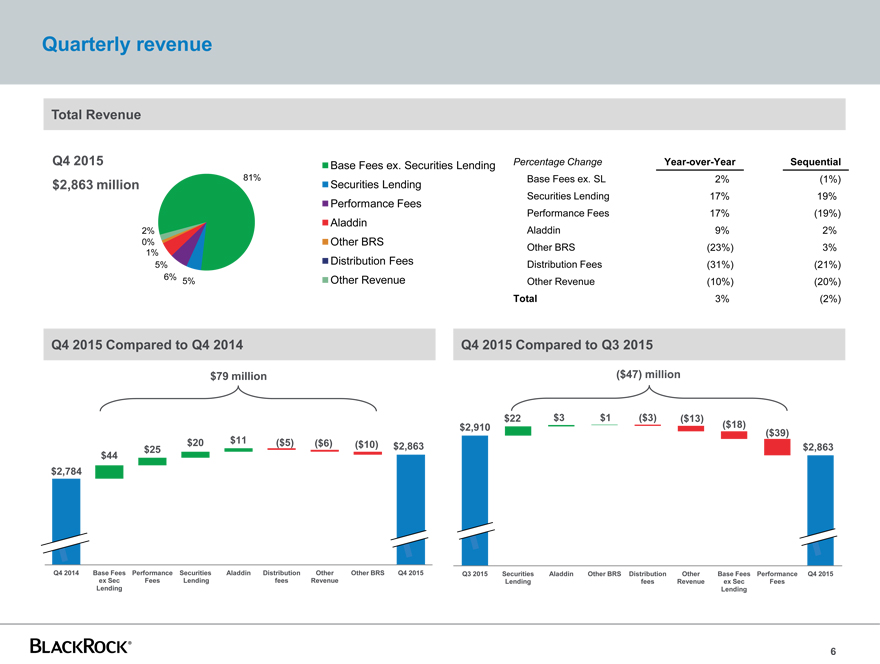
Quarterly revenue
$2,910 $2,863 $22 $3 $1 ($3) ($13) ($18) ($39) Q3 2015 Securities Lending Aladdin Other BRS Distribution fees Other Revenue Base Fees ex Sec Lending Performance Fees Q4 2015 $2,784 $2,863 $44 $25 $20 $11 ($5) ($6) ($10) Q4 2014 Base Fees ex Sec Lending Performance Fees Securities Lending Aladdin Distribution fees Other Revenue Other BRS Q4 2015 81% 5% 6% 5% 1% 0% 2% Base Fees ex. Securities Lending Securities Lending Performance Fees Aladdin Other BRS Distribution Fees Other Revenue Q4 2015 Compared to Q4 2014 $79 million Total Revenue Q4 2015 Compared to Q3 2015
($47) million Percentage Change Year-over-Year Sequential
Base Fees ex. SL 2% (1%)
Securities Lending 17% 19%
Performance Fees 17% (19%)
Aladdin 9% 2%
Other BRS (23%) 3%
Distribution Fees (31%) (21%)
Other Revenue (10%) (20%)
Total 3% (2%)
BLACKROCK®
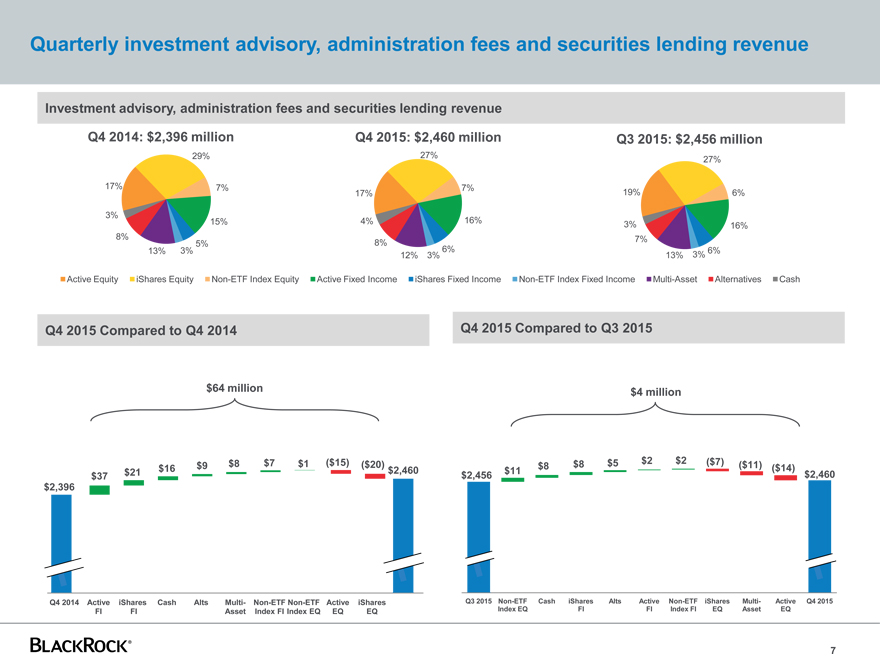
Quarterly investment advisory, administration fees and securities lending revenue
$2,456 $2,460 $11 $8 $8 $5 $2 $2 ($7) ($11) ($14) Q3 2015 Non-ETF Index EQ Cash iShares FI Alts Active FI Non-ETF Index FI iShares EQ Multi- Asset Active EQ Q4 2015 $2,396 $2,460 $37 $21 $16 $9 $8 $7 $1 ($15) ($20) Q4 2014 Active FI iShares FI Cash Alts Multi- Asset Non-ETF Index FI Non-ETF Index EQ Active EQ iShares EQ Q4 2015 Compared to Q4 2014 Investment advisory, administration fees and securities lending revenue $64 million Q4 2015 Compared to Q3 2015 $4 million 7 17% 29% 7% 15% 5% 3% 13% 8% 3% Active Equity iShares Equity Non-ETF Index Equity Active Fixed Income iShares Fixed Income Non-ETF Index Fixed Income Multi-Asset Alternatives Cash 17% 27% 7% 16% 6% 3% 12% 8% 4% Q4 2015: $2,460 million Q4 2014: $2,396 million 19% 27% 6% 16% 6% 3% 13% 7% 3% Q3 2015: $2,456 million BLACKROCK®
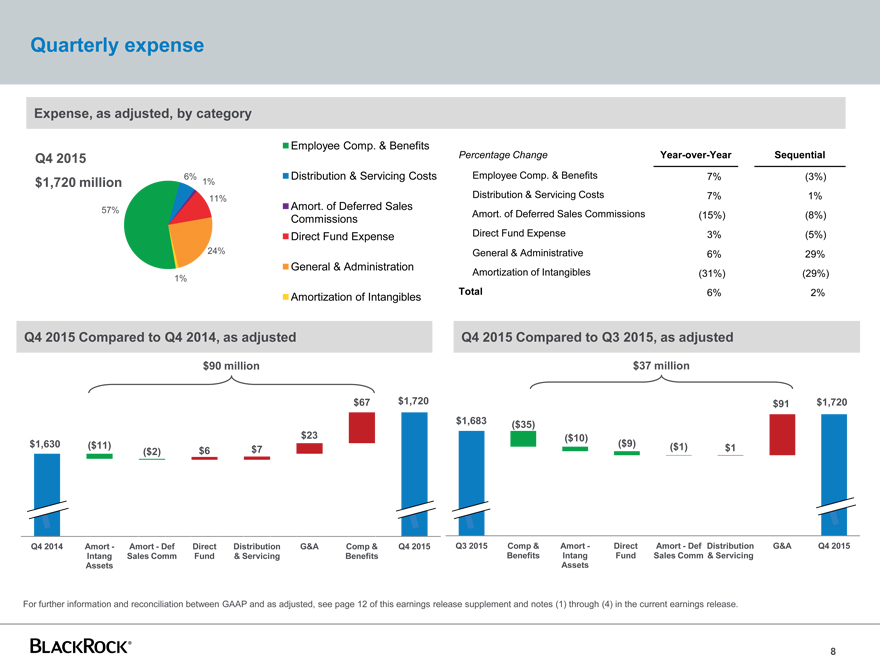
Quarterly expense $1,630 $1,720 $6 $7 $23 $67 ($11) ($2) Q4 2014 Amort—Intang Assets Amort—Def Sales Comm Direct Fund Distribution & Servicing G&A Comp & Benefits Q4 2015 $1,683 $1,720 $1 $91 ($35) ($10) ($9) ($1) Q3 2015 Comp & Benefits Amort—Intang Assets Direct Fund Amort—Def Sales Comm Distribution & Servicing G&A Q4 2015 Expense, as adjusted, by category Q4 2015 Compared to Q4 2014, as adjusted For further information and reconciliation between GAAP and as adjusted, see page 12 of this earnings release supplement and notes (1) through (4) in the current earnings release. $90 million 57% 6% 1% 11% 24% 1% Employee Comp. & Benefits Distribution & Servicing Costs Amort. of Deferred Sales Commissions Direct Fund Expense General & Administration
Amortization of Intangibles Q4 2015 Compared to Q3 2015, as adjusted $37 million Percentage Change Year-over-Year Sequential
Employee Comp. & Benefits 7% (3%)
Distribution & Servicing Costs 7% 1%
Amort. of Deferred Sales Commissions (15%) (8%)
Direct Fund Expense 3% (5%)
General & Administrative 6% 29%
Amortization of Intangibles (31%) (29%)
Total 6% 2% BLACKROCK®
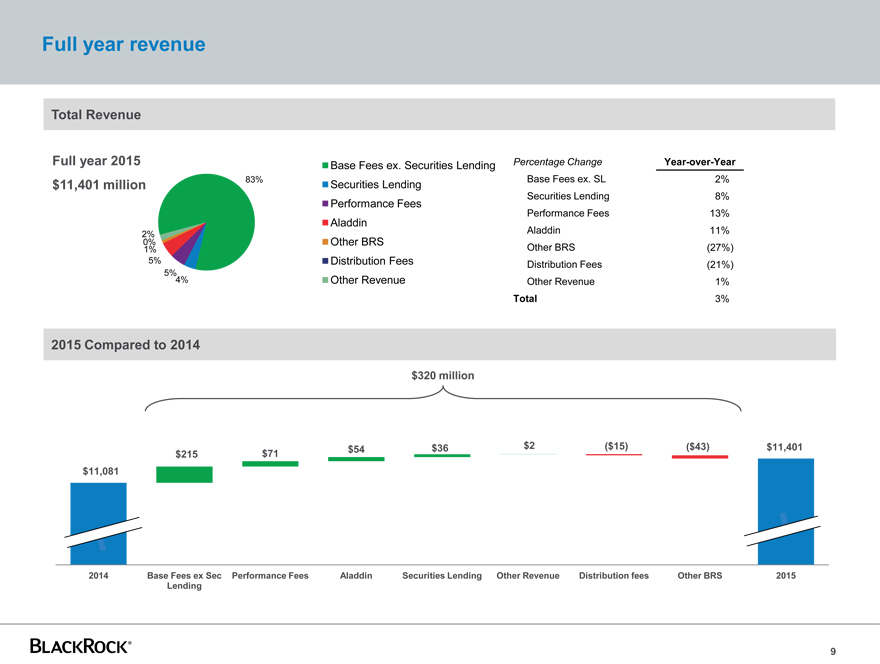
Full year revenue $11,081
$11,401 $215 $71 $54 $36 $2 ($15) ($43)
2014 Base Fees ex Sec Lending Performance Fees Aladdin Securities Lending Other Revenue Distribution fees Other BRS 2015 83% 4% 5% 5% 1% 0% 2% Base Fees ex. Securities Lending Securities Lending Performance Fees Aladdin Other BRS Distribution Fees Other Revenue 2015 Compared to 2014 $320 million Total Revenue Percentage Change Year-over-Year Base Fees ex. SL 2% Securities Lending 8% Performance Fees 13% Aladdin 11% Other BRS (27%) Distribution Fees (21%) Other Revenue 1% Total 3% BLACKROCK®
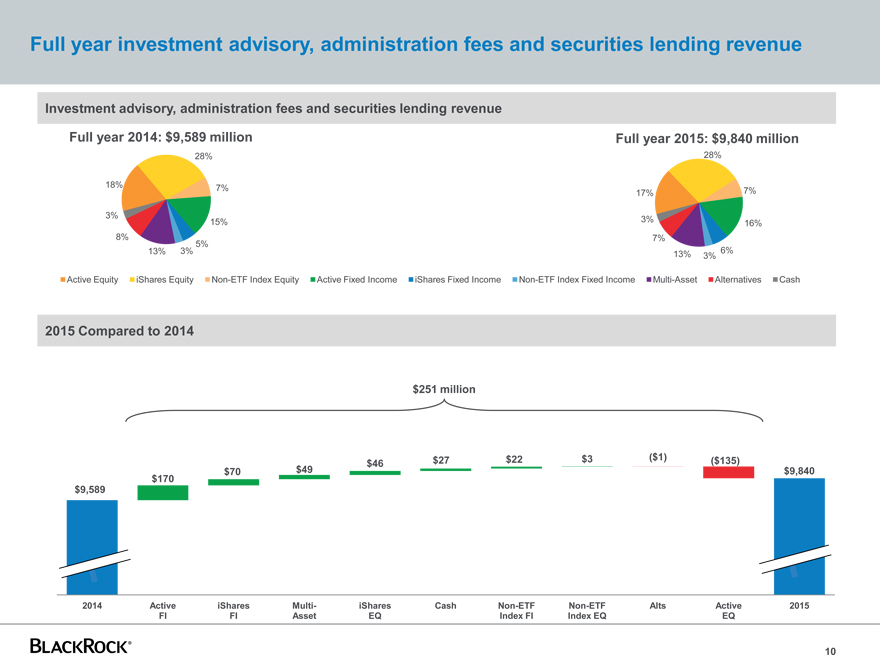
Full year investment advisory, administration fees and securities lending revenue
$9,589 $9,840 $170 $70 $49 $46 $27 $22 $3 ($1) ($135)
2014 Active FI iShares FI Multi- Asset iShares EQ Cash Non-ETF Index FI Non-ETF Index EQ Alts Active EQ 2015
2015 Compared to 2014 Investment advisory, administration fees and securities lending revenue $251 million 10 18% 28% 7% 15% 5% 3% 13% 8% 3% Active Equity iShares Equity Non-ETF Index Equity Active Fixed Income iShares Fixed Income Non-ETF Index Fixed Income Multi-Asset Alternatives Cash 17% 28% 7% 16% 6% 3% 13% 7% 3% Full year 2015: $9,840 million Full year 2014: $9,589 million BLACKROCK®
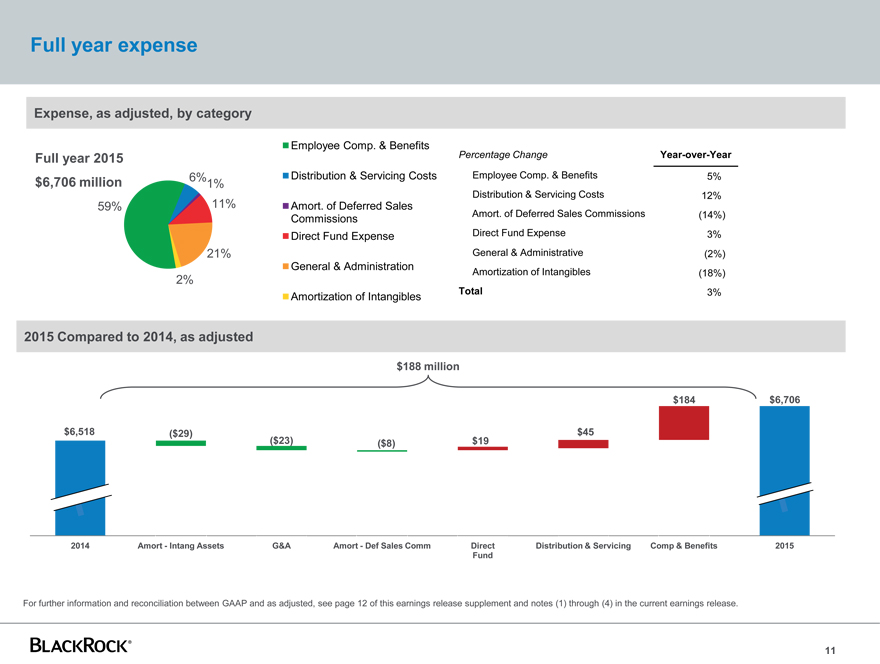
Full year expense
$6,518 $6,706 $19 $45 $184 ($29) ($23) ($8) 2014 Amort—Intang Assets G&A Amort—Def Sales Comm Direct Fund Distribution & Servicing Comp & Benefits 2015 Expense, as adjusted, by category 2015 Compared to 2014, as adjusted For further information and reconciliation between GAAP and as adjusted, see page 12 of this earnings release supplement and notes (1) through (4) in the current earnings release. $188 million 59% 6% 1% 11% 21% 2% Employee Comp. & Benefits Distribution & Servicing Costs Amort. of Deferred Sales Commissions Direct Fund Expense General & Administration Amortization of Intangibles Percentage Change Year-over-Year Employee Comp. & Benefits 5% Distribution & Servicing Costs 12% Amort. of Deferred Sales Commissions (14%) Direct Fund Expense 3% General & Administrative (2%) Amortization of Intangibles (18%) Total 3%
BLACKROCK®
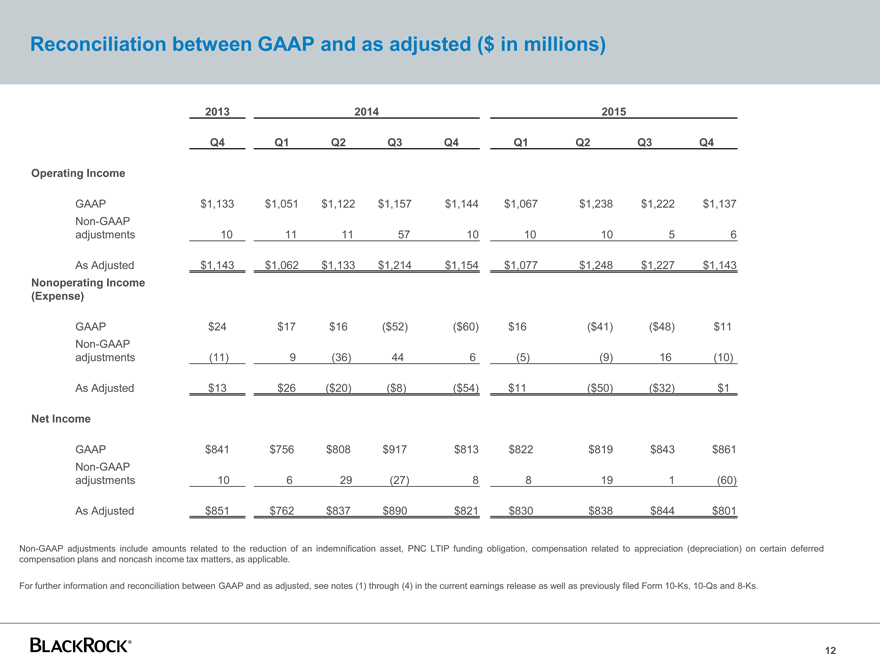
Reconciliation between GAAP and as adjusted ($ in millions) 2013 2014 2015 Q4 Q1 Q2 Q3 Q4 Q1 Q2 Q3 Q4 Operating Income GAAP $1,133 $1,051 $1,122 $1,157 $1,144 $1,067 $1,238 $1,222 $1,137 Non-GAAP adjustments 10 11 11 57 10 10 10 5 6 As Adjusted $1,143 $1,062 $1,133 $1,214 $1,154 $1,077 $1,248 $1,227 $1,143 Nonoperating Income (Expense) GAAP $24 $17 $16 ($52) ($60) $16 ($41) ($48) $11 Non-GAAP adjustments (11) 9 (36) 44 6 (5) (9) 16 (10) As Adjusted $13 $26 ($20) ($8) ($54) $11 ($50) ($32) $1 Net Income GAAP $841 $756 $808 $917 $813 $822 $819 $843 $861 Non-GAAP adjustments 10 6 29 (27) 8 8 19 1 (60) As Adjusted $851 $762 $837 $890 $821 $830 $838 $844 $801
BLACKROCK®
Important Notes This presentation, and other statements that BlackRock, Inc. (“BlackRock”) may make, may contain forward-looking statements within the meaning of the Private Securities Litigation Reform Act, with respect to BlackRock’s future financial or business performance, strategies or expectations. Forward-looking statements are typically identified by words or phrases such as “trend,” “potential,” “opportunity,” “pipeline,” “believe,” “comfortable,” “expect,” “anticipate,” “current,” “intention,” “estimate,” “position,” “assume,” “outlook,” “continue,” “remain,” “maintain,” “sustain,” “seek,” “achieve,” and similar expressions, or future or conditional verbs such as “will,” “would,” “should,” “could,” “may” and similar expressions. BlackRock cautions that forward-looking statements are subject to numerous assumptions, risks and uncertainties, which change over time. Forward-looking statements speak only as of the date they are made, and BlackRock assumes no duty to and does not undertake to update forward-looking statements. Actual results could differ materially from those anticipated in forward-looking statements and future results could differ materially from historical performance. In addition to risk factors previously disclosed in BlackRock’s Securities and Exchange Commission reports and those identified elsewhere in this presentation, the following factors, among others, could cause actual results to differ materially from forward-looking statements or historical performance: (1) the introduction, withdrawal, success and timing of business initiatives and strategies; (2) changes and volatility in political, economic or industry conditions, the interest rate environment, foreign exchange rates or financial and capital markets, which could result in changes in demand for products or services or in the value of assets under management; (3) the relative and absolute investment performance of BlackRock’s investment products; (4) the impact of increased competition; (5) the impact of future acquisitions or divestitures; (6) the unfavorable resolution of legal proceedings; (7) the extent and timing of any share repurchases; (8) the impact, extent and timing of technological changes and the adequacy of intellectual property, information and cyber security protection; (9) the impact of legislative and regulatory actions and reforms, including the Dodd-Frank Wall Street Reform and Consumer Protection Act, and regulatory, supervisory or enforcement actions of government agencies relating to BlackRock or The PNC Financial Services Group, Inc.; (10) terrorist activities, international hostilities and natural disasters, which may adversely affect the general economy, domestic and local financial and capital markets, specific industries or BlackRock; (11) the ability to attract and retain highly talented professionals; (12) fluctuations in the carrying value of BlackRock’s economic investments; (13) the impact of changes to tax legislation, including income, payroll and transaction taxes, and taxation on products or transactions, which could affect the value proposition to clients and, generally, the tax position of BlackRock; (14) BlackRock’s success in maintaining the distribution of its products; (15) the impact of BlackRock electing to provide support to its products from time to time and any potential liabilities related to securities lending or other indemnification obligations; and (16) the impact of problems at other financial institutions or the failure or negative performance of products at other financial institutions. This presentation also includes non-GAAP financial measures. You can find our presentations on the most directly comparable GAAP financial measures calculated in accordance with GAAP and our reconciliations on page 12 of this earnings release supplement, our current earnings release dated January 15, 2016, and BlackRock’s other periodic reports, which are available on BlackRock’s web site at www.blackrock.com. 13
10%
10%
13%
11%
11%
11%
10%
10%
8%
6%
10%
9%
11%
14%
11%
12%
1%
1%
0%
0%
1%
2%
1%
1%
Note: LTM organic asset growth rate measures rolling last twelve months net flows over beginning of period assets.
5%
5%
5%
8%
6%
6%
7%
6%
6%
7%
13%
(1%)2
BLACKROCK®