Attached files
| file | filename |
|---|---|
| 8-K - 8-K - STORE CAPITAL Corp | a16-1911_18k.htm |
Exhibit 99.1
S T O R E Investor and Analyst Day Four Seasons Resort, Scottsdale, Arizona January 14, 2016 Introductory Comments and Observations Christopher Volk, CEO The LEADER in Middle Market Real Estate Capital Solutions SINGLE TENANT OPERATIONAL REAL ESTATE
Disclaimer This presentation includes forward-looking statements within the meaning of Section 27A of the Securities Act of 1933, as amended, and section 21E of the securities exchange act of 1934, as amended, that are subject to the “safe harbor” created by those sections. These forward-looking statements include comments with respect to our objectives and strategies, and the results of our operations and our business. Forward-looking statements can be identified by the fact that they do not relate strictly to historical or current facts. They often include words such as “expects,” “assumes,” “anticipates,” “intends,” “plans,” “believes,” “seeks,” “estimates” or words of similar meaning, or future or conditional words such as “assuming,” “will,” “would,” “possible,” “proposed,” “projected,” “positioned,” “vision,” “opportunity,” “should,” “could,” “indicative,” “target” or “may.” FORWARD-LOOKING STATEMENTS INVOLVE NUMEROUS RISKS AND UNCERTAINTIES, AND YOU SHOULD NOT RELY ON THEM AS PREDICTIONS OF FUTURE EVENTS. FORWARD-LOOKING STATEMENTS DEPEND ON ASSUMPTIONS, DATA OR METHODS THAT MAY BE INCORRECT OR IMPRECISE, AND WE MAY NOT BE ABLE TO REALIZE THEM. WE DO NOT GUARANTEE THAT THE TRANSACTIONS AND EVENTS DESCRIBED WILL HAPPEN AS DESCRIBED (OR THAT THEY WILL HAPPEN AT ALL). THE FOLLOWING FACTORS, AMONG OTHERS, COULD CAUSE ACTUAL RESULTS AND FUTURE EVENTS TO DIFFER MATERIALLY FROM THOSE SET FORTH OR CONTEMPLATED IN THE FORWARD-LOOKING STATEMENTS: general business and economic conditions; continued volatility and uncertainty in the credit markets and broader financial markets, including potential fluctuations in the consumer price index; other risks inherent in the real estate business, including tenant defaults, potential liability relating to environmental matters, illiquidity of real estate investments, and potential damages from natural disasters; availability of suitable properties to acquire and our ability to acquire and lease those properties on favorable terms; ability to renew leases, lease vacant space or re-lease space as existing leases expire or are terminated; the degree and nature of our competition; our failure to generate sufficient cash flows to service our outstanding indebtedness; access to debt and equity capital markets; fluctuating interest rates; availability of qualified personnel and our ability to retain our key management personnel; changes in, or the failure or inability to comply with, government regulation, including Maryland laws; failure to maintain our status as a REIT; changes in the U.S. tax law and other U.S. laws, whether or not specific to REITs; and the risks described in the Company’s Annual Report on Form 10-K for the fiscal year ended December 31, 2014 and other filings of the Company under the Securities Act of 1933, as amended, and the Securities Exchange Act of 1934, as amended. This presentation contains references to our copyrights, trademarks and service marks and to those belonging to other entities. Solely for convenience, copyrights, trademarks, trade names and service marks referred to in this presentation may appear without the © or ® or TM or SM symbols, but such references are not intended to indicate, in any way, that we will not assert, to the fullest extent under applicable law, our rights or the rights of the applicable licensor to these copyrights, trademarks, trade names and service marks. We do not intend our use or display of other companies’ trade names, copyrights, trademarks or service marks to imply a relationship with, or endorsement or sponsorship of us by, any other companies. The information contained in this presentation is provided for illustrative purposes only and does not represent the Company’s actual financial performance or projected financial performance, or guidance, for the Company. This information is intended to demonstrate hypothetical results generated by a financial model that could be used to analyze REIT performance based on various factors and assumptions. Actual results would be impacted by different factors than those assumed herein and by actual financial results, as well AS additional factors such as investment portfolio performance, investment timing, capital markets timing and other factors. In particular, you should not consider the inputs to the financial model reflected in this presentation (including, without limitation, asset growth rates, lease rates and borrowing costs) to represent guidance or an indication of management’s expectations with respect to the Company’s future financial performance.
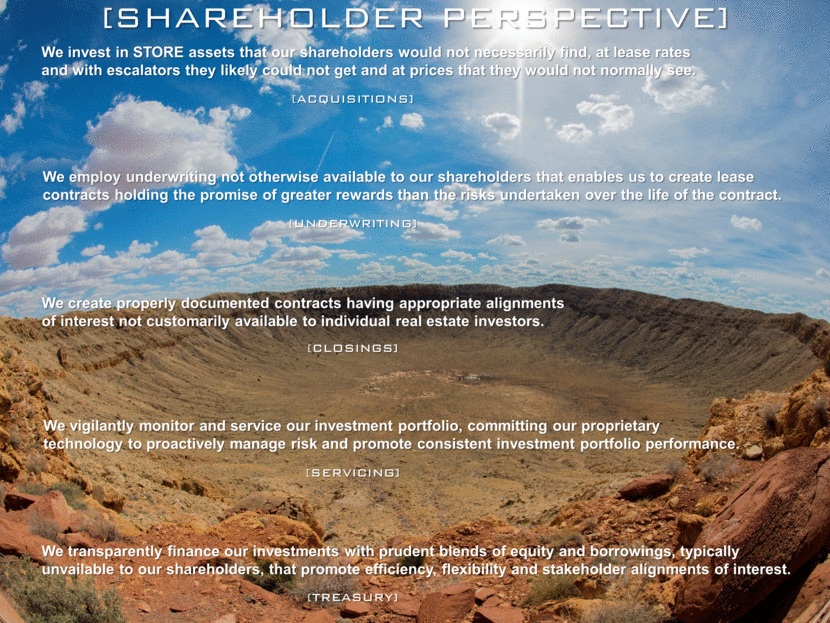
We invest in STORE assets that our shareholders would not necessarily find, at lease rates and with escalators they likely could not get and at prices that they would not normally see. We employ underwriting not otherwise available to our shareholders that enables us to create lease contracts holding the promise of greater rewards than the risks undertaken over the life of the contract. We create properly documented contracts having appropriate alignments of interest not customarily available to individual real estate investors. We vigilantly monitor and service our investment portfolio, committing our proprietary technology to proactively manage risk and promote consistent investment portfolio performance. We transparently finance our investments with prudent blends of equity and borrowings, typically unvailable to our shareholders, that promote efficiency, flexibility and stakeholder alignments of interest. [ACQUISITIONS] [UNDERWRITING] [CLOSINGS] [SERVICING] [TREASURY] [SHAREHOLDER PERSPECTIVE]
We listen to and understand the needs of our customers in order to create superior real estate capital solutions for them to grow their wealth and make us their landlord of choice. We take the time to understand the businesses of our customers in order to devote our financial and intellectual capital to their success. We create contracts having mutual alignments of interest that offer our customers enhanced flexibility to operate their businesses, thereby increasing their potential to create wealth. We are responsive to the ongoing daily real estate administration needs of our customers to minimize their frictional costs and enable capital solutions for properties within our portfolio. We conduct our corporate treasury activities in ways that enhance the financial flexibility of our customers, making them better off for having selected us for their real estate capital solutions. [ACQUISITIONS] [UNDERWRITING] [CLOSINGS] [SERVICING] [TREASURY] [CUSTOMER PERSPECTIVE]
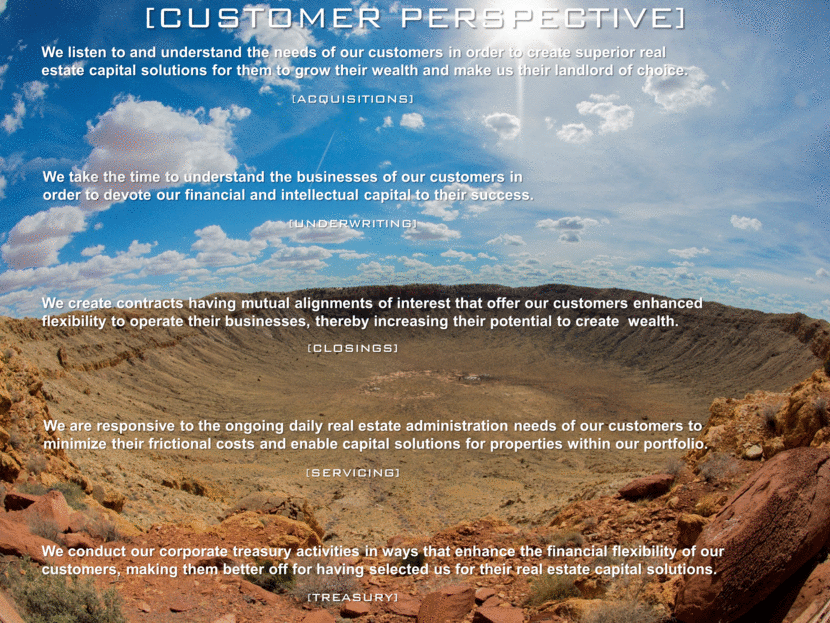
Making an Impact Meteor Crater is located near Winslow, Arizona and is the world’s best preserved meteorite impact site. The meteorite impact resulted in a crater nearly one mile across, 2.4 miles in circumference and more than 550 feet deep.

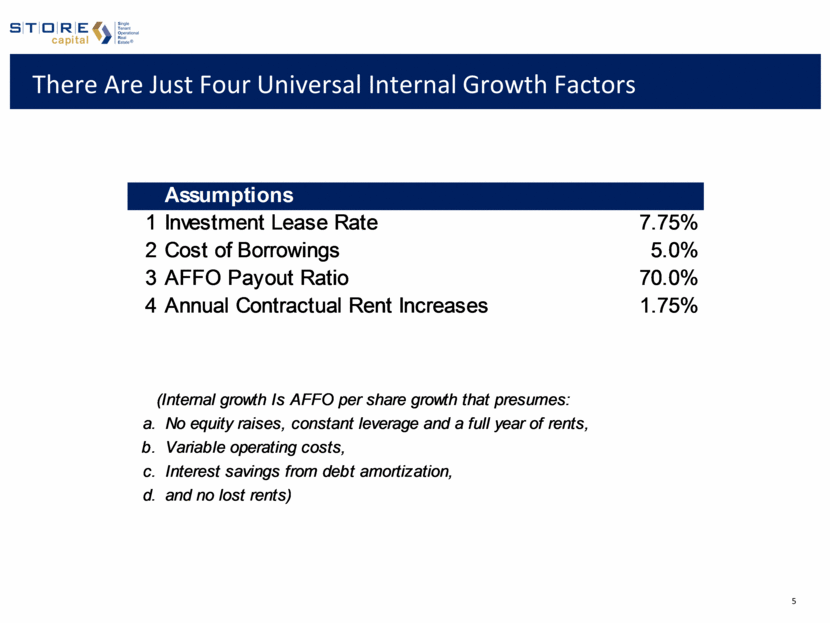
There Are Just Four Universal Internal Growth Factors (Internal growth Is AFFO per share growth that presumes: a. No equity raises, constant leverage and a full year of rents, b. Variable operating costs, c. Interest savings from debt amortization, d. and no lost rents) Assumptions 1 Investment Lease Rate 7.75% 2 Cost of Borrowings 5.0% 3 AFFO Payout Ratio 70.0% 4 Annual Contractual Rent Increases 1.75%
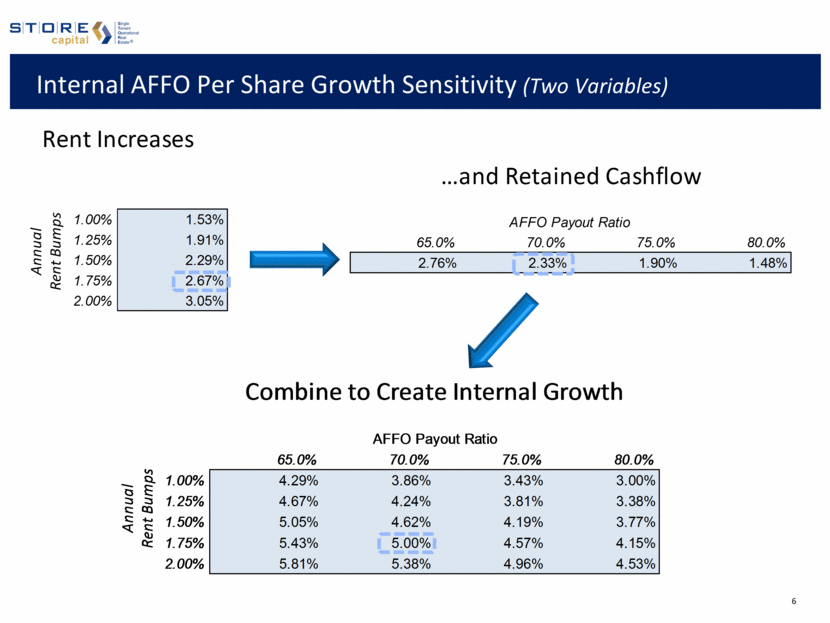
Internal AFFO Per Share Growth Sensitivity (Two Variables) 65.0% 70.0% 75.0% 80.0% 1.00% 4.29% 3.86% 3.43% 3.00% 1.25% 4.67% 4.24% 3.81% 3.38% 1.50% 5.05% 4.62% 4.19% 3.77% 1.75% 5.43% 5.00% 4.57% 4.15% 2.00% 5.81% 5.38% 4.96% 4.53% Combine to Create Internal Growth AFFO Payout Ratio Annual Rent Bumps 65.0% 70.0% 75.0% 80.0% 2.76% 2.33% 1.90% 1.48% and Retained Cashflow AFFO Payout Ratio 1.00% 1.53% 1.25% 1.91% 1.50% 2.29% 1.75% 2.67% 2.00% 3.05% Rent Increases Annual Rent Bumps
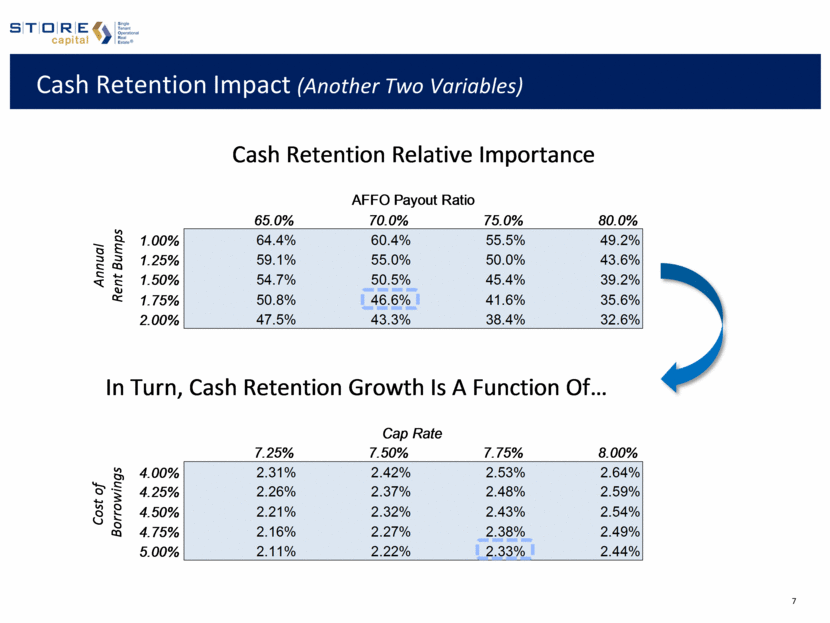
Cash Retention Impact (Another Two Variables) 65.0% 70.0% 75.0% 80.0% 1.00% 64.4% 60.4% 55.5% 49.2% 1.25% 59.1% 55.0% 50.0% 43.6% 1.50% 54.7% 50.5% 45.4% 39.2% 1.75% 50.8% 46.6% 41.6% 35.6% 2.00% 47.5% 43.3% 38.4% 32.6% AFFO Payout Ratio Cash Retention Relative Importance Annual Rent Bumps 7.25% 7.50% 7.75% 8.00% 4.00% 2.31% 2.42% 2.53% 2.64% 4.25% 2.26% 2.37% 2.48% 2.59% 4.50% 2.21% 2.32% 2.43% 2.54% 4.75% 2.16% 2.27% 2.38% 2.49% 5.00% 2.11% 2.22% 2.33% 2.44% In Turn, Cash Retention Growth Is A Function Of Cap Rate Cost of Borrowings
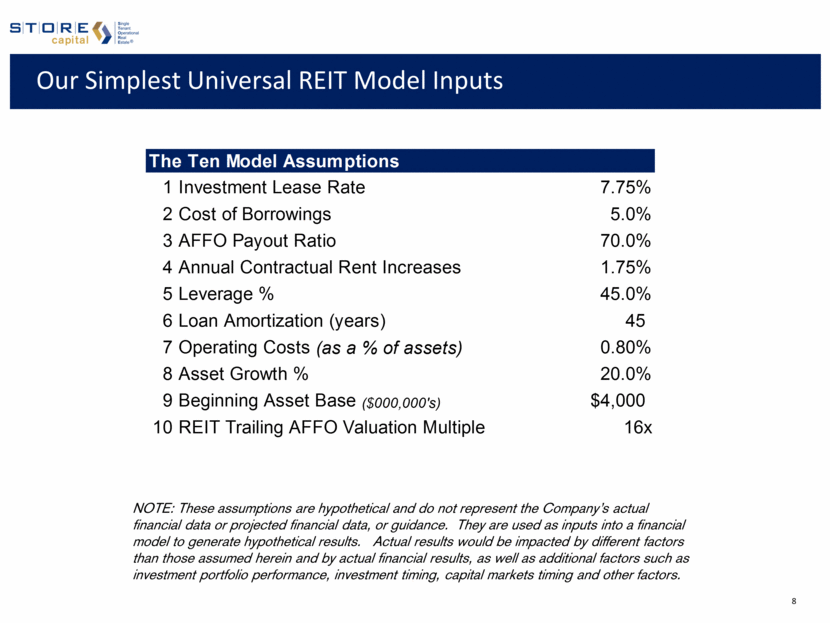
Our Simplest Universal REIT Model Inputs NOTE: These assumptions are hypothetical and do not represent the Company’s actual financial data or projected financial data, or guidance. They are used as inputs into a financial model to generate hypothetical results. Actual results would be impacted by different factors than those assumed herein and by actual financial results, as well as additional factors such as investment portfolio performance, investment timing, capital markets timing and other factors. The Ten Model Assumptions 1 Investment Lease Rate 7.75% 2 Cost of Borrowings 5.0% 3 AFFO Payout Ratio 70.0% 4 Annual Contractual Rent Increases 1.75% 5 Leverage % 45.0% 6 Loan Amortization (years) 45 7 Operating Costs (as a % of assets) 0.80% 8 Asset Growth % 20.0% 9 Beginning Asset Base ($000,000's) $4,000 10 REIT Trailing AFFO Valuation Multiple 16x
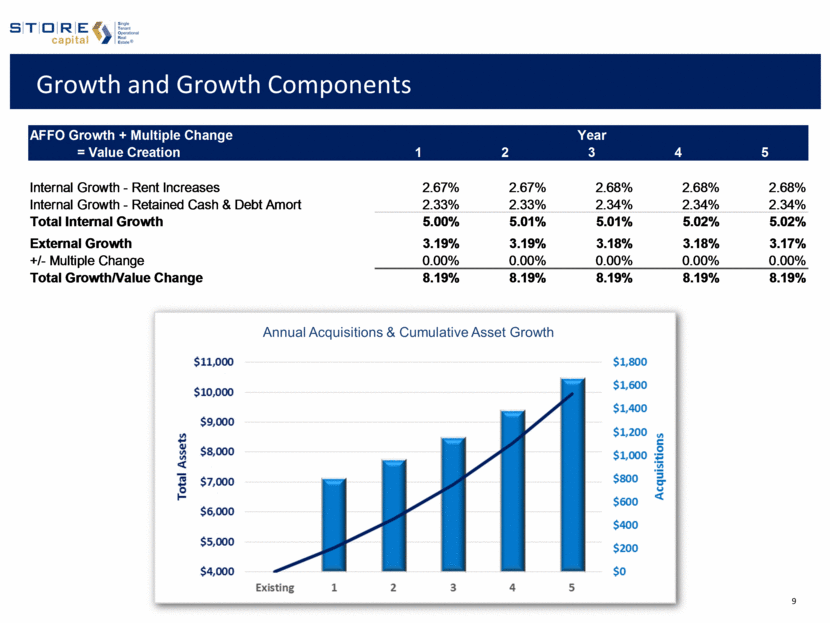
Growth and Growth Components Annual Acquisitions & Cumulative Asset Growth AFFO Growth + Multiple Change Year = Value Creation 1 2 3 4 5 Internal Growth - Rent Increases 2.67% 2.67% 2.68% 2.68% 2.68% Internal Growth - Retained Cash & Debt Amort 2.33% 2.33% 2.34% 2.34% 2.34% Total Internal Growth 5.00% 5.01% 5.01% 5.02% 5.02% External Growth 3.19% 3.19% 3.18% 3.18% 3.17% +/- Multiple Change 0.00% 0.00% 0.00% 0.00% 0.00% Total Growth/Value Change 8.19% 8.19% 8.19% 8.19% 8.19% year
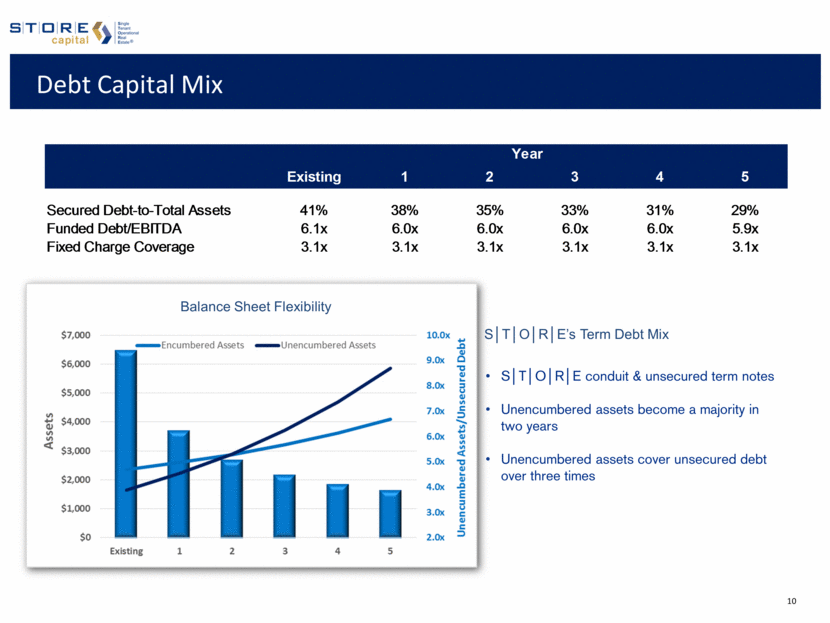
Debt Capital Mix S T O R E conduit & unsecured term notes Unencumbered assets become a majority in two years Unencumbered assets cover unsecured debt over three times Balance Sheet Flexibility S T O R E’s Term Debt Mix Year Existing 1 2 3 4 5 Secured Debt-to-Total Assets 41% 38% 35% 33% 31% 29% Funded Debt/EBITDA 6.1x 6.0x 6.0x 6.0x 6.0x 5.9x Fixed Charge Coverage 3.1x 3.1x 3.1x 3.1x 3.1x 3.1x
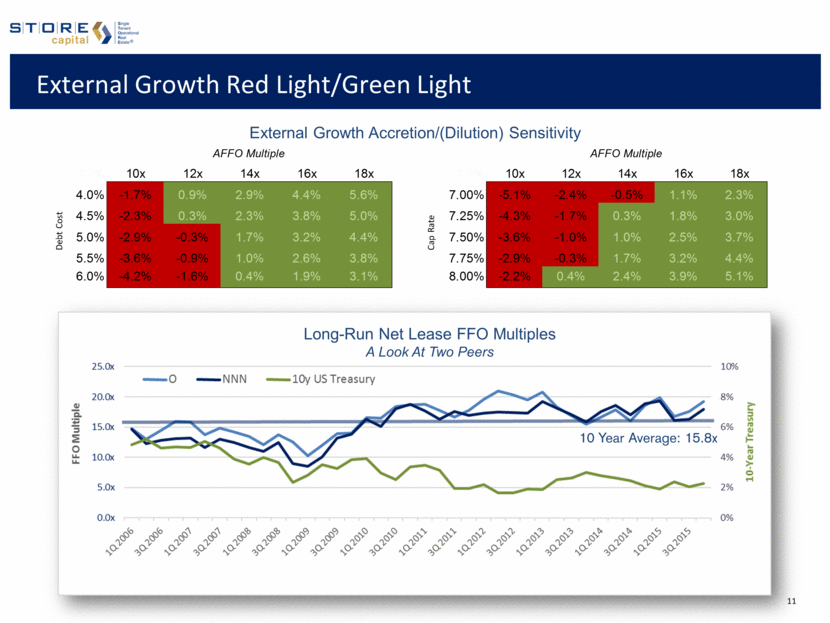
External Growth Red Light/Green Light Long-Run Net Lease FFO Multiples A Look At Two Peers 10 Year Average: 15.8x External Growth Accretion/(Dilution) Sensitivity AFFO Multiple AFFO Multiple 3.2% 10x 12x 14x 16x 18x 4.0% -1.7% 0.9% 2.9% 4.4% 5.6% 4.5% -2.3% 0.3% 2.3% 3.8% 5.0% 5.0% -2.9% -0.3% 1.7% 3.2% 4.4% 5.5% -3.6% -0.9% 1.0% 2.6% 3.8% 6.0% -4.2% -1.6% 0.4% 1.9% 3.1% Debt Cost AFFO Multiple 3.2% 10x 12x 14x 16x 18x 7.00% -5.1% -2.4% -0.5% 1.1% 2.3% 7.25% -4.3% -1.7% 0.3% 1.8% 3.0% 7.50% -3.6% -1.0% 1.0% 2.5% 3.7% 7.75% -2.9% -0.3% 1.7% 3.2% 4.4% 8.00% -2.2% 0.4% 2.4% 3.9% 5.1% Cap Rate
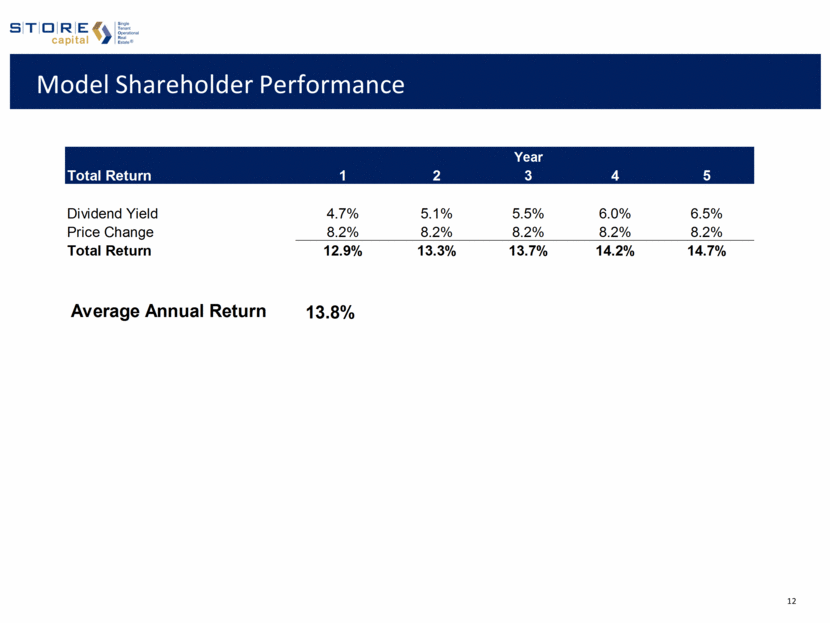
Model Shareholder Performance 2 5.1% 8.2% 13.3% 3 5.5% 8.2% 13.7% 4 6.0% 8.2% 14.2% 5 6.5% 8.2% 14.7% Year Total Return Dividend Yield Price Change Total Return 1 4.7% 8.2% 12.9% Average Annual Return 13.8%
