Attached files
| file | filename |
|---|---|
| 8-K - FORM 8-K - AMEDISYS INC | d104468d8k.htm |
 Right
care. Right care.
Right time. Right time. Right place. Right place. Amedisys Investor Presentation JP Morgan Healthcare Conference Exhibit 99.1 |
 1 Forward-looking Statements This presentation may include forward-looking statements as defined by the Private
Securities Litigation Reform Act of 1995. These forward-looking statements are
based upon current expectations and assumptions about our business that
are subject to a variety of risks and uncertainties that could cause
actual results to differ materially from those described in this
presentation. You should not rely on forward-looking statements as a
prediction of future events. Additional information regarding factors
that could cause actual results to differ materially from those discussed
in any forward-looking statements are described in reports and registration statements we file with the SEC, including our Annual Report on Form 10-K
and subsequent Quarterly Reports on Form 10-Q and Current Reports on Form 8-K,
copies of which are available on the Amedisys internet website http://www.amedisys.com or by contacting
the Amedisys Investor Relations department at (225) 292-2031. We
disclaim any obligation to update any forward-looking statements or any changes in events, conditions or circumstances upon which any forward-looking statement may be
based except as required by law.
www.amedisys.com
NASDAQ: AMED We encourage everyone to visit the Investors Section of our website at www.amedisys.com, where we have posted additional important information such as press releases, profiles concerning our business and clinical operations and control processes, and SEC filings. We intend to use our website to expedite public access to time-critical information regarding the Company in advance of or in lieu of distributing a press release or a filing with the SEC disclosing the same information. |
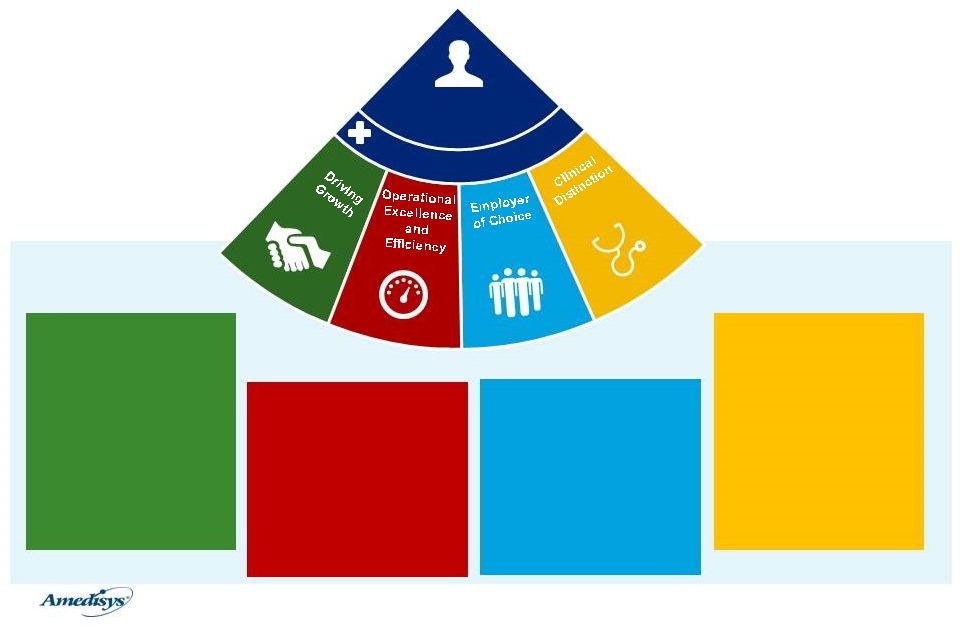 2 Amedisys Strategy Focusing on our four strategic areas will position us to grow through the headwinds we face
Outstanding Outcomes for Our Patients In Their Homes Amedisys Care Centers & Clinical Teams Current State: • Investing in Quality • 29% of centers at 4.0+ STARs Current State: • Q3’15 same store Medicare admissions growth of 4% • Q3’ 15 same store hospice admissions growth 26% • Closed Infinity acquisition Future: • All care centers at 4.0+ STARs at end of 2017 • VBP opportunity Current State: • Outsourcing of recruiting and onboarding • Implement engagement plans Future: • Lower voluntary turnover • Improved employee engagement and retention Current State: • 126 centers currently on HomeCare HomeBase • Rationalizing IT infrastructure Future: • Realize $40M - $50M in savings from IT and HCHB efficiencies Future: • Continued HH Medicare and Hospice Growth • Continued strong cash generation • Inorganic Growth |
 2016 and
2017 Headwinds & Tailwinds Q2’16
Q4’16 Q2’17 Q4’17 Total Impact of Rate Cut: $28M 2015 $40M - $50M Savings (HCHB and IT Efficiencies) $40M - $50M Savings $20M - $25M HCHB Efficiencies $20M - $25M IT Efficiencies Role Consolidation Regionalize Roles Optimize Clinician Mix Increase Productivity Lower Bad Debt Coding Accuracy Supplies Savings Breakdown of Savings Opportunity Impact of Rate Cuts and Savings Opportunity Role Consolidation Technology Savings |
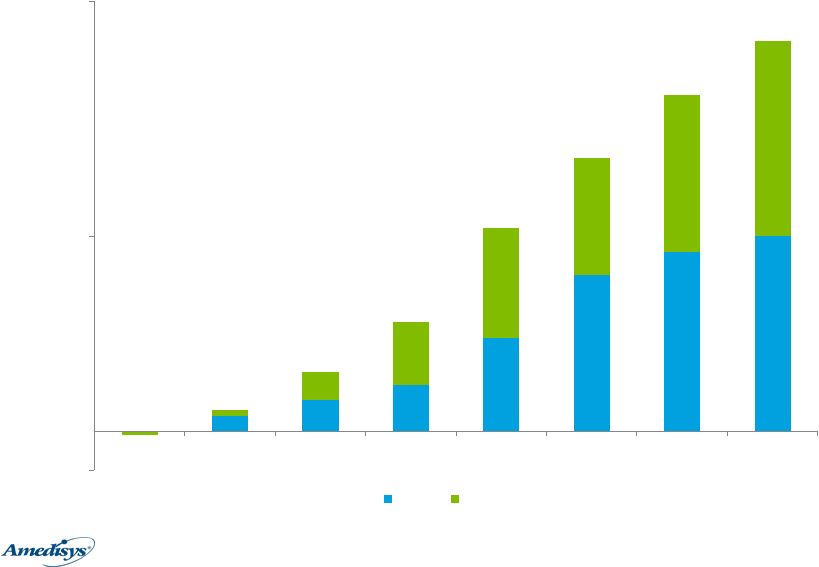 4 Roadmap to Annualized EBITDA Run Rate Improvement We are projecting $40M - $50M in annualized savings by Q4 2017. These savings will be achieved through our IT restructure and HCHB Efficiencies 2016 Initiatives $(5.0) $25.0 $55.0 Q1 2016 Q2 2016 Q3 2016 Q4 2016 Q1 2017 Q2 2017 Q3 2017 Q4 2017 HCHB IT $40M - $50M |
 5 Where we will focus our efforts in 2016 and 2017 2016-17 Initiatives HomeCare HomeBase (HCHB) implementation Continuing to invest in quality Drive organic and inorganic growth • 126 of 411 care centers currently on HCHB • Targeting all care centers live on system by November 1 • Anticipate productivity disruption in Q1 and Q2 (~200 care centers go live) • Initial STARs performance significantly better than the industry • Individualized improvement plans yielding results in only 6 months • Strong Medicare same store growth in home health and hospice • Tailoring business development efforts • Focused on business mix in home health • Infinity Homecare acquisition closed; pipeline remains strong |
 6 HCHB Implementation Timeline We have accelerated our HCHB implementation timeline with a target Go-Live date of
November 1, 2016, seven months ahead of our
original plan Why Accelerate?
• AMS2 specifications not designed for ongoing operation; rate of regulatory change
increases risk of operating on older system
• Desire to move to cheaper POC devices sooner • Impact on employee satisfaction and retention • Acceleration of operational efficiencies and impact on business All Hospice Centers on HCHB 126 Centers Live as of January 11 * *Includes 15 Infinity Care Centers 84 115 99 82 31 411 0 50 100 150 200 250 300 350 400 450 2015 Q1 2016 Q2 2016 Q3 2016 Q4 2016 Total by Jan 1 |
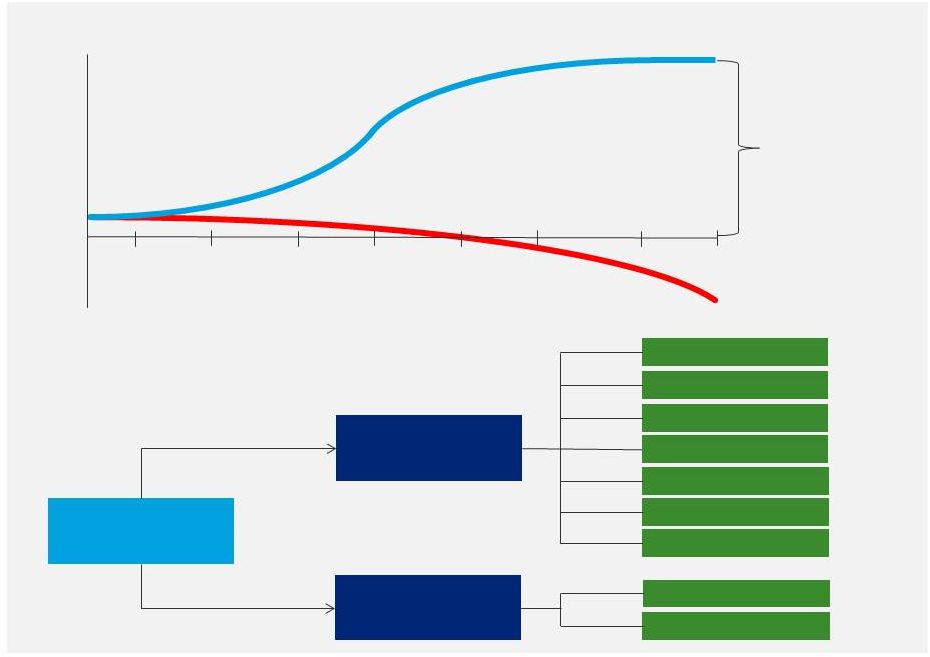
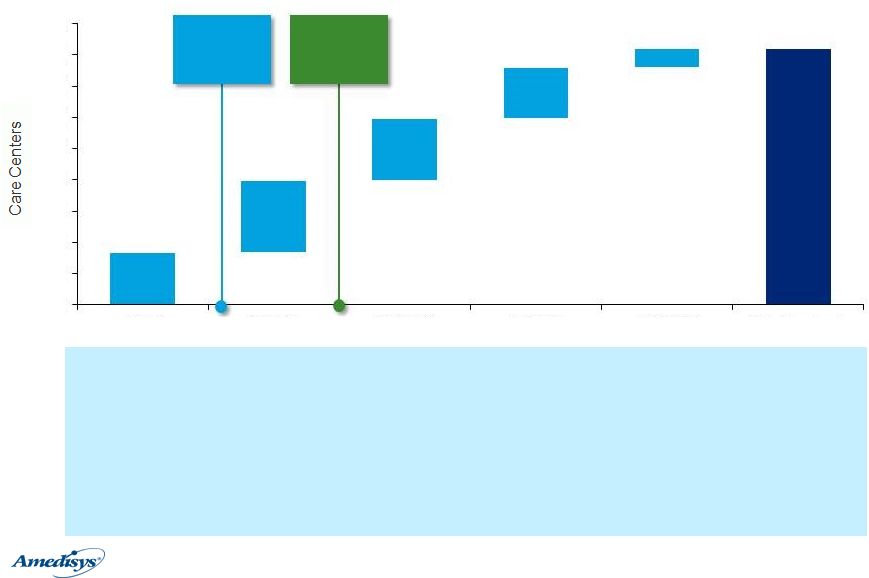
 7 Path to Productivity: Care Center Conversion Initial implementation data shows that once a center is live on HCHB, they start to see an
uptick in performance after 120
days Center Performance
• Productivity loss due to system learning curve • Additional loss from operating on
two systems during transition • Minor productivity loss from splitting focus between operations and rollout preparation • Clinical: AMS2 cases discharged or recertified; all work on HCHB • Back Office: Some AR/Billing still on AMS2 • All operations on one system • Staff experienced with HCHB • Opportunity to measure improvements • Sufficient data available to track performance • Regions and centers start to drive operational efficiencies Cases enroll and “recertify” in HCHB All clinical operations on HCHB All back office operations on HCHB Data available to drive performance Centers supporting 2 systems System support HCHB only Reports become meaningful Projected Long Term Efficiencies |
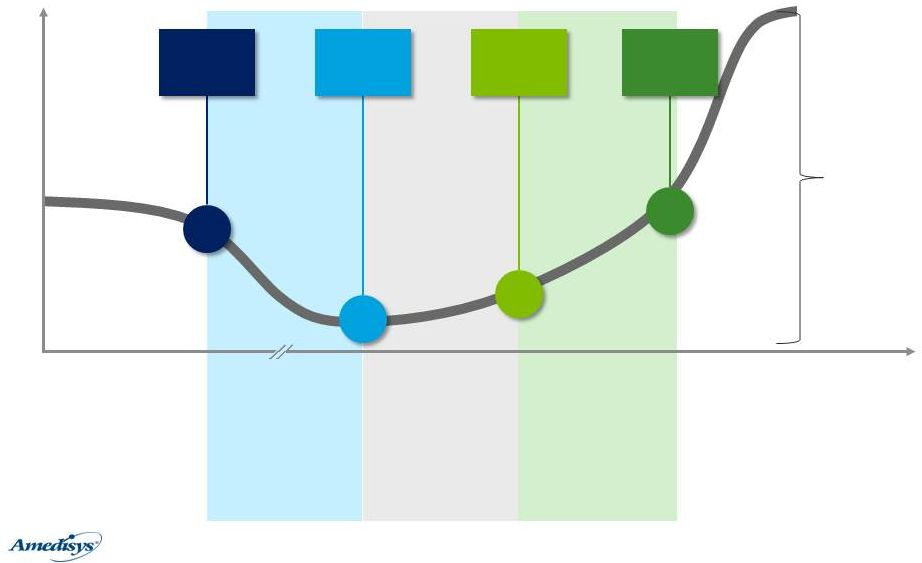
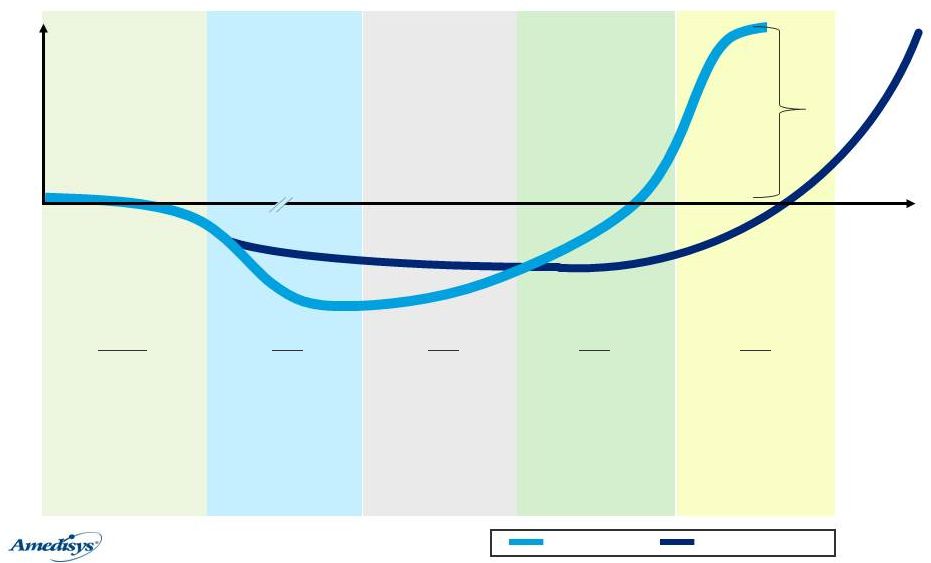 8 Initial vs. Accelerated Implementation Change in implementation timeline will result in deeper and more compact operational
disruption, the end result is the same
Center Performance Q116 • 115 conversions • Infinity integration begins • Hospice rollout completed Q216 • 99 conversions • Deepest productivity impact YE 2015 • 84 care centers live on HCHB • Collecting initial data on conversions • Positive operational response from first sites Q316 • 82 conversions • Operational recovery becomes evident Q416 • 31 conversions • Rationalization of IT infrastructure • Standardization and process improvement work begins May 2017 Projected Long Term Efficiencies Original Plan New Plan |
 9 What our People are Saying About HCHB “I love the detail and specificity of the reporting on HCHB” “HCHB is preparing our people to a new level of accountability” “I am spending
less time
documenting because system is easy to use ” “We now have the possibility to see a complete patient history on HCHB” “HCHB is empowering our clinicians to become true case managers” |
 10 Investing in Quality (STARs and VBP) Annualized 2015 Revenue in the pilot states 2018 Revenue using forecast growth in the pilot states + / - 3% in 2018 for excellent quality results $230M $277M $8M Year + / - Quality % $’s at risk or reward (based on 2018 revenue) 2019 5% $14M 2020 6% $17M 2021 7% $19M 2022 8% $22M VBP States: Average STARs Scores Across all Rated Entities: 3.48 The average for the April preview represents the highest average Amedisys entities have seen to date Entities at 4+ STARs: 29% All entities will be at 4+ STARs by YE 2017 |
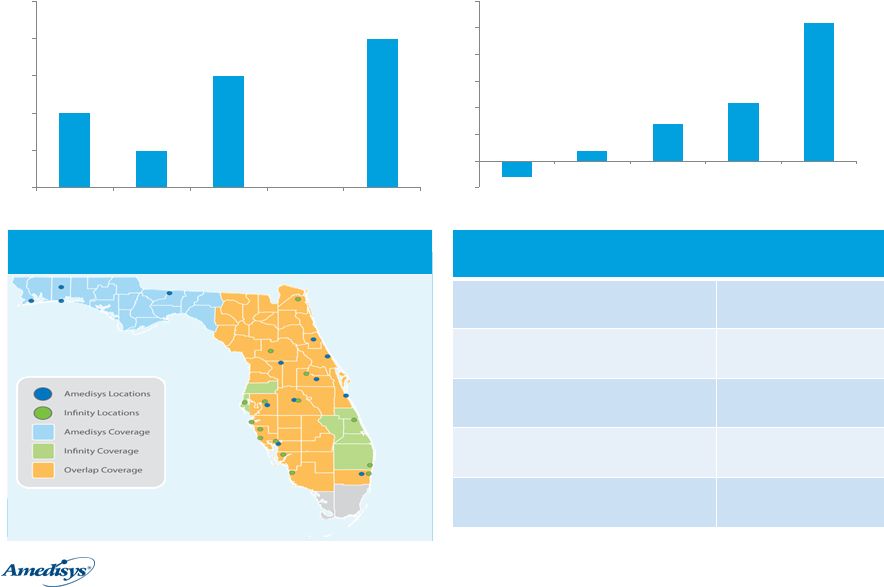 11 Driving Growth – Organic and Inorganic 2% 1% 3% 0% 4% 0% 1% 2% 3% 4% 5% Q314 Q414 Q115 Q215 Q315 HH Same Store Medicare Admissions -3% 2% 7% 11% 26% -5% 0% 5% 10% 15% 20% 25% 30% Q314 Q414 Q115 Q215 Q315 Hospice Same Store Admissions Infinity Homecare Acquisition Expanding our Ability to Care for Patients in Florida Infinity Home Care adds 15 locations in 8 of 11 Florida districts including 48 counties Balance Sheet and Cash Flow Metrics Cash $57 Total Debt Outstanding $100 Net Debt (1) $43 Leverage Ratio (net) (2) 0.4x LTM Adjusted Free Cash Flow (3) $98 |
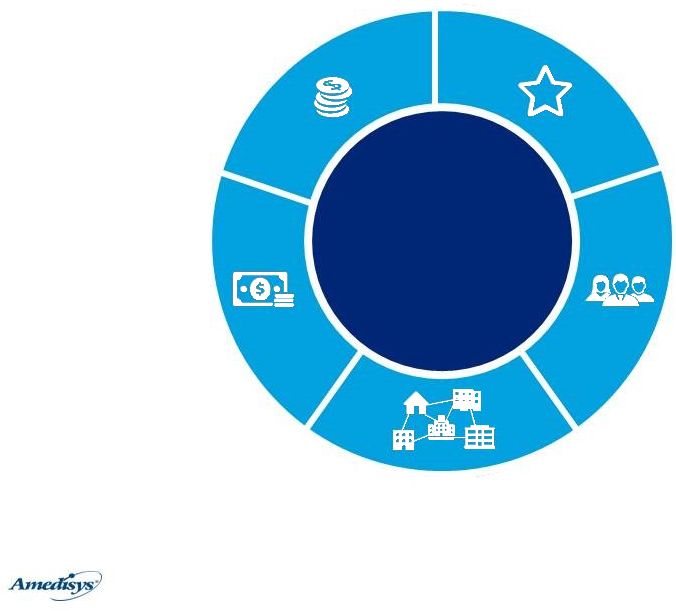 12 Investment Rationale STRONG CASH FLOW AND BALANCE SHEET EXPERIENCED MANAGED TEAM FRAGMENTED MARKET RIPE FOR CONSOLIDATION LOWEST COST POST - ACUTE SETTING PATIENT PREFERENCE AMEDISYS |
 Appendix |
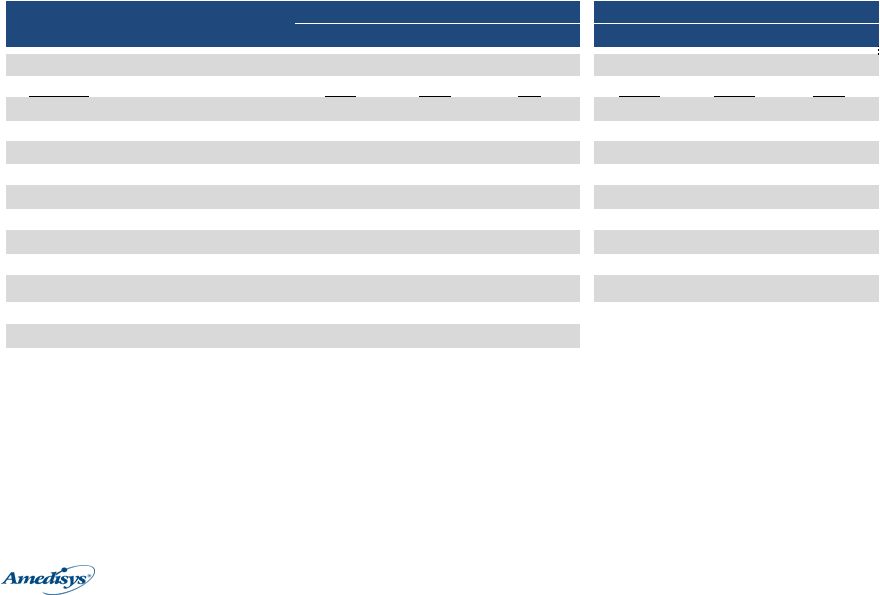 14 Summary Adjusted Financials (4) $ in Millions, except EPS 2014 2015 Variance 2014 2015 Variance Home Health 237.2 253.4 16.2 717.4 742.6 25.2 Hospice 63.1 73.0 9.9 186.6 199.6 13.0 Total Revenue $300.3 $326.4 $26.1 $904.0 $942.2 $38.2 Gross Margin % 43.4% 42.8% (0.6%) 42.6% 43.4% 0.8% Adjusted EBITDA 23.8 26.4 2.6 51.4 84.4 33.0 7.9% 8.1% 0.2% 5.7% 9.0% 3.3% Adjusted EPS $0.28 $0.34 $0.06 $0.46 $1.09 $0.63 Free cash flow (3) 21.5 29.4 7.9 (89.0) 63.7 152.7 Outstanding debt 149.3 100.0 (49.3) Cash balance 5.5 57.0 51.5 Available liquidity (5) 96.2 236.0 139.8 YTD Q3 |
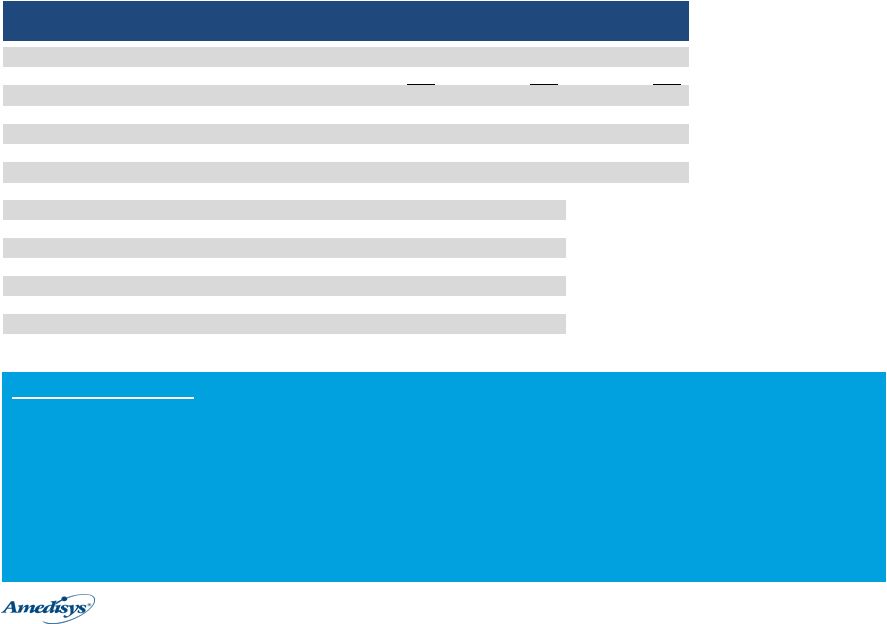 15 Home Health Segment – Adjusted Financials and Operating Statistics (4) $ in Millions Q314 Q315 Variance Medicare 185.4 190.2 4.8 Non-Medicare 51.8 63.2 11.4 Home Health Revenue $237.2 $253.4 $16.2 Gross Margin % 42.1% 40.8% (1.3%) Segment EBITDA 32.6 34.6 2.0 Medicare admit growth - same store 2% 4% Medicare recertification rate 38% 38% Medicare admits 42,770 44,434 Medicare recertifications 25,407 25,420 Non-Medicare admit growth - same store 26% 21% Non-Medicare admits 20,585 24,792 Cost per visit $85.47 $87.54 Quarterly Highlights • Revenue growth of $16.2M, or 7% • Same store admit growth in Medicare (+4%) and Non-Medicare (+21%) • Strong emphasis on business mix (Medicare vs. Non-Medicare) • Cost per visit increased $2.07 to $87.54 • Anticipated increases from ICD-10 prep and headcount / contractor use to deal with growth
• Some higher than anticipated cost from higher health insurance and workers’ comp |
 16 Hospice Segment – Adjusted Financials and Operating Statistics (4) $ in Millions Q314 Q315 Variance Medicare 59.0 68.6 9.6 Non-Medicare 4.1 4.4 0.3 Hospice Revenue $63.1 $73.0 $9.9 Gross Margin % 48.0% 49.6% 1.6% Segment EBITDA 16.6 19.6 3.0 Admit growth - same store (3%) 26% ADC growth - same store (3%) 17% Admits 4,002 4,962 ADC 4,608 5,346 Revenue per day $148.74 $148.47 Cost per day $77.38 $74.82 Quarterly Highlights • Year-over-year revenue growth of $9.9M, or 16% • Patient census at quarter end of 5,524, an increase of 23% over census at 12/31/14
• Second straight quarter of double-digit same store admission growth • Cost per day year-over-year decrease primarily driven by decrease in pharmacy costs |
| 17 Endnotes 1. Net debt defined as total outstanding debt ($100M) less cash ($57M) as of 9/30/15
2. Net leverage ratio defined as net debt ($43M) divided by last twelve months adjusted EBITDA ($107M)
3. Free cash flow defined as cash flow from operations less capital expenditures and required debt repayments. Adjusted free cash flow on
slide 11 adds back Department of Justice payment in 4Q14 of
$35M. 4. The financial results for the three-month periods ended September 30, 2014 and September 30, 2015 are adjusted for certain items and should be considered a non-GAAP financial measure. A reconciliation of these non-GAAP financial measures is included in the
8-K earnings release filed on November 4, 2015.
5. Available liquidity defined as the sum of cash balance and available revolving line of credit. |