Attached files
| file | filename |
|---|---|
| 8-K - 8-K - CST BRANDS, INC. | cst2016form8-k1616investor.htm |
| EX-99.2 - EXHIBIT 99.2 - CST BRANDS, INC. | exhibit992-cst1616realesta.htm |

Investor Update January 2016

Investor Update January 2016 Safe Harbor Statements Forward-Looking Statements Statements contained in this presentation that state the Company’s and Partnership’s or management’s expectations or predictions of the future are forward-looking statements and are intended to be covered by the safe harbor provisions of the Securities Act of 1933, as amended, and the Securities Exchange Act of 1934, as amended. The words “believe,” “expect,” “should,” “intends,” “estimates,” and other similar expressions identify forward-looking statements. It is important to note that actual results could differ materially from those projected in such forward- looking statements. For more information concerning factors that could cause actual results to differ from those expressed or forecasted, see CST and CrossAmerica filings with the Securities and Exchange Commission (“SEC”), including the Risk Factors in our most recently filed Annual Reports on Form 10-K and Quarterly Reports on Form 10-Q as filed with the SEC and available on CST Brand’s website at www.cstbrands.com and CrossAmerica’s website at www.crossamericapartners.com. If any of these risks or uncertainties materialize, or if our underlying assumptions prove to be incorrect, actual results may vary significantly from what we projected. Any forward-looking statement you see or hear during this presentation reflects our current views as of the date of this presentation with respect to future events. We assume no obligation to publicly update or revise these forward-looking statements for any reason, whether as a result of new information, future events, or otherwise. Non-GAAP Financial Measures To supplement our consolidated financial statements prepared in accordance with accounting principles generally accepted in the United States (“GAAP”) and to better reflect period-over-period comparisons, we use non-GAAP financial measures that either exclude or include amounts that are not normally excluded or included in the most directly comparable measure, calculated and presented in accordance with GAAP. Non-GAAP financial measures do not replace and are not superior to the presentation of GAAP financial results, but are provided to improve overall understanding of our current financial performance and our prospects for the future. We believe the non-GAAP financial results provide useful information to both management and investors regarding certain additional financial and business trends relating to financial condition and operating results. In addition, management uses these measures, along with GAAP information, for reviewing financial results and evaluating our historical operating performance. The non-GAAP adjustments for all periods presented are based upon information and assumptions available as of the date of this presentation. The non-GAAP information is not prepared in accordance with GAAP and may not be comparable to non-GAAP information used by other companies. Information regarding the non-GAAP financial measure referenced in this presentation, including the reconciliation to the nearest GAAP measure can be found in our financial results press releases, available on our web sites: www.cstbrands.com and www.crossamericapartners.com. 2

Investor Update January 2016 3 NEW REAL ESTATE VENTURE

Investor Update January 2016 Unlocking Asset Potential to Fund Growth and Create Stockholder Value 4 FUEL STORE OPERATIONS REAL ESTATE New Real Estate Venture

Investor Update January 2016 Creating Stockholder Value By Pursuing a New Real Estate Venture • Provides an innovative solution to fund CST’s aggressive large format NTI program and acquisitions • More than doubles ROI of new large format stores by reducing CST’s capital requirements • Proposed venture provides CST with optionality through management and equity participation in a growing portfolio of properties • Initial property value expected to be $250 million - $350 million with annual growth of $175 million - $225 million per the 2020 plan related to future NTIs • Build to suit opportunity for NTIs built in 2017 and thereafter • Also beneficial to CrossAmerica for potential sale leaseback transactions • Future acquisitions can utilize the venture to fund a portion of the purchase price related to real estate • CST can also utilize the venture as a real property exchange partner as it continues to optimize its existing store portfolio Began working with investment bank advisors to explore real estate alternatives Engaged RBC Capital Markets to advise on new real estate venture - Launch marketing effort to potential partners in mid-January - Expect to identify potential partners by end of 1Q Expect to select and announce partner and close first transaction in mid-2016 3Q15 4Q15 1Q16 2Q16 Timeline 5

Investor Update January 2016 Improving U.S. New To Industry (NTI) Returns Illustrative Economics - Before and After Real Estate Venture Before Venture Venture Impacts After Venture Construction Cost: Land & Building $4,000,000 ($4,000,000)* $0 Equipment 1,500,000 1,500,000 Total $5,500,000 (A) $1,500,000 (A) Fully Matured (1-3 yrs) EBITDA $825,000 (B) ($260,000)* $565,000 (B) Store Level EBITDA Return on Capital Employed (ROCE)** 15% (B/A) 38% (B/A) 6 The above is a hypothetical example. Construction costs, lease rates and return economics are subject to change. *Assumes a sale/leaseback at a theoretical 6.5% lease rate **Store level Cash Flow ROCE is equal to the individual store’s operating income plus store level depreciation and amortization. Store level operating income excludes interest expense and income tax expense but does include applicable store rent expense.

Investor Update January 2016 7 2013-2015 2016-2020 EBITDA $64.4 $161.0 Net Investment $430.0 $430.0 Net Cash Flow ROCE 15% 38% $64.4 $161.0 Potential Uplift From Accelerated 2016-2020 U.S. NTI Growth(C) (EBITDA dollars in millions) • The real estate venture dramatically changes the return profile on the NTI investments by utilizing sale/leaseback leverage for real property • CST estimates that over the next 5 years (2016-2020), by utilizing sale/leaseback leverage, a $430 million of capital investment in NTI personal property, could potentially generate approximately $97 million of incremental EBITDA through utilizing the venture(C) • In addition to this anticipated benefit, beginning in 2017, CST expects to have the real estate venture construct NTIs on CST’s behalf (under a “build to suit” arrangement) freeing up capital used during construction Improving New To Industry (NTI) Returns Pro Forma Illustrative Impact (A) (A) Without Venture With Venture (A) Assumes $1.5 million in personal property construction cost per NTI. Real property construction cost of $4.0 million per NTI is not paid by CST (B) Store level Cash Flow ROCE is equal to the individual store’s operating income plus store level depreciation and amortization. Store level operating income excludes interest expense and income tax expense but does include applicable store rent expense. (C) Hypothetical example assuming stores financed utilizing the illustrative terms on slide #6 Net Investment $430.0 $430.0 Store Level EBITDA ROCE (B) 15% 38% (A)
Investor Update January 2016 8 BUSINESS OVERVIEW

Investor Update January 2016 • One of the largest independent wholesalers and retailers of motor fuels and convenience merchandise in North America • Strong urban footprint, supplying and retailing motor fuel in nearly 1,900 locations in the U.S. and eastern Canada – TTM CST revenues through Sept. 30 of nearly $10 billion – Over 8 million gallons of fuel supplied/sold per day – Serve ~10 million retail customers / week – Operates in high-growth attractive markets - 62% of U.S. stores in Texas, one of the fastest growing states in the U.S.(1) • Consistent track record of growth, both organically and through acquisitions • Significant amount of owned property – 75% Owned vs. 25% Leased • Controls the general partner of CrossAmerica Partners (NYSE: CAPL), all the incentive distribution rights and 18.7% of the Limited Partnership interests as of 12/31/2015 CST Brands Overview – A Leading C-Store Platform… CO 76 AZ NM OK TX AR LA WY Ontario Quebec Atlantic CA 53 37 137 3 632 2 26 29 146 533 181 NY 32 Site Locations • U.S. Retail – 1,027 – Substantially all company operated retail • Canadian Retail – 860 – Commission Agents – Company Operated Retail – Cardlock CST Service Centers • San Antonio • Montreal Site count as of September 30, 2015; does not include Flash Foods acquisition which has not closed Source: Forbes (1) 9

Investor Update January 2016 • Pre-spin – Focus on Maintaining Status Quo • Built less than 10 new stores per year in 5 years prior to spin • Non-sustaining CapEx was less than $50 million per year • Minimal dollars spent on advertising • Only 2 retail acquisitions in prior 10 years – Focus on Fuel Operations • Operation was heavily focused on maximizing fuel volume sales • Locations were strategic to support refining distribution network – Averaged 13 cents per gallon fuel margin in the U.S. in four years prior to spin – 5,083 gallons sold per store per day in the U.S. • Merchandise sales secondary to fuel sales – $3,509 in merchandise sales per store per day in the U.S. with cigarettes representing 31% of those sales CST Brands: Looking Back… 10 • Spun from former parent on May 1, 2013 – Average U.S. store size: 2,200 square feet – No store brand identity • Known throughout our network by former parent fuel brand • Limited existing advertising, no loyalty program, etc. – Had to establish G&A infrastructure associated with the establishment of a public company, separated from our former parent – Had certain limitations regarding strategic growth for 2 years post-spin

Investor Update January 2016 • Objective since the spin has been to grow stockholder value by growing operating profit with a higher percentage coming from more stable non-fuel operating profit in the following ways: CST Brands: Setting a New Path… Acquisitive Growth & Portfolio Optimization • Grow our business in existing and new geographic locations through strategic acquisitions • CST and CrossAmerica have announced a total of $746 million of acquisitions since October 1, 2014 • Optimize store portfolio – continue to optimize network to focus on large format stores – Larger format U.S. stores generate approximately double the merchandise sales and fuel volumes compared to a legacy core store • Merchandise – Re-brand U.S. network to unified and updated image by end of 2018 – Build best-in-class convenience brands that consumers embrace and that create loyalty – Focus on expansion of food service, private label and fill-in grocery to expand margins – Transform non-fuel gross profit contribution to 70% in U.S. and 50% in Canada by 2020 • Fuel – Maximize the gross profit potential of the network’s high fuel volumes – Utilize a portfolio of fuel brands that complement the Corner Store brand • Store operations focused on reducing Net Operating Cost (NOC) Operational Excellence Organic Growth • Dramatically increase investment in our large format, high-return New-To-Industry (NTI) stores – Plan to open approximately 400 – 460 NTIs from 2015 – 2020 – NTIs will represent over 30% of the total store network by the end of 2020 • Potential to accelerate NTI growth through implementation of real estate venture 11 Prudent Use of Capital for Growth and Value Creation • Effectively manage stockholders’ capital by unlocking value of embedded assets to fund growth and create value • Continue to leverage CrossAmerica and the MLP market for fuel supply • Pursue new real estate venture – Utilize existing assets to fund organic growth – Completes optimal structures (c-stores, fuel supply & real estate) to fund acquisitive growth and facilitate industry consolidation

Investor Update January 2016 Recent Results Demonstrate Success of Plan Overall Results 12 • More than a 40% improvement in Gross Profit Dollars (GPD) per store over the last 12 months compared to 2012 – Outperformed peers and market expectations with fuel margin capture Note: Merchandise margin and merchandise GPD represent all non-fuel sales; Figures in thousands; Canadian figures in USD and include the Home Heat business $295 $253 $368 $414 $294 $287 $283 $269 2012 2013 2014 TTM 3Q15 U.S. Canada $420 $422 $442 $476 $608 $584 $543 $499 2012 2013 2014 TTM 3Q15 U.S. Canada • 13% improvement in non-fuel GPD • U.S. non-fuel margin is 33.5% (YTD 3Q15) • Food sales mix is up 200 bps to 11%, cigarettes is now 27% Fuel Strategy Merchandise Strategy Key Metrics % Change Core Stores (EOP) 1,027 1,041 (1%) Same Store Merchandise Sales (PSPD) $3,688 $3,308 11% Merchandise Sales (PSPD) $3,667 $3,363 9% Merchandise Margin* (net of CC) 30.3% 29.5% 80 bps Motor Fuel Gallons Sold (PSPD) 4,963 5,026 (1%) Motor Fuel CPG (net of CC) $0.223 $0.150 48% TTM 3Q15 TTM 3Q13 Key Metrics % Change Company Operated Stores (EOP) 292 265 10% Same Store Merchandise Sales (PSPD) $2,843 $2,781 2% Merchandise Sales (PSPD) $2,842 $2,772 3% Merchandise Margin* (net of CC) 26.9% 27.9% (100) bps Total Retail Stores (EOP) 860 840 2% Motor Fuel Gallons Sold (PSPD) 3,193 3,296 (3%) Motor Fuel CPG (net of CC) $0.284 $0.240 18% TTM 3Q15 TTM 3Q13 U.S. Retail (USD) Canadian Retail (CAD) Non-Fuel GPD per Store Fuel GPD per Store Note: Figures in thousands; Canadian figures in USD *Merchandise margin excludes other revenue margin

Investor Update January 2016 2020 VISION 13

Investor Update January 2016 Grow Inside Sales Grow Margins • Implement enhanced advertising/marketing plan in key markets following store re-branding • Expand grocery fill-in offering – expected to be implemented in 200 stores by end of 2016 – Enhances large store product mix – Includes perishable grocery and produce • U.S. merchandise sales per store are up 12% in 3Q15 vs. 3Q14 • Expand food service penetration and prepared food programs – Food sales grew four times faster than overall merchandise sales – All new stores have expanded kitchens; 40% of core stores have kitchens – Implementing Nice N Easy Made-to-Order food program (expected to be in 30+ stores by end of 2016) • Continue to build on successful private label packaged goods offering (200+ SKUs and growing) • Leverage logistics system to lower cost of goods • U.S. merchandise gross profit is up 13% in 3Q15 vs. 3Q14, despite lower store count • Opened 3x larger new U.S. Corner Store distribution center in 1Q15 • Distribution center enables private label, food service and perishable food growth • Flash Foods acquisition will give CST a second distribution center Improve Distribution Capabilities 14 Merchandise Profit Growth

Investor Update January 2016 30% 70% Enhanced Gross Profit From Merchandise Growth Q3’15 2020 Vision U.S. Canada Gross Profit Contribution Note: Non-fuel includes Merchandise and “Other” Categories; Figures exclude impact of California network and Flash Foods acquisition 22 percentage point increase in Non-Fuel GP 16 percentage point increase in Non-Fuel GP 15 52% 48% 66% 34% 50% 50% Fuel Non-Fuel

Investor Update January 2016 Organic Growth 2013 2014 2015 2016 2017 - 2020 Canada 7 10 11 13 88 U.S. 15 28 31 48 238 Cumulative Total 22 60 102 163 489 0 100 200 300 400 500 600 N ew S to re C ou n t 75 - 100 225 - 250 10 - 15 45 - 50 By the end of 2020, NTIs are expected to make up over 30% of the total store network 16
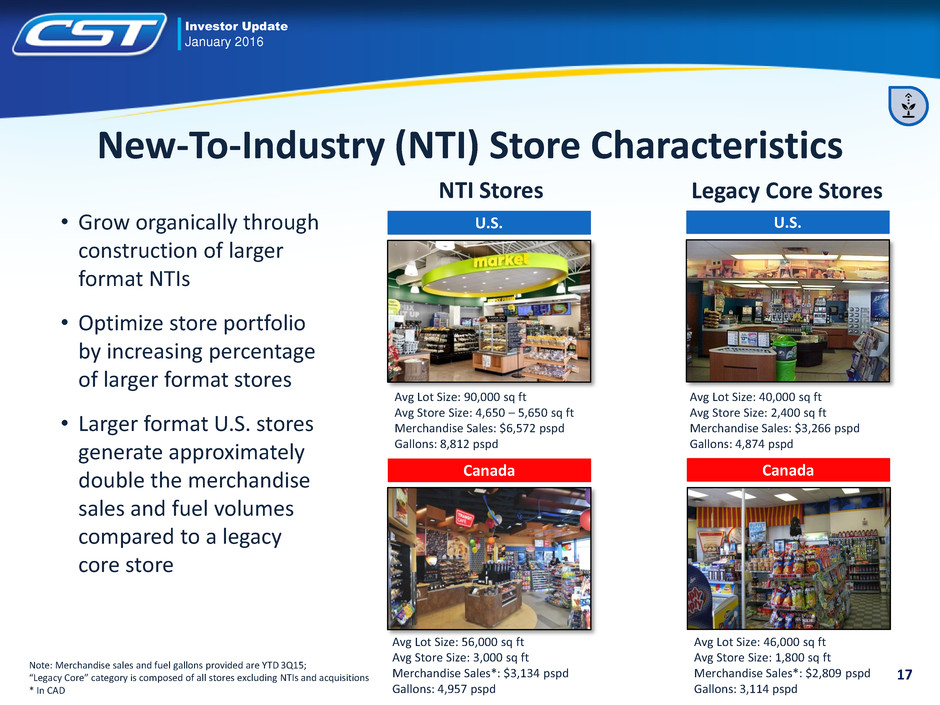
Investor Update January 2016 New-To-Industry (NTI) Store Characteristics • Grow organically through construction of larger format NTIs • Optimize store portfolio by increasing percentage of larger format stores • Larger format U.S. stores generate approximately double the merchandise sales and fuel volumes compared to a legacy core store NTI Stores Avg Lot Size: 90,000 sq ft Avg Store Size: 4,650 – 5,650 sq ft Merchandise Sales: $6,572 pspd Gallons: 8,812 pspd Legacy Core Stores Avg Lot Size: 56,000 sq ft Avg Store Size: 3,000 sq ft Merchandise Sales*: $3,134 pspd Gallons: 4,957 pspd Canada Avg Lot Size: 40,000 sq ft Avg Store Size: 2,400 sq ft Merchandise Sales: $3,266 pspd Gallons: 4,874 pspd Avg Lot Size: 46,000 sq ft Avg Store Size: 1,800 sq ft Merchandise Sales*: $2,809 pspd Gallons: 3,114 pspd Canada 17 Note: Merchandise sales and fuel gallons provided are YTD 3Q15; “Legacy Core” category is composed of all stores excluding NTIs and acquisitions * In CAD U.S. U.S.

Investor Update January 2016 Asset Date Acquirer Purchase Price (1) Stores Gallons (1) 2016 CAPL $49 31 27 2016 CST 425 164 290 2015 CAPL 45 41 36 2015 CAPL 85 64 68 2015 CST & CAPL 64 22 41 2014 CST & CAPL 78 32 40 Proven Track Record of Acquisitive Growth Acquisition Strategy • CST and CrossAmerica have announced strategic acquisitions representing a total transaction value of $746 million since October 1, 2014 • Acquisitions have contributed more than 354 stores and 502 million gallons to the CST and CrossAmerica networks Proven Track Record • Grow our business in existing and new geographic locations through strategic acquisitions • Key acquisition target characteristics: – Complementary geographic presence in existing or adjacent markets – Larger format store network – Strategically located, convenient locations – Opportunity to improve merchandise and/or fuel operations ____________________ (1) In millions • Integrating award-winning food programs from Nice N Easy in both the U.S. and Canada • Expect to combine the learnings of loyalty programs from Freedom and Flash Foods to develop Corner Store strategy • Will use our logistics expertise to build efficiencies into Flash Foods’ distribution center Value Added 18 From Landmark Industries From SSG Corporation

Investor Update January 2016 California Network Remaining U.S. Network Average Store Size (Sq. Ft.) 1,320 2,637 Average Lot Size (Acres) 0.72 1.13 70% 30% Strategic Review of California Operations Exploring strategic options for California network to enhance stockholder value and fund future growth Overview of California Operations Comparison of California Operations vs. Remaining U.S. Network Gross Profit Mix: Fuel vs. Non-Fuel • 76 operated stores • Significant owned real estate • Potential transactions can be structured tax-efficiently given Flash Foods acquisition and utilization of § 1031 exchange • Limited opportunity to build new stores due to high real estate prices and regulatory environment • Low food penetration • Smaller store footprint does not fit merchandise strategy and limits merchandise sales growth potential California Remaining U.S. Network 19 40% 60% Fuel Non-Fuel
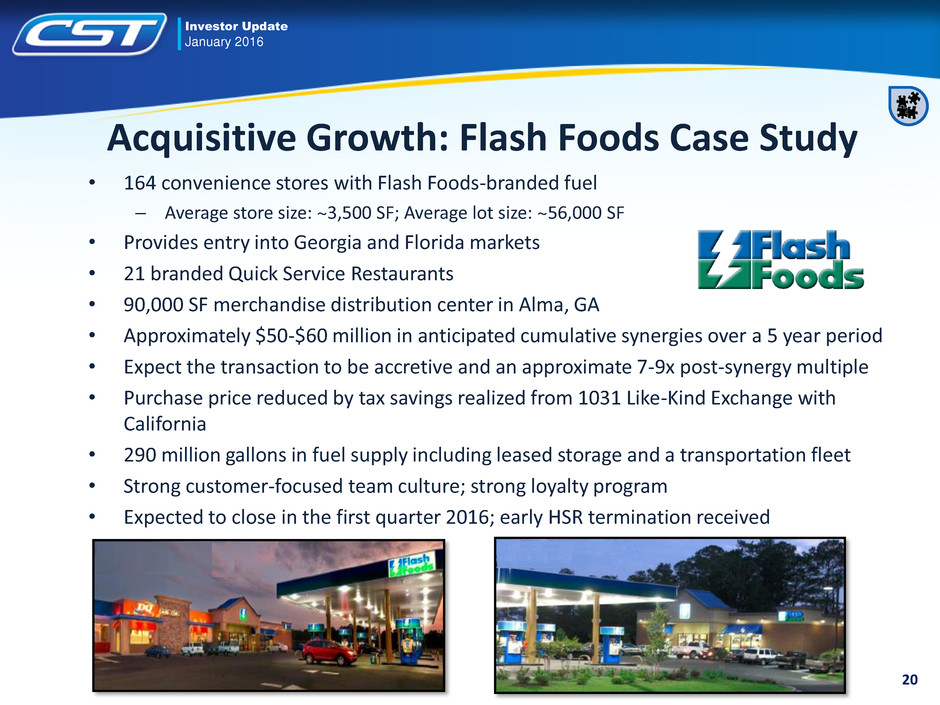
Investor Update January 2016 • 164 convenience stores with Flash Foods-branded fuel – Average store size: ~3,500 SF; Average lot size: ~56,000 SF • Provides entry into Georgia and Florida markets • 21 branded Quick Service Restaurants • 90,000 SF merchandise distribution center in Alma, GA • Approximately $50-$60 million in anticipated cumulative synergies over a 5 year period • Expect the transaction to be accretive and an approximate 7-9x post-synergy multiple • Purchase price reduced by tax savings realized from 1031 Like-Kind Exchange with California • 290 million gallons in fuel supply including leased storage and a transportation fleet • Strong customer-focused team culture; strong loyalty program • Expected to close in the first quarter 2016; early HSR termination received Acquisitive Growth: Flash Foods Case Study 20

Investor Update January 2016 • Sponsored MLP provides a growth vehicle to fund organic expansion and partner for strategic acquisitions • CST cash flows benefit from distributions on CrossAmerica common units while CST participates in long-term CrossAmerica value creation – CrossAmerica is currently yielding ~9% distribution yield – CST can receive common units as partial consideration for asset drop-downs • CST owns Incentive Distribution Rights (IDRs) that should increase cash flow in future years – IDRs are currently at the 25% level – Partnership has generated approximately $147 million in cash for CST year-to-date (period ending 9/30/15) Strategic Value of the CrossAmerica Relationship Recent Drop-Downs Benefits to CST Stockholders Current CST/CrossAmerica Relationship • CST controls the general partner of CrossAmerica Partners and 18.7% of CrossAmerica common units (~6.2 million units) as of 12/31/2015 • CrossAmerica owns a 17.5% interest in CST Fuel Supply 21 January 2015 • CST sold a 5% interest in CST Fuel Supply (CST’s captive wholesale distributor) in exchange for 1.5 million CrossAmerica Units July 2015 • CST sold a 12.5% interest in CST Fuel Supply and entered into a sale-leaseback agreement for the Real Property of 29 NTIs in exchange for $142 million of cash and 3.6 million CrossAmerica units Future Drops • Will be valued based on the prevailing market conditions • Opportunity to acquire Flash Foods fuel supply

Investor Update January 2016 CROSSAMERICA PARTNERS UPDATE 22
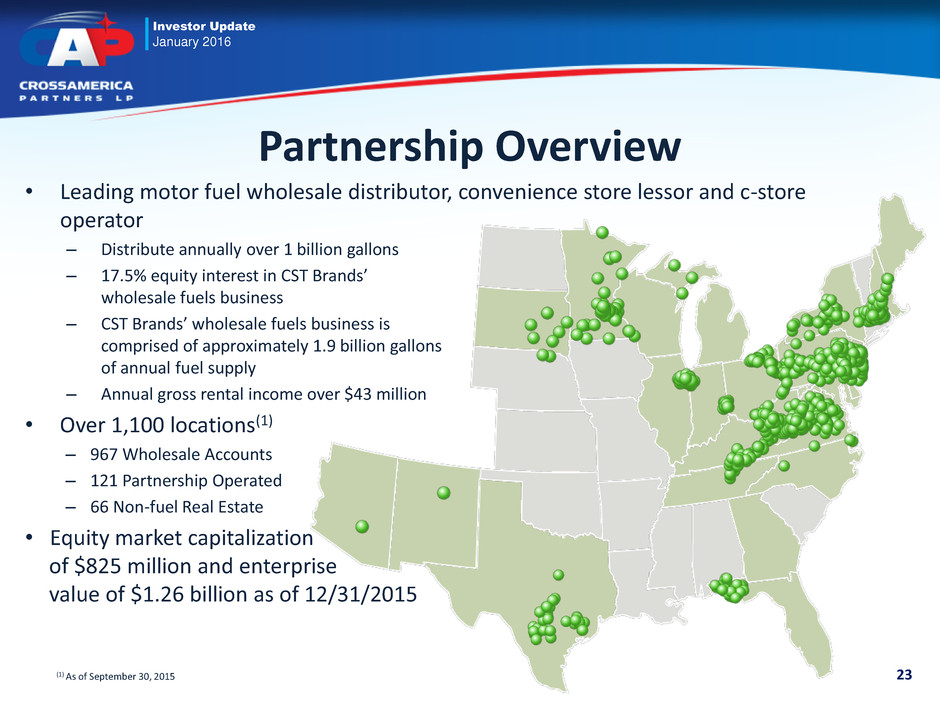
Investor Update January 2016 Partnership Overview • Leading motor fuel wholesale distributor, convenience store lessor and c-store operator – Distribute annually over 1 billion gallons – 17.5% equity interest in CST Brands’ wholesale fuels business – CST Brands’ wholesale fuels business is comprised of approximately 1.9 billion gallons of annual fuel supply – Annual gross rental income over $43 million • Over 1,100 locations(1) – 967 Wholesale Accounts – 121 Partnership Operated – 66 Non-fuel Real Estate • Equity market capitalization of $825 million and enterprise value of $1.26 billion as of 12/31/2015 (1) As of September 30, 2015 23

Investor Update January 2016 Continuing Accretive Growth 24 • Over 85% owned locations • Located in proximity with FreedomValu stores • Large stores with good inside sales • Holiday franchise brings strong brand recognition and optionality after three years 31 Company Operated $48.5 Million Purchase 26.5 Million Gallons Upper Midwest (MN, WI) Holiday Est. 1Q16 close date Asset Purchase Rationale 60 CrossAmerica company operated – FreedomValu or SuperAmerica 4 CrossAmerica dealer operated – FreedomValu 31 CrossAmerica company operated – Holiday (PENDING) (From SSG Corporation) Acquisition is accretive to distributable cash flow

Investor Update January 2016 Strong Financial Position • Declared third quarter distribution of $0.5775 per unit – 1.5 cent per unit increase over second quarter – Continue to target 2015 annual per unit distribution growth of 7-9% – Expect 2015 annual Coverage Ratio over 1.0x, with a long-term target of 1.1x • Continue to maintain adequate borrowing capacity on our revolving credit facility to be able to fund growth opportunities – Net revolver capacity of $125 million, as of September 30, 2015 – Can leverage our real estate portfolio to fund additional, accretive growth opportunities 25

Investor Update January 2016 • Continue to execute on core competencies – Strong wholesale, retail operations and real estate business units – Acquisitive growth at accretive multiples • Target annual third party growth between $50 and $200 million, depending on market conditions • With CST, can structure transactions in numerous ways to ensure optimal value accretion • Leverage expertise and systems to recognize synergies and improve EBITDA • Continue accretive growth in CST Fuel Supply – Targeting 10-12% additional acquisition in CST Fuel Supply in 2016, subject to prevailing market conditions – With CST’s NTI growth plan, CrossAmerica expects to benefit from this growing fuel supply – By 2020, CAPL ownership is expected to grow to over 75% • Rate of growth will be dependent upon market conditions and third party acquisition opportunities TODAY 1.9 billion gallons 17.5% CAPL Ownership Strategic Vision 2020 2+ billion gallons 75%+ CAPL Ownership 26

Investor Update January 2016 STOCKHOLDER VALUE 27

Investor Update January 2016 Committed to Enhancing Stockholder Value • Announced pending acquisition of Flash Foods • Announced strategic review of California network (76 stores) • Announced Real Estate Venture initiative • Returned approximately $100 million to stockholders in the last twelve months (period ending 12/31/15) • Consistent quarterly dividend of $0.0625 per share • Implemented $200 million CST stock purchase plan in 3rd quarter of 2014 – 2.1 million shares repurchased through December 31, 2015 totaling ~$86 million • Implemented $50 million CrossAmerica unit purchase plan in 3rd quarter of 2015 – 804,667 CAPL common units purchased through December 31, 2015 totaling ~$19.8 million 28
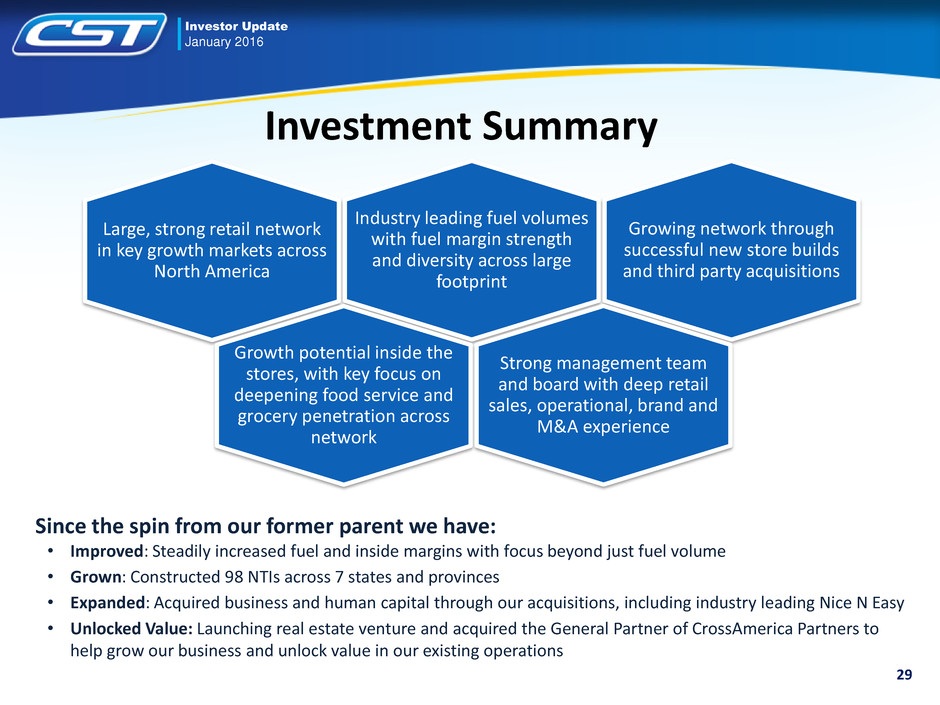
Investor Update January 2016 Investment Summary Since the spin from our former parent we have: • Improved: Steadily increased fuel and inside margins with focus beyond just fuel volume • Grown: Constructed 98 NTIs across 7 states and provinces • Expanded: Acquired business and human capital through our acquisitions, including industry leading Nice N Easy • Unlocked Value: Launching real estate venture and acquired the General Partner of CrossAmerica Partners to help grow our business and unlock value in our existing operations 29 Large, strong retail network in key growth markets across North America Industry leading fuel volumes with fuel margin strength and diversity across large footprint Growing network through successful new store builds and third party acquisitions Growth potential inside the stores, with key focus on deepening food service and grocery penetration across network Strong management team and board with deep retail sales, operational, brand and M&A experience
