Attached files
| file | filename |
|---|---|
| 8-K - FORM 8-K - PINNACLE FOODS INC. | d27787d8k.htm |
 Lender Presentation
January 6, 2016
Exhibit 99.1 |
 Forward-Looking Statements & Non-GAAP Financial Measures
This presentation contains “forward-looking statements” within the
meaning of U.S. federal securities laws. Forward-looking
statements are not historical facts, and are based upon management’s current expectations, beliefs, projections and targets, many of which, by their nature, are inherently uncertain. Such expectations,
beliefs, projections and targets are expressed in good faith. However, there
can be no assurance that management’s expectations,
beliefs, projections and targets will be achieved and actual results may differ materially from what is expressed in or indicated by the forward-looking statements. Forward-looking
statements are subject to significant business, economic, regulatory and
competitive risks and uncertainties that could cause actual
performance or results to differ materially from those expressed in the forward-looking statements, including risks detailed in Pinnacle Foods Inc.’s (“Pinnacle Foods,” “Pinnacle” or the
“Company”) filings with the U.S. Securities and
Exchange Commission (the “SEC”). Nothing in this presentation should be regarded as a representation by any person that these forward-looking statements will be achieved.
Forward-looking statements speak only as of the date the statements are
made. The Company assumes no obligation to update
forward-looking statements to reflect actual results, subsequent events or circumstances or other changes affecting forward-looking information except to the extent required by applicable securities laws.
This presentation includes certain financial measures, including Covenant
Compliance EBITDA, Adjusted EBITDA, Adjusted Gross Profit and
Unleveraged Free Cash Flow, which differ from results using U.S. Generally Accepted Accounting Principles (GAAP). Non-GAAP financial measures typically exclude certain charges, which are not
expected to occur routinely in future periods. The Company uses
non-GAAP financial measures internally to focus management on
performance excluding these special charges to gauge our business operating performance. Management believes this information is helpful to investors in understanding trends in the
business. The most directly comparable GAAP financial measures and
reconciliations to non-GAAP financial measures are set forth
in the slides in this presentation and included in the Company’s filings with the SEC. |
 Management Presenters
Bob Gamgort, Chief Executive Officer Craig Steeneck, Chief Financial
Officer |
 Agenda Transaction Overview Credit Highlights Pinnacle Business Update Boulder Brands Opportunity |
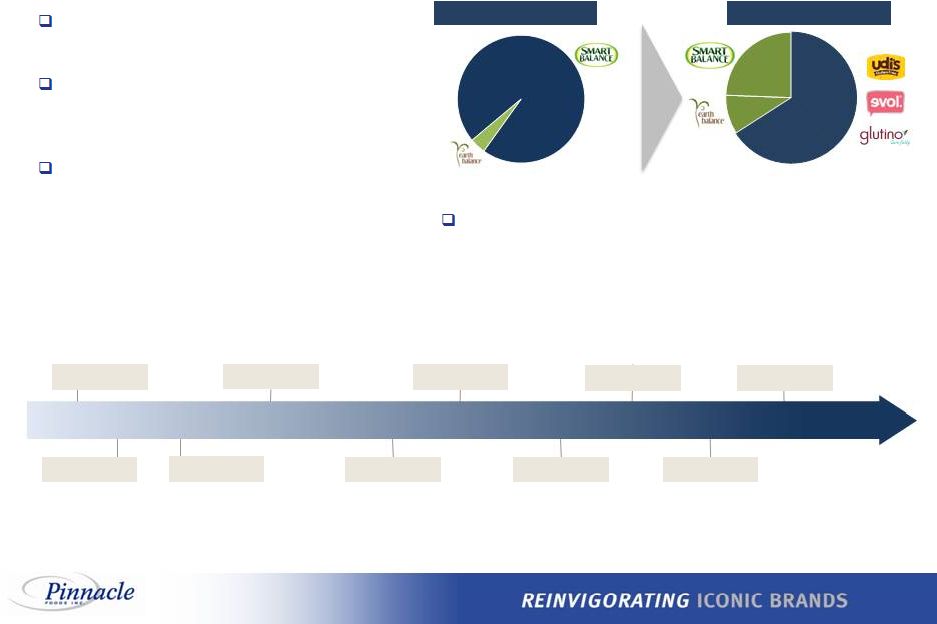
 Transaction Rationale
Expands leading
health and wellness
position for Pinnacle Foods Combined business will have over 50% of net sales in health and wellness
categories Dedicated gluten-free leadership in an industry expected to reach $23bn by
2018 (1) Retaining Boulder’s existing headquarters in Boulder, CO, to serve as
Pinnacle’s health and wellness hub
Leverages scale and increases importance to broad range of retailers Expands penetration in natural and organic channels Allows creation of focused sales organization covering all channels Leverages Pinnacle’s scale in frozen manufacturing/distribution capabilities to drive synergies Opportunity to use Pinnacle’s “Reinvigoration” capabilities to improve Smart
Balance performance
Provides new growth
platform in refrigerated
foods Enables the expansion of select Pinnacle brands into refrigerated temperature
class Offers attractive financial returns Significant upside to the Boulder Brands profitability, as margins are aligned
with those at Pinnacle
$30mm in expected synergies from moving Boulder onto the Pinnacle
platform
Substantial free cash flow generation and ability to rapidly de-lever
(1)
Source: Mintel.
6 |
 Credit Highlights
Strong Position in High Growth
Health and Wellness Categories
Attractive Pinnacle Margin Profile with Plan to Drive Operational
Efficiencies and Margin Expansion at Boulder
Strong Free Cash Flow Generation for Debt Paydown
Proven Track Record of Successful Acquisition Integration
and Cost Savings Realization
Experienced Operating Team Led by Industry Veterans
1 2 3 4 5 7 |
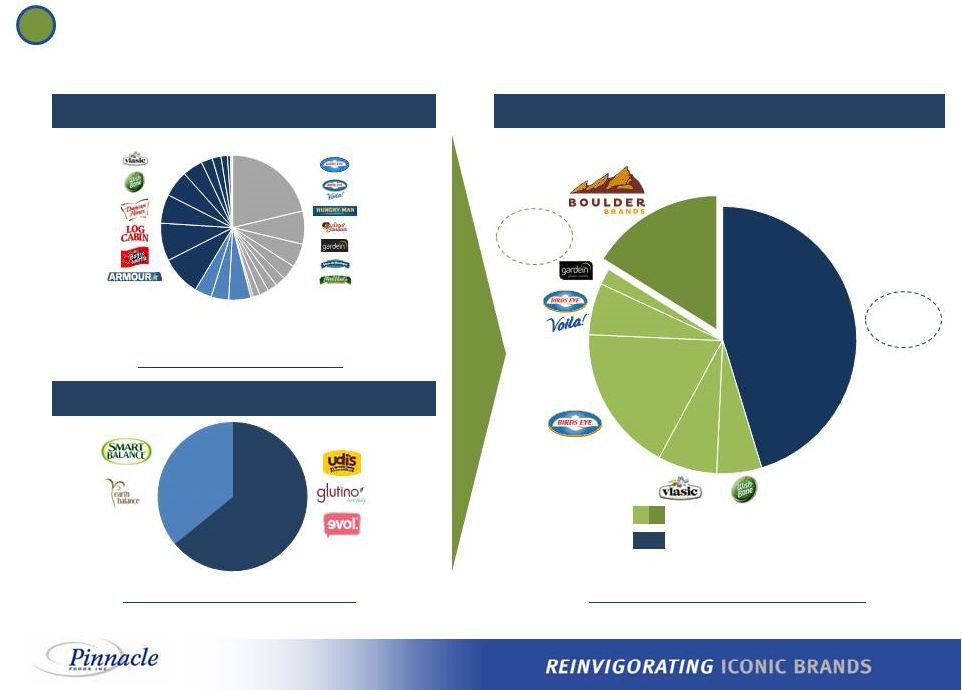 Strong Position in High Growth Health & Wellness
Categories 1 Combined Portfolio With Significant H&W Scale Pinnacle Foods Health & Wellness brands represent ~55% of portfolio Boulder Brands LTM 9/30/15 Net Sales: $508mm (1) LTM 9/27/15 Net Sales: $2.6bn Pro Forma Net Sales: $3.1bn LTM 9/27/15 Specialty Health & Wellness Brands Remaining Portfolio Brands Source: Company filings and management. (1) Excludes discontinued Level Life brand. Snacks Food-service Private Label Natural 64% Balance 36% 8 Grocery Frozen ~55% ~45% |
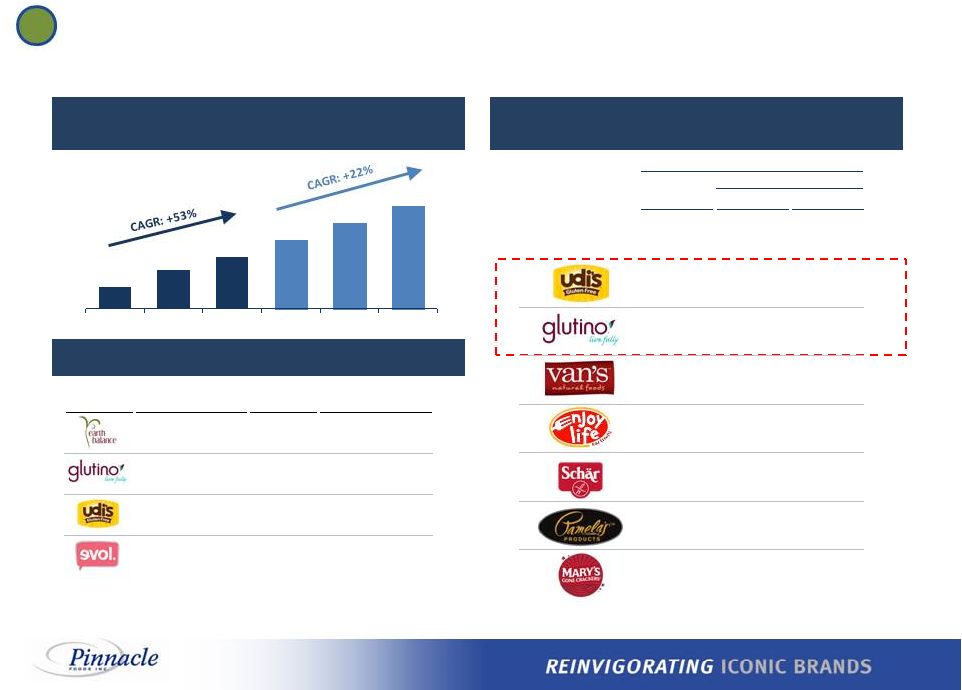 U.S. retail sales
$4.9 $8.8 $11.6 $15.3 $19.0 $22.7 2013 2014 2015 2016E 2017E 2018E Strong Position in High Growth Health & Wellness Categories 1 Best-in-Class, Dedicated Gluten-Free Brands (2) Gluten-free Market Expected to Reach $22.7bn in Sales by 2018 (1) Solid Portfolio Growth Over Time (1) Source: Mintel October 2015. (2) Gluten-free Nielsen Panel. 52 weeks ending December 2014. (3) Represents sales in tracked channels per Nielsen. (4) Earth Balance reported in Balance segment, effective 2014. CAGR reflects 2011 through LTM 9/30/15.
(3) (in $ billion) Brand Date Acquired LTM Sales at Acquisition Net Sales CAGR since Acquisition NA $31 16% 2011 $45 14% 2012 $71 40% 2013 $18 66% (4) 9 Market Penetration Change vs. 2013 2014 Bps % Total Dedicated Gluten Free Brands 7.7% +120 bps 18% 2.8% +70 bps 35% 2.4% +40 bps 20% 2.3% +50 bps 30% 1.5% +40 bps 39% 1.3% +40 bps 43% 1.0% +20 bps 19% 0.7% (0 bps) (5%) |
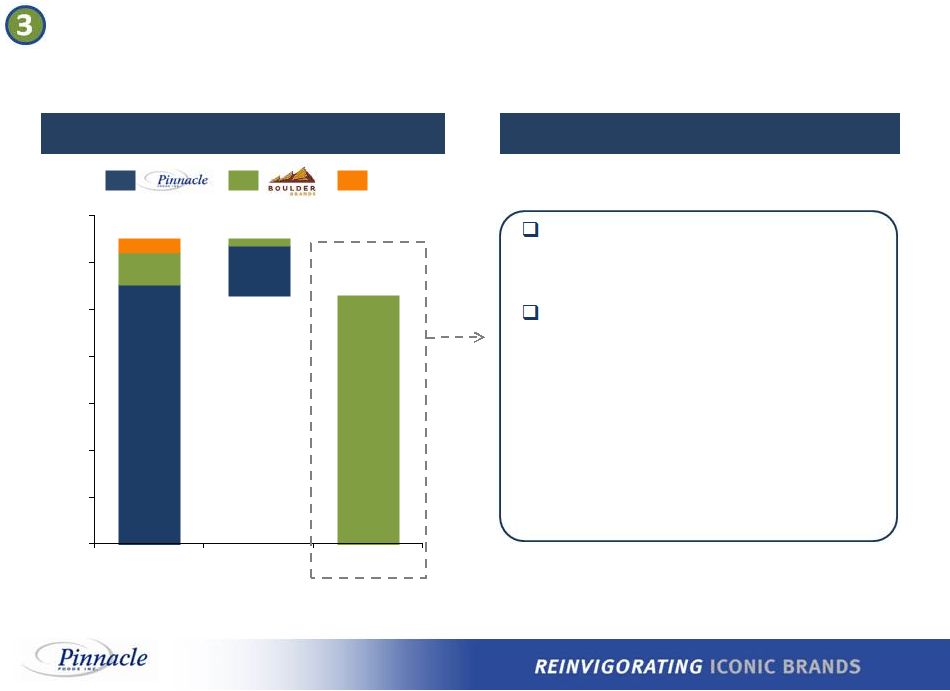
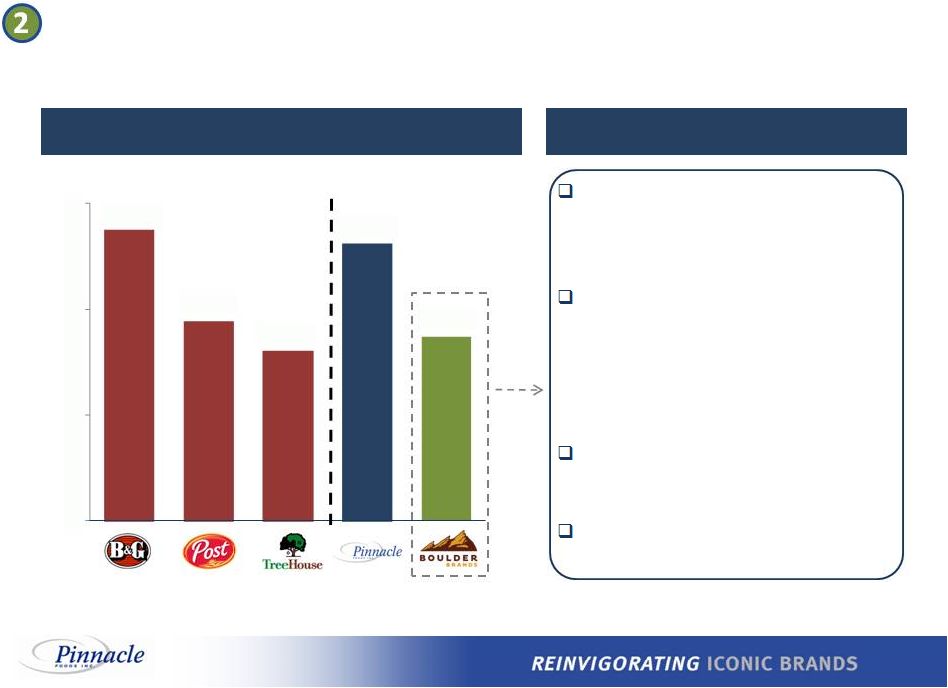 Attractive Pinnacle Margin Profile with Plan to Drive
Operational Efficiencies and Margin Expansion at Boulder
Adj. EBITDA Margin vs. Peers
(1) Key Boulder Brands Margin Drivers Source: Public company filings. Note: Pinnacle margins shown based on LTM 9/27/15 Adj. EBITDA of $520mm and includes the cost of stock-based
compensation. (1)
Reflects LTM figures.
(2) Pro forma for the Green Giant acquisition. Execute Boulder’s previously identified organic cost savings initiatives • Supply Chain • SG&A Overhead Achieve meaningful synergies across multiple initiatives: • Procurement & Manufacturing • Transportation & Warehousing • Public Company Costs • SG&A Overhead Implement SKU rationalization to drive focused and higher velocity Boulder portfolio Manage Smart Balance projected decline while improving profit margin % (2) 10 20.7% 14.1% 12.1% 19.7% 13.1% 0.0% 7.5% 15.0% 22.5% |
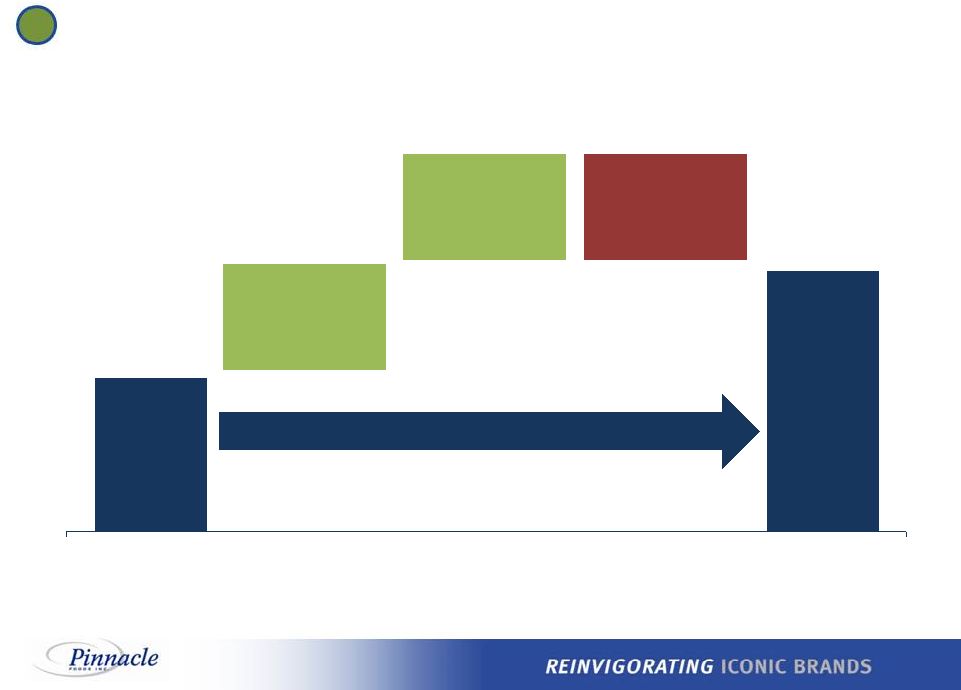 $69 LTM 9/30/15 Pro Forma Execute Boulder’s previously identified organic cost savings initiatives Achieve meaningful synergies across multiple initiatives Boulder Integration Opportunity Conservative operating model incorporates realistic assumptions and required investments… 2 Adjusted EBITDA ($ in millions) …with line of sight to potentially meaningful upside Note: Chart not to scale. SKU rationalization to drive focused and higher velocity Boulder portfolio Manage Smart Balance projected decline while improving profit margin % Integration Actions Takes ~24 months to achieve Integration Actions Takes ~24 months to achieve 11 |
 Expected Deleveraging Over Time
Strong Free Cash Flow Generation for Debt Paydown
Adj. EBITDA Less Capex
(1) Adj. EBITDA represents Covenant Compliance EBITDA. See reconciliation to GAAP financial measures in Appendix.
$553 $69 $105 $30 $16 $0 $100 $200 $300 $400 $500 $600 $700 PF LTM 9/27/15 Adj. EBITDA Capex Adj. EBITDA - Capex $532 $653 $121 Synergies Synergies (1) Strong free cash flow generation expected to drive rapid deleveraging Reduce leverage by ~0.5x per year • Deleveraging consistent with historical acquisitions • Target leverage ratio of ~4.0x within ~24 months and ~3.0x long-term, absent further acquisitions 12 |
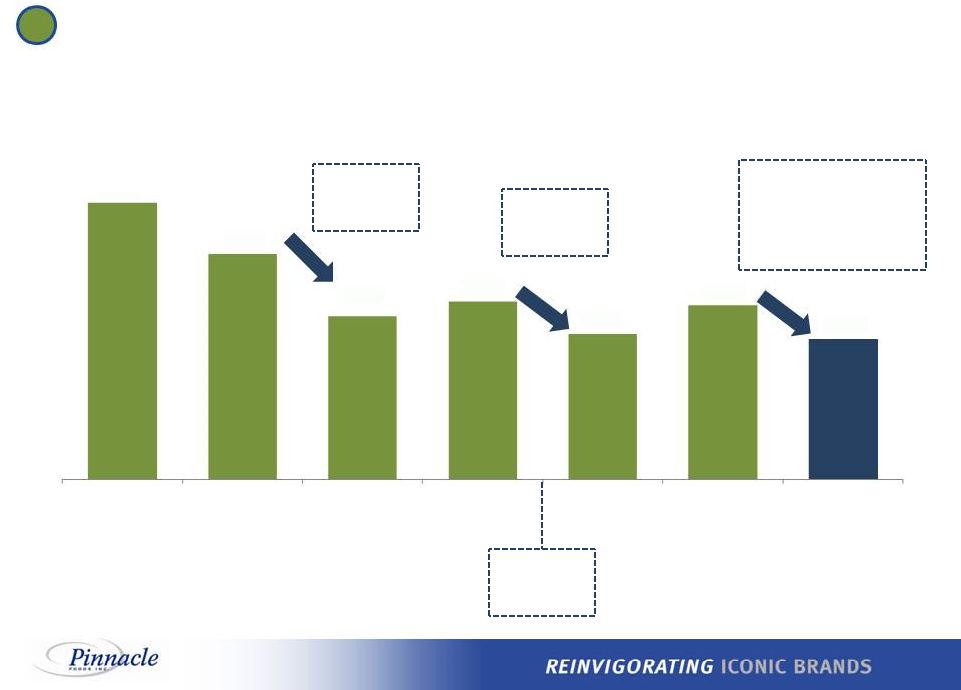 Pinnacle Has a History of Successful Deleveraging
3 IPO proceeds used to repay existing debt Note: Leverage statistics defined as Total Net Debt / Covenant Compliance EBITDA.
PF LTM 9/27/15 Total Net Debt figure based on 12/27/15 cash
balance. Approximate
2-year path to
~4.0x Leverage
Target deleveraging of ~0.5x
per year, consistent with
historical deleveraging post
acquisitions (Target leverage ratio of ~4.0x within ~24 months) May 2015: Blackstone exit completed 13 7.6x 6.2x 4.5x 4.9x 4.0x 4.8x ~4.0x Blackstone LBO (April '07) Birds Eye Acq. (December '09) IPO (March '13) Wishbone Acq. (October '13) 9/27/15A Status Quo Boulder Acq. PF LTM 9/27/15 |
 Proven Execution Expertise
($ in millions)
The Pinnacle team has a track record of successfully acquiring and integrating
iconic brands, driving top line growth and margin
expansion (1)
Adj. EBITDA represents Covenant Compliance EBITDA. See reconciliation to GAAP
financial measures in Appendix. (1)
14 $2,548 $2,464 $2,591 $3,147 $391 $515 $538 $653 PF 2009 (For Birds Eye) 2013 2014 PF LTM 9/27/15 Net Sales Adj. EBITDA |
 Cost Synergies
Acquisition Year Acquired Months to Integrate Identified at Acquisition Realized 2014 6 months $5mm $5mm 2013 3 months $17mm $17mm 2009 6 months $45mm $75mm (1) 2006 4 months $10mm $10mm Proven Track Record of Successful Integration and Cost Savings Realization 4 Purchase Price: $158mm Purchase Price: $575mm Purchase Price: $1.3bn Purchase Price: $200mm (1) Realized an additional $25mm of savings from subsequent plant consolidation, with capex investment of $50mm.
15 |
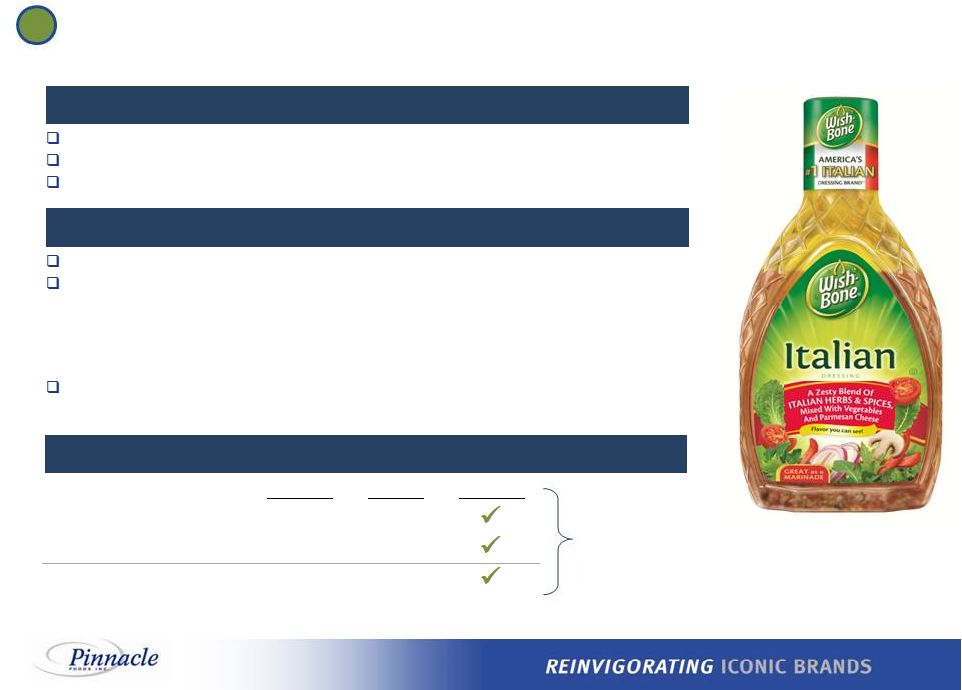 $575mm Purchase Price
Transaction EV / EBITDA multiple of 7.7x
(1) Achieved run-rate EBITDA of $65mm, as expected Q4 2013: Pinnacle
Foods Inc. completed the acquisition of Wish-Bone Q1 2014: Integrated
the back office and realized SG&A synergies •
Began process to bring Wish-Bone manufacturing in-house (18-month
co-packing arrangement with Unilever during facility
build-out process) •
$50mm investment to expand existing facility to accommodate in-sourced
Wish-Bone production
Q2 2015: Completed transition to St. Elmo facility; exited contractual agreement with Unilever
• Realized identified full run-rate EBITDA of $65mm One-time costs of $8 million to achieve synergies Transaction Overview Wish-Bone Case Study: Identified & Achieved Synergies 4 Wish-Bone Execution Timeline Results Identified Realized On Target Cost of Products Sold Savings $13mm $13mm SG&A Savings $4mm $4mm Total Synergies $17mm $17mm (1) Calculation includes synergies, $125mm NPV of Tax Assets and $50mm of capex.
16 |
 Protect the Business
Secure Value & Initial Cost Synergies
Drive Growth & Manufacturing Synergies
Ensure continuation of base business
operations post-close and a smooth
transition Capture SG&A purchasing and logistics synergies 1. Cash Management 2. Financial Controls/ Shared Services 3. Customer Service/ Order Entry 4. Manufacturing Transition Coordination Execute on opportunities to drive manufacturing efficiencies and optimize co-packing relationships Steering Committee 5. External Communication 6. Internal Communication 7. Day 1 Readiness 8. Consumer Affairs Execution Taskforces: 9. Legal 10. Org Design, Recruiting & Staffing 11. IT Systems 12. Trade Spend/Sales Promotion 13. Sales Process/ Brokerage 14. Logistics/Distribution 15. Procurement Execution Taskforces: 16. Marketing Strategy 17. Business Planning 18. Manufacturing Integration 19. S&OP 20. R&D Execution Taskforces: Bob Gamgort (CEO) & Craig Steeneck (CFO) Program Office Managed by senior executives from Pinnacle and Boulder that will serve as co-leads on the integration
As in prior acquisitions, the Program Office will be supported by Bain
Consulting Will lead multiple taskforces that are each focused on
a specific integration objective Management will draw upon the
same, proven playbook that has been used for prior Pinnacle
acquisitions 1
2 3 Pinnacle’s Integration Playbook 4 17 |
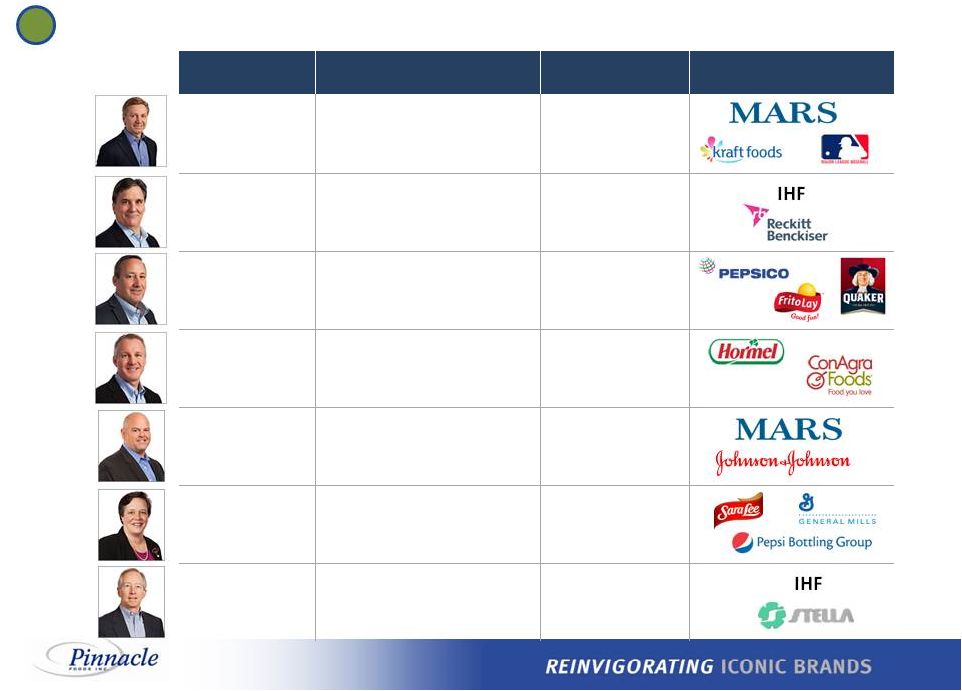 Name Role Relevant Industry Experience Consumer Products Experience Bob Gamgort Chief Executive Officer 30 years Craig Steeneck Executive VP and Chief Financial Officer 25 years Mark Schiller Executive VP and President North America Retail 30 years Christopher Boever Executive VP and Chief Customer Officer 25 years Mike Wittman Executive VP and Chief Supply Chain Officer 30+ years Mary Beth DeNooyer Executive VP and Chief HR Officer 22 years Kelley Maggs Executive VP and General Counsel 23 years Experienced Operating Team Led by Industry Veterans 5 18 |
 Agenda Transaction Overview Credit Highlights Pinnacle Business Update Boulder Brands Opportunity |
 Attractive Value Creation Results Since IPO
Net Sales Operating Income EPS Dividend Yield In Line with Categories 10 – 12% 4 – 5% 7 – 8% 3 – 4% LT Organic Growth Target @ IPO 13% 14% 3% Outpaced Categories 17% 2014 Accretive Acquisitions Accelerate Growth Beyond Algorithm Note: Excludes items affecting comparability. 15% 12% LTM 9/27/15 Outpaced Categories 3% 5% 19 |
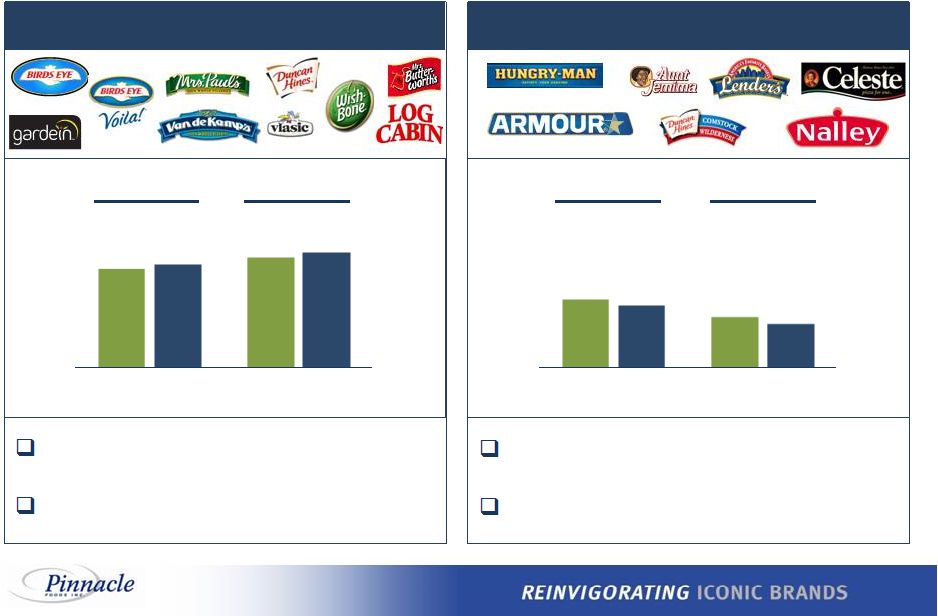 69% 77% 72% 80% Net Sales 2014 2015 2014 2015 31% 23% 28% 20% 2014 2015 2014 2015 Invest in marketing to drive growth and share expansion Focus on breakthrough innovation Gross Profit Net Sales Gross Profit Maintain stable sales/market position and cash flow Focus on brand renovation Leadership Brands Foundation Brands (% of NA Retail) (% of NA Retail) 9 Months Pinnacle’s Portfolio Management Strategy 9 Months 9 Months 9 Months 20 |
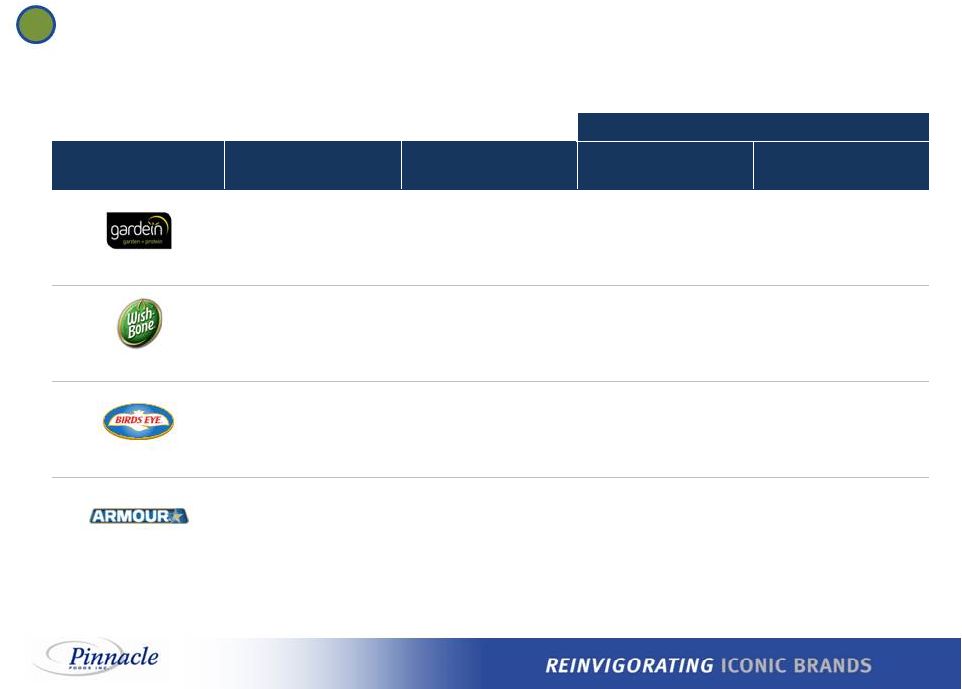
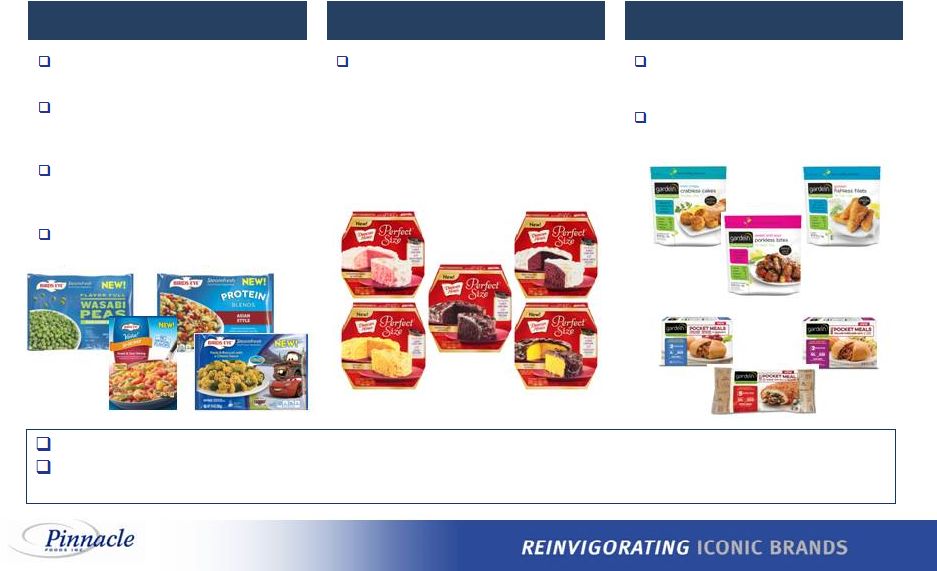 Driving Growth Through Innovation
Birds Eye Flavor Full: Pairing popular vegetables
with on-trend flavors
Protein Blends: Delivering plant-based protein benefit through nutrient-rich vegetables, beans and whole grains Disney-themed Sides: Great-tasting, nutritious offering
featuring key Disney characters
Birds Eye Voila!: Expansion into new
premium, non-chicken price tier
Duncan Hines A breakthrough insight/platform with new premium baking kits positioned for smaller households • Ideal for serving 2 to 4 people • Kit includes mix, frosting and 6- inch disposable pan Gardein Rapidly growing innovator of plant- based proteins New meatless entrée and pocket meal varieties introduced in 2015 Innovation highly incremental to Pinnacle and categories Recognized by retailers as delivering best in class innovation • Ranked #1 in Food in 2015 Advantage Survey All Pinnacle innovation is targeted to be margin-accretive, focused on trading consumers up to products offering incremental benefits 21 |
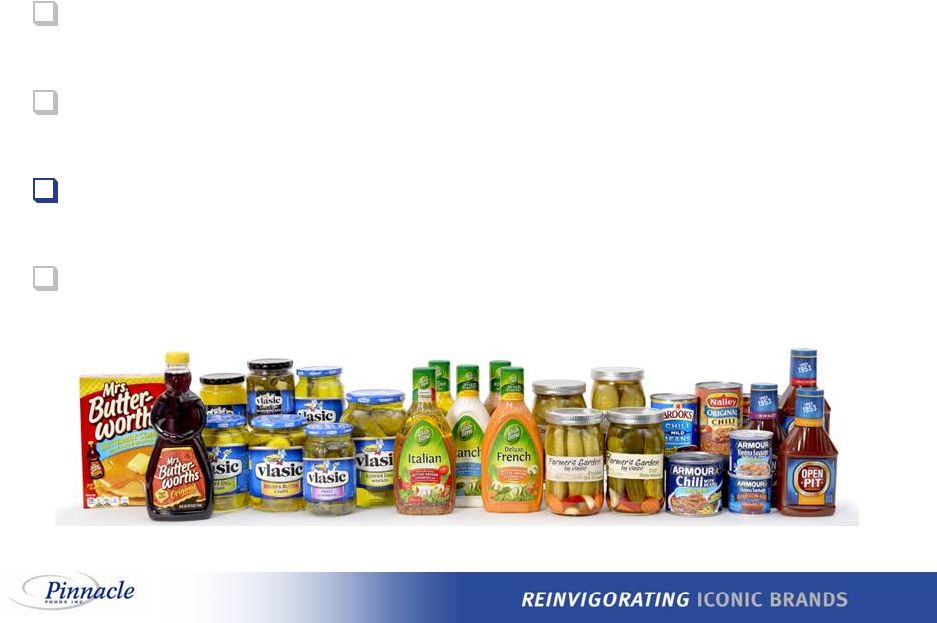
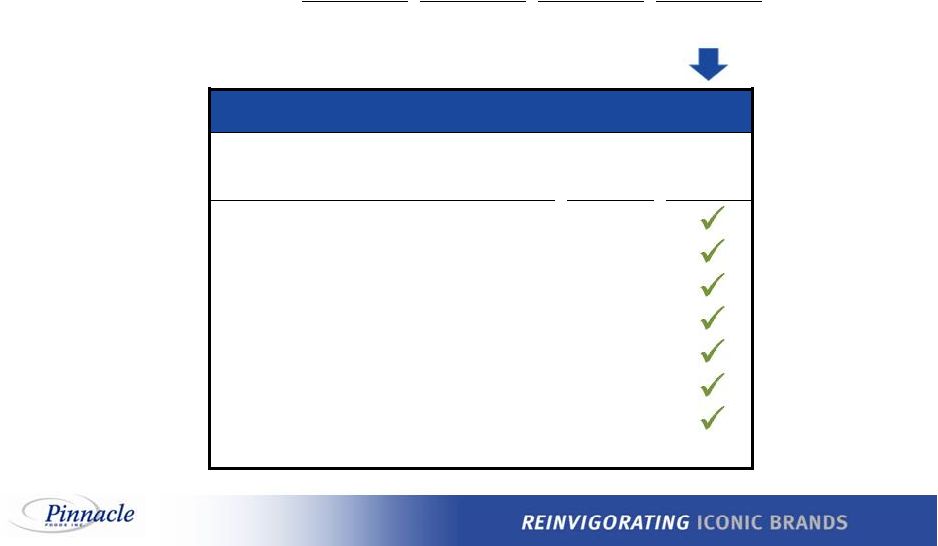 Leadership Brands
Category Pinnacle Market Position Growing/ Holding Share Frozen Vegetables #1 Frozen Complete Bagged Meals #1 Frozen Prepared Seafood #2 Frozen/Refrig. Meat Substitutes #2 Shelf-Stable Pickles #1 Table Syrups #1 Cake/Brownie Mixes and Frostings #2 Shelf-Stable Salad Dressings #3 Source: IRI US Multi-Outlet data, YTD ending 11/29/15; based on IRI’s Pinnacle custom definitions; market position ranks are
among branded players. Growth driven by strong performance of
Leadership Brands 2012
2013 2014 2015 YTD $ Market Share +0.1 pts. +0.3 pts. +0.2 pts. +0.6 pts. (Change vs. PY) Pinnacle Foods Composite Market Share 22 |
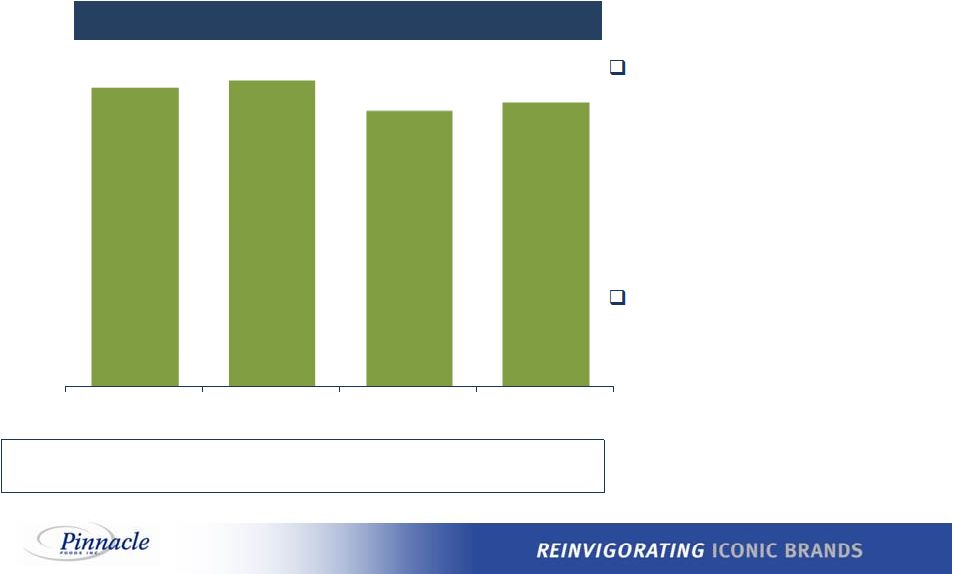 4.0% 4.1% 3.7% 3.8% Productivity (1) 2012 2013 2014 LTM 9/27/15 Maximizing Value Through Productivity (MVP) – sustainable ongoing program • Strategic sourcing • Product design • Conversion cost improvement • Network optimization Opportunistic supply chain consolidations • 2012-2013 performance enabled by prior acquisitions Maximizing Value Through Productivity at Pinnacle $68mm $64mm $71mm $71mm $ Saved: Sustainable ongoing program targets 3-4% annual savings in COPS (1) As disclosed in company public filings.
23 |
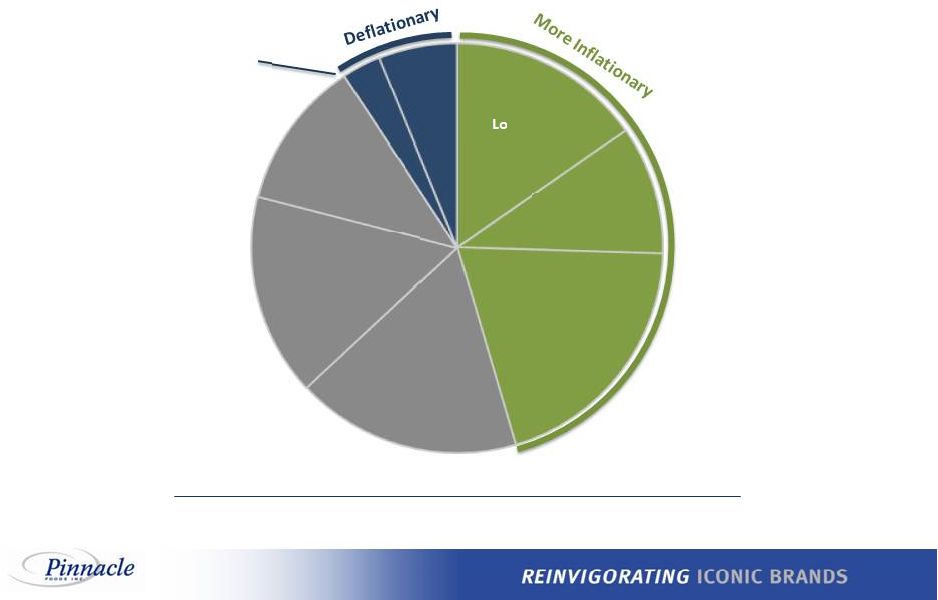 Pinnacle’s Input Cost Breakdown
Conversion Logistics Proteins Grains & Oils Packaging Vegetables & Fruit All Other Sugar & Cocoa COPS of $1.9 billion @ inflation rate of ~3% for 2015 Note: COPS as of LTM 9/27/15. Diversity of COPS input basket serves as a natural hedge 24 |
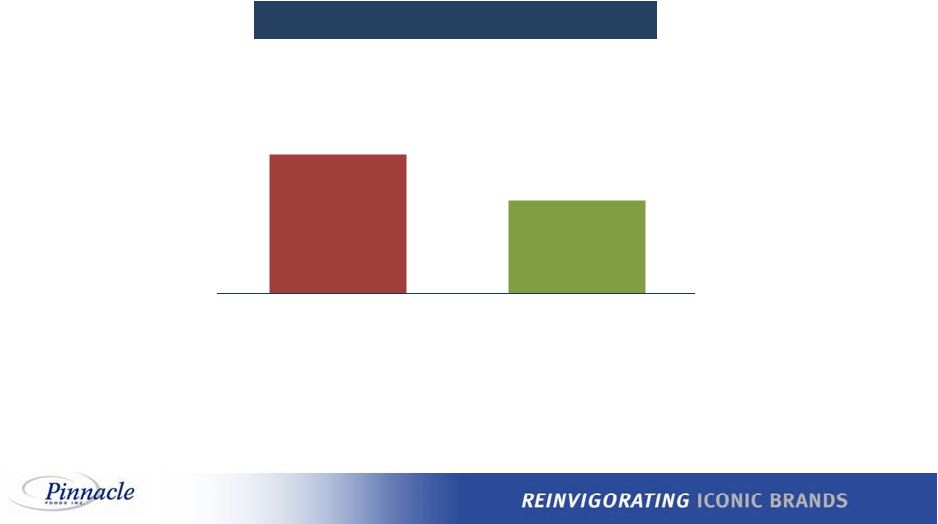 Lean Overhead Source: Pinnacle analysis. Defined as selling, general and administrative expenses excluding marketing investment, intangible amortization and one-time
items. (1)
Peer Average represents 2014 fiscal year end data. Pinnacle SG&A as % of
Net Sales of ~9% represents LTM 9/27/15 data. (2)
BGS, CAG, CPB, GIS, KRFT, MKC, SJM.
SG&A % of Net Sales
(1) ~12% ~9% Peer Average (2) Pinnacle Industry-leading efficient organization structure with SG&A overhead consistently approximating 9% of net sales 25 |
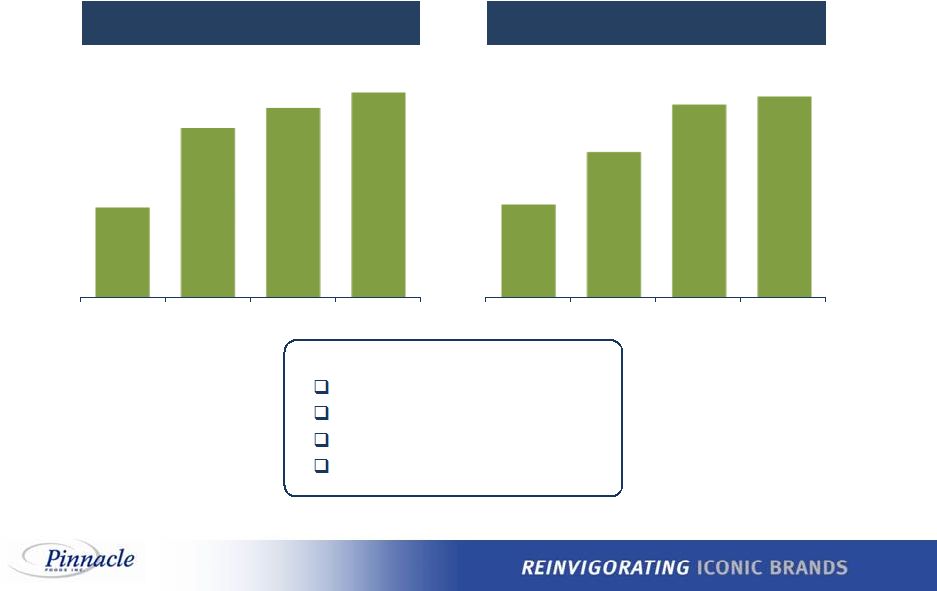 Pinnacle’s Gross Margin Improvement Translates to
EBITDA Margin Expansion
Key Drivers: Portfolio Management Strategy Margin Accretive Innovation Sustainable Productivity Program Lean Overhead Structure Note: Gross Profit is on an adjusted basis, consistent with Adj. EBITDA. See reconciliation to GAAP financial measures in Appendix.
(1)
Adj. EBITDA Margin presented above includes the cost of stock-based
compensation. Adj. Gross Profit % Net Sales
Adj. EBITDA Margin
(1) 25.1% 27.0% 27.5% 27.8% 2012 2013 2014 LTM 9/27/15 17.2% 18.4% 19.5% 19.7% 2012 2013 2014 LTM 9/27/15 26 |
 ~4% ~7% Peer Average (3) Pinnacle Estimate Superior Free Cash Flow Generation Another year of strong free cash flow expected in 2015… …despite strong crop season driving higher inventories thus burdening LTM September 2015 unleveraged free cash flow ($ millions) (1) Defined as Cash From Operations, less capital expenditures, less 2014 Hillshire Termination Fee, less Acquisition / merger / other
charges, plus cash interest expense. (2)
2015E based on industry analysts’ valuation analyses using prices as of
12/11/2015. (3)
CPB, CAG, DF, FLO, GIS, HSY, HRL, SJM, K, KHC, MJN, MKC, MDLZ, PEP, PF,
WWAV. Unleveraged Free Cash Flow
(1) Free Cash Flow Yield (2) $345 $325 $452 $362 2012 2013 2014 LTM 9/27/15 Expected Q4 working capital benefit driven by inventory timing in 2015 27 |
 Capital Expenditures
Prudent investment in both acquisition and base business capex
further supports strong cash flow
2012 2013 2014 LTM 9/27/15 $78 $84 $103 $105 Base Capex Acquisition Related Capex ($ millions) $56 $TBD 2.8% 2.2% 3.4% 3.2% Base Capex as % of Net Sales: $47 $31 $74 28 |
 Historical Pinnacle Financial Performance
Total Revenue Adj. EBITDA (1) Capex Adj. EBITDA (1) Less Capex ($ millions) % of Sales % of Sales Adj. EBITDA Margin Adj. EBITDA Margin 29 (1) Adj. EBITDA presented above includes the cost of stock-based compensation. See reconciliation to GAAP financial measures in
Appendix. $2,478
$2,464 $2,591 $2,639 $2,300 $2,400 $2,500 $2,600 $2,700 2012A 2013A 2014A LTM 9/27/15 $426 $452 $504 $520 17.2% 18.4% 19.5% 19.7% $300 $350 $400 $450 $500 $550 2012A 2013A 2014A LTM 9/27/15 $78 $84 $103 $105 3.2% 3.4% 4.0% 4.0% $0 $25 $50 $75 $100 $125 2012A 2013A 2014A LTM 9/27/15 $348 $368 $401 $415 $250 $300 $350 $400 $450 2012A 2013A 2014A LTM 9/27/15 |
 LTM Performance on an Adjusted Basis
Recent Pinnacle Performance
Net sales increase driven by
North America Retail, reflecting
the Gardein acquisition and
growth in the base business,
fueled by innovation and net
price realization
Adjusted gross profit margin
increase driven by strong
productivity, favorable mix and
higher net price realization,
partly offset by input cost
inflation SG&A/Other maintained at ~11% • SG&A Overhead: 8.9% • Marketing/Other: 2.5% Increase in Adjusted EBIT reflects the growth in gross profit and the benefit of maintaining lean SG&A/Other expenses Key Highlights Source: Company Filings. (1) Adj. EBITDA presented above includes the cost of stock-based compensation. See reconciliation to GAAP financial measures in Appendix.
30
($ in millions)
LTM 9/28/14 LTM 9/27/15 Total Net Sales $2,595 $2,639 +2% Adjusted Gross Profit $708 $733 +4% % Margin 27.3% 27.8% +52 bps Adjusted SG&A / Other $295 $300 +2% % Sales 11.4% 11.4% (4 bps) Adjusted EBIT $413 $433 +5% % Margin 15.9% 16.4% +48 bps Adjusted EBITDA (1) $494 $520 +5% % Margin 19.0% 19.7% +67 bps |
 Acquisition Strategy
Pinnacle employs a disciplined approach to M&A, with a maximum
leverage threshold up to 5.5x and line of sight to deleveraging
quickly North America Focus Existing or adjacent categories Market leadership or line of sight to leadership Synergy-rich transaction Speed of integration 31 |
 Disciplined Financial Policies
Conservative Balance Sheet Policy Use strong free cash flow to pay down debt Maximum leverage for an acquisition up to 5.5x Target deleveraging of ~0.5x per year, consistent with historical deleveraging post acquisitions • Target leverage ratio of ~4.0x within ~24 months • Long-term leverage ratio targeted at ~3.0x, absent further acquisitions Strong liquidity profile consisting of $150 million unfunded Revolver and a cash balance of at least $50 million pro forma for transaction Shareholder Returns Policy Quarterly dividend program with current rate at $0.255 per share Dividend payout targeted at 50% of Net Earnings No current or expected share repurchase authorization at this time 32 |
 Agenda Transaction Overview Credit Highlights Pinnacle Business Update Boulder Brands Opportunity |
 Boulder Brands: A Strong Brand Portfolio…
2005 May 2007 August 2011 July 2012 January 2013 May 2013 July 2013 August 2013 December 2013 December 2005 Company founded Acquired Glutino Group for $66mm Partnership with BBIG to look for early stage growth companies Acquired an 80% stake in GlucoBrands, the owner of Level Life Foods, for ~$2mm Acquired EVOL Foods for $50mm IPO for ~$102mm Merged with GFA Brands, the owner of Smart Balance & Earth Balance, for $491mm Acquired Udi's Healthy Foods for $127mm Acquired Davies (UK gluten-free bakery) for ~$4mm Opened largest dedicated gluten-free facility in the U.S. (Denver) 2007 LTM 9/30/15 (1) Boulder Brands was founded as a Special Purpose Acquisition Company (“SPAC”) in 2005 Strategy to create a next generation of packaged foods that deliver good-tasting products for people on need-based diets The company rapidly grew by acquiring many businesses across the food sector Portfolio diversification and addition of Udi’s and Glutino have strongly positioned Boulder Brands in gluten-free category 2005 2010 2012 2013 (1) Excludes discontinued Level Life brand. 33 96% 4% Natural 64% Balance 36% |
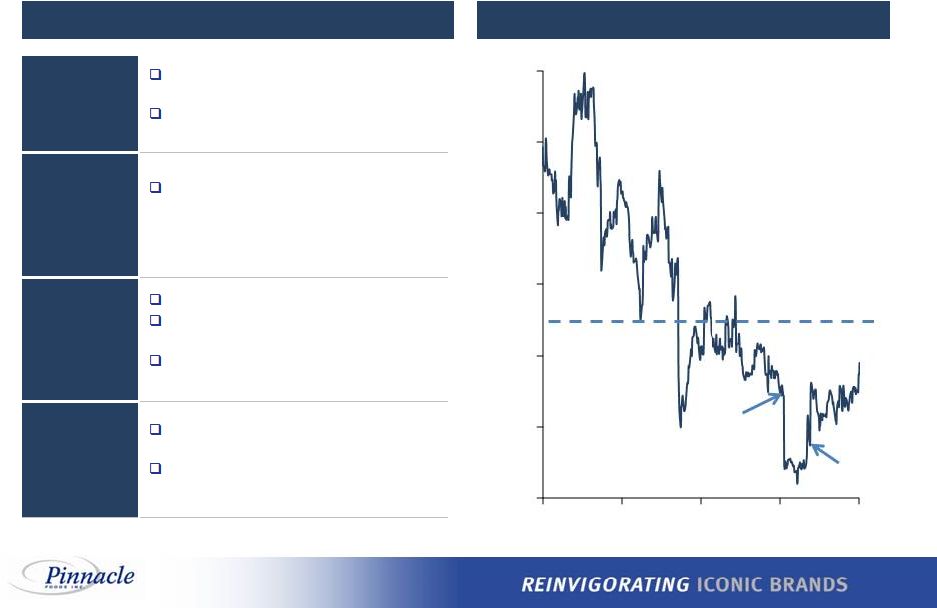 Balance Segment FY2014 declining performance, with sales down 10% year-over-year Negatively impacted by shifting consumer preferences Q2 Downward Revision (June 2015) Net sales expected to decline 5-7% compared to Q2'14 • Natural segment growth of 0%-2% • Balance segment decline of 16%-18% Management Changes (June / July 2015) Co-founder and CEO, Steve Hughes, resigns James Leighton, COO, to serve as interim CEO Announced organizational realignment plans Strategic Alternatives, Fiscal Year Guidance (August 2015) Exploring range of strategic and financial alternatives to enhance shareholder value Limiting outlook for FY2015 given continued near-term variability of operations Boulder Brands' Stock Price Recent Challenges Source: Company filings and FactSet. 6/10/15: Co-founder resigns, Q2 guidance announced …with Recent Challenges 8/6/15: Strategic alternatives announced Offer Price: $11.00 34 $6.00 $8.00 $10.00 $12.00 $14.00 $16.00 $18.00 Jan-14 Jun-14 Dec-14 May-15 Nov-15 |
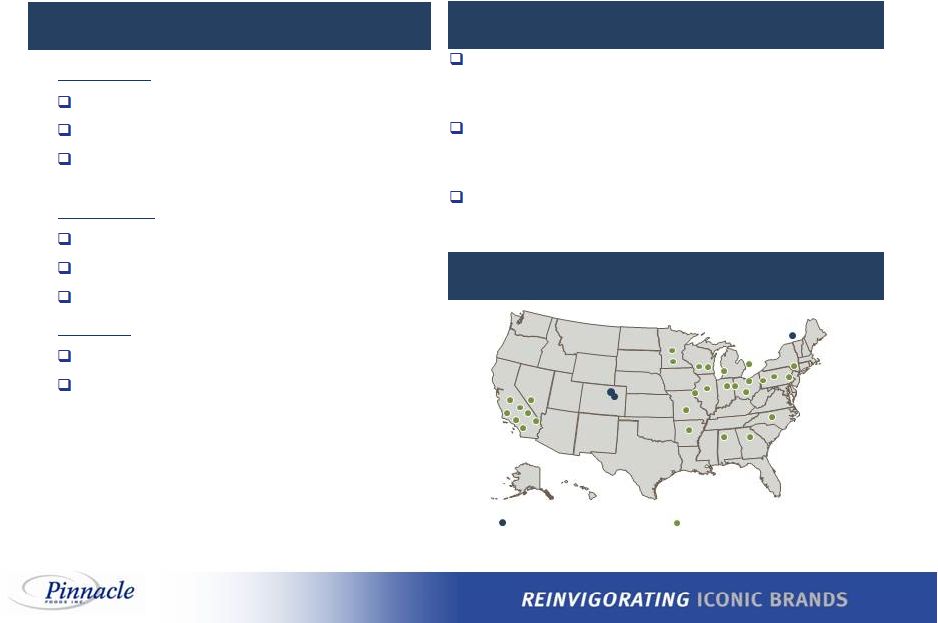
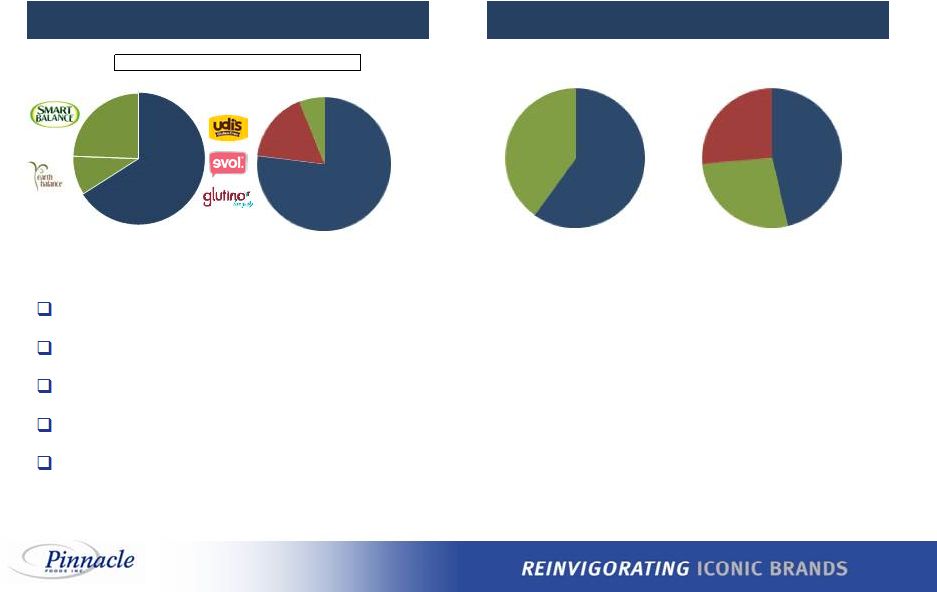 Leading portfolio of health and wellness brands
Positioned to capitalize on industry tailwinds and shifting consumer trends in
foods Supply chain flexibility achieved through combination of
in-house manufacturing and co-manufacturing Strong
relationships with key retail partners across natural & organic and conventional grocery channels Opportunity to expand in foodservice and new channels of distribution Sales by Brand and Channel (1) Manufacturing Summary (1) Excludes discontinued Level Life brand. Unique and Authentic Health & Wellness Platform By Brand By Channel LTM 9/30/15 Net Sales of $508mm Natural & Organic International Other Conventional Co- Manufactured Self- Manufactured Refrigerated Frozen Ambient Natural 64% Balance 36% Other 35 46% 27% 27% 60% 40% 77% 17% 6% |
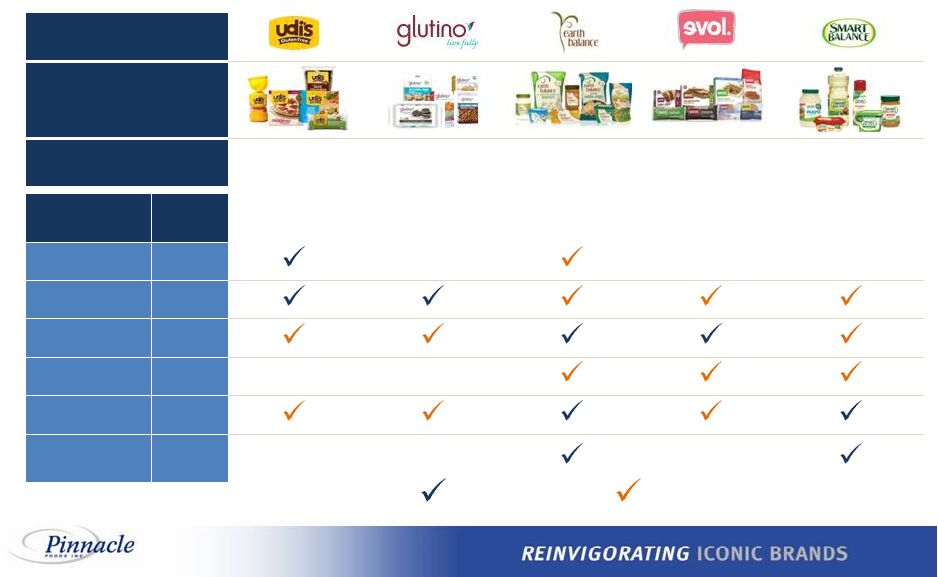 Portfolio of authentic brands offering unique health and wellness
solutions (1) Nielsen eXtended All Outlet Coverage (“xAOC”) 12 weeks ending 12/20/14. xAOC includes conventional grocery, drug, mass,
Wal-Mart, select club (excluding Costco) and dollar stores. Broad
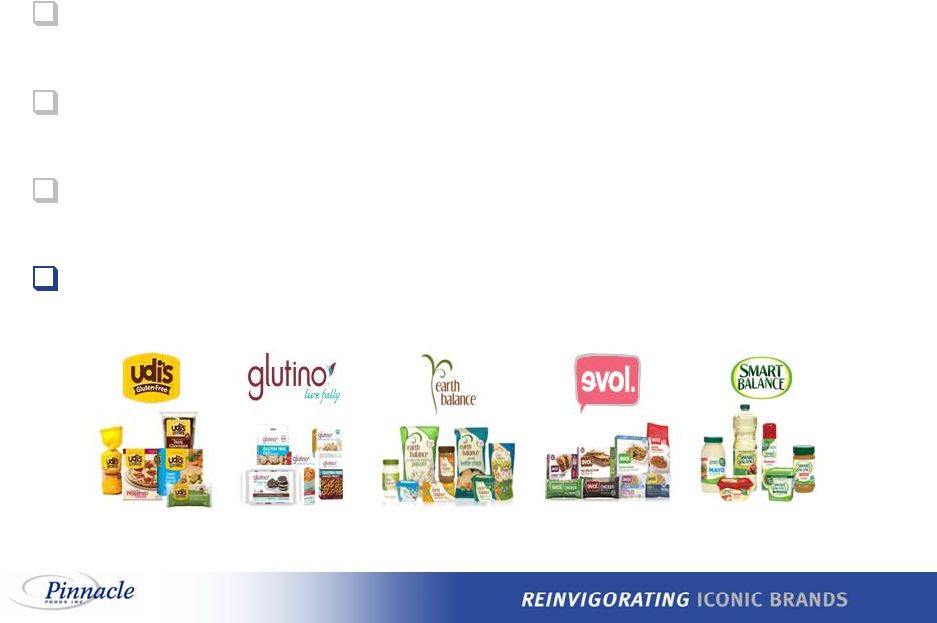
Portfolio That Addresses Consumer Needs Brand
Representative Products Brand Positioning Flagship premium gluten-free brand Gluten-free sweet and savory snacking Plant-based nutrition On-trend, pure & simple Heart healthy Need Addressed Growth Rate (1) Soy Free +30% Gluten-Free +11% Natural +10% Organic +10% Non-GMO +10% Lactose Free / Reduced Lactose +7% Entire Product Line Selected Products 36 |
 All brands utilize third-party co-manufacturers. Glutino,
Udi's and EVOL brands utilize a hybrid of internal and
external manufacturing
Outsourcing is designed to enhance production flexibility
and capacity, leverage working capital, and focus energy
and resources on product innovation, marketing and sales
Third-party warehouses are used for distribution and
storage 1) Florence St. Located in Denver, Colorado Produces Udi’s and Glutino products Largest dedicated gluten-free manufacturing facility in North America 2) Laval Bakery Located in Laval, Quebec, Canada Produces Glutino and Udi’s products Manufactures exclusively gluten-free products 3) Range St. Located in Boulder, Colorado Produces EVOL products North America Production / Co-Manufacturing Locations Self Manufacturing Facilities Overview Co-Manufacturing Overview Co-Manufacturing Locations (~29) Boulder Brands’ Production Overview Self Manufacturing Locations (3) (1) Excludes >10 co-manufacturing locations outside of North America.
(1) 37 |
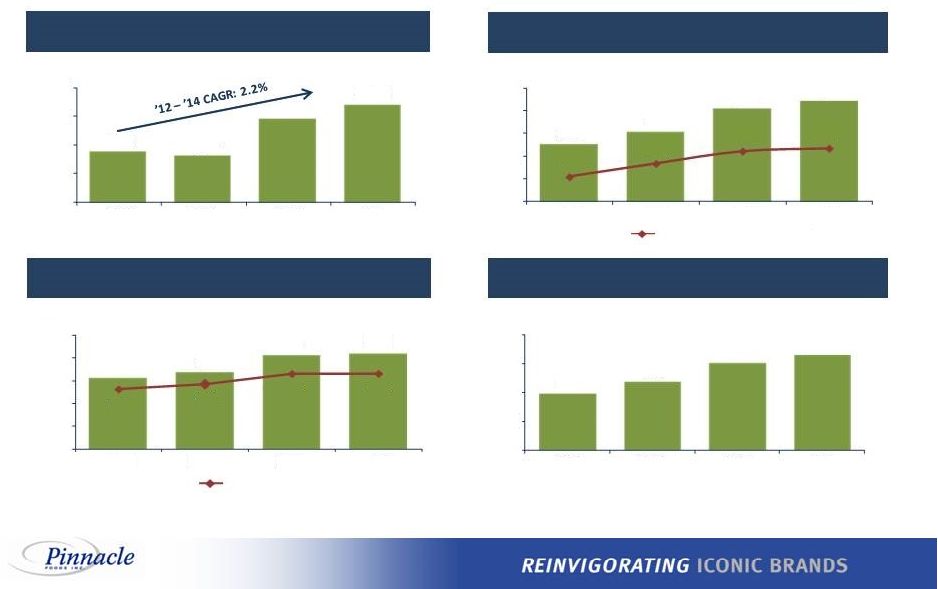
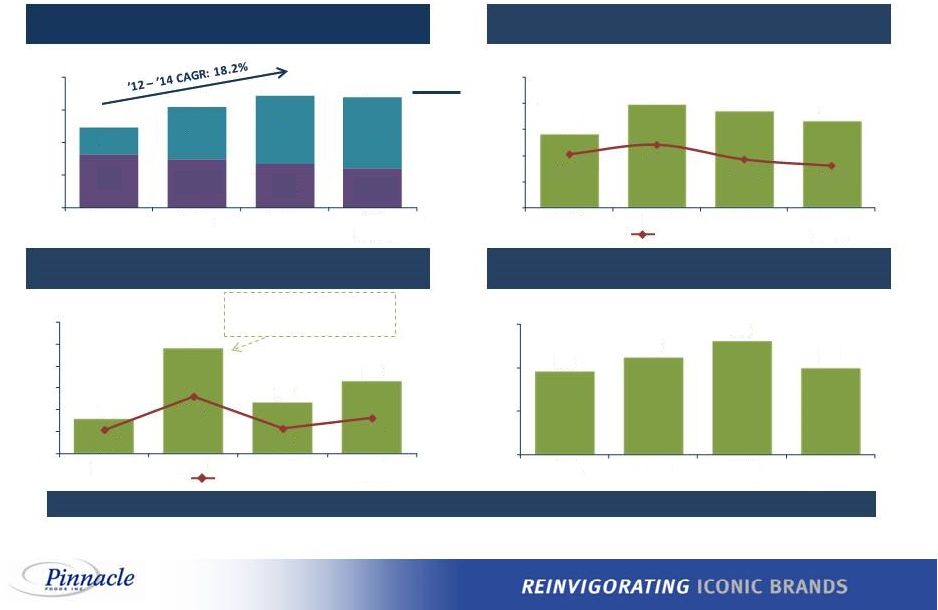 Historical Boulder Brands Financial Performance
Strong Top Line with Opportunity to Recapture Margin
Total Revenue Adj. EBITDA (1) Capex Adj. EBITDA (1) Less Capex ($ millions) Increase primarily attributable to investment in automated bread line and Udi’s facilities consolidation Adj. EBITDA Margin Adj. EBITDA Margin % of Sales % of Sales Balance: (9.5%) ’12 – ’14 CAGR: Natural: 60.1% 38 $247 $224 $202 $184 $123 $237 $314 $324 $370 $461 $517 $508 $0 $150 $300 $450 $600 2012A 2013A 2014A LTM 9/30/15 $57 $79 $74 $67 15.3% 17.1% 14.3% 13.1% $0 $20 $40 $60 $80 $100 2012A 2013A 2014A LTM 9/30/15 $8 $24 $12 $16 2.2% 5.2% 2.3% 3.2% $0 $5 $10 $15 $20 $25 $30 2012A 2013A 2014A LTM 9/30/15 $48 $55 $62 $50 $10 $30 $50 $70 2012A 2013A 2014A LTM 9/30/15 Source: Company Filings.
(1) Adj. EBITDA does not include the cost of stock-based
compensation, consistent with Boulder reporting. See reconciliation to GAAP financial measures in Appendix.
|
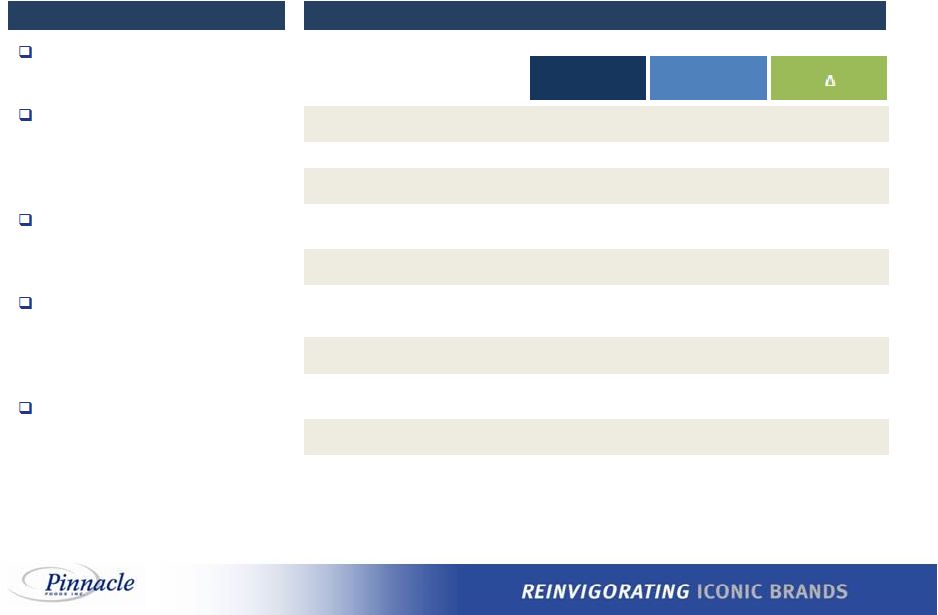 LTM Performance on an Adjusted Basis
Recent Boulder Brands Performance
Net sales decrease driven by the
Balance Segment
Adjusted gross margin decline
impacted by mix shift to lower
margin Natural segment from
higher margin Balance segment
Adjusted Brand Profit decrease
driven by both the Balance and
Natural segments
Adjusted SG&A/Other includes
SG&A overhead, marketing,
freight and intangible
amortization Adjusted EBITDA decline driven by decline in gross profit and increase in SG&A/Other Key Highlights 39 ($ in millions) LTM 9/30/14 LTM 9/30/15 Total Net Sales $514 $508 (1%) Adjusted Gross Profit $196 $183 (6%) % Margin 38.1% 36.1% (205 bps) Adjusted SG&A / Other $152 $162 +6% % Sales 29.5% 31.8% (232 bps) Adjusted Brand Profit $131 $118 (11%) % Margin 25.6% 23.1% (244 bps) Adjusted EBITDA (1) $79 $67 (15%) % Margin 15.3% 13.1% (220 bps) Source: Company Filings.
(1) Adj. EBITDA does not include the cost of stock-based compensation,
consistent with Boulder reporting. See reconciliation to GAAP financial measures in Appendix. |
 Credit Highlights
Strong Position in High Growth
Health and Wellness Categories
Attractive Pinnacle Margin Profile with Plan to Drive Operational
Efficiencies and Margin Expansion at Boulder
Strong Free Cash Flow Generation for Debt Paydown
Proven Track Record of Successful Acquisition Integration and Cost Savings Realization Experienced Operating Team Led by Industry Veterans 1 2 3 4 5 40 |
 Appendix |
 (1) Primarily includes: Restructuring charges from plant consolidations, integration costs, other non-recurring merger costs and employee
severance. ($ in millions)
9 months LTM Pinnacle Foods 2012 2013 2014 9/27/2015 9/28/2014 9/27/2015 Reported Cash Flow from Operating Activities $203 $262 $551 $211 $413 $349 Capital Expenditures (78) (84) (103) (85) (83) (105) Hillshire Termination Fee (Net of Costs & Cash Taxes) -- -- (150) -- (150) -- Acquisition, Merger & Other Restructuring (1) 48 39 64 13 43 34 Free Cash Flow $173 $217 $362 $139 $223 $277 Cash Interest Expense 172 108 90 63 69 85 Unleveraged Free Cash Flow $345 $325 $452 $202 $292 $362 Pinnacle Foods – Unleveraged Free Cash Flow Reconciliation 41 |
 Pinnacle Foods –
Adjusted Gross Profit
Reconciliation For fiscal year 2012, reflects accelerated depreciation related to plant closures. For the nine-month period ended September 27, 2015, reflects accelerated depreciation related to in-sourcing of Wish-Bone production
1 a) Represents non-cash gains and losses resulting from mark-to-market obligations under derivative contracts
b) For fiscal year 2013, represents additional Cost of products sold
attributable to the write-up to fair market value of inventories acquired as a result of the Wish-Bone acquisition. For fiscal year 2014, represents additional Cost of products sold attributable to the write-up to
fair market value of inventories acquired as a result of the
Garden Protein acquisition c) For the nine-month period ended
September 27, 2015, represents non-cash employee incentives and retention charges resulting from the termination of the Hillshire merger agreement. For all other periods, it also includes equity based compensation resulting from the
liquidity event associated with the reduction in December 2014 of
Blackstone’s ownership to 16.5%. 2
Includes expenses in connection with an acquisition or other non-recurring
merger costs, restructuring charges, integration costs and other business optimization expenses and employee severance and recruiting 3 For fiscal year 2012, primarily represents costs for the recall of Aunt Jemima product, net of insurance recoveries
4 ($ in millions) 9 Months Ending LTM Pinnacle Foods 2012 2013 2014 9/27/2015 9/28/2014 9/27/2015 GAAP Gross Profit $584.5 $654.2 $681.2 $517.7 $492.8 $706.1 Accelerated depreciation expense 21.0 -- -- 1.1 -- 1.1 Non-Cash Items (1.3) 5.6 17.9 0.7 4.6 14.0 Acquisition, merger and other restructuring charges 16.9 4.5 12.3 6.3 6.4 12.2 Other Adjustments 1.6 -- -- -- -- -- Adjusted Gross Profit $622.8 $664.4 $711.3 $525.9 $503.8 $733.4 1 2 3 4 42 |
 Pinnacle Foods –
Adjusted EBIT Reconciliation
2014 and thereafter: Receipt of Hillshire merger termination fee, net of external advisory expense and employee incentives, plant integration and restructuring charges, non-recurring merger costs and other acquisition-related expenses
1 2015 and thereafter: Unrealized foreign exchange losses resulting from intra- entity loans, employee stock compensation expense related to the termination of the Hillshire merger agreement and unrealized mark- to- market gains resulting from hedging activities 2 1 2 43 ($ in millions) 9 Months Ending LTM Pinnacle Foods 2014 9/27/2015 9/28/2014 9/27/2015 GAAP Operating Income $283.6 $293.0 $512.3 $276.1 $418.6 $369.7 Acquisition, merger and other restructuring charges 45.1 22.1 (130.1) 9.4 (143.1) 22.4 Other Non-Cash Items 0.1 5.6 41.0 5.0 5.3 40.8 Other Adjustments 21.0 53.4 0.2 -- 0.2 -- Adjusted EBIT $423.4 $290.5 $281.0 $432.9 |
 Pinnacle Foods –
Covenant Compliance EBITDA
Reconciliation Non-cash (gains) / losses resulting from mark-to-market adjustments of obligations under derivative contracts Additional COPS to write-up to fair market value of inventories acquired through acquisitions Non-cash employee incentives and retention charges from termination of Hillshire merger agreement and equity-based compensation charges from liquidity event with associated with the reduction in December 2014 of Blackstone’s ownership to 16.5% Foreign exchange losses resulting from intra-entity loans anticipated to be settled in the foreseeable future Expenses related to secondary offerings of common stock and receipt of Hillshire merger termination fee Integration costs of Gardein, Wish-Bone, and Gilster and gain from sales of Millsboro and Tacoma Facilities Severance costs paid or accrued to terminated employees Management/advisory fees paid to an affiliate of Blackstone, including fees relating to the termination of the advisory agreement in connection with the IPO Premium and fees paid for redemptions of notes and costs for the recall of Aunt Jemima product of $2.1 million Impairment on the Bernstein’s tradename Pro Forma Net Cost Savings projected to be realized from the Gardein and Wish-Bone acquisitions 44 ($ in millions) 9 Months Ending LTM Pinnacle Foods 2012 2013 2014 9/27/2015 9/28/2014 9/27/2015 GAAP Net Income $52.5 $89.3 $248.4 $133.3 $212.3 $169.4 Interest Expense, Net 198.4 132.2 96.1 66.0 73.7 88.4 Income Tax 32.7 71.5 167.8 76.8 132.7 111.9 Depreciation & Amortization 98.1 78.2 80.6 67.4 60.0 88.0 GAAP EBITDA $381.7 $371.3 $592.9 $343.5 $478.6 $457.7 Unrealized (Gains) Losses Resulting from Hedging Activities (1.3) (0.7) 12.5 (0.2) 3.6 8.7 Adjustments Related to Application of Purchase Accounting -- 6.3 0.6 -- -- 0.6 Non-Cash Compensation Charges -- -- 27.2 1.6 1.7 27.1 Unrealized Foreign Exchange Losses -- -- 0.7 3.7 -- 4.4 Other Adjustment Items 0.5 -- -- -- -- -- Acquisition or Other Non-Recurring Merger Costs 2.4 9.5 (144.5) 1.1 (150.2) 6.8 Restructuring, Integration, and Business Optimization Expenses 19.9 8.0 11.0 6.9 6.1 11.8 Employee Severance 1.0 4.7 3.5 0.2 1.0 2.7 Management, Monitoring, Consulting and Advisory Fees 4.7 19.2 -- -- -- -- Other 16.3 34.2 0.2 -- 0.2 -- Adjusted EBITDA $425.2 $452.4 $504.0 $356.8 $340.9 $519.9 Wish-Bone and Garden Protein acquisition adjustments -- 54.7 25.3 6.5 10.1 21.7 Non-Cash Equity-Based Compensation 0.9 7.9 8.8 9.9 6.7 12.0 Covenant Compliance EBITDA per Credit Agreement Definition $426.1 $515.0 $538.1 $373.2 $357.8 $553.5 |
 Boulder Brands –
Covenant Compliance EBITDA
Reconciliation ($ in millions) LTM Boulder Brands 9/30/2015 GAAP Net Income $0.8 Interest Expense 16.7 Income Taxes (1.4) Depreciation & Amortization 21.5 GAAP EBITDA $37.5 Unrealized Gains Resulting from Hedging Activites (0.1) Other Impairment Charges 2.8 Expenses in Connection with an Acquisition or Other Non-Recurring Merger Costs
3.5 Restructuring Charges, Integration Costs and Other Business Optimization Expenses
10.3 Employee Severance 5.8 Other Adjustment Items 0.4 Adjusted EBITDA $60.2 Non-Cash Equity-Based Compensation 9.2 Covenant Compliance EBITDA per Pinnacle Credit Agreement $69.4 Represents non-cash gains resulting from mark-to-market adjustments of obligations under derivative contracts Represents impairment of goodwill related to the Level Life brand Represents expenses related to strategic alternatives incurred by Boulder Primarily represents costs incurred in connection with restructuring actions initiated by Boulder, the relocation of the headquarters office to Colorado and costs to discontinue the Level Life brand. Also includes a $4.7 million gain on the sale of an investment. Represents non-recurring severance costs paid or accrued to terminated employees in connection with restructuring actions initiated by Boulder Represents the non-controlling interest of Boulder 1 2 3 4 5 6 1 2 3 4 5 6 45 |
 Boulder Brands –
Historic EBITDA Reconciliation
Write-up to fair market value of inventories acquired
as a result of the EVOL acquisition
Non-Cash employee stock compensation
Impairment charges related to the goodwill of the Level
Life brand Expenses related to strategic alternatives incurred by Boulder Costs incurred with restructuring actions initiated by Boulder and the relocation of the HQ office to CO Severance costs paid or to be paid to terminated employees as a result of restructuring actions as well as severance costs incurred related to the former CEO 1 2 3 4 5 6 1 2 3 4 5 6 9 7 7 8 Class action litigation settlements related to labeling and marketing of products Costs to discontinue the Level Life brand primarily related to anticipated customer returns BBIG sold a portion of one of its investments and recorded a consolidated gain on the sale 8 9 (1) 46 ($ in millions) 9 Months Ending LTM Boulder Brands 2012 2013 2014 9/30/2014 9/30/2015 9/30/2015 GAAP Net Income (Loss) $4.2 $10.3 ($127.3) ($129.0) ($1.0) $0.8 Interest Expense 15.0 24.5 18.1 13.9 12.5 16.7 Income Taxes 3.7 8.8 (7.6) (9.8) (3.6) (1.4) Depreciation & Amortization 13.5 18.8 22.3 16.8 15.9 21.5 GAAP EBITDA $36.4 $62.4 ($94.5) ($108.2) $23.8 $37.5 Adjustments Related to the Application of Purchase Accounting -- -- 0.9 0.9 -- -- Non-Cash Compensation Charges 11.5 9.0 9.4 7.1 6.9 9.2 Goodwill and Intangible Assets Impairment -- -- 150.5 150.5 2.7 2.7 Acquisition or Other Non-Recurring Merger Expense -- -- -- -- 3.5 3.5 Restructuring Charges, Integration Costs and Business Optimization 8.6 7.4 5.1 4.2 8.5 9.4 Employee Severance -- -- 2.1 1.2 4.9 5.8 Class Action Settlement -- -- 0.3 0.3 0.7 0.7 Level Adjustments -- -- -- -- 2.2 2.2 BBIG Investment Gain -- -- -- -- (4.7) (4.7) Non-Controlling Interest of Boulder Brands, Inc. -- -- 0.2 0.1 0.3 0.4 Adjusted EBITDA $56.5 $78.8 $73.9 $56.0 $48.8 $66.7 |