Attached files
| file | filename |
|---|---|
| 8-K - 8-K - DOVER Corp | a201512158-k.htm |
| EX-99.1 - EXHIBIT 99.1 - DOVER Corp | a20151215exhibit991.htm |

Dover Investor Presentation December 15, 2015 Bob Livingston President & Chief Executive Officer Exhibit 99.2

2 Forward looking statements We want to remind everyone that our comments may contain forward-looking statements that are inherently subject to uncertainties and risks. We caution everyone to be guided in their analysis of Dover by referring to the documents we file from time to time with the SEC, including our Form 10-K for 2014 and our Form 10-Q for the third quarter of 2015, for a list of factors that could cause our results to differ from those anticipated in any such forward-looking statements. We would also direct your attention to our website, www.dovercorporation.com, where considerably more information can be found.

3 Our strategy remains consistent Expanding our businesses in key markets with significant growth potential Capitalizing on our expertise and providing products and solutions globally to customers who value our offerings Innovating to address our customers’ needs and help them win in their markets Maintaining and emphasizing our entrepreneurial culture with intense customer focus 3

4 Strong execution Our business profile is more focused – We have invested in and expanded our businesses within key markets – We have built a very attractive portfolio featuring strong competitive positions and exposure to tailwinds We have accelerated our efforts and processes around innovation, focusing on technologies which create tangible value for our customers – We have increased our investment in new products and commercial excellence Our portfolio has strong margins and returns – Our focus on productivity and continuous improvement, driven by the Dover Excellence program (“DEx”), is broad-based and will unlock further value 4

5 Creating value over the long-term Market Attributes Areas of action Energy Production & Automation Growth of 5% - 9% Strong margin profile International expansion potential Expand international capabilities in the Middle East and Latin America Build infrastructure to serve life of well needs and track installed base Pursue focused M&A opportunities Bearings & Compression Growth of 3% - 5% High competitive advantage from application engineering Invest in sales relationships Look for small adjacent technology targets Invest in and build out local service centers in Asia Pacific Pumps Growth of 3% - 5% Strong distribution network Numerous product adjacencies Leading position in polymer processing Expand sales force globally and adapt product to fit local needs Invest to increase productivity Look for acquisition targets in our next growth vertical…..the hygienic market Note: Growth rates represent a 5-year CAGR off 2015 base year

6 Creating value over the long-term Market Attributes Areas of action Printing & Identification Growth of 4% - 6% International expansion potential in APAC Consolidated marking & coding industry Invest in local sales and service in China and India Drive conversion to digital textile printing through system solution Invest to increase productivity Retail Fueling Growth of 3% - 5% Expansion opportunities in Asia and in CNG/LNG Differentiated station-in- a-box offering Leverage position and expand sales in key de-regulating markets (ex. Mexico, India, Saudi Arabia) Expand regional scale and broaden technology Refrigeration & Food Equipment Growth of 2% - 4% Adjacencies in highly engineered category specialists Strong productivity potential Build out dedicated marketing strategy and sales to target high growth markets Broaden product offerings targeting retail food service Invest to increase productivity Note: Growth rates represent a 5-year CAGR off 2015 base year

7 Aggressively investing to drive product development & innovation MS JP3 Anthony Vacuum Glass Door DAL Horizontal Pump PSG Stainless G Series Pump

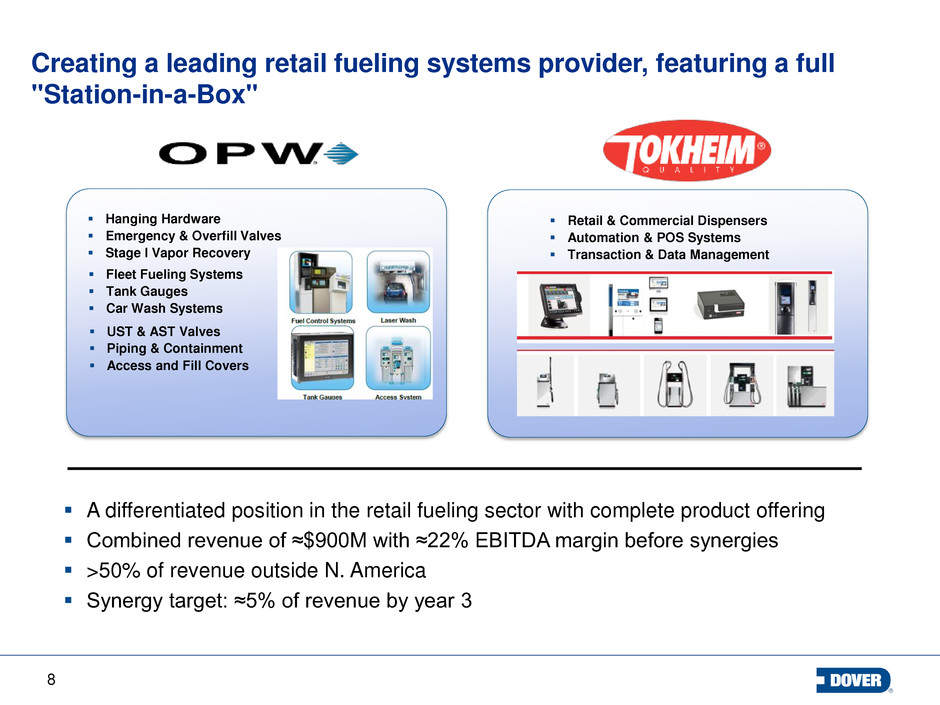
8 Creating a leading retail fueling systems provider, featuring a full "Station-in-a-Box" A differentiated position in the retail fueling sector with complete product offering Combined revenue of ≈$900M with ≈22% EBITDA margin before synergies >50% of revenue outside N. America Synergy target: ≈5% of revenue by year 3 Fleet Fueling Systems Tank Gauges Car Wash Systems UST & AST Valves Piping & Containment Access and Fill Covers Hanging Hardware Emergency & Overfill Valves Stage I Vapor Recovery Retail & Commercial Dispensers Automation & POS Systems Transaction & Data Management

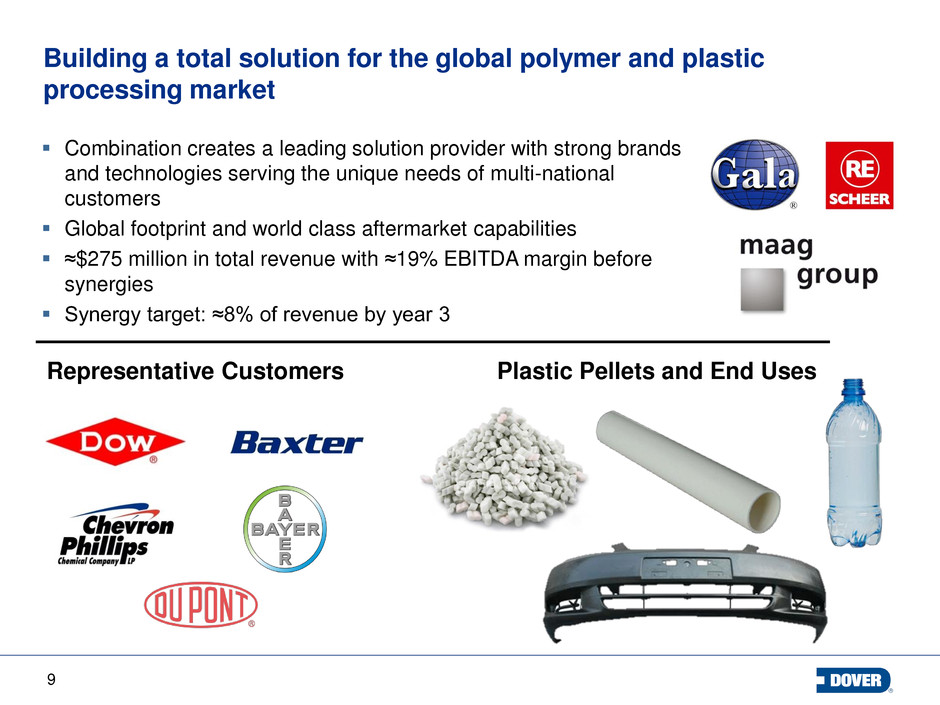
9 Building a total solution for the global polymer and plastic processing market Combination creates a leading solution provider with strong brands and technologies serving the unique needs of multi-national customers Global footprint and world class aftermarket capabilities ≈$275 million in total revenue with ≈19% EBITDA margin before synergies Synergy target: ≈8% of revenue by year 3 Representative Customers Plastic Pellets and End Uses

10 Digital textile printing – A full solution set will drive growth ▪ Full printer portfolio ▪ Consistent print quality ▪ Integrated solution including printer, ink, service & support ▪ Nearly 100 sales & service technicians and access to 400+ distributors ▪ Opportunity to leverage integrated digital solution for other substrates Integrated Solution

11 Q4 update Overall challenging market conditions driving lower than expected performance – Oil & gas related end-markets continue to deteriorate sequentially; impact felt primarily in Energy and Fluids – China markets continue to be sluggish; impact across portfolio Continued focus on ‘self-help’ actions – cost management, restructuring – Anticipate incremental restructuring in Q4(1) Capital allocation – Closed three acquisitions: JK, Gala and Reduction Engineering Scheer – Expect to close Tokheim in early Q1 2016 – Anticipated acquisition impact in Q4 (inc. deal costs, purchase accounting, and performance)(2) – Two dispositions to further focus portfolio (one closed, one in process) with approximately $200M in 2015 annualized revenue(3) 11 (3) Approximately $100M in annualized 2015 revenue in Refrigeration & Food Equipment and $100M in Engineered Systems (1) Estimated to be ($0.04) EPS (2) Estimated to be ($0.03) EPS

12 2016 Preview 2016 will be driven by actions we have already implemented – Meaningful benefits from prior restructuring actions and lower 2016 restructuring costs Lower restructuring costs: $0.15 - $0.17 EPS; carryover benefits: $0.21 - $0.22 EPS – Solid accretion from acquisitions: ≈$0.18 EPS – Carryover benefits from 2015 share repurchase activities: ≈$0.08 EPS – Offsets from compensation and investment: $0.26 - $0.28 cents Market outlook – Continuation of difficult North American oil & gas markets; modest China markets – Generally solid markets for marking & coding, refrigeration & food equipment, retail fueling, plastics & polymers and US industrial markets – Strength in digital printing and bio pharma applications Multiple growth opportunities across each segment will help mitigate tough markets Core margin improvement Our strong financial position enables meaningful capital deployment 12

13 FY 2016F Guidance 2016F adjusted organic growth rate Energy (11%) - (8%) Engineered Systems 1% - 3% (1) Fluids (1%) - 2% Refrigeration & Food Equipment 2% - 4% (1) Total adjusted organic (3%) – 0% (1) Acquisitions ≈7% (2) FX Impact (2%) Total adjusted revenue 2% - 5% (2) Reflects completed acquisitions, and Tokheim (anticipated to close early in Q1 2016) FY 2016F EPS from continuing operations: $3.85 – $4.05 FY 2016F adjusted segment margin target (ex. acq): ≈16.6%(3) (1) Adjusted for the impact of Q4 2015 disposition in Refrigeration & Food Equipment and a pending disposition in Engineered Systems. On an un- adjusted basis, expected 2016 organic growth is (4%) – (2%) in Refrigeration & Food Equipment, (3%) – (1%) in Engineered Systems, and (6%) – (3%) for total Dover (3) At midpoint of EPS range

14 Organic growth drivers in 2016 Energy – Increasing our sales and service capabilities in the Middle East and Columbia – Continuing to invest in customer facing activities to gain share (ex. ESP’s) Engineered Systems — Markem-Imaje launching five new printers — Launching new products to accelerate analog to digital conversion in textile with system solution approach (New low-end JP3 and high-end LaRio) Fluids – Leveraging Tokheim acquisition to offer complete “station-in-a-box” – Launching new gear and screw pump technology Refrigeration & Food Equipment – Providing modular CO2 system for small store format – Launching vacuum glass for retail refrigeration – Expanding heat exchanger applications, such as engine oil cooling 14

15 DEx drives margin enhancement Global supply chain – Target $40+ million in annual savings Capturing the benefits of commodity price weakness – ≈$20M in price reductions in metal and fuels in 2015; more to come Utilizing partnership to improve supplier payment terms, resulting in working capital improvements (ex. $15M alone at OPW) Capturing integration supply chain synergies Continuous improvement (“CI”) and lean mindset embedded in organization – Creating problem solvers and solution providers for customers Shared services and ERP/back office consolidations – Significant investment in shared service infrastructure underway Audit, IT and financial transaction processing to be consolidated over time 15

16 $- $300 $600 $900 $1,200 Acquisitions Capex Dividends Share Repurchase $ in millions 2012 2013 2014 2015E Return to investors Capital allocation Invest in growth; acquisitions and capex ≈ 50% Consistently return cash to shareholders; dividends and repurchases ≈ 50% Investment spending will remain focused and disciplined 16 Growth Capital Deployed 2012 – 2015E We expect to continue our longstanding record of raising the dividend We will continue to invest in our businesses with an increased spend on productivity projects We will continue to build our businesses via acquisitions Share repurchases remain an important component of capital allocation

17 Key take-a-ways Our strategy remains consistent. We have great businesses serving markets that offer ample opportunities for growth We are investing for growth and have above market share expectations of this portfolio. Even in challenging markets we continue to invest even more and expand our capabilities to service our customers and win share gains We are committed to margin enhancement through our set of productivity tools and processes We will remain aggressive to pursue opportunities to expand internationally and into adjacencies We will continue to generate strong free cash flow, while maintaining our consistent approach to capital allocation

18 Appendix

19 FY 2015 guidance update 19 Prior 2015 EPS Guidance – Continuing Ops (GAAP) $3.73 - $3.80 Mid-point of prior EPS guidance ≈$3.76 – Less: Q4 performance: ≈($0.07) – Less: incremental Q4 restructuring and acquisition-related costs(1): ≈($0.07) Revised 2015 EPS Guidance– Continuing Ops (GAAP) ≈$3.62 (1) Reflects approximately ($0.04) EPS of incremental Q4 restructuring actions above prior forecast. Also reflects Q4 deal costs associated with JK, Gala, Reduction Scheer and Tokheim, as well as Q4 operating performance and purchase accounting amortization of JK, Gala and Reduction Scheer estimated to total ($0.03) EPS

20 FY 2016 Guidance – Adjusted revenue by segment 2016F Energy Engineered Systems Fluids Refrigeration & Food Equip Total Organic (11%) - (8%) 1% - 3% (1%) - 2% 2% - 4% (3%) - 0% Acquisitions - ≈ 3% ≈ 30% - ≈ 7% Currency (1%) (2%) (2%) (1%) (2%) Total (12%) - (9%) 2% - 4% 27% - 30% 1% - 3% 2% - 5% Note: Adjusted for the impact of Q4 2015 disposition in Refrigeration & Food Equipment and pending disposition in Engineered Systems. On an un-adjusted basis expected 2016 organic growth is (4%) – (2%) in Refrigeration & Food Equipment, (3%) – (1%) in Engineered Systems, and (6%) – (3%) for total Dover

21 FY 2016F Guidance Revenue – Organic revenue: (3%) - 0% – Completed acquisitions(a): ≈7% – FX impact: (2%) – Total revenue: 2% - 5% Corporate expense: ≈ $120 million Interest expense: ≈ $128 million Full-year tax rate: ≈ 29% Capital expenditures: ≈ 2.3% of revenue FY free cash flow: ≈ 11% of revenue (a) Reflects completed acquisitions, and Tokheim (anticipated to close in early Q1 2016)

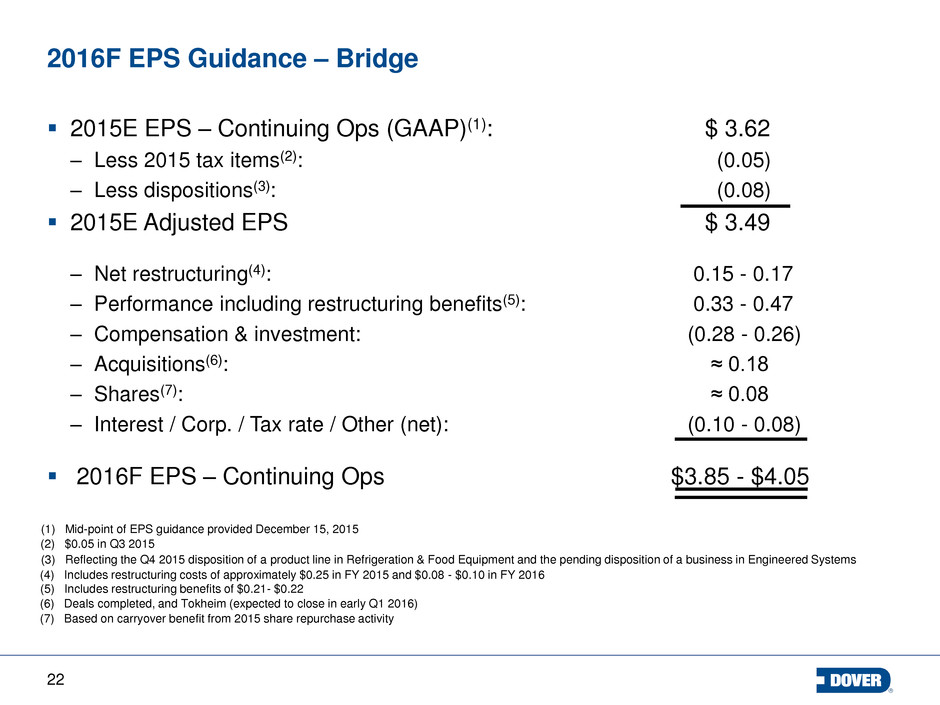
22 2016F EPS Guidance – Bridge 2015E EPS – Continuing Ops (GAAP)(1): $ 3.62 – Less 2015 tax items(2): (0.05) – Less dispositions(3): (0.08) 2015E Adjusted EPS $ 3.49 – Net restructuring(4): 0.15 - 0.17 – Performance including restructuring benefits(5): 0.33 - 0.47 – Compensation & investment: (0.28 - 0.26) – Acquisitions(6): ≈ 0.18 – Shares(7): ≈ 0.08 – Interest / Corp. / Tax rate / Other (net): (0.10 - 0.08) 2016F EPS – Continuing Ops $3.85 - $4.05 (2) $0.05 in Q3 2015 (6) Deals completed, and Tokheim (expected to close in early Q1 2016) (7) Based on carryover benefit from 2015 share repurchase activity (4) Includes restructuring costs of approximately $0.25 in FY 2015 and $0.08 - $0.10 in FY 2016 (5) Includes restructuring benefits of $0.21- $0.22 (1) Mid-point of EPS guidance provided December 15, 2015 (3) Reflecting the Q4 2015 disposition of a product line in Refrigeration & Food Equipment and the pending disposition of a business in Engineered Systems
