Attached files
| file | filename |
|---|---|
| EX-10.1 - EX-10.1 - MAGNUM HUNTER RESOURCES CORP | a15-25036_1ex10d1.htm |
| 8-K - CURRENT REPORT OF MATERIAL EVENTS OR CORPORATE CHANGES - MAGNUM HUNTER RESOURCES CORP | a15-25036_18k.htm |
Exhibit 99.1
|
|
Company Presentation November 2015 0 Private & Confidential SUBJECT TO NDA. |
|
|
The statements and information contained in this presentation that are not statements of historical fact, including any estimates and assumptions contained herein, are "forward looking statements" as defined in Section 27A of the Securities Act of 1933, as amended, referred to as the Securities Act, and Section 21E of the Securities Exchange Act of 1934, as amended, referred to as the Exchange Act. These forward-looking statements include, among others, statements, estimates and assumptions relating to our business and growth strategies, our oil and gas reserve estimates, estimates of oil and natural gas resource potential, our ability to successfully and economically explore for and develop oil and gas resources, our exploration and development prospects, future inventories, projects and programs, expectations relating to availability and costs of drilling rigs and field services, anticipated trends in our business or industry, our future results of operations, our liquidity and ability to finance our exploration and development activities and our midstream activities, market conditions in the oil and gas industry and the impact of environmental and other governmental regulation. In addition, with respect to any pending transactions described herein, forward-looking statements include, but are not limited to, statements regarding the expected timing of the completion of proposed transactions; the ability to complete proposed transactions considering various closing conditions; the benefits of any such transactions and their impact on the Company's business; and any statements of assumptions underlying any of the foregoing. In addition, if and when any proposed transaction is consummated, there will be risks and uncertainties related to the Company's ability to successfully integrate the operations and employees of the Company and the acquired business. Forward-looking statements generally can be identified by the use of forward-looking terminology such as "may," "will," "could," "should," "expect," "intend," "estimate," "anticipate," "believe," "project," "pursue," "plan" or "continue" or the negative thereof or variations thereon or similar terminology. These forward-looking statements are subject to numerous assumptions, risks, and uncertainties. Factors that may cause our actual results, performance, or achievements to be materially different from those anticipated in forwardlooking statements include, among others, the following: adverse economic conditions in the United States and globally; difficult and adverse conditions in the domestic and global capital and credit markets; changes in domestic and global demand for oil and natural gas; volatility in the prices we receive for our oil, natural gas and natural gas liquids; the effects of government regulation, permitting and other legal requirements; future developments with respect to the quality of our properties, including, among other things, the existence of reserves in economic quantities; uncertainties about the estimates of our oil and natural gas reserves; our ability to increase our production and therefore our oil and natural gas income through exploration and development; our ability to successfully apply horizontal drilling techniques; the effects of increased federal and state regulation, including regulation of the environmental aspects, of hydraulic fracturing; the number of well locations to be drilled, the cost to drill and the time frame within which they will be drilled; drilling and operating risks; the availability of equipment, such as drilling rigs and transportation pipelines; changes in our drilling plans and related budgets; regulatory, environmental and land management issues, and demand for gas gathering services, relating to our midstream operations; and the adequacy of our capital resources and liquidity including, but not limited to, access to additional borrowing capacity. These factors are in addition to the risks described in the "Risk Factors" and "Management's Discussion and Analysis of Financial Condition and Results of Operations" sections of the Company's 2014 annual report on Form 10-K, as amended, filed with the Securities and Exchange Commission, which we refer to as the SEC, and subsequently filed quarterly reports on Form 10-Q. Most of these factors are difficult to anticipate and beyond our control. Because forward-looking statements are subject to risks and uncertainties, actual results may differ materially from those expressed or implied by such statements. You are cautioned not to place undue reliance on forward-looking statements contained herein, which speak only as of the date of this document. Other unknown or unpredictable factors may cause actual results to differ materially from those projected by the forward-looking statements. Unless otherwise required by law, we undertake no obligation to publicly update or revise any forward-looking statements, whether as a result of new information, future events or otherwise. We urge readers to review and consider disclosures we make in our reports that discuss factors germane to our business. See in particular our reports on Forms 10-K, 10-Q and 8-K subsequently filed from time to time with the SEC. All forward-looking statements attributable to us are expressly qualified in their entirety by these cautionary statements. The SEC requires oil and natural gas companies, in filings made with the SEC, to disclose proved reserves, which are those quantities of oil and natural gas that by analysis of geoscience and engineering data can be estimated with reasonable certainty to be economically producible from a given date forward, from known reservoirs, and under existing economic conditions, operating methods, and government regulations. Probable reserves are those additional reserves that are less certain to be recovered than proved reserves but which, together with proved reserves, are as likely as not to be recovered. When deterministic methods are used, it is as likely as not that actual remaining quantities recovered will exceed the sum of estimated proved plus probable reserves. When probabilistic methods are used, there should be at least a 50% probability that the actual quantities recovered will equal or exceed the proved plus probable reserves estimates. Probable reserves may be assigned to areas of a reservoir adjacent to proved reserves where data control or interpretations of available data are less certain, even if the interpreted reservoir continuity of structure or productivity does not meet the reasonable certainty criterion. Probable reserves may be assigned to areas that are structurally higher than the proved area if these areas are in communication with the proved reservoir. Probable reserves estimates also include potential incremental quantities associated with a greater percentage recovery of the hydrocarbons in place than assumed for proved reserves. Possible reserves are those additional reserves that are less certain to be recovered than probable reserves. When deterministic methods are used, the total quantities ultimately recovered from a project have a low probability of exceeding proved plus probable plus possible reserves. When probabilistic methods are used, there should be at least a 10% probability that the total quantities ultimately recovered will equal or exceed the proved plus probable plus possible reserves estimates. Possible reserves may be assigned to areas of a reservoir adjacent to probable reserves where data control and interpretations of available data are progressively less certain. Frequently, this will be in areas where geoscience and engineering data are unable to define clearly the area and vertical limits of commercial production from the reservoir by a defined project. Possible reserves also include incremental quantities associated with a greater percentage recovery of the hydrocarbons in place than the recovery quantities assumed for probable reserves. Possible reserves may be assigned where geoscience and engineering data identify directly adjacent portions of a reservoir within the same accumulation that may be separated from proved areas by faults with displacement less than formation thickness or other geological discontinuities and that have not been penetrated by a wellbore, and the Company believes that such adjacent portions are in communication with the known (proved) reservoir. Possible reserves may be assigned to areas that are structurally higher or lower than the proved area if these areas are in communication with the proved reservoir. Where direct observation has defined a highest known oil (“HKO”) elevation and the potential exists for an associated gas cap, proved oil reserves should be assigned in the structurally higher portions of the reservoir above the HKO only if the higher contact can be established with reasonable certainty through reliable technology. Portions of the reservoir that do not meet this reasonable certainty criterion may be assigned as probable and possible oil or gas based on reservoir fluid properties and pressure gradient interpretations. The term “contingent resources” is a broader description of potentially recoverable volumes than probable and possible reserves, as defined by SEC regulations. In this presentation disclosure of “contingent resources” represents a high estimate scenario, rather than a middle or low estimate scenario. Estimates of contingent resources are by their nature more speculative than estimates of proved, probable, or possible reserves and accordingly are subject to substantially greater risk of actually being realized by the Company. We believe our estimates of contingent resources and future drill sites are reasonable, but such estimates have not been reviewed by independent engineers. Estimates of contingent resources may change significantly as development provides additional data, and actual quantities that are ultimately recovered may differ substantially from prior estimates. Forward-Looking Statements 1 |
|
|
Note Regarding Non-GAAP Measures This presentation includes certain historical and forward-looking non-GAAP measures, including Adjusted EBITDAX and PV-10, which are described in greater detail in this presentation. Management believes that these non-GAAP measures, which may be defined differently by other companies, better explain the Company's results of operations in a manner that allows for a more complete understanding of the underlying trends in the Company's business, and are also measures that are important to the Company’s lenders. However, these measures should not be viewed as a substitute for those determined in accordance with GAAP. We have provided reconciliations of those historical non-GAAP measures to the most directly comparable GAAP measures, which are available in the Appendix. A reconciliation of the GAAP measures most comparable to the forwardlooking non-GAAP financial measures has not been included in the Appendix because such measures are not accessible on a forward-looking basis and reconciling information is not available without unreasonable effort. This presentation also includes disclosure of PV-10 in a variety of contexts, including PV-10 calculated as of an interim date and PV-10 of reserves based on NYMEX pricing. With respect to PV-10 calculated as of an interim date, it is not practicable to calculate a comparable GAAP measure for the related interim period because GAAP does not provide for disclosure of the Standardized Measure on an interim basis. Similarly, Standardized Measure is based on proved reserves as of fiscal year end calculated using unweighted arithmetic average first-day-of-the-month prices for the prior 12 months. GAAP does not prescribe any corresponding GAAP measure for PV-10 of reserves based on alternative pricing. For these reasons, it is not practicable for us to reconcile these additional PV-10 measures to a GAAP measure. Forward-Looking Statements (Cont’d) 2 |
|
|
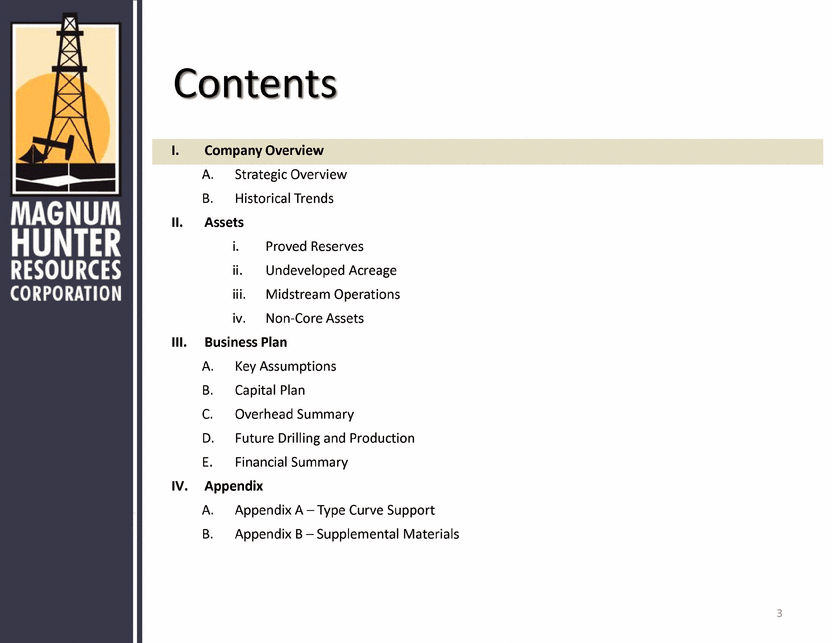
I. Company Overview A. Strategic Overview B. Historical Trends II. Assets i. Proved Reserves ii. Undeveloped Acreage iii. Midstream Operations iv. Non-Core Assets III. Business Plan A. Key Assumptions B. Capital Plan C. Overhead Summary D. Future Drilling and Production E. Financial Summary IV. Appendix A. Appendix A – Type Curve Support B. Appendix B – Supplemental Materials Contents 3 |
|
|
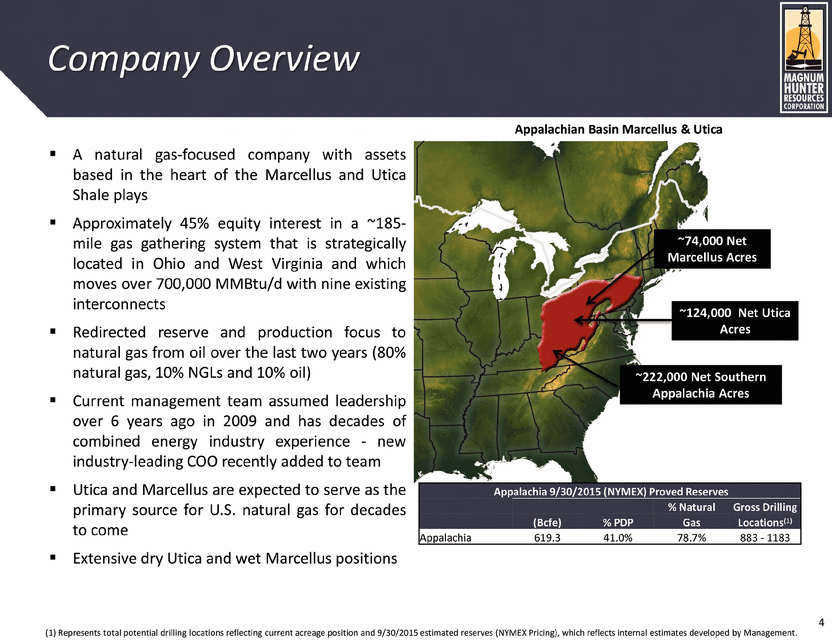
~222,000 Net Southern Appalachia Acres ~74,000 Net Marcellus Acres ~124,000 Net Utica Acres Appalachian Basin Marcellus & Utica Company Overview A natural gas-focused company with assets based in the heart of the Marcellus and Utica Shale plays Approximately 45% equity interest in a ~185- mile gas gathering system that is strategically located in Ohio and West Virginia and which moves over 700,000 MMBtu/d with nine existing interconnects Redirected reserve and production focus to natural gas from oil over the last two years (80% natural gas, 10% NGLs and 10% oil) Current management team assumed leadership over 6 years ago in 2009 and has decades of combined energy industry experience - new industry-leading COO recently added to team Utica and Marcellus are expected to serve as the primary source for U.S. natural gas for decades to come Extensive dry Utica and wet Marcellus positions (1) Represents total potential drilling locations reflecting current acreage position and 9/30/2015 estimated reserves (NYMEX Pricing), which reflects internal estimates developed by Management. Appalachia 9/30/2015 (NYMEX) Proved Reserves % Natural Gross Drilling (Bcfe) % PDP Gas Locations(1) Appalachia 619.3 41.0% 78.7% 883 - 1183 4 |
|
|
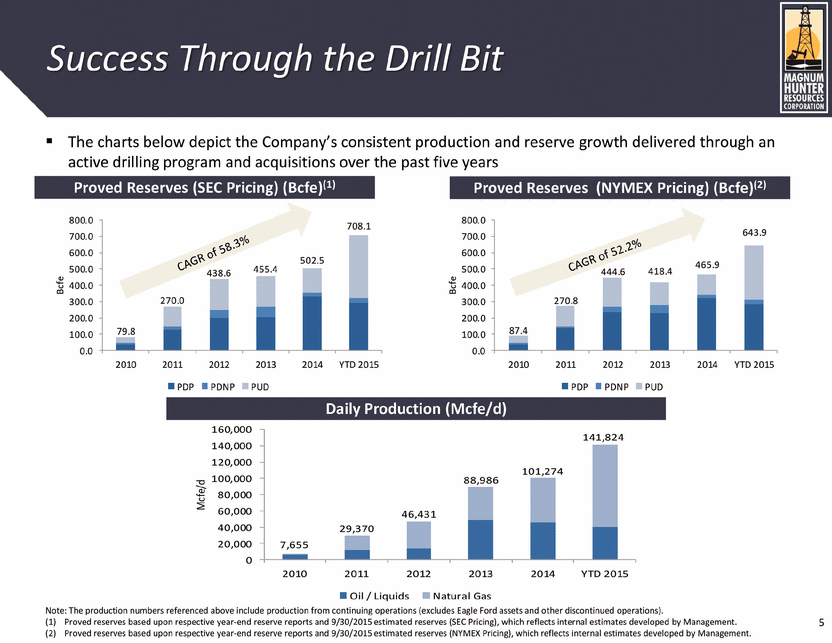
The charts below depict the Company’s consistent production and reserve growth delivered through an active drilling program and acquisitions over the past five years Success Through the Drill Bit Proved Reserves (SEC Pricing) (Bcfe)(1) Proved Reserves (NYMEX Pricing) (Bcfe)(2) Note: The production numbers referenced above include production from continuing operations (excludes Eagle Ford assets and other discontinued operations). (1) Proved reserves based upon respective year-end reserve reports and 9/30/2015 estimated reserves (SEC Pricing), which reflects internal estimates developed by Management. (2) Proved reserves based upon respective year-end reserve reports and 9/30/2015 estimated reserves (NYMEX Pricing), which reflects internal estimates developed by Management. 87.4 270.8 444.6 418.4 465.9 643.9 0.0 100.0 200.0 300.0 400.0 500.0 600.0 700.0 800.0 2010 2011 2012 2013 2014 YTD 2015 Bcfe PDP PDNP PUD 79.8 270.0 438.6 455.4 502.5 708.1 0.0 100.0 200.0 300.0 400.0 500.0 600.0 700.0 800.0 2010 2011 2012 2013 2014 YTD 2015 Bcfe PDP PDNP PUD 7,655 29,370 46,431 88,986 101,274 141,824 0 20,000 40,000 60,000 80,000 100,000 120,000 140,000 160,000 2010 2011 2012 2013 2014 YTD 2015 Mcfe/d Oil / Liquids Natural Gas Daily Production (Mcfe/d) 5 |
|
|
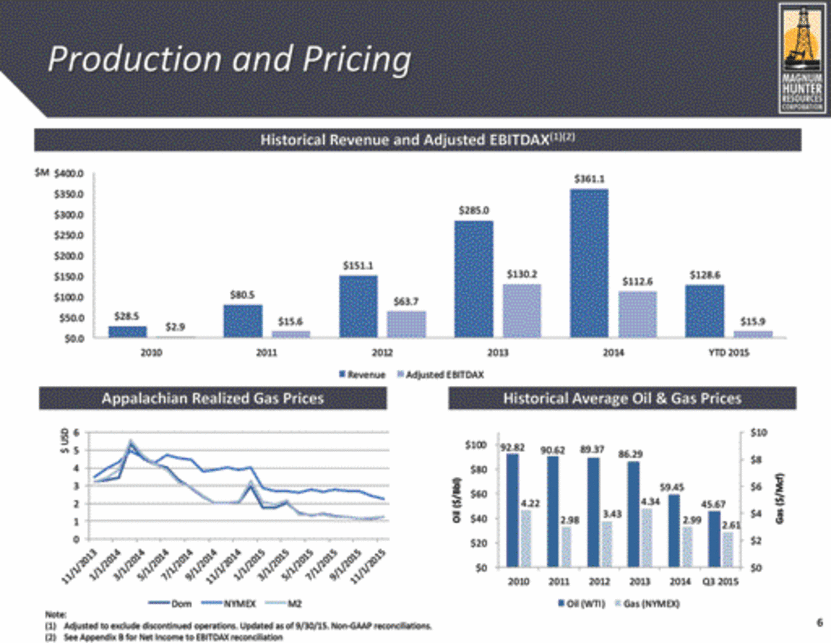
Production and Pricing Historical Average Oil & Gas Prices Historical Revenue and Adjusted EBITDAX(1)(2) Appalachian Realized Gas Prices $28.5 $80.5 $151.1 $285.0 $361.1 $128.6 $2.9 $15.6 $63.7 $130.2 $112.6 $15.9 $0.0 $50.0 $100.0 $150.0 $200.0 $250.0 $300.0 $350.0 $400.0 2010 2011 2012 2013 2014 YTD 2015 $M Revenue Adjusted EBITDAX 6 Note: (1) Adjusted to exclude discontinued operations. Updated as of 9/30/15. Non-GAAP reconciliations. (2) See Appendix B for Net Income to EBITDAX reconciliation 0 1 2 3 4 5 6 $ USD Dom NYMEX M2 92.82 90.62 89.37 86.29 59.45 45.67 4.22 2.98 3.43 4.34 2.99 2.61 $0 $2 $4 $6 $8 $10 $0 $20 $40 $60 $80 $100 2010 2011 2012 2013 2014 Q3 2015 Gas ($/Mcf) Oil ($/Bbl) Oil (WTI) Gas (NYMEX) |
|
|
I. Company Overview A. Strategic Overview B. Historical Trends II. Assets A. Proved Reserves B. Undeveloped Acreage C. Midstream Operations D. Non-Core Assets III. Business Plan A. Key Assumptions B. Capital Plan C. Overhead Summary D. Future Drilling and Production E. Financial Summary IV. Appendix A. Appendix A – Type Curve Support B. Appendix B – Supplemental Materials Contents 7 |
|
|
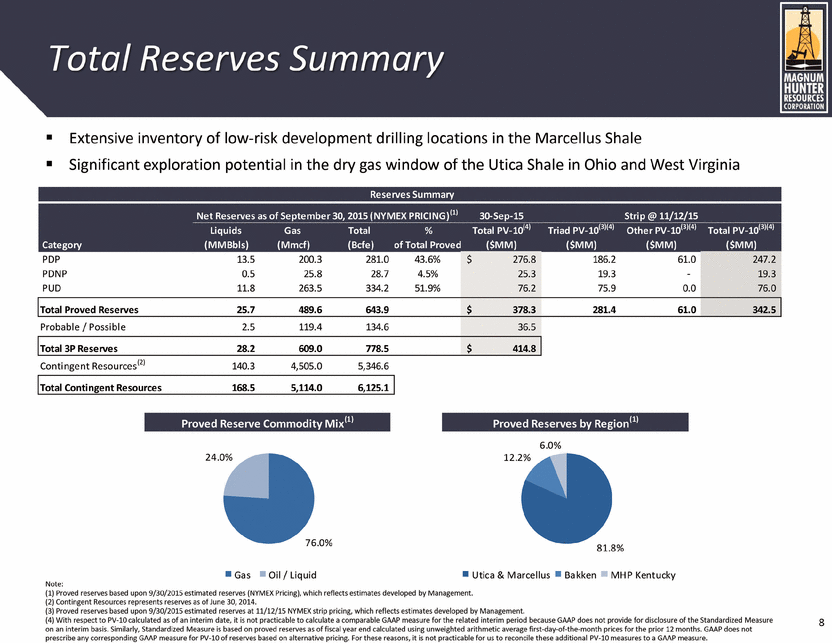
Note: (1) Proved reserves based upon 9/30/2015 estimated reserves (NYMEX Pricing), which reflects estimates developed by Management. (2) Contingent Resources represents reserves as of June 30, 2014. (3) Proved reserves based upon 9/30/2015 estimated reserves at 11/12/15 NYMEX strip pricing, which reflects estimates developed by Management. (4) With respect to PV-10 calculated as of an interim date, it is not practicable to calculate a comparable GAAP measure for the related interim period because GAAP does not provide for disclosure of the Standardized Measure on an interim basis. Similarly, Standardized Measure is based on proved reserves as of fiscal year end calculated using unweighted arithmetic average first-day-of-the-month prices for the prior 12 months. GAAP does not prescribe any corresponding GAAP measure for PV-10 of reserves based on alternative pricing. For these reasons, it is not practicable for us to reconcile these additional PV-10 measures to a GAAP measure. Total Reserves Summary Extensive inventory of low-risk development drilling locations in the Marcellus Shale Significant exploration potential in the dry gas window of the Utica Shale in Ohio and West Virginia 8 Proved Reserve Commodity Mix(1) Proved Reserves by Region(1) 76.0% 24.0% Gas Oil / Liquid 81.8% 12.2% 6.0% Utica & Marcellus Bakken MHP Kentucky Reserves Summary Net Reserves as of September 30, 2015 (NYMEX PRICING)(1) 30-Sep-15 Strip @ 11/12/15 Liquids Gas Total % Total PV-10(4) Triad PV-10(3)(4) Other PV-10(3)(4) Total PV-10(3)(4) Category (MMBbls) (Mmcf) (Bcfe) of Total Proved ($MM) ($MM) ($MM) ($MM) PDP 13.5 200.3 281.0 43.6% 276.8 $ 186.2 61.0 247.2 PDNP 0.5 25.8 28.7 4.5% 25.3 19.3 - 19.3 PUD 11.8 263.5 334.2 51.9% 76.2 75.9 0.0 76.0 Total Proved Reserves 25.7 489.6 643.9 378.3 $ 281.4 61.0 342.5 Probable / Possible 2.5 119.4 134.6 36.5 Total 3P Reserves 28.2 609.0 778.5 414.8 $ Contingent Resources(2) 140.3 4,505.0 5,346.6 Total Contingent Resources 168.5 5,114.0 6,125.1 |
|
|
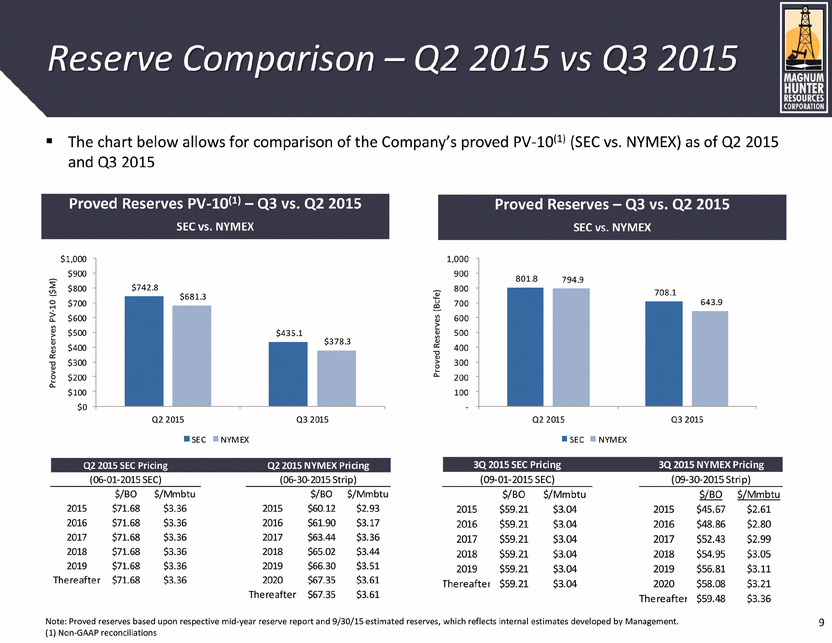
The chart below allows for comparison of the Company’s proved PV-10(1) (SEC vs. NYMEX) as of Q2 2015 and Q3 2015 Reserve Comparison – Q2 2015 vs Q3 2015 Proved Reserves PV-10(1) – Q3 vs. Q2 2015 SEC vs. NYMEX Proved Reserves – Q3 vs. Q2 2015 SEC vs. NYMEX Note: Proved reserves based upon respective mid-year reserve report and 9/30/15 estimated reserves, which reflects internal estimates developed by Management. (1) Non-GAAP reconciliations 9 $742.8 $435.1 $681.3 $378.3 $0 $100 $200 $300 $400 $500 $600 $700 $800 $900 $1,000 Q2 2015 Q3 2015 Proved Reserves PV-10 ($M) SEC NYMEX 801.8 708.1 794.9 643.9 - 100 200 300 400 500 600 700 800 900 1,000 Q2 2015 Q3 2015 Proved Reserves (Bcfe) SEC NYMEX Q2 2015 SEC Pricing Q2 2015 NYMEX Pricing (06-01-2015 SEC) (06-30-2015 Strip) $/BO $/Mmbtu $/BO $/Mmbtu 2015 $71.68 $3.36 2015 $60.12 $2.93 2016 $71.68 $3.36 2016 $61.90 $3.17 2017 $71.68 $3.36 2017 $63.44 $3.36 2018 $71.68 $3.36 2018 $65.02 $3.44 2019 $71.68 $3.36 2019 $66.30 $3.51 Thereafter $71.68 $3.36 2020 $67.35 $3.61 Thereafter $67.35 $3.61 3Q 2015 SEC Pricing 3Q 2015 NYMEX Pricing (09-01-2015 SEC) (09-30-2015 Strip) $/BO $/Mmbtu $/BO $/Mmbtu 2015 $59.21 $3.04 2015 $45.67 $2.61 2016 $59.21 $3.04 2016 $48.86 $2.80 2017 $59.21 $3.04 2017 $52.43 $2.99 2018 $59.21 $3.04 2018 $54.95 $3.05 2019 $59.21 $3.04 2019 $56.81 $3.11 Thereafter $59.21 $3.04 2020 $58.08 $3.21 Thereafter $59.48 $3.36 |
|
|
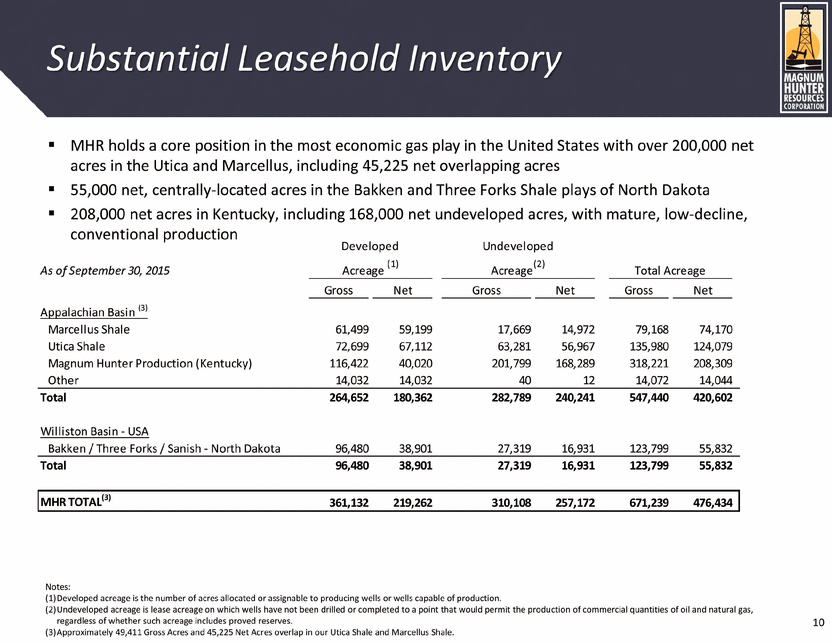
MHR holds a core position in the most economic gas play in the United States with over 200,000 net acres in the Utica and Marcellus, including 45,225 net overlapping acres 55,000 net, centrally-located acres in the Bakken and Three Forks Shale plays of North Dakota 208,000 net acres in Kentucky, including 168,000 net undeveloped acres, with mature, low-decline, conventional production Notes: (1)Developed acreage is the number of acres allocated or assignable to producing wells or wells capable of production. (2)Undeveloped acreage is lease acreage on which wells have not been drilled or completed to a point that would permit the production of commercial quantities of oil and natural gas, regardless of whether such acreage includes proved reserves. (3)Approximately 49,411 Gross Acres and 45,225 Net Acres overlap in our Utica Shale and Marcellus Shale. Substantial Leasehold Inventory As of September 30, 2015 Developed Acreage (1) Undeveloped Acreage(2) Total Acreage Gross Net Gross Net Gross Net Appalachian Basin (3) Marcellus Shale 61,499 59,199 17,669 14,972 79,168 74,170 Utica Shale 72,699 67,112 63,281 56,967 135,980 124,079 Magnum Hunter Production (Kentucky) 116,422 40,020 201,799 168,289 318,221 208,309 Other 14,032 14,032 40 12 14,072 14,044 Total 264,652 180,362 282,789 240,241 547,440 420,602 Williston Basin - USA Bakken / Three Forks / Sanish - North Dakota 96,480 38,901 27,319 16,931 123,799 55,832 Total 96,480 38,901 27,319 16,931 123,799 55,832 MHR TOTAL(3) 361,132 219,262 310,108 257,172 671,239 476,434 10 |
|
|
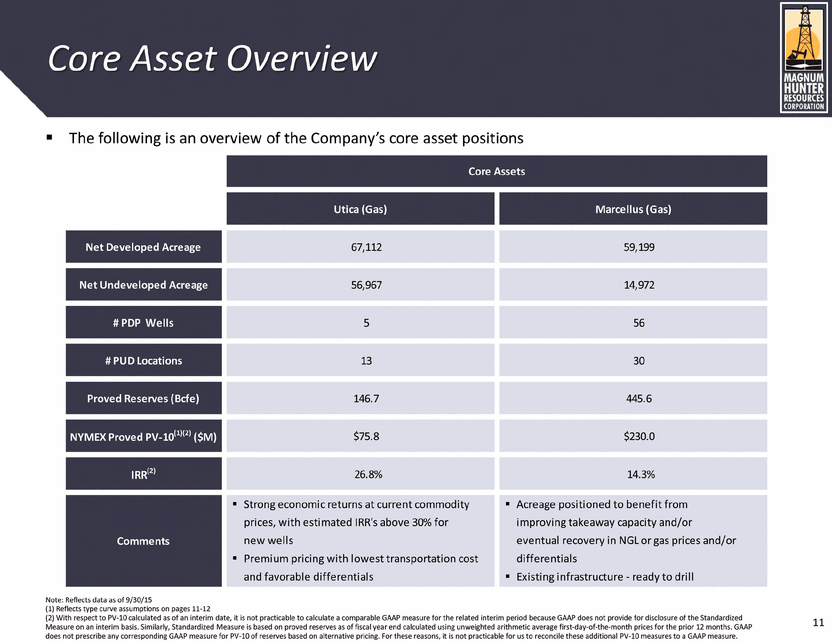
Core Asset Overview The following is an overview of the Company’s core asset positions Note: Reflects data as of 9/30/15 (1) Reflects type curve assumptions on pages 11-12 (2) With respect to PV-10 calculated as of an interim date, it is not practicable to calculate a comparable GAAP measure for the related interim period because GAAP does not provide for disclosure of the Standardized Measure on an interim basis. Similarly, Standardized Measure is based on proved reserves as of fiscal year end calculated using unweighted arithmetic average first-day-of-the-month prices for the prior 12 months. GAAP does not prescribe any corresponding GAAP measure for PV-10 of reserves based on alternative pricing. For these reasons, it is not practicable for us to reconcile these additional PV-10 measures to a GAAP measure. 11 Core Assets Utica (Gas) Marcellus (Gas) Net Developed Acreage 67,112 59,199 Net Undeveloped Acreage 56,967 14,972 # PDP Wells 5 56 # PUD Locations 13 30 Proved Reserves (Bcfe) 146.7 445.6 NYMEX Proved PV-10(1)(2) ($M) $75.8 $230.0 IRR(2) 26.8% 14.3% Strong economic returns at current commodity Acreage positioned to benefit from prices, with estimated IRR's above 30% for improving takeaway capacity and/or Comments new wells eventual recovery in NGL or gas prices and/or Premium pricing with lowest transportation cost differentials and favorable differentials Existing infrastructure - ready to drill |
|
|
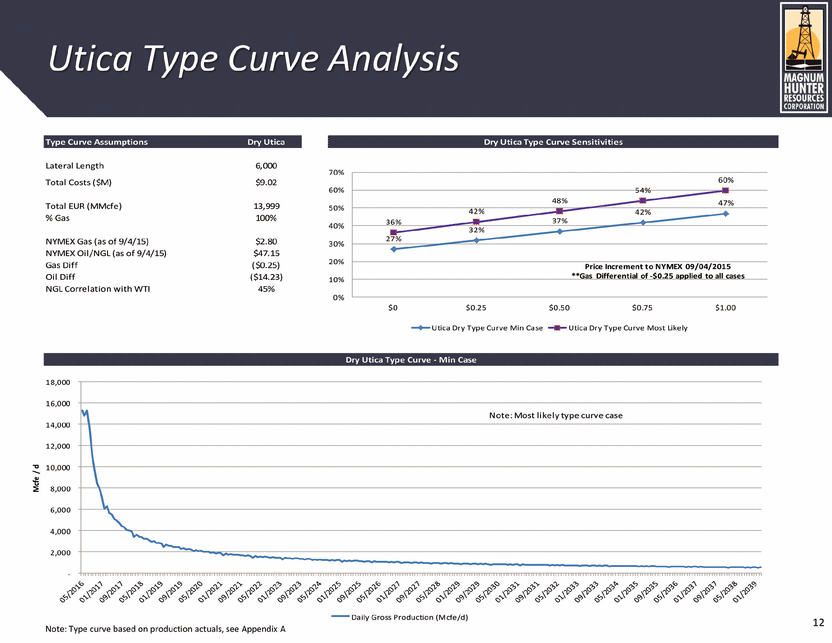
Utica Type Curve Analysis Note: Type curve based on production actuals, see Appendix A Type Curve Assumptions Dry Utica Dry Utica Type Curve Sensitivities Lateral Length 6,000 Total Costs ($M) $9.02 Total EUR (MMcfe) 13,999 % Gas 100% NYMEX Gas (as of 9/4/15) $2.80 NYMEX Oil/NGL (as of 9/4/15) $47.15 Gas Diff ($0.25) Oil Diff ($14.23) NGL Correlation with WTI 45% Dry Utica Type Curve - Min Case - 2,000 4,000 6,000 8,000 10,000 12,000 14,000 16,000 18,000 Mcfe / d Daily Gross Production (Mcfe/d) 27% 32% 37% 42% 47% 36% 42% 48% 54% 60% 0% 10% 20% 30% 40% 50% 60% 70% $0 $0.25 $0.50 $0.75 $1.00 Price Increment to NYMEX 09/04/2015 **Gas Differential of -$0.25 applied to all cases Utica Dry Type Curve Min Case Utica Dry Type Curve Most Likely Note: Most likely type curve case 12 |
|
|
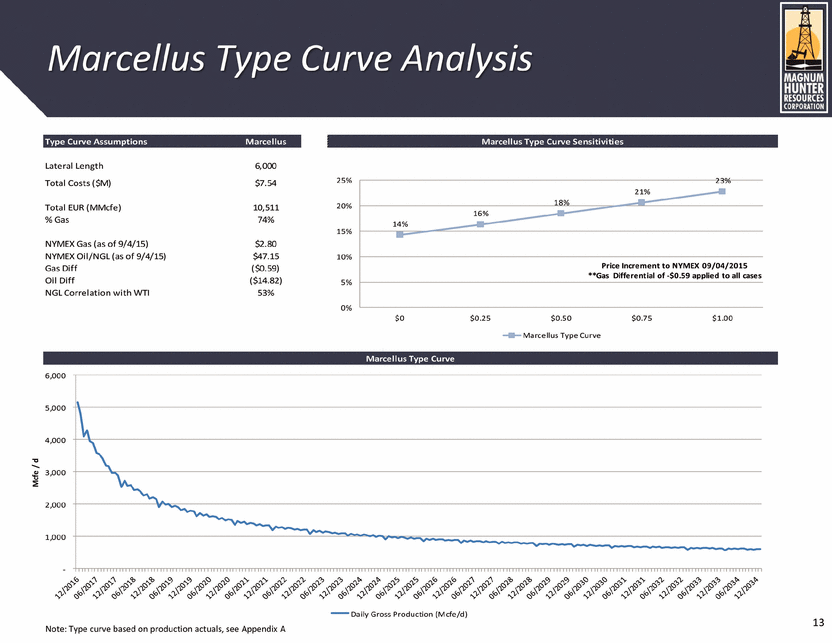
Marcellus Type Curve Analysis Note: Type curve based on production actuals, see Appendix A Type Curve Assumptions Marcellus Marcellus Type Curve Sensitivities Lateral Length 6,000 Total Costs ($M) $7.54 Total EUR (MMcfe) 10,511 % Gas 74% NYMEX Gas (as of 9/4/15) $2.80 NYMEX Oil/NGL (as of 9/4/15) $47.15 Gas Diff ($0.59) Oil Diff ($14.82) NGL Correlation with WTI 53% Marcellus Type Curve - 1,000 2,000 3,000 4,000 5,000 6,000 Mcfe / d Daily Gross Production (Mcfe/d) 14% 16% 18% 21% 23% 0% 5% 10% 15% 20% 25% $0 $0.25 $0.50 $0.75 $1.00 Price Increment to NYMEX 09/04/2015 **Gas Differential of -$0.59 applied to all cases Marcellus Type Curve 13 |
|
|
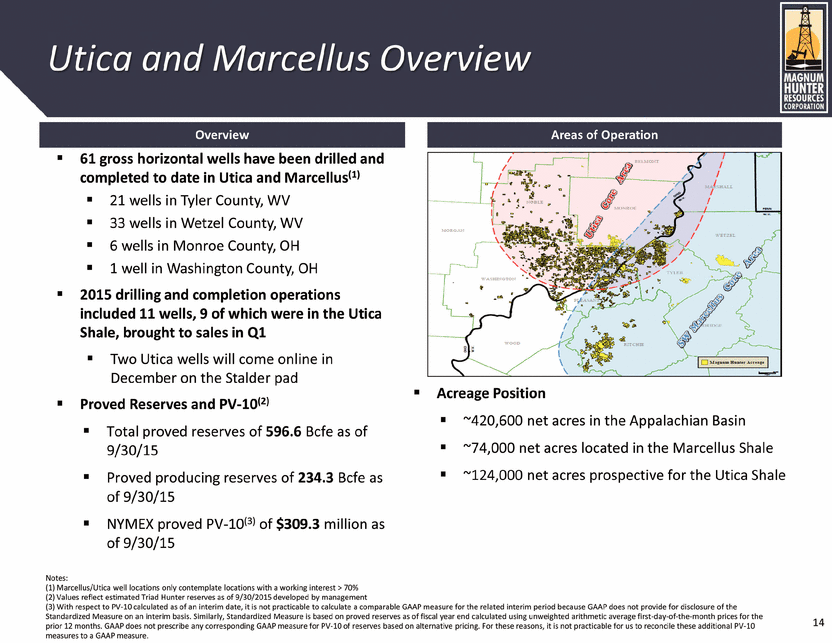
Utica and Marcellus Overview 61 gross horizontal wells have been drilled and completed to date in Utica and Marcellus(1) 21 wells in Tyler County, WV 33 wells in Wetzel County, WV 6 wells in Monroe County, OH 1 well in Washington County, OH 2015 drilling and completion operations included 11 wells, 9 of which were in the Utica Shale, brought to sales in Q1 Two Utica wells will come online in December on the Stalder pad Proved Reserves and PV-10(2) Total proved reserves of 596.6 Bcfe as of 9/30/15 Proved producing reserves of 234.3 Bcfe as of 9/30/15 NYMEX proved PV-10(3) of $309.3 million as of 9/30/15 Overview Areas of Operation Acreage Position ~420,600 net acres in the Appalachian Basin ~74,000 net acres located in the Marcellus Shale ~124,000 net acres prospective for the Utica Shale Notes: (1) Marcellus/Utica well locations only contemplate locations with a working interest > 70% (2) Values reflect estimated Triad Hunter reserves as of 9/30/2015 developed by management (3) With respect to PV-10 calculated as of an interim date, it is not practicable to calculate a comparable GAAP measure for the related interim period because GAAP does not provide for disclosure of the Standardized Measure on an interim basis. Similarly, Standardized Measure is based on proved reserves as of fiscal year end calculated using unweighted arithmetic average first-day-of-the-month prices for the prior 12 months. GAAP does not prescribe any corresponding GAAP measure for PV-10 of reserves based on alternative pricing. For these reasons, it is not practicable for us to reconcile these additional PV-10 measures to a GAAP measure. 14 |
|
|
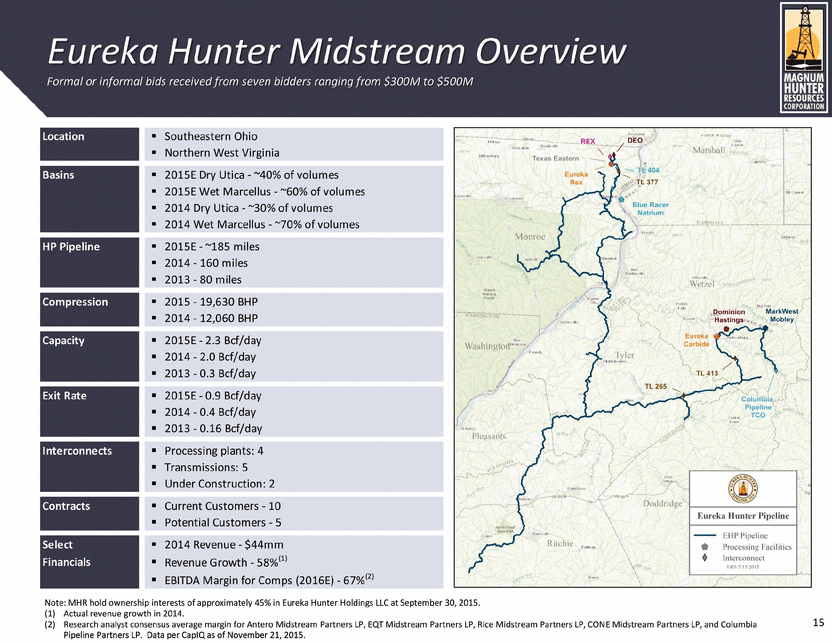
Eureka Hunter Midstream Overview Formal or informal bids received from seven bidders ranging from $300M to $500M 15 Note: MHR hold ownership interests of approximately 45% in Eureka Hunter Holdings LLC at September 30, 2015. (1) Actual revenue growth in 2014. (2) Research analyst consensus average margin for Antero Midstream Partners LP, EQT Midstream Partners LP, Rice Midstream Partners LP, CONE Midstream Partners LP, and Columbia Pipeline Partners LP. Data per CapIQ as of November 21, 2015. Location Southeastern Ohio Northern West Virginia Basins 2015E Dry Utica - ~40% of volumes 2015E Wet Marcellus - ~60% of volumes 2014 Dry Utica - ~30% of volumes 2014 Wet Marcellus - ~70% of volumes HP Pipeline 2015E - ~185 miles 2014 - 160 miles 2013 - 80 miles Compression 2015 - 19,630 BHP 2014 - 12,060 BHP Capacity 2015E - 2.3 Bcf/day 2014 - 2.0 Bcf/day 2013 - 0.3 Bcf/day Exit Rate 2015E - 0.9 Bcf/day 2014 - 0.4 Bcf/day 2013 - 0.16 Bcf/day Interconnects Processing plants: 4 Transmissions: 5 Under Construction: 2 Contracts Current Customers - 10 Potential Customers - 5 Select 2014 Revenue - $44mm Financials Revenue Growth - 58%(1) EBITDA Margin for Comps (2016E) - 67%(2) |
|
|
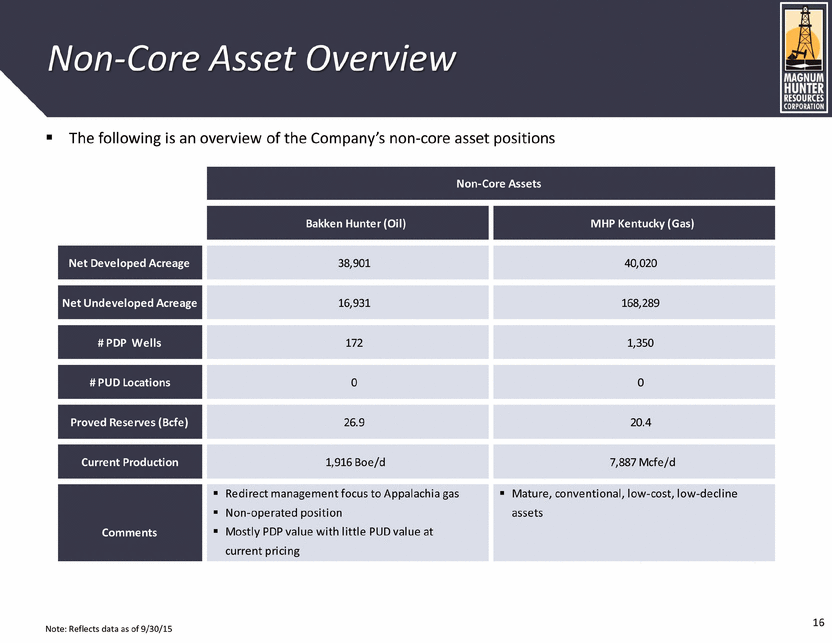
Non-Core Asset Overview The following is an overview of the Company’s non-core asset positions Note: Reflects data as of 9/30/15 Non-Core Assets Bakken Hunter (Oil) MHP Kentucky (Gas) Net Developed Acreage 38,901 40,020 Net Undeveloped Acreage 16,931 168,289 # PDP Wells 172 1,350 # PUD Locations 0 0 Proved Reserves (Bcfe) 26.9 20.4 Current Production 1,916 Boe/d 7,887 Mcfe/d Redirect management focus to Appalachia gas Mature, conventional, low-cost, low-decline Non-operated position assets Comments Mostly PDP value with little PUD value at current pricing 16 |
|
|
I. Company Overview A. Strategic Overview B. Historical Trends II. Assets i. Proved Reserves ii. Undeveloped Acreage iii. Midstream Operations iv. Non-Core Assets III. Business Plan A. Key Assumptions B. Capital Plan C. Overhead Summary D. Future Drilling and Production E. Financial Summary IV. Appendix A. Appendix A – Type Curve Support B. Appendix B – Supplemental Materials Contents 17 |
|
|
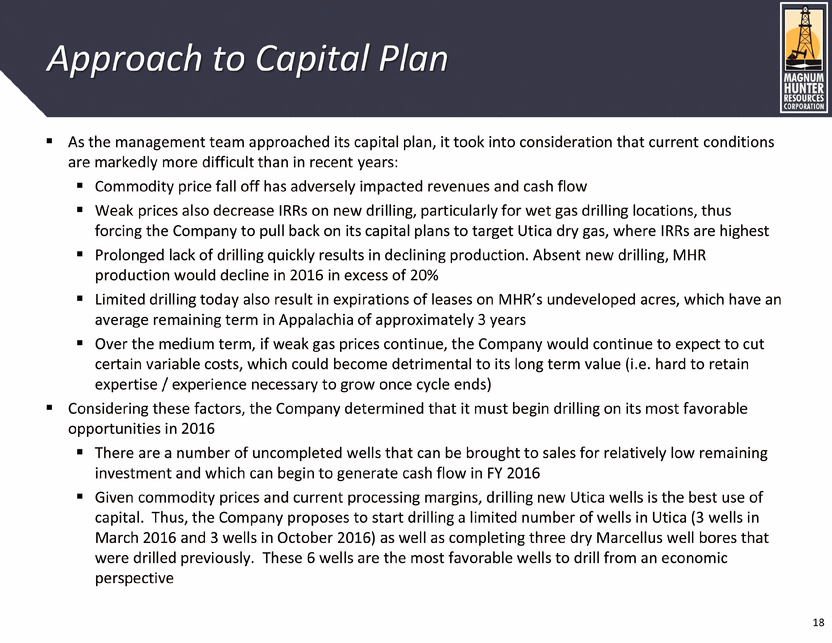
As the management team approached its capital plan, it took into consideration that current conditions are markedly more difficult than in recent years: Commodity price fall off has adversely impacted revenues and cash flow Weak prices also decrease IRRs on new drilling, particularly for wet gas drilling locations, thus forcing the Company to pull back on its capital plans to target Utica dry gas, where IRRs are highest Prolonged lack of drilling quickly results in declining production. Absent new drilling, MHR production would decline in 2016 in excess of 20% Limited drilling today also result in expirations of leases on MHR’s undeveloped acres, which have an average remaining term in Appalachia of approximately 3 years Over the medium term, if weak gas prices continue, the Company would continue to expect to cut certain variable costs, which could become detrimental to its long term value (i.e. hard to retain expertise / experience necessary to grow once cycle ends) Considering these factors, the Company determined that it must begin drilling on its most favorable opportunities in 2016 There are a number of uncompleted wells that can be brought to sales for relatively low remaining investment and which can begin to generate cash flow in FY 2016 Given commodity prices and current processing margins, drilling new Utica wells is the best use of capital. Thus, the Company proposes to start drilling a limited number of wells in Utica (3 wells in March 2016 and 3 wells in October 2016) as well as completing three dry Marcellus well bores that were drilled previously. These 6 wells are the most favorable wells to drill from an economic perspective Approach to Capital Plan 18 |
|
|
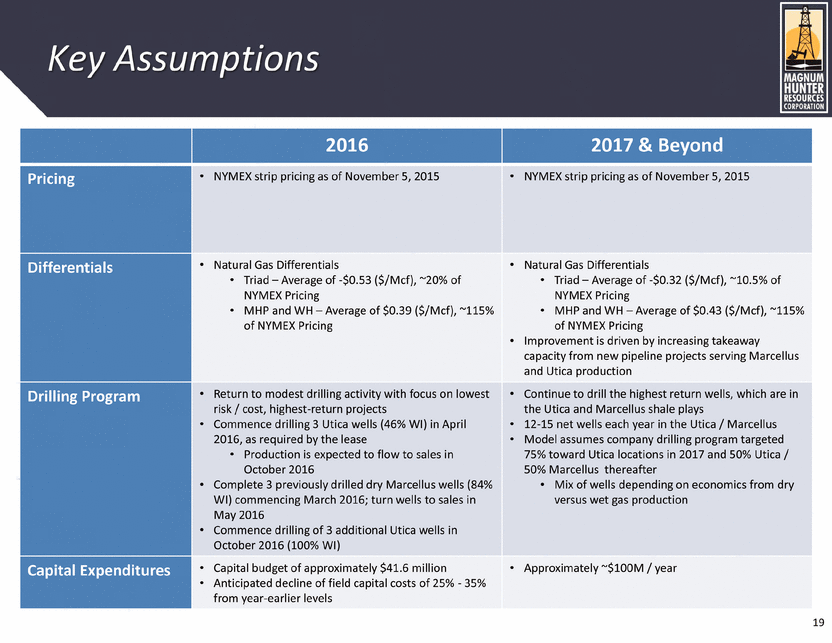
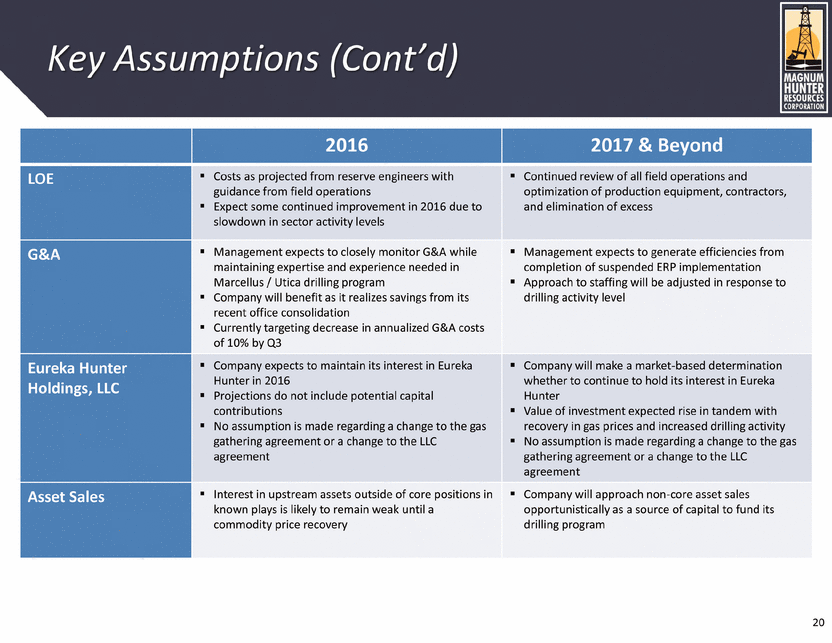
Key Assumptions 2016 2017 & Beyond Pricing • NYMEX strip pricing as of November 5, 2015 • NYMEX strip pricing as of November 5, 2015 Differentials • Natural Gas Differentials • Triad – Average of -$0.53 ($/Mcf), ~20% of NYMEX Pricing • MHP and WH – Average of $0.39 ($/Mcf), ~115% of NYMEX Pricing • Natural Gas Differentials • Triad – Average of -$0.32 ($/Mcf), ~10.5% of NYMEX Pricing • MHP and WH – Average of $0.43 ($/Mcf), ~115% of NYMEX Pricing • Improvement is driven by increasing takeaway capacity from new pipeline projects serving Marcellus and Utica production Drilling Program • Return to modest drilling activity with focus on lowest risk / cost, highest-return projects • Commence drilling 3 Utica wells (46% WI) in April 2016, as required by the lease • Production is expected to flow to sales in October 2016 • Complete 3 previously drilled dry Marcellus wells (84% WI) commencing March 2016; turn wells to sales in May 2016 • Commence drilling of 3 additional Utica wells in October 2016 (100% WI) • Continue to drill the highest return wells, which are in the Utica and Marcellus shale plays • 12-15 net wells each year in the Utica / Marcellus • Model assumes company drilling program targeted 75% toward Utica locations in 2017 and 50% Utica / 50% Marcellus thereafter • Mix of wells depending on economics from dry versus wet gas production Capital Expenditures • Capital budget of approximately $41.6 million • Anticipated decline of field capital costs of 25% - 35% from year-earlier levels • Approximately ~$100M / year 19 |
|
|
Key Assumptions (Cont’d) 2016 2017 & Beyond LOE Costs as projected from reserve engineers with guidance from field operations Expect some continued improvement in 2016 due to slowdown in sector activity levels Continued review of all field operations and optimization of production equipment, contractors, and elimination of excess G&A Management expects to closely monitor G&A while maintaining expertise and experience needed in Marcellus / Utica drilling program Company will benefit as it realizes savings from its recent office consolidation Currently targeting decrease in annualized G&A costs of 10% by Q3 Management expects to generate efficiencies from completion of suspended ERP implementation Approach to staffing will be adjusted in response to drilling activity level Eureka Hunter Holdings, LLC Company expects to maintain its interest in Eureka Hunter in 2016 Projections do not include potential capital contributions No assumption is made regarding a change to the gas gathering agreement or a change to the LLC agreement Company will make a market-based determination whether to continue to hold its interest in Eureka Hunter Value of investment expected rise in tandem with recovery in gas prices and increased drilling activity No assumption is made regarding a change to the gas gathering agreement or a change to the LLC agreement Asset Sales Interest in upstream assets outside of core positions in known plays is likely to remain weak until a commodity price recovery Company will approach non-core asset sales opportunistically as a source of capital to fund its drilling program 20 |
|
|
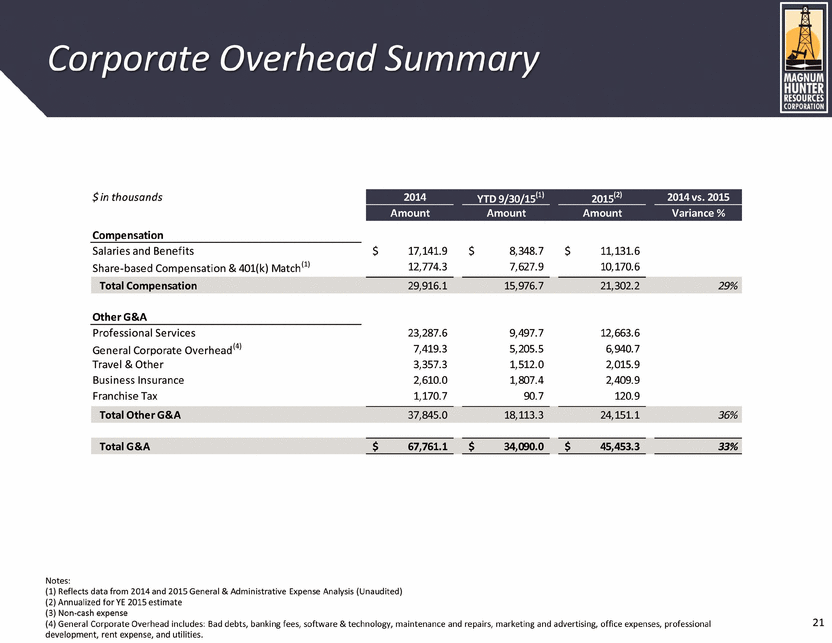
Corporate Overhead Summary Notes: (1) Reflects data from 2014 and 2015 General & Administrative Expense Analysis (Unaudited) (2) Annualized for YE 2015 estimate (3) Non-cash expense (4) General Corporate Overhead includes: Bad debts, banking fees, software & technology, maintenance and repairs, marketing and advertising, office expenses, professional development, rent expense, and utilities. 21 $ in thousands 2014 YTD 9/30/15(1) 2015(2) 2014 vs. 2015 Amount Amount Amount Variance % Compensation Salaries and Benefits 17,141.9 $ 8,348.7 $ 11,131.6 $ Share-based Compensation & 401(k) Match(1) 12,774.3 7,627.9 10,170.6 Total Compensation 29,916.1 15,976.7 21,302.2 29% Other G&A Professional Services 23,287.6 9,497.7 12,663.6 General Corporate Overhead(4) 7,419.3 5,205.5 6,940.7 Travel & Other 3,357.3 1,512.0 2,015.9 Business Insurance 2,610.0 1,807.4 2,409.9 Franchise Tax 1,170.7 90.7 120.9 Total Other G&A 37,845.0 18,113.3 24,151.1 36% Total G&A 67,761.1 $ 34,090.0 $ 45,453.3 $ 33% |
|
|
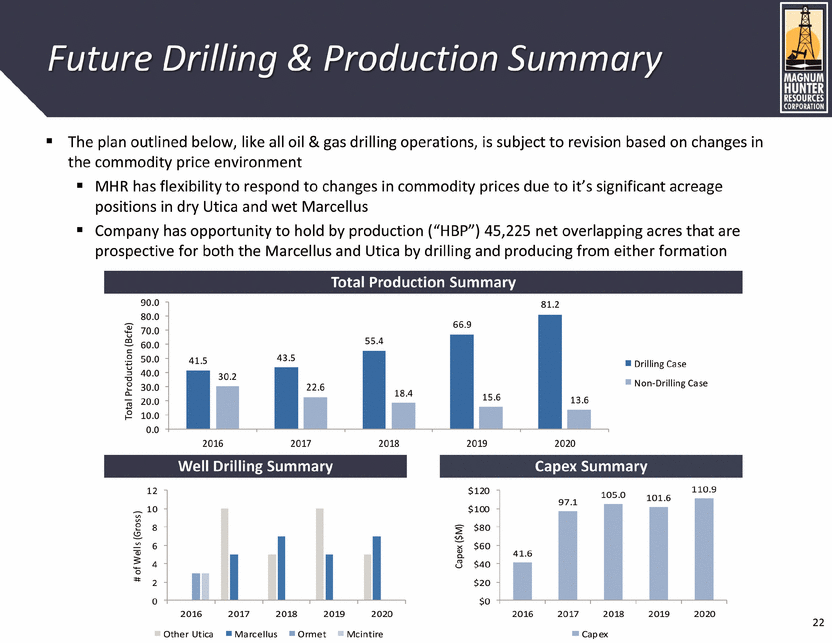
The plan outlined below, like all oil & gas drilling operations, is subject to revision based on changes in the commodity price environment MHR has flexibility to respond to changes in commodity prices due to it’s significant acreage positions in dry Utica and wet Marcellus Company has opportunity to hold by production (“HBP”) 45,225 net overlapping acres that are prospective for both the Marcellus and Utica by drilling and producing from either formation Future Drilling & Production Summary Capex Summary Well Drilling Summary 41.5 43.5 55.4 66.9 81.2 30.2 22.6 18.4 15.6 13.6 0.0 10.0 20.0 30.0 40.0 50.0 60.0 70.0 80.0 90.0 2016 2017 2018 2019 2020 Total Production (Bcfe) Drilling Case Non-Drilling Case Total Production Summary 0 2 4 6 8 10 12 2016 2017 2018 2019 2020 # of Wells (Gross) Other Utica Marcellus Ormet Mcintire 41.6 97.1 105.0 101.6 110.9 $0 $20 $40 $60 $80 $100 $120 2016 2017 2018 2019 2020 Capex ($M) Capex 22 |
|
|
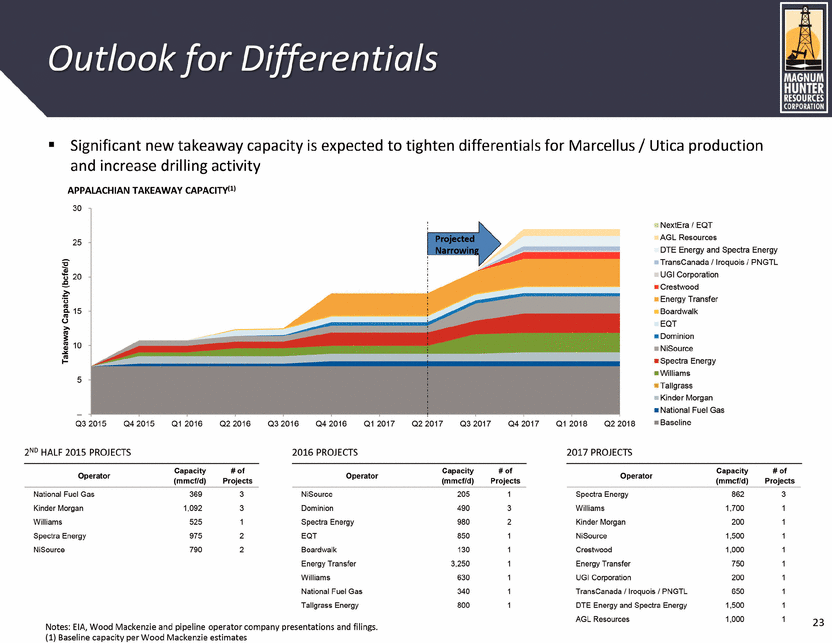
Significant new takeaway capacity is expected to tighten differentials for Marcellus / Utica production and increase drilling activity Outlook for Differentials – 5 10 15 20 25 30 Q3 2015 Q4 2015 Q1 2016 Q2 2016 Q3 2016 Q4 2016 Q1 2017 Q2 2017 Q3 2017 Q4 2017 Q1 2018 Q2 2018 Takeaway Capacity (bcfe/d) NextEra / EQT AGL Resources DTE Energy and Spectra Energy TransCanada / Iroquois / PNGTL UGI Corporation Crestwood Energy Transfer Boardwalk EQT Dominion NiSource Spectra Energy Williams Tallgrass Kinder Morgan National Fuel Gas Baseline 2ND HALF 2015 PROJECTS 2016 PROJECTS 2017 PROJECTS Operator Capacity (mmcf/d) # of Projects National Fuel Gas 369 3 Kinder Morgan 1,092 3 Williams 525 1 Spectra Energy 975 2 NiSource 790 2 Operator Capacity (mmcf/d) # of Projects NiSource 205 1 Dominion 490 3 Spectra Energy 980 2 EQT 850 1 Boardwalk 130 1 Energy Transfer 3,250 1 Williams 630 1 National Fuel Gas 340 1 Tallgrass Energy 800 1 Operator Capacity (mmcf/d) # of Projects Spectra Energy 862 3 Williams 1,700 1 Kinder Morgan 200 1 NiSource 1,500 1 Crestwood 1,000 1 Energy Transfer 750 1 UGI Corporation 200 1 TransCanada / Iroquois / PNGTL 650 1 DTE Energy and Spectra Energy 1,500 1 AGL Resources 1,000 1 APPALACHIAN TAKEAWAY CAPACITY(1) Projected Narrowing 23 Notes: EIA, Wood Mackenzie and pipeline operator company presentations and filings. (1) Baseline capacity per Wood Mackenzie estimates |
|
|
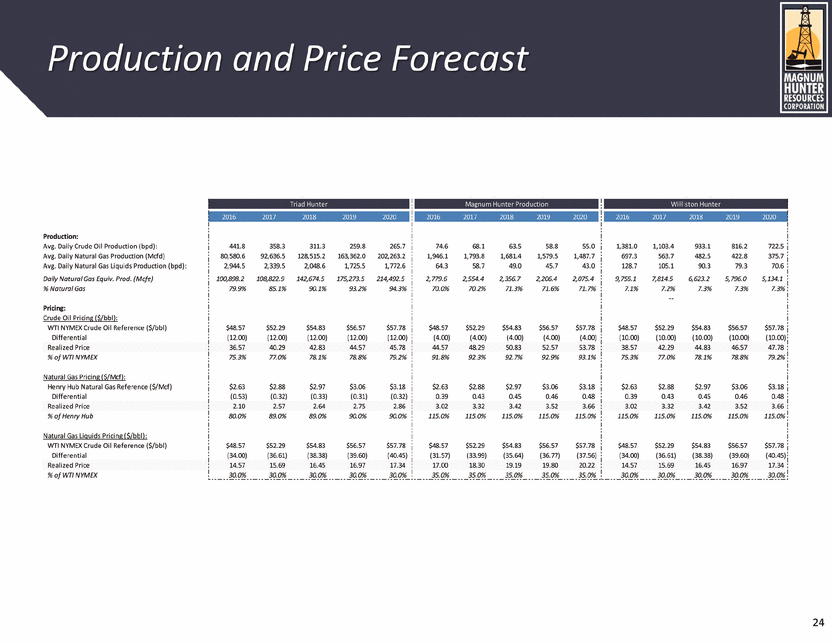
Production and Price Forecast 24 Triad Hunter Magnum Hunter Production Williston Hunter 2016 2017 2018 2019 2020 2016 2017 2018 2019 2020 2016 2017 2018 2019 2020 Production: Avg. Daily Crude Oil Production (bpd): 441.8 358.3 311.3 259.8 265.7 74.6 68.1 63.5 58.8 55.0 1,381.0 1,103.4 933.1 816.2 722.5 Avg. Daily Natural Gas Production (Mcfd) 80,580.6 92,636.5 128,515.2 163,362.0 202,263.2 1,946.1 1,793.8 1,681.4 1,579.5 1,487.7 697.3 563.7 482.5 422.8 375.7 Avg. Daily Natural Gas Liquids Production (bpd): 2,944.5 2,339.5 2,048.6 1,725.5 1,772.6 64.3 58.7 49.0 45.7 43.0 128.7 105.1 90.3 79.3 70.6 Daily Natural Gas Equiv. Prod. (Mcfe) 100,898.2 108,822.9 142,674.5 175,273.5 214,492.5 2,779.6 2,554.4 2,356.7 2,206.4 2,075.4 9,755.1 7,814.5 6,623.2 5,796.0 5,134.1 % Natural Gas 79.9% 85.1% 90.1% 93.2% 94.3% 70.0% 70.2% 71.3% 71.6% 71.7% 7.1% 7.2% 7.3% 7.3% 7.3% -- Pricing: Crude Oil Pricing ($/bbl): WTI NYMEX Crude Oil Reference ($/bbl) $48.57 $52.29 $54.83 $56.57 $57.78 $48.57 $52.29 $54.83 $56.57 $57.78 $48.57 $52.29 $54.83 $56.57 $57.78 Differential (12.00) (12.00) (12.00) (12.00) (12.00) (4.00) (4.00) (4.00) (4.00) (4.00) (10.00) (10.00) (10.00) (10.00) (10.00) Realized Price 36.57 40.29 42.83 44.57 45.78 44.57 48.29 50.83 52.57 53.78 38.57 42.29 44.83 46.57 47.78 % of WTI NYMEX 75.3% 77.0% 78.1% 78.8% 79.2% 91.8% 92.3% 92.7% 92.9% 93.1% 75.3% 77.0% 78.1% 78.8% 79.2% Natural Gas Pricing ($/Mcf): Henry Hub Natural Gas Reference ($/Mcf) $2.63 $2.88 $2.97 $3.06 $3.18 $2.63 $2.88 $2.97 $3.06 $3.18 $2.63 $2.88 $2.97 $3.06 $3.18 Differential (0.53) (0.32) (0.33) (0.31) (0.32) 0.39 0.43 0.45 0.46 0.48 0.39 0.43 0.45 0.46 0.48 Realized Price 2.10 2.57 2.64 2.75 2.86 3.02 3.32 3.42 3.52 3.66 3.02 3.32 3.42 3.52 3.66 % of Henry Hub 80.0% 89.0% 89.0% 90.0% 90.0% 115.0% 115.0% 115.0% 115.0% 115.0% 115.0% 115.0% 115.0% 115.0% 115.0% Natural Gas Liquids Pricing ($/bbl): WTI NYMEX Crude Oil Reference ($/bbl) $48.57 $52.29 $54.83 $56.57 $57.78 $48.57 $52.29 $54.83 $56.57 $57.78 $48.57 $52.29 $54.83 $56.57 $57.78 Differential (34.00) (36.61) (38.38) (39.60) (40.45) (31.57) (33.99) (35.64) (36.77) (37.56) (34.00) (36.61) (38.38) (39.60) (40.45) Realized Price 14.57 15.69 16.45 16.97 17.34 17.00 18.30 19.19 19.80 20.22 14.57 15.69 16.45 16.97 17.34 % of WTI NYMEX 30.0% 30.0% 30.0% 30.0% 30.0% 35.0% 35.0% 35.0% 35.0% 35.0% 30.0% 30.0% 30.0% 30.0% 30.0% |
|
|
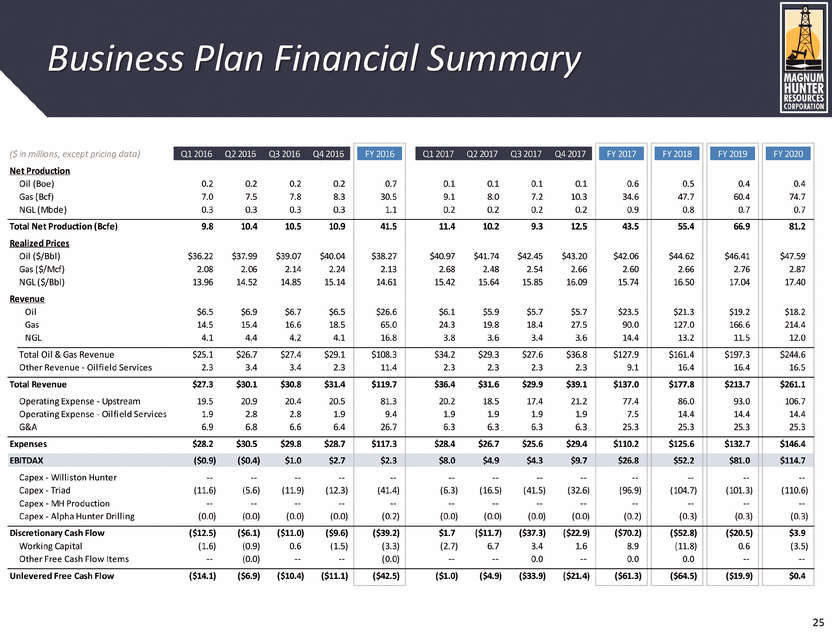
Business Plan Financial Summary 25 ($ in millions, except pricing data) Q1 2016 Q2 2016 Q3 2016 Q4 2016 FY 2016 Q1 2017 Q2 2017 Q3 2017 Q4 2017 FY 2017 FY 2018 FY 2019 FY 2020 Net Production Oil (Boe) 0.2 0.2 0.2 0.2 0.7 0.1 0.1 0.1 0.1 0.6 0.5 0.4 0.4 Gas (Bcf) 7.0 7.5 7.8 8.3 30.5 9.1 8.0 7.2 10.3 34.6 47.7 60.4 74.7 NGL (Mbde) 0.3 0.3 0.3 0.3 1.1 0.2 0.2 0.2 0.2 0.9 0.8 0.7 0.7 Total Net Production (Bcfe) 9.8 10.4 10.5 10.9 41.5 11.4 10.2 9.3 12.5 43.5 55.4 66.9 81.2 Realized Prices Oil ($/Bbl) $36.22 $37.99 $39.07 $40.04 $38.27 $40.97 $41.74 $42.45 $43.20 $42.06 $44.62 $46.41 $47.59 Gas ($/Mcf) 2.08 2.06 2.14 2.24 2.13 2.68 2.48 2.54 2.66 2.60 2.66 2.76 2.87 NGL ($/Bbl) 13.96 14.52 14.85 15.14 14.61 15.42 15.64 15.85 16.09 15.74 16.50 17.04 17.40 Revenue Oil $6.5 $6.9 $6.7 $6.5 $26.6 $6.1 $5.9 $5.7 $5.7 $23.5 $21.3 $19.2 $18.2 Gas 14.5 15.4 16.6 18.5 65.0 24.3 19.8 18.4 27.5 90.0 127.0 166.6 214.4 NGL 4.1 4.4 4.2 4.1 16.8 3.8 3.6 3.4 3.6 14.4 13.2 11.5 12.0 Total Oil & Gas Revenue $25.1 $26.7 $27.4 $29.1 $108.3 $34.2 $29.3 $27.6 $36.8 $127.9 $161.4 $197.3 $244.6 Other Revenue - Oilfield Services 2.3 3.4 3.4 2.3 11.4 2.3 2.3 2.3 2.3 9.1 16.4 16.4 16.5 Total Revenue $27.3 $30.1 $30.8 $31.4 $119.7 $36.4 $31.6 $29.9 $39.1 $137.0 $177.8 $213.7 $261.1 Operating Expense - Upstream 19.5 20.9 20.4 20.5 81.3 20.2 18.5 17.4 21.2 77.4 86.0 93.0 106.7 Operating Expense - Oilfield Services 1.9 2.8 2.8 1.9 9.4 1.9 1.9 1.9 1.9 7.5 14.4 14.4 14.4 G&A 6.9 6.8 6.6 6.4 26.7 6.3 6.3 6.3 6.3 25.3 25.3 25.3 25.3 Expenses $28.2 $30.5 $29.8 $28.7 $117.3 $28.4 $26.7 $25.6 $29.4 $110.2 $125.6 $132.7 $146.4 EBITDAX ($0.9) ($0.4) $1.0 $2.7 $2.3 $8.0 $4.9 $4.3 $9.7 $26.8 $52.2 $81.0 $114.7 Capex - Williston Hunter -- -- -- -- -- -- -- -- -- -- -- -- -- Capex - Triad (11.6) (5.6) (11.9) (12.3) (41.4) (6.3) (16.5) (41.5) (32.6) (96.9) (104.7) (101.3) (110.6) Capex - MH Production -- -- -- -- -- -- -- -- -- -- -- -- -- Capex - Alpha Hunter Drilling (0.0) (0.0) (0.0) (0.0) (0.2) (0.0) (0.0) (0.0) (0.0) (0.2) (0.3) (0.3) (0.3) Discretionary Cash Flow ($12.5) ($6.1) ($11.0) ($9.6) ($39.2) $1.7 ($11.7) ($37.3) ($22.9) ($70.2) ($52.8) ($20.5) $3.9 Working Capital (1.6) (0.9) 0.6 (1.5) (3.3) (2.7) 6.7 3.4 1.6 8.9 (11.8) 0.6 (3.5) Other Free Cash Flow Items -- (0.0) -- -- (0.0) -- -- 0.0 -- 0.0 0.0 -- -- Unlevered Free Cash Flow ($14.1) ($6.9) ($10.4) ($11.1) ($42.5) ($1.0) ($4.9) ($33.9) ($21.4) ($61.3) ($64.5) ($19.9) $0.4 |
|
|
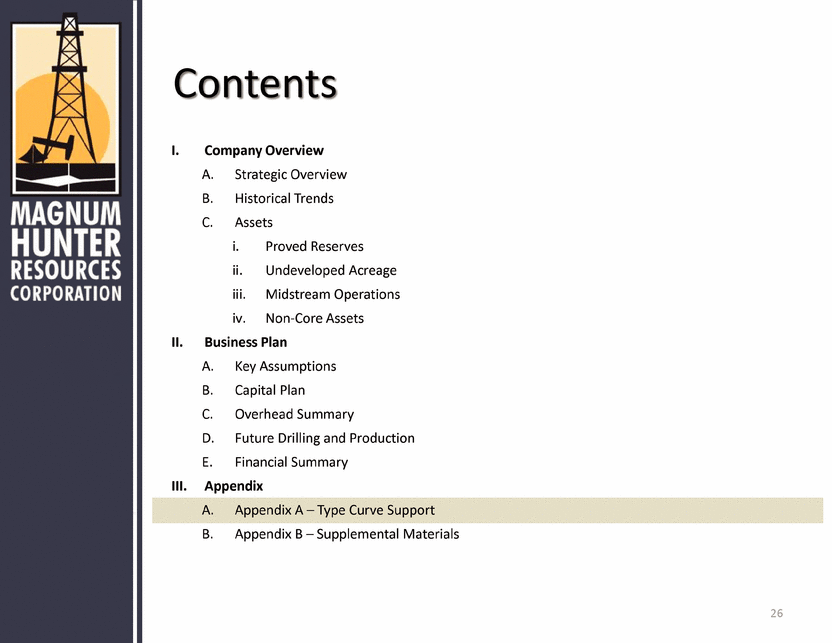
I. Company Overview A. Strategic Overview B. Historical Trends C. Assets i. Proved Reserves ii. Undeveloped Acreage iii. Midstream Operations iv. Non-Core Assets II. Business Plan A. Key Assumptions B. Capital Plan C. Overhead Summary D. Future Drilling and Production E. Financial Summary III. Appendix A. Appendix A – Type Curve Support B. Appendix B – Supplemental Materials Contents 26 |
|
|
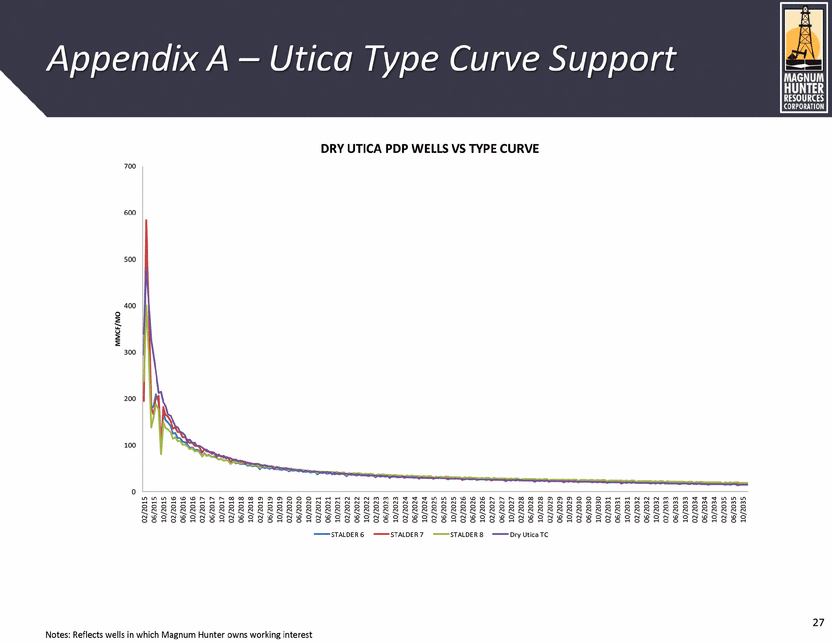
Appendix A – Utica Type Curve Support 0 100 200 300 400 500 600 700 02/2015 06/2015 10/2015 02/2016 06/2016 10/2016 02/2017 06/2017 10/2017 02/2018 06/2018 10/2018 02/2019 06/2019 10/2019 02/2020 06/2020 10/2020 02/2021 06/2021 10/2021 02/2022 06/2022 10/2022 02/2023 06/2023 10/2023 02/2024 06/2024 10/2024 02/2025 06/2025 10/2025 02/2026 06/2026 10/2026 02/2027 06/2027 10/2027 02/2028 06/2028 10/2028 02/2029 06/2029 10/2029 02/2030 06/2030 10/2030 02/2031 06/2031 10/2031 02/2032 06/2032 10/2032 02/2033 06/2033 10/2033 02/2034 06/2034 10/2034 02/2035 06/2035 10/2035 MMCF/MO DRY UTICA PDP WELLS VS TYPE CURVE STALDER 6 STALDER 7 STALDER 8 Dry Utica TC 27 Notes: Reflects wells in which Magnum Hunter owns working interest |
|
|
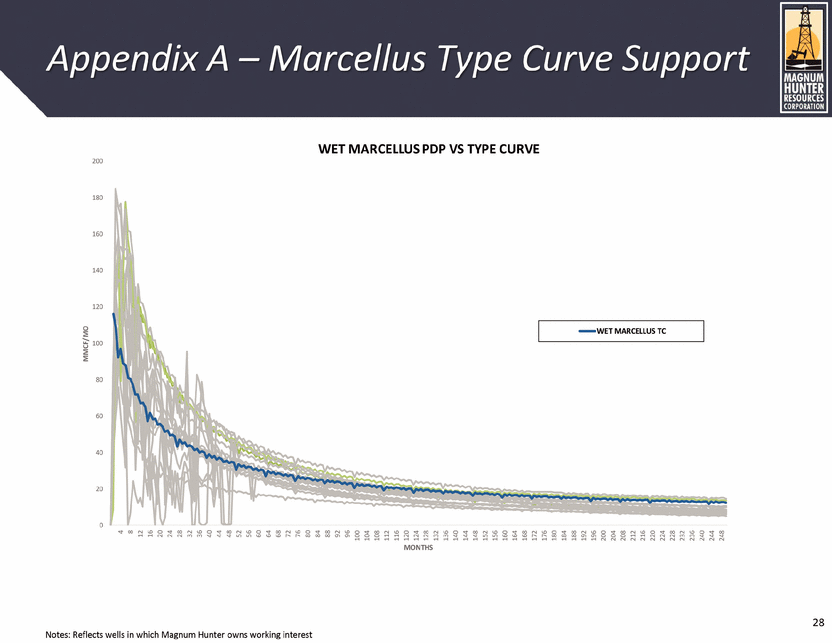
Appendix A – Marcellus Type Curve Support 0 20 40 60 80 100 120 140 160 180 200 4 8 12 16 20 24 28 32 36 40 44 48 52 56 60 64 68 72 76 80 84 88 92 96 100 104 108 112 116 120 124 128 132 136 140 144 148 152 156 160 164 168 172 176 180 184 188 192 196 200 204 208 212 216 220 224 228 232 236 240 244 248 MMCF/MO MONTHS WET MARCELLUS PDP VS TYPE CURVE WET MARCELLUS TC 28 Notes: Reflects wells in which Magnum Hunter owns working interest |
|
|
I. Company Overview A. Strategic Overview B. Historical Trends C. Assets i. Proved Reserves ii. Undeveloped Acreage iii. Midstream Operations iv. Non-Core Assets II. Business Plan A. Key Assumptions B. Capital Plan C. Overhead Summary D. Future Drilling and Production E. Financial Summary III. Appendix A. Appendix A – Type Curve Support B. Appendix B – Supplemental Materials Contents 29 |
|
|
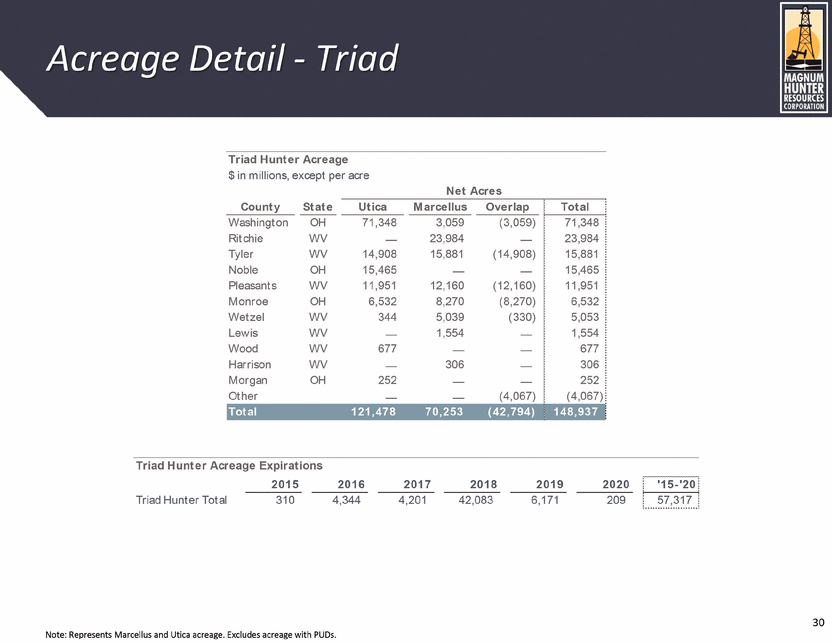
30 Acreage Detail - Triad Note: Represents Marcellus and Utica acreage. Excludes acreage with PUDs. Triad Hunter Acreage Expirations 2015 2016 2017 2018 2019 2020 '15-'20 Triad Hunter Total 310 4,344 4,201 42,083 6,171 209 57,317 Triad Hunter Acreage $ in millions, except per acre Net Acres County State Utica Marcellus Overlap Total Washington OH 71,348 3,059 (3,059) 71,348 Ritchie WV — 23,984 — 23,984 Tyler WV 14,908 15,881 (14,908) 15,881 Noble OH 15,465 — — 15,465 Pleasants WV 11,951 12,160 (12,160) 11,951 Monroe OH 6,532 8,270 (8,270) 6,532 Wetzel WV 344 5,039 (330) 5,053 Lewis WV — 1,554 — 1,554 Wood WV 677 — — 677 Harrison WV — 306 — 306 Morgan OH 252 — — 252 Other — — (4,067) (4,067) Total 121,478 70,253 (42,794) 148,937 |
|
|
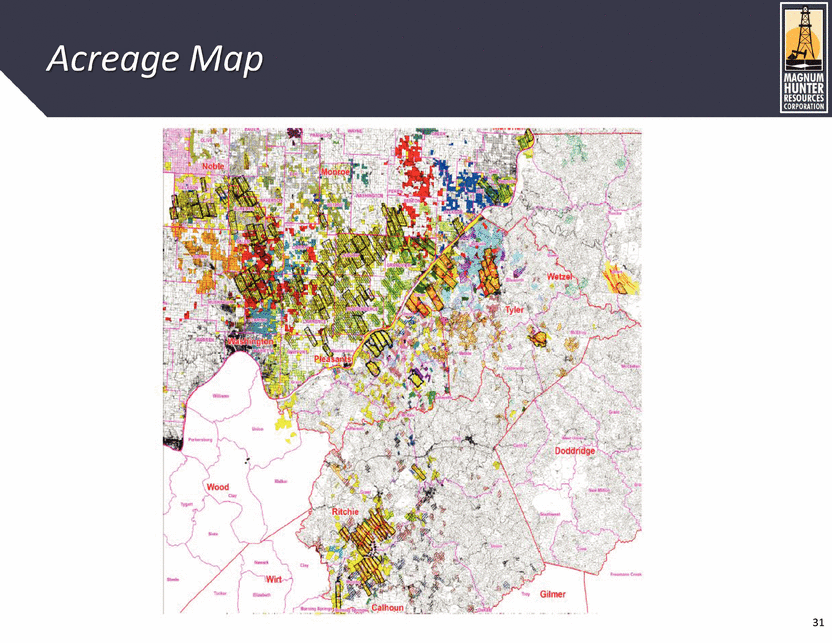
31 Acreage Map |
|
|
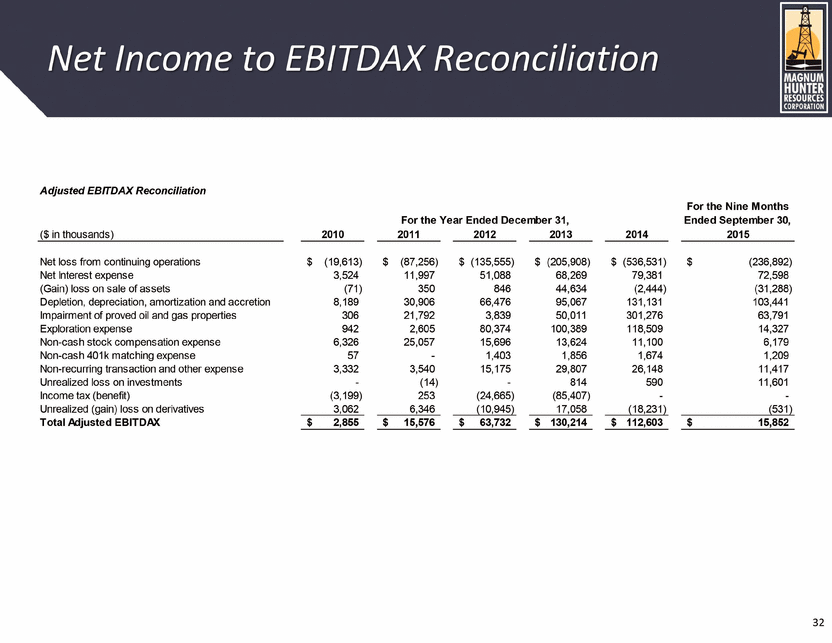
32 Net Income to EBITDAX Reconciliation Adjusted EBITDAX Reconciliation For the Nine Months Ended September 30, ($ in thousands) 2010 2011 2012 2013 2014 2015 Net loss from continuing operations (19,613) $ (87,256) $ (135,555) $ (205,908) $ (536,531) $ (236,892) $ Net Interest expense 3,524 11,997 51,088 68,269 79,381 72,598 (Gain) loss on sale of assets (71) 350 846 44,634 (2,444) (31,288) Depletion, depreciation, amortization and accretion 8,189 30,906 66,476 95,067 131,131 103,441 Impairment of proved oil and gas properties 306 21,792 3,839 50,011 301,276 63,791 Exploration expense 942 2,605 80,374 100,389 118,509 14,327 Non-cash stock compensation expense 6,326 25,057 15,696 13,624 11,100 6,179 Non-cash 401k matching expense 57 - 1,403 1,856 1,674 1,209 Non-recurring transaction and other expense 3,332 3,540 15,175 29,807 26,148 11,417 Unrealized loss on investments - (14) - 814 590 11,601 Income tax (benefit) (3,199) 253 (24,665) (85,407) - - Unrealized (gain) loss on derivatives 3,062 6,346 (10,945) 17,058 (18,231) (531) Total Adjusted EBITDAX 2,855 $ 15,576 $ 63,732 $ 130,214 $ 112,603 $ 15,852 $ For the Year Ended December 31, |
|
|
DRAFT Privileged & Confidential Attorney Work Product Subject to FRE 408 Project Mustang 2L MORTGAGE AND INTERCOMPANY ACCOUNTS ANALYSIS November 23 – 24, 2015 Subject to NDA. |
|
|
DRAFT Privileged & Confidential Attorney Work Product Subject to FRE 408 This document contains highly confidential information and is solely for informational purposes. You should not rely upon or use it to form the definitive basis for any decision or action whatsoever, with respect to any proposed transaction or otherwise. You and your affiliates and agents must hold this document and any oral information provided in connection with this document, as well as any information derived by you from the information contained herein, in strict confidence and may not communicate, reproduce or disclose it to any other person, or refer to it publicly, in whole or in part at any time except with our prior written consent. If you are not the intended recipient of this document, please delete and destroy all copies immediately. This document is “as is” and is based, in part, on information obtained from other sources. Our use of such information does not imply that we have independently verified or necessarily agree with any of such information, and we have assumed and relied upon the accuracy and completeness of such information for purposes of this document. Neither we nor any of our affiliates or agents, make any representation or warranty, express or implied, in relation to the accuracy or completeness of the information contained in this document or any oral information provided in connection herewith, or any data it generates and expressly disclaim any and all liability (whether direct or indirect, in contract, tort or otherwise) in relation to any of such information or any errors or omissions therein. Any views or terms contained herein are preliminary, and are based on financial, economic, market and other conditions prevailing as of the date of this document and are subject to change. We undertake no obligations or responsibility to update any of the information contained in this document. Past performance does not guarantee or predict future performance. This document does not constitute an offer to sell or the solicitation of an offer to buy any security, nor does it constitute an offer or commitment to lend, syndicate or arrange a financing, underwrite or purchase or act as an agent or advisor or in any other capacity with respect to any transaction, or commit capital, or to participate in any trading strategies, and does not constitute legal, regulatory, accounting or tax advice to the recipient. This document does not constitute and should not be considered as any form of financial opinion or recommendation by us or any of our affiliates. This document is not a research report nor should it be construed as such. This document may include information from the S&P Capital IQ Platform Service. Such information is subject to the following: “Copyright © 2015, S&P Capital IQ (and its affiliates, as applicable). This may contain information obtained from third parties, including ratings from credit ratings agencies such as Standard & Poor’s. Reproduction and distribution of third party content in any form is prohibited except with the prior written permission of the related third party. Third party content providers do not guarantee the accuracy, completeness, timeliness or availability of any information, including ratings, and are not responsible for any errors or omissions (negligent or otherwise), regardless of the cause, or for the results obtained from the use of such content. THIRD PARTY CONTENT PROVIDERS GIVE NO EXPRESS OR IMPLIED WARRANTIES, INCLUDING, BUT NOT LIMITED TO, ANY WARRANTIES OF MERCHANTABILITY OR FITNESS FOR A PARTICULAR PURPOSE OR USE. THIRD PARTY CONTENT PROVIDERS SHALL NOT BE LIABLE FOR ANY DIRECT, INDIRECT, INCIDENTAL, EXEMPLARY, COMPENSATORY, PUNITIVE, SPECIAL OR CONSEQUENTIAL DAMAGES, COSTS, EXPENSES, LEGAL FEES, OR LOSSES (INCLUDING LOST INCOME OR PROFITS AND OPPORTUNITY COSTS OR LOSSES CAUSED BY NEGLIGENCE) IN CONNECTION WITH ANY USE OF THEIR CONTENT, INCLUDING RATINGS. Credit ratings are statements of opinions and are not statements of fact or recommendations to purchase, hold or sell securities. They do not address the suitability of securities or the suitability of securities for investment purposes, and should not be relied on as investment advice.” Copyright © 2015, PJT Partners LP (and its affiliates, as applicable). Disclaimer 1 |
|
|
DRAFT Privileged & Confidential Attorney Work Product Subject to FRE 408 I. 2L Mortgage Analysis 2 |
|
|
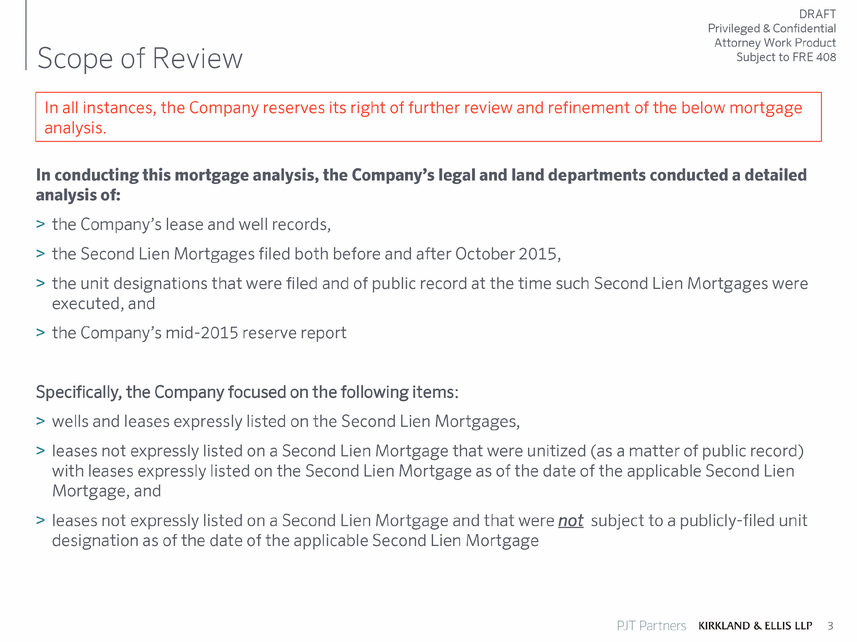
DRAFT Privileged & Confidential Attorney Work Product Subject to FRE 408 Scope of Review In conducting this mortgage analysis, the Company’s legal and land departments conducted a detailed analysis of: > the Company’s lease and well records, > the Second Lien Mortgages filed both before and after October 2015, > the unit designations that were filed and of public record at the time such Second Lien Mortgages were executed, and > the Company’s mid-2015 reserve report Specifically, the Company focused on the following items: > wells and leases expressly listed on the Second Lien Mortgages, > leases not expressly listed on a Second Lien Mortgage that were unitized (as a matter of public record) with leases expressly listed on the Second Lien Mortgage as of the date of the applicable Second Lien Mortgage, and > leases not expressly listed on a Second Lien Mortgage and that were not subject to a publicly-filed unit designation as of the date of the applicable Second Lien Mortgage 3 In all instances, the Company reserves its right of further review and refinement of the below mortgage analysis. |
|
|
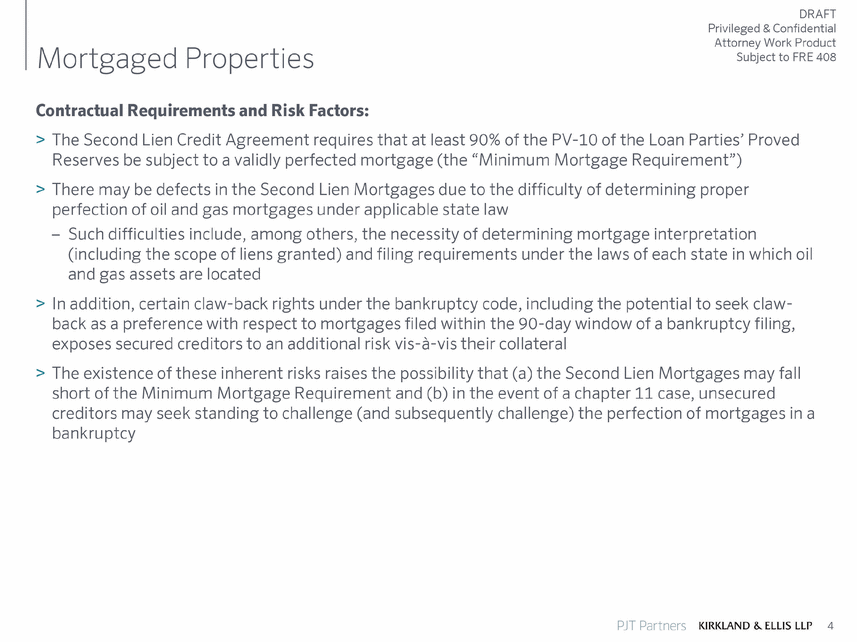
DRAFT Privileged & Confidential Attorney Work Product Subject to FRE 408 Mortgaged Properties Contractual Requirements and Risk Factors: > The Second Lien Credit Agreement requires that at least 90% of the PV-10 of the Loan Parties’ Proved Reserves be subject to a validly perfected mortgage (the “Minimum Mortgage Requirement”) > There may be defects in the Second Lien Mortgages due to the difficulty of determining proper perfection of oil and gas mortgages under applicable state law . Such difficulties include, among others, the necessity of determining mortgage interpretation (including the scope of liens granted) and filing requirements under the laws of each state in which oil and gas assets are located > In addition, certain claw-back rights under the bankruptcy code, including the potential to seek clawback as a preference with respect to mortgages filed within the 90-day window of a bankruptcy filing, exposes secured creditors to an additional risk vis-à-vis their collateral > The existence of these inherent risks raises the possibility that (a) the Second Lien Mortgages may fall short of the Minimum Mortgage Requirement and (b) in the event of a chapter 11 case, unsecured creditors may seek standing to challenge (and subsequently challenge) the perfection of mortgages in a bankruptcy 4 |
|
|
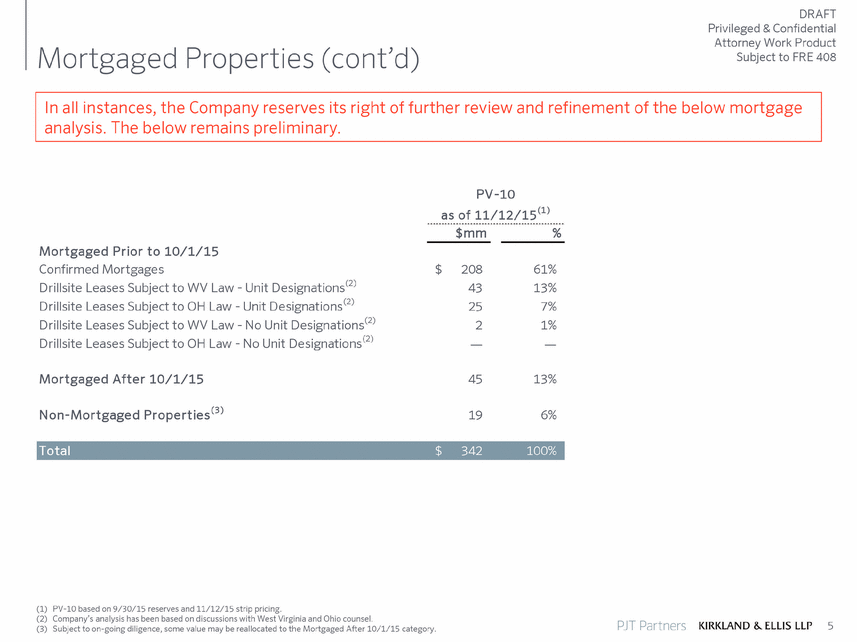
DRAFT Privileged & Confidential Attorney Work Product Subject to FRE 408 Mortgaged Properties (cont’d) (1) PV-10 based on 9/30/15 reserves and 11/12/15 strip pricing. (2) Company’s analysis has been based on discussions with West Virginia and Ohio counsel. (3) Subject to on-going diligence, some value may be reallocated to the Mortgaged After 10/1/15 category. In all instances, the Company reserves its right of further review and refinement of the below mortgage analysis. The below remains preliminary. 5 PV-10 Illustrative as of 11/12/15(1) Success Rate $mm % Mortgaged Prior to 10/1/15 Confirmed Mortgages 208 $ 61% Drillsite Leases Subject to WV Law - Unit Designations(2) 43 13% Drillsite Leases Subject to OH Law - Unit Designations(2) 25 7% Drillsite Leases Subject to WV Law - No Unit Designations(2) 2 1% Drillsite Leases Subject to OH Law - No Unit Designations(2) — — Mortgaged After 10/1/15 45 13% Non-Mortgaged Properties(3) 19 6% Total 342 $ 100% |
|
|
DRAFT Privileged & Confidential Attorney Work Product Subject to FRE 408 II. Intercompany Accounts Analysis 6 |
|
|
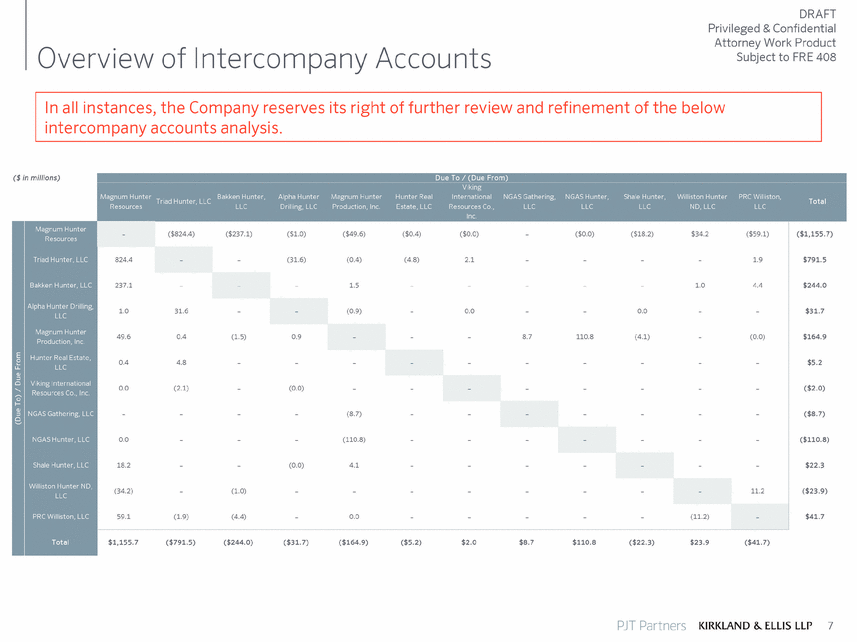
DRAFT Privileged & Confidential Attorney Work Product Subject to FRE 408 Overview of Intercompany Accounts 7 In all instances, the Company reserves its right of further review and refinement of the below intercompany accounts analysis. ($ in millions) Due To / (Due From) Magnum Hunter Resources – ($824.4) ($237.1) ($1.0) ($49.6) ($0.4) ($0.0) – ($0.0) ($18.2) $34.2 ($59.1) ($1,155.7) Triad Hunter, LLC 824.4 – – (31.6) (0.4) (4.8) 2.1 – – – – 1.9 $791.5 Bakken Hunter, LLC 237.1 – – – 1.5 – – – – – 1.0 4.4 $244.0 Alpha Hunter Drilling, LLC 1.0 31.6 – – (0.9) – 0.0 – – 0.0 – – $31.7 Magnum Hunter Production, Inc. 49.6 0.4 (1.5) 0.9 – – – 8.7 110.8 (4.1) – (0.0) $164.9 Hunter Real Estate, LLC 0.4 4.8 – – – – – – – – – – $5.2 Viking International Resources Co., Inc. 0.0 (2.1) – (0.0) – – – – – – – – ($2.0) NGAS Gathering, LLC – – – – (8.7) – – – – – – – ($8.7) NGAS Hunter, LLC 0.0 – – – (110.8) – – – – – – – ($110.8) Shale Hunter, LLC 18.2 – – (0.0) 4.1 – – – – – – – $22.3 Williston Hunter ND, LLC (34.2) – (1.0) – – – – – – – – 11.2 ($23.9) PRC Williston, LLC 59.1 (1.9) (4.4) – 0.0 – – – – – (11.2) – $41.7 Total $1,155.7 ($791.5) ($244.0) ($31.7) ($164.9) ($5.2) $2.0 $8.7 $110.8 ($22.3) $23.9 ($41.7) Total (Due To) / Due From Viking International Resources Co., Inc. NGAS Gathering, LLC NGAS Hunter, LLC Shale Hunter, LLC Williston Hunter ND, LLC PRC Williston, LLC Magnum Hunter Resources Triad Hunter, LLC Bakken Hunter, LLC Alpha Hunter Drilling, LLC Magnum Hunter Production, Inc. Hunter Real Estate, LLC |
|
|
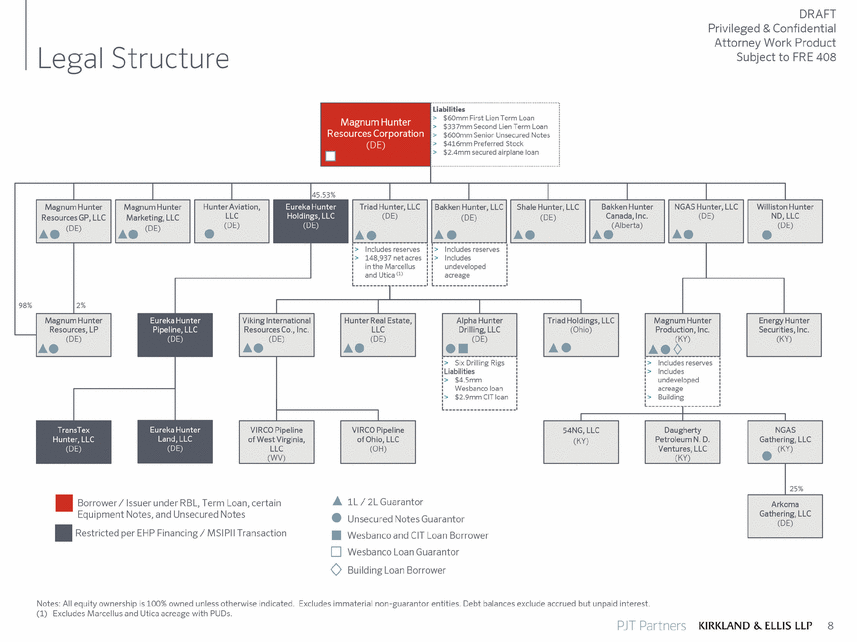
DRAFT Privileged & Confidential Attorney Work Product Subject to FRE 408 Legal Structure Notes: All equity ownership is 100% owned unless otherwise indicated. Excludes immaterial non-guarantor entities. Debt balances exclude accrued but unpaid interest. (1) Excludes Marcellus and Utica acreage with PUDs. 8 Eureka Hunter Pipeline, LLC (DE) Magnum Hunter Production, Inc. (KY) Energy Hunter Securities, Inc. (KY) Hunter Real Estate, LLC (DE) Magnum Hunter Resources, LP (DE) Alpha Hunter Drilling, LLC (DE) Viking International Resources Co., Inc. (DE) Triad Holdings, LLC (Ohio) Eureka Hunter Land, LLC (DE) NGAS Gathering, LLC (KY) 54NG, LLC (KY) Arkoma Gathering, LLC (DE) TransTex Hunter, LLC (DE) VIRCO Pipeline of West Virginia, LLC (WV) VIRCO Pipeline of Ohio, LLC (OH) Daugherty Petroleum N. D. Ventures, LLC (KY) Triad Hunter, LLC (DE) Magnum Hunter Resources GP, LLC (DE) NGAS Hunter, LLC (DE) Bakken Hunter Canada, Inc. (Alberta) Bakken Hunter, LLC (DE) Hunter Aviation, LLC (DE) Magnum Hunter Marketing, LLC (DE) Eureka Hunter Holdings, LLC (DE) Shale Hunter, LLC (DE) Unsecured Notes Guarantor Liabilities > $60mm First Lien Term Loan > $337mm Second Lien Term Loan > $600mm Senior Unsecured Notes > $416mm Preferred Stock > $2.4mm secured airplane loan Magnum Hunter Resources Corporation (DE) Williston Hunter ND, LLC (DE) > Includes reserves > 148,937 net acres in the Marcellus and Utica (1) > Includes reserves > Includes undeveloped acreage > Six Drilling Rigs Liabilities > $4.5mm Wesbanco loan > $2.9mm CIT loan > Includes reserves > Includes undeveloped acreage > Building 45.53% 2% 98% 25% Borrower / Issuer under RBL, Term Loan, certain Equipment Notes, and Unsecured Notes 1L / 2L Guarantor Wesbanco and CIT Loan Borrower Restricted per EHP Financing / MSIPII Transaction Wesbanco Loan Guarantor Building Loan Borrower |
|
|
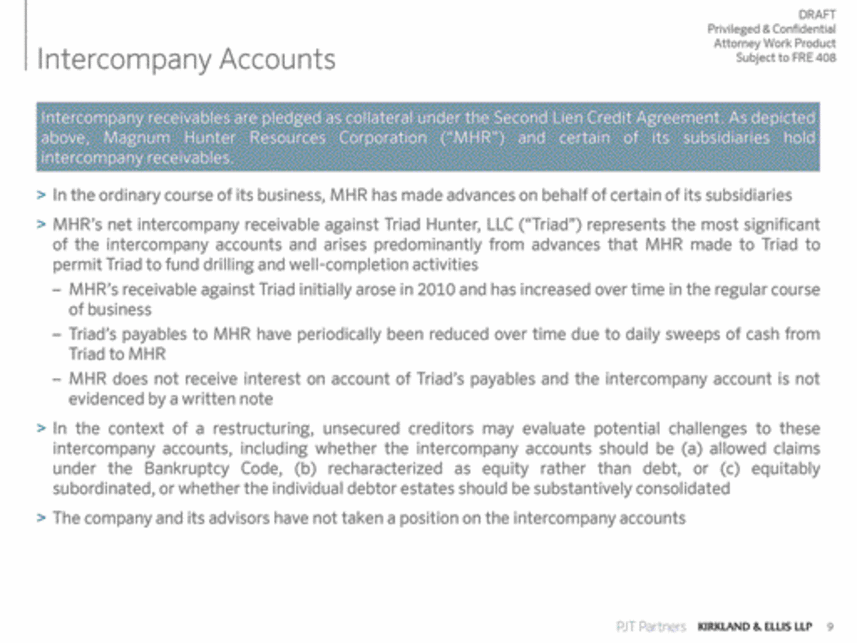
DRAFT Privileged & Confidential Attorney Work Product Subject to FRE 408 Intercompany Accounts Intercompany receivables are pledged as collateral under the Second Lien Credit Agreement. As depicted above, Magnum Hunter Resources Corporation (“MHR”) and certain of its subsidiaries hold intercompany receivables. > In the ordinary course of its business, MHR has made advances on behalf of certain of its subsidiaries > MHR’s net intercompany receivable against Triad Hunter, LLC (“Triad”) represents the most significant of the intercompany accounts and arises predominantly from advances that MHR made to Triad to permit Triad to fund drilling and well-completion activities . MHR’s receivable against Triad initially arose in 2010 and has increased over time in the regular course of business . Triad’s payables to MHR have periodically been reduced over time due to daily sweeps of cash from Triad to MHR . MHR does not receive interest on account of Triad’s payables and the intercompany account is not evidenced by a written note > In the context of a restructuring, unsecured creditors may evaluate potential challenges to these intercompany accounts, including whether the intercompany accounts should be (a) allowed claims under the Bankruptcy Code, (b) recharacterized as equity rather than debt, or (c) equitably subordinated, or whether the individual debtor estates should be substantively consolidated > The company and its advisors have not taken a position on the intercompany accounts 9 |

