Attached files
| file | filename |
|---|---|
| 8-K - CURRENT REPORT OF MATERIAL EVENTS OR CORPORATE CHANGES - Thryv Holdings, Inc. | a15-21744_18k.htm |
| EX-99.1 - EX-99.1 - Thryv Holdings, Inc. | a15-21744_1ex99d1.htm |
| EX-99.3 - EX-99.3 - Thryv Holdings, Inc. | a15-21744_1ex99d3.htm |
| EX-10.1 - EX-10.1 - Thryv Holdings, Inc. | a15-21744_1ex10d1.htm |
| EX-99.4 - EX-99.4 - Thryv Holdings, Inc. | a15-21744_1ex99d4.htm |
Exhibit 99.2
November 16, 2015 Confidential and Proprietary Information of Dex Media Dex Media 5 Year Plan

Overview 2 Confidential and Proprietary Information of Dex Media The Company has prepared its five year plan which is outlined in this presentation This plan has not yet been reviewed or approved by the Board and remains subject to their approval and possible further modification

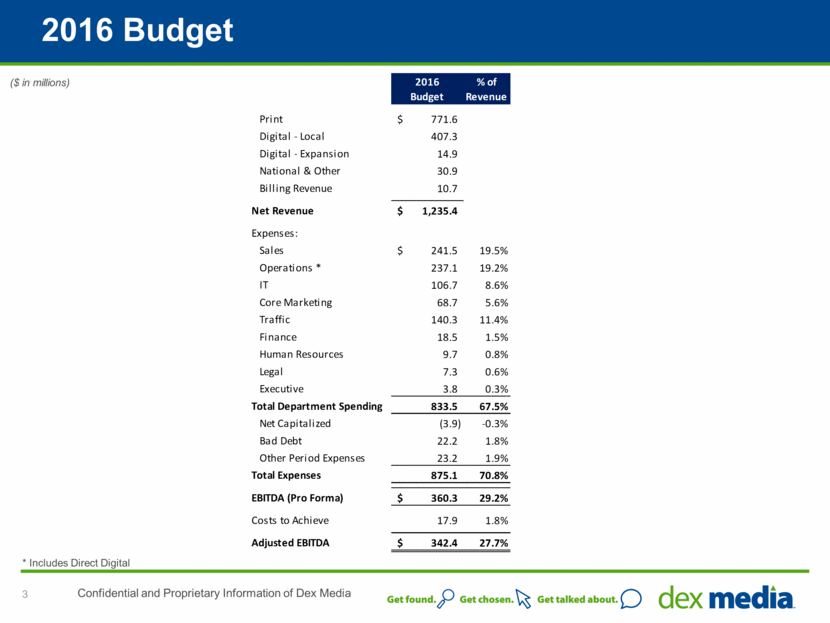
2016 Budget 3 Confidential and Proprietary Information of Dex Media ($ in millions) * Includes Direct Digital Print 775.4 $ 771.6 $ (3.8) $ Digital - Local 482.6 407.3 (75.3) Digital - Expansion 26.7 14.9 (11.9) National & Other 30.5 30.9 0.4 Billing Revenue - 10.7 10.7 Net Revenue 1,315.2 $ 1,235.4 $ (79.8) $ Expenses: Sales 257.7 $ 19.6% 241.5 $ 19.5% 16.2 $ Operations * 228.3 17.4% 237.1 19.2% (8.8) IT 99.0 7.5% 106.7 8.6% (7.7) Core Marketing 64.6 4.9% 68.7 5.6% (4.1) Traffic 156.0 11.9% 140.3 11.4% 15.7 Finance 19.2 1.5% 18.5 1.5% 0.7 Human Resources 9.7 0.7% 9.7 0.8% 0.1 Legal 7.2 0.6% 7.3 0.6% (0.1) Executive 3.3 0.3% 3.8 0.3% (0.4) Total Department Spending 845.0 64.3% 833.5 67.5% 11.5 Net Capitalized 16.7 1.3% (3.9) -0.3% 20.6 Bad Debt 29.6 2.3% 22.2 1.8% 7.4 Other Period Expenses 22.6 1.7% 23.2 1.9% (0.6) Total Expenses 913.9 69.5% 875.1 70.8% 38.8 EBITDA (Pro Forma) 401.3 $ 30.5% 360.3 $ 29.2% (41.0) $ Costs to Achieve 1.1 0.1% 17.9 1.8% (16.8) - Adjusted EBITDA 400.2 $ 30.4% 342.4 $ 27.7% (57.8) $ Variance Fav/(Unfav) % of Revenue 2016 Budget % of Revenue 2016 Lender Presentation Print 775.4 $ 771.6 $ (3.8) $ Digital - Local 482.6 407.3 (75.3) Digital - Expansion 26.7 14.9 (11.9) National & Other 30.5 30.9 0.4 Billing Revenue - 10.7 10.7 Net Revenue 1,315.2 $ 1,235.4 $ (79.8) $ Expenses: Sales 257.7 $ 19.6% 241.5 $ 19.5% 16.2 $ Operations * 228.3 17.4% 237.1 19.2% (8.8) IT 99.0 7.5% 106.7 8.6% (7.7) Core Marketing 64.6 4.9% 68.7 5.6% (4.1) Traffic 156.0 11.9% 140.3 11.4% 15.7 Finance 19.2 1.5% 18.5 1.5% 0.7 Human Resources 9.7 0.7% 9.7 0.8% 0.1 Legal 7.2 0.6% 7.3 0.6% (0.1) Executive 3.3 0.3% 3.8 0.3% (0.4) Total Department Spending 845.0 64.3% 833.5 67.5% 11.5 Net Capitalized 16.7 1.3% (3.9) -0.3% 20.6 Bad Debt 29.6 2.3% 22.2 1.8% 7.4 Other Period Expenses 22.6 1.7% 23.2 1.9% (0.6) Total Expenses 913.9 69.5% 875.1 70.8% 38.8 EBITDA (Pro Forma) 401.3 $ 30.5% 360.3 $ 29.2% (41.0) $ Costs to Achieve 1.1 0.1% 17.9 1.8% (16.8) - Adjusted EBITDA 400.2 $ 30.4% 342.4 $ 27.7% (57.8) $ Variance Fav/(Unfav) % of Revenue 2016 Budget % of Revenue 2016 Lender Presentation
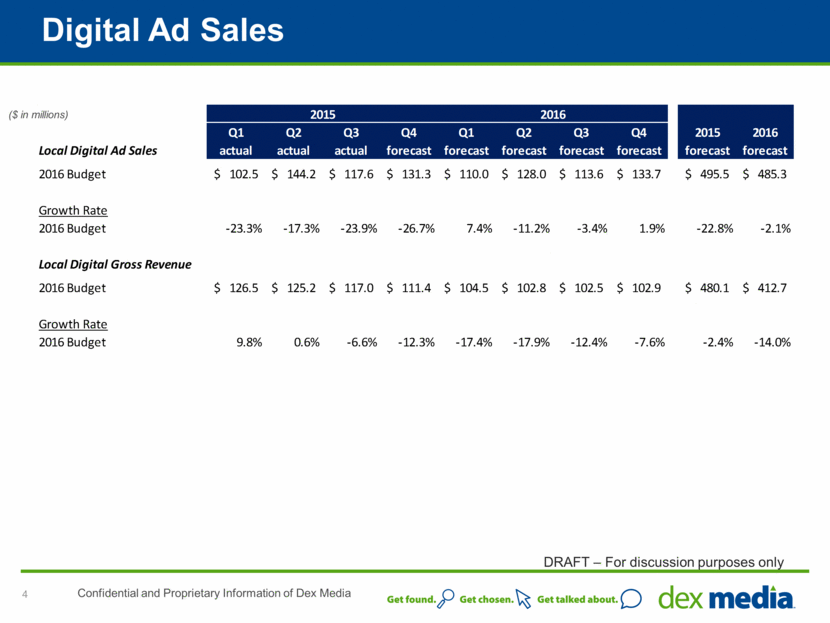
Digital Ad Sales 4 Confidential and Proprietary Information of Dex Media DRAFT – For discussion purposes only ($ in millions) 2015 2016 Q1 Q2 Q3 Q4 Q1 Q2 Q3 Q4 2015 2016 Local Digital Ad Sales actual actual actual forecast forecast forecast forecast forecast forecast forecast 2016 Budget 102.5 $ 144.2 $ 117.6 $ 131.3 $ 110.0 $ 128.0 $ 113.6 $ 133.7 $ 495.5 $ 485.3 $ Growth Rate 2016 Budget -23.3% -17.3% -23.9% -26.7% 7.4% -11.2% -3.4% 1.9% -22.8% -2.1% Local Digital Gross Revenue 2016 Budget 126.5 $ 125.2 $ 117.0 $ 111.4 $ 104.5 $ 102.8 $ 102.5 $ 102.9 $ 480.1 $ 412.7 $ Growth Rate 2016 Budget 9.8% 0.6% -6.6% -12.3% -17.4% -17.9% -12.4% -7.6% -2.4% -14.0%
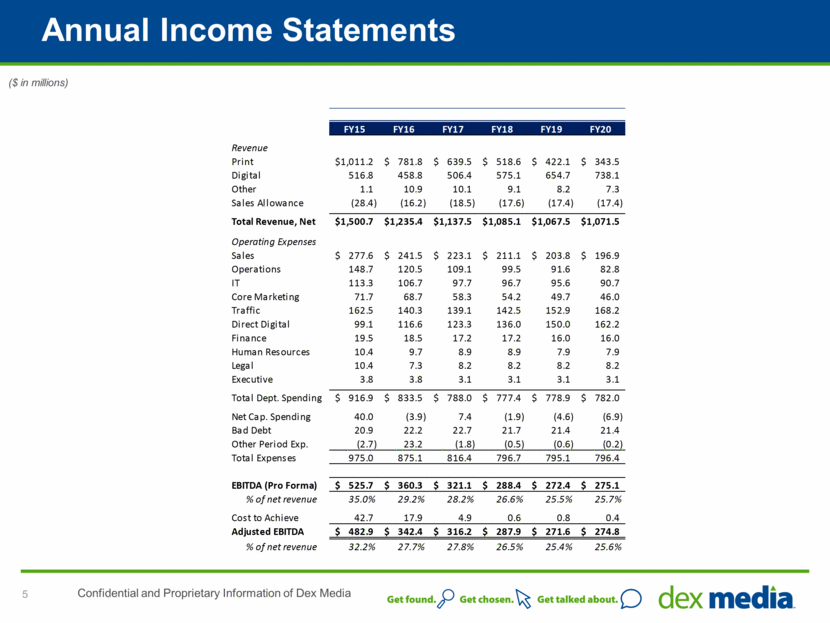
Annual Income Statements 5 Confidential and Proprietary Information of Dex Media ($ in millions) Sept. 11th Lender Presentation Revised 5 Year Plan Variance Fav / (Unfav) FY15 FY16 FY17 FY18 FY19 FY20 FY15 FY16 FY17 FY18 FY19 FY20 FY15 FY16 FY17 FY18 FY19 FY20 Revenue Print 1,010.8 $ 788.0 $ 618.5 $ 492.8 $ 394.3 $ 315.8 $ 1,011.2 $ 781.8 $ 639.5 $ 518.6 $ 422.1 $ 343.5 $ 0.4 $ (6.2) $ 21.0 $ 25.8 $ 27.7 $ 27.7 $ Digital 519.2 548.6 628.7 704.0 789.3 877.6 516.8 458.8 506.4 575.1 654.7 738.1 (2.5) (89.7) (122.3) (128.9) (134.7) (139.5) Other - - - - - - 1.1 10.9 10.1 9.1 8.2 7.3 1.1 10.9 10.1 9.1 8.2 7.3 Sales Allowance (27.3) (21.4) (20.0) (19.1) (18.9) (19.1) (28.4) (16.2) (18.5) (17.6) (17.4) (17.4) (1.1) 5.2 1.5 1.5 1.6 1.7 Total Revenue, Net 1,502.8 $ 1,315.2 $ 1,227.2 $ 1,177.7 $ 1,164.7 $ 1,174.3 $ 1,500.7 $ 1,235.4 $ 1,137.5 $ 1,085.1 $ 1,067.5 $ 1,071.5 $ (2.1) $ (79.8) $ (89.7) $ (92.5) $ (97.2) $ (102.8) $ Operating Expenses Sales 286.5 $ 257.7 $ 233.1 $ 222.5 $ 215.5 $ 212.4 $ 277.6 $ 241.5 $ 223.1 $ 211.1 $ 203.8 $ 196.9 $ 8.9 $ 16.2 $ 10.0 $ 11.4 $ 11.7 $ 15.5 $ Operations 151.4 122.5 110.0 100.0 91.8 82.7 148.7 120.5 109.1 99.5 91.6 82.8 2.7 2.0 0.9 0.4 0.2 (0.1) IT 114.2 99.0 99.0 99.0 99.0 99.0 113.3 106.7 97.7 96.7 95.6 90.7 0.8 (7.7) 1.3 2.3 3.4 8.3 Core Marketing 75.3 64.6 58.2 52.6 48.1 44.4 71.7 68.7 58.3 54.2 49.7 46.0 3.6 (4.1) (0.0) (1.5) (1.5) (1.6) Traffic 163.9 156.0 178.7 196.6 216.5 234.0 162.5 140.3 139.1 142.5 152.9 168.2 1.4 15.7 39.6 54.1 63.6 65.8 Direct Digital 101.3 105.8 115.4 124.5 134.7 145.3 99.1 116.6 123.3 136.0 150.0 162.2 2.2 (10.8) (7.9) (11.5) (15.3) (16.9) Finance 19.6 19.2 17.2 17.2 16.0 16.0 19.5 18.5 17.2 17.2 16.0 16.0 0.1 0.7 0.0 0.0 0.0 0.0 Human Resources 10.2 9.7 8.5 8.5 7.5 7.5 10.4 9.7 8.9 8.9 7.9 7.9 (0.2) 0.1 (0.4) (0.4) (0.4) (0.4) Legal 9.2 7.2 7.2 7.2 7.2 7.2 10.4 7.3 8.2 8.2 8.2 8.2 (1.3) (0.1) (0.9) (0.9) (0.9) (0.9) Executive 3.3 3.3 3.3 3.3 3.3 3.3 3.8 3.8 3.1 3.1 3.1 3.1 (0.4) (0.4) 0.2 0.2 0.2 0.2 Total Dept. Spending 934.8 $ 845.0 $ 830.8 $ 831.5 $ 839.9 $ 852.0 $ 916.9 $ 833.5 $ 788.0 $ 777.4 $ 778.9 $ 782.0 $ 17.9 $ 11.5 $ 42.8 $ 54.1 $ 61.0 $ 70.0 $ Net Cap. Spending 38.1 16.7 10.5 7.5 6.1 3.1 40.0 (3.9) 7.4 (1.9) (4.6) (6.9) (1.9) 20.6 3.0 9.4 10.7 10.0 Bad Debt 23.0 29.6 36.8 43.0 43.7 44.0 20.9 22.2 22.7 21.7 21.4 21.4 2.2 7.4 14.1 21.3 22.3 22.6 Other Period Exp. (18.2) 22.6 (9.4) 0.4 4.5 1.3 (2.7) 23.2 (1.8) (0.5) (0.6) (0.2) (15.5) (0.6) (7.6) 0.9 5.1 1.5 Total Expenses 977.8 913.9 868.7 882.4 894.2 900.5 975.0 875.1 816.4 796.7 795.1 796.4 2.8 38.8 52.3 85.7 99.1 104.1 EBITDA (Pro Forma) 525.0 $ 401.3 $ 358.5 $ 295.2 $ 270.5 $ 273.8 $ 525.7 $ 360.3 $ 321.1 $ 288.4 $ 272.4 $ 275.1 $ 0.6 $ (41.0) $ (37.4) $ (6.8) $ 1.9 $ 1.3 $ % of net revenue 34.9% 30.5% 29.2% 25.1% 23.2% 23.3% 35.0% 29.2% 28.2% 26.6% 25.5% 25.7% 0.1% -1.3% -1.0% 1.5% 2.3% 2.4% Cost to Achieve 33.3 1.1 1.9 0.7 0.8 0.4 42.7 17.9 4.9 0.6 0.8 0.4 (9.4) (16.8) (3.0) 0.2 - - Adjusted EBITDA 491.7 $ 400.2 $ 356.6 $ 294.5 $ 269.7 $ 273.5 $ 482.9 $ 342.4 $ 316.2 $ 287.9 $ 271.6 $ 274.8 $ (8.7) (57.8) (40.3) (6.6) 1.9 1.3 % of net revenue 32.7% 30.4% 29.1% 25.0% 23.2% 23.3% 32.2% 27.7% 27.8% 26.5% 25.4% 25.6% -0.5% -2.7% -1.3% 1.5% 2.3% 2.4% Sept. 11th Lender Presentation Revised 5 Year Plan Variance Fav / (Unfav) FY15 FY16 FY17 FY18 FY19 FY20 FY15 FY16 FY17 FY18 FY19 FY20 FY15 FY16 FY17 FY18 FY19 FY20 Revenue Print 1,010.8 $ 788.0 $ 618.5 $ 492.8 $ 394.3 $ 315.8 $ 1,011.2 $ 781.8 $ 639.5 $ 518.6 $ 422.1 $ 343.5 $ 0.4 $ (6.2) $ 21.0 $ 25.8 $ 27.7 $ 27.7 $ Digital 519.2 548.6 628.7 704.0 789.3 877.6 516.8 458.8 506.4 575.1 654.7 738.1 (2.5) (89.7) (122.3) (128.9) (134.7) (139.5) Other - - - - - - 1.1 10.9 10.1 9.1 8.2 7.3 1.1 10.9 10.1 9.1 8.2 7.3 Sales Allowance (27.3) (21.4) (20.0) (19.1) (18.9) (19.1) (28.4) (16.2) (18.5) (17.6) (17.4) (17.4) (1.1) 5.2 1.5 1.5 1.6 1.7 Total Revenue, Net 1,502.8 $ 1,315.2 $ 1,227.2 $ 1,177.7 $ 1,164.7 $ 1,174.3 $ 1,500.7 $ 1,235.4 $ 1,137.5 $ 1,085.1 $ 1,067.5 $ 1,071.5 $ (2.1) $ (79.8) $ (89.7) $ (92.5) $ (97.2) $ (102.8) $ Operating Expenses Sales 286.5 $ 257.7 $ 233.1 $ 222.5 $ 215.5 $ 212.4 $ 277.6 $ 241.5 $ 223.1 $ 211.1 $ 203.8 $ 196.9 $ 8.9 $ 16.2 $ 10.0 $ 11.4 $ 11.7 $ 15.5 $ Operations 151.4 122.5 110.0 100.0 91.8 82.7 148.7 120.5 109.1 99.5 91.6 82.8 2.7 2.0 0.9 0.4 0.2 (0.1) IT 114.2 99.0 99.0 99.0 99.0 99.0 113.3 106.7 97.7 96.7 95.6 90.7 0.8 (7.7) 1.3 2.3 3.4 8.3 Core Marketing 75.3 64.6 58.2 52.6 48.1 44.4 71.7 68.7 58.3 54.2 49.7 46.0 3.6 (4.1) (0.0) (1.5) (1.5) (1.6) Traffic 163.9 156.0 178.7 196.6 216.5 234.0 162.5 140.3 139.1 142.5 152.9 168.2 1.4 15.7 39.6 54.1 63.6 65.8 Direct Digital 101.3 105.8 115.4 124.5 134.7 145.3 99.1 116.6 123.3 136.0 150.0 162.2 2.2 (10.8) (7.9) (11.5) (15.3) (16.9) Finance 19.6 19.2 17.2 17.2 16.0 16.0 19.5 18.5 17.2 17.2 16.0 16.0 0.1 0.7 0.0 0.0 0.0 0.0 Human Resources 10.2 9.7 8.5 8.5 7.5 7.5 10.4 9.7 8.9 8.9 7.9 7.9 (0.2) 0.1 (0.4) (0.4) (0.4) (0.4) Legal 9.2 7.2 7.2 7.2 7.2 7.2 10.4 7.3 8.2 8.2 8.2 8.2 (1.3) (0.1) (0.9) (0.9) (0.9) (0.9) Executive 3.3 3.3 3.3 3.3 3.3 3.3 3.8 3.8 3.1 3.1 3.1 3.1 (0.4) (0.4) 0.2 0.2 0.2 0.2 Total Dept. Spending 934.8 $ 845.0 $ 830.8 $ 831.5 $ 839.9 $ 852.0 $ 916.9 $ 833.5 $ 788.0 $ 777.4 $ 778.9 $ 782.0 $ 17.9 $ 11.5 $ 42.8 $ 54.1 $ 61.0 $ 70.0 $ Net Cap. Spending 38.1 16.7 10.5 7.5 6.1 3.1 40.0 (3.9) 7.4 (1.9) (4.6) (6.9) (1.9) 20.6 3.0 9.4 10.7 10.0 Bad Debt 23.0 29.6 36.8 43.0 43.7 44.0 20.9 22.2 22.7 21.7 21.4 21.4 2.2 7.4 14.1 21.3 22.3 22.6 Other Period Exp. (18.2) 22.6 (9.4) 0.4 4.5 1.3 (2.7) 23.2 (1.8) (0.5) (0.6) (0.2) (15.5) (0.6) (7.6) 0.9 5.1 1.5 Total Expenses 977.8 913.9 868.7 882.4 894.2 900.5 975.0 875.1 816.4 796.7 795.1 796.4 2.8 38.8 52.3 85.7 99.1 104.1 EBITDA (Pro Forma) 525.0 $ 401.3 $ 358.5 $ 295.2 $ 270.5 $ 273.8 $ 525.7 $ 360.3 $ 321.1 $ 288.4 $ 272.4 $ 275.1 $ 0.6 $ (41.0) $ (37.4) $ (6.8) $ 1.9 $ 1.3 $ % of net revenue 34.9% 30.5% 29.2% 25.1% 23.2% 23.3% 35.0% 29.2% 28.2% 26.6% 25.5% 25.7% 0.1% -1.3% -1.0% 1.5% 2.3% 2.4% Cost to Achieve 33.3 1.1 1.9 0.7 0.8 0.4 42.7 17.9 4.9 0.6 0.8 0.4 (9.4) (16.8) (3.0) 0.2 - - Adjusted EBITDA 491.7 $ 400.2 $ 356.6 $ 294.5 $ 269.7 $ 273.5 $ 482.9 $ 342.4 $ 316.2 $ 287.9 $ 271.6 $ 274.8 $ (8.7) (57.8) (40.3) (6.6) 1.9 1.3 % of net revenue 32.7% 30.4% 29.1% 25.0% 23.2% 23.3% 32.2% 27.7% 27.8% 26.5% 25.4% 25.6% -0.5% -2.7% -1.3% 1.5% 2.3% 2.4%
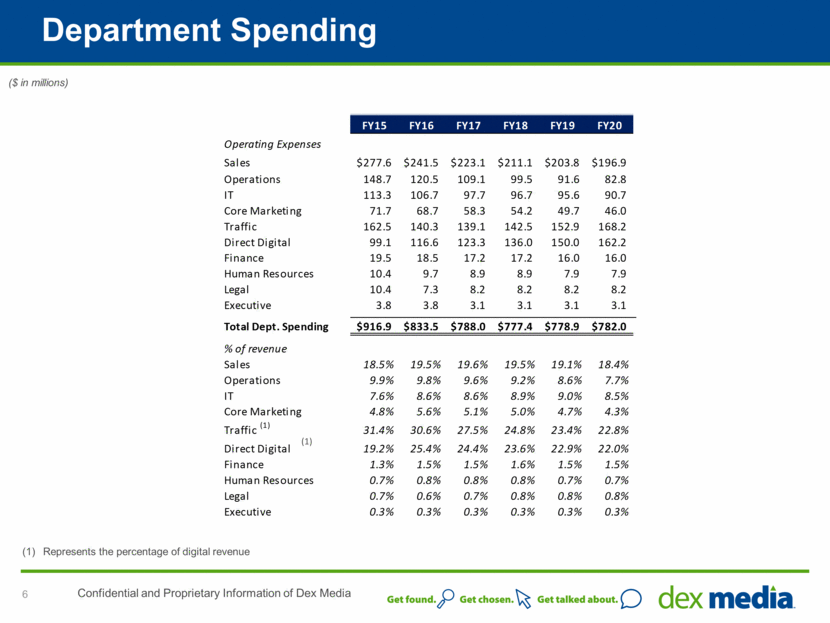
Department Spending 6 Confidential and Proprietary Information of Dex Media Represents the percentage of digital revenue ($ in millions) (1) Sept. 11th Lender Presentation Revised 5 Year Plan Variance Fav / (Unfav) FY15 FY16 FY17 FY18 FY19 FY20 FY15 FY16 FY17 FY18 FY19 FY20 FY15 FY16 FY17 FY18 FY19 FY20 Operating Expenses Sales 286.5 $ 257.7 $ 233.1 $ 222.5 $ 215.5 $ 212.4 $ 277.6 $ 241.5 $ 223.1 $ 211.1 $ 203.8 $ 196.9 $ 8.9 $ 16.2 $ 10.0 $ 11.4 $ 11.7 $ 15.5 $ Operations 151.4 122.5 110.0 100.0 91.8 82.7 148.7 120.5 109.1 99.5 91.6 82.8 2.7 2.0 0.9 0.4 0.2 (0.1) IT 114.2 99.0 99.0 99.0 99.0 99.0 113.3 106.7 97.7 96.7 95.6 90.7 0.8 (7.7) 1.3 2.3 3.4 8.3 Core Marketing 75.3 64.6 58.2 52.6 48.1 44.4 71.7 68.7 58.3 54.2 49.7 46.0 3.6 (4.1) (0.0) (1.5) (1.5) (1.6) Traffic 163.9 156.0 178.7 196.6 216.5 234.0 162.5 140.3 139.1 142.5 152.9 168.2 1.4 15.7 39.6 54.1 63.6 65.8 Direct Digital 101.3 105.8 115.4 124.5 134.7 145.3 99.1 116.6 123.3 136.0 150.0 162.2 2.2 (10.8) (7.9) (11.5) (15.3) (16.9) Finance 19.6 19.2 17.2 17.2 16.0 16.0 19.5 18.5 17.2 17.2 16.0 16.0 0.1 0.7 0.0 0.0 0.0 0.0 Human Resources 10.2 9.7 8.5 8.5 7.5 7.5 10.4 9.7 8.9 8.9 7.9 7.9 (0.2) 0.1 (0.4) (0.4) (0.4) (0.4) Legal 9.2 7.2 7.2 7.2 7.2 7.2 10.4 7.3 8.2 8.2 8.2 8.2 (1.3) (0.1) (0.9) (0.9) (0.9) (0.9) Executive 3.3 3.3 3.3 3.3 3.3 3.3 3.8 3.8 3.1 3.1 3.1 3.1 (0.4) (0.4) 0.2 0.2 0.2 0.2 Total Dept. Spending 934.8 $ 845.0 $ 830.8 $ 831.5 $ 839.9 $ 852.0 $ 916.9 $ 833.5 $ 788.0 $ 777.4 $ 778.9 $ 782.0 $ 17.9 $ 11.5 $ 42.8 $ 54.1 $ 61.0 $ 70.0 $ % of revenue Sales 19.1% 19.6% 19.0% 18.9% 18.5% 18.1% 18.5% 19.5% 19.6% 19.5% 19.1% 18.4% 0.6% 0.0% -0.6% -0.6% -0.6% -0.3% Operations 10.1% 9.3% 9.0% 8.5% 7.9% 7.0% 9.9% 9.8% 9.6% 9.2% 8.6% 7.7% 0.2% -0.4% -0.6% -0.7% -0.7% -0.7% IT 7.6% 7.5% 8.1% 8.4% 8.5% 8.4% 7.6% 8.6% 8.6% 8.9% 9.0% 8.5% 0.0% -1.1% -0.5% -0.5% -0.5% 0.0% Core Marketing 5.0% 4.9% 4.7% 4.5% 4.1% 3.8% 4.8% 5.6% 5.1% 5.0% 4.7% 4.3% 0.2% -0.6% -0.4% -0.5% -0.5% -0.5% Traffic (1) 31.6% 28.4% 28.4% 27.9% 27.4% 26.7% 31.4% 30.6% 27.5% 24.8% 23.4% 22.8% 0.1% -2.1% 1.0% 3.1% 4.1% 3.9% Direct Digital (2) 19.5% 19.3% 18.4% 17.7% 17.1% 16.6% 19.2% 25.4% 24.4% 23.6% 22.9% 22.0% 0.3% -6.1% -6.0% -6.0% -5.9% -5.4% Finance 1.3% 1.5% 1.4% 1.5% 1.4% 1.4% 1.3% 1.5% 1.5% 1.6% 1.5% 1.5% 0.0% 0.0% -0.1% -0.1% -0.1% -0.1% Human Resources 0.7% 0.7% 0.7% 0.7% 0.6% 0.6% 0.7% 0.8% 0.8% 0.8% 0.7% 0.7% 0.0% 0.0% -0.1% -0.1% -0.1% -0.1% Legal 0.6% 0.6% 0.6% 0.6% 0.6% 0.6% 0.7% 0.6% 0.7% 0.8% 0.8% 0.8% -0.1% 0.0% -0.1% -0.1% -0.1% -0.1% Executive 0.2% 0.3% 0.3% 0.3% 0.3% 0.3% 0.3% 0.3% 0.3% 0.3% 0.3% 0.3% 0.0% -0.1% 0.0% 0.0% 0.0% 0.0% Sept. 11th Lender Presentation Revised 5 Year Plan Variance Fav / (Unfav) FY15 FY16 FY17 FY18 FY19 FY20 FY15 FY16 FY17 FY18 FY19 FY20 FY15 FY16 FY17 FY18 FY19 FY20 Operating Expenses Sales 286.5 $ 257.7 $ 233.1 $ 222.5 $ 215.5 $ 212.4 $ 277.6 $ 241.5 $ 223.1 $ 211.1 $ 203.8 $ 196.9 $ 8.9 $ 16.2 $ 10.0 $ 11.4 $ 11.7 $ 15.5 $ Operations 151.4 122.5 110.0 100.0 91.8 82.7 148.7 120.5 109.1 99.5 91.6 82.8 2.7 2.0 0.9 0.4 0.2 (0.1) IT 114.2 99.0 99.0 99.0 99.0 99.0 113.3 106.7 97.7 96.7 95.6 90.7 0.8 (7.7) 1.3 2.3 3.4 8.3 Core Marketing 75.3 64.6 58.2 52.6 48.1 44.4 71.7 68.7 58.3 54.2 49.7 46.0 3.6 (4.1) (0.0) (1.5) (1.5) (1.6) Traffic 163.9 156.0 178.7 196.6 216.5 234.0 162.5 140.3 139.1 142.5 152.9 168.2 1.4 15.7 39.6 54.1 63.6 65.8 Direct Digital 101.3 105.8 115.4 124.5 134.7 145.3 99.1 116.6 123.3 136.0 150.0 162.2 2.2 (10.8) (7.9) (11.5) (15.3) (16.9) Finance 19.6 19.2 17.2 17.2 16.0 16.0 19.5 18.5 17.2 17.2 16.0 16.0 0.1 0.7 0.0 0.0 0.0 0.0 Human Resources 10.2 9.7 8.5 8.5 7.5 7.5 10.4 9.7 8.9 8.9 7.9 7.9 (0.2) 0.1 (0.4) (0.4) (0.4) (0.4) Legal 9.2 7.2 7.2 7.2 7.2 7.2 10.4 7.3 8.2 8.2 8.2 8.2 (1.3) (0.1) (0.9) (0.9) (0.9) (0.9) Executive 3.3 3.3 3.3 3.3 3.3 3.3 3.8 3.8 3.1 3.1 3.1 3.1 (0.4) (0.4) 0.2 0.2 0.2 0.2 Total Dept. Spending 934.8 $ 845.0 $ 830.8 $ 831.5 $ 839.9 $ 852.0 $ 916.9 $ 833.5 $ 788.0 $ 777.4 $ 778.9 $ 782.0 $ 17.9 $ 11.5 $ 42.8 $ 54.1 $ 61.0 $ 70.0 $ % of revenue Sales 19.1% 19.6% 19.0% 18.9% 18.5% 18.1% 18.5% 19.5% 19.6% 19.5% 19.1% 18.4% 0.6% 0.0% -0.6% -0.6% -0.6% -0.3% Operations 10.1% 9.3% 9.0% 8.5% 7.9% 7.0% 9.9% 9.8% 9.6% 9.2% 8.6% 7.7% 0.2% -0.4% -0.6% -0.7% -0.7% -0.7% IT 7.6% 7.5% 8.1% 8.4% 8.5% 8.4% 7.6% 8.6% 8.6% 8.9% 9.0% 8.5% 0.0% -1.1% -0.5% -0.5% -0.5% 0.0% Core Marketing 5.0% 4.9% 4.7% 4.5% 4.1% 3.8% 4.8% 5.6% 5.1% 5.0% 4.7% 4.3% 0.2% -0.6% -0.4% -0.5% -0.5% -0.5% Traffic (1) 31.6% 28.4% 28.4% 27.9% 27.4% 26.7% 31.4% 30.6% 27.5% 24.8% 23.4% 22.8% 0.1% -2.1% 1.0% 3.1% 4.1% 3.9% Direct Digital (2) 19.5% 19.3% 18.4% 17.7% 17.1% 16.6% 19.2% 25.4% 24.4% 23.6% 22.9% 22.0% 0.3% -6.1% -6.0% -6.0% -5.9% -5.4% Finance 1.3% 1.5% 1.4% 1.5% 1.4% 1.4% 1.3% 1.5% 1.5% 1.6% 1.5% 1.5% 0.0% 0.0% -0.1% -0.1% -0.1% -0.1% Human Resources 0.7% 0.7% 0.7% 0.7% 0.6% 0.6% 0.7% 0.8% 0.8% 0.8% 0.7% 0.7% 0.0% 0.0% -0.1% -0.1% -0.1% -0.1% Legal 0.6% 0.6% 0.6% 0.6% 0.6% 0.6% 0.7% 0.6% 0.7% 0.8% 0.8% 0.8% -0.1% 0.0% -0.1% -0.1% -0.1% -0.1% Executive 0.2% 0.3% 0.3% 0.3% 0.3% 0.3% 0.3% 0.3% 0.3% 0.3% 0.3% 0.3% 0.0% -0.1% 0.0% 0.0% 0.0% 0.0%
Appendix
Dex Media
Local Digital Gross Revenue
Reconciliation to Operating Revenue (GAAP)
Q1, Q2 and Q3 2015
(in millions)
|
|
|
2015 |
| |||||||
|
|
|
Q1 |
|
Q2 |
|
Q3 |
| |||
|
|
|
|
|
|
|
|
| |||
|
Local Digital Gross Revenue |
|
$ |
126.5 |
|
$ |
125.2 |
|
$ |
115.8 |
|
|
|
|
|
|
|
|
|
| |||
|
All Other Revenue |
|
279.0 |
|
262.3 |
|
248.0 |
| |||
|
|
|
|
|
|
|
|
| |||
|
Operating Revenue (GAAP) |
|
$ |
405.5 |
|
$ |
387.5 |
|
$ |
363.8 |
|
|
|
|
|
|
|
|
|
| |||
|
Operating Revenue (Per Form 10-Q) |
|
$ |
406 |
|
$ |
387 |
|
$ |
364 |
|
