Attached files
| file | filename |
|---|---|
| 8-K - CURRENT REPORT OF MATERIAL EVENTS OR CORPORATE CHANGES - Thryv Holdings, Inc. | a15-21744_18k.htm |
| EX-99.3 - EX-99.3 - Thryv Holdings, Inc. | a15-21744_1ex99d3.htm |
| EX-99.2 - EX-99.2 - Thryv Holdings, Inc. | a15-21744_1ex99d2.htm |
| EX-10.1 - EX-10.1 - Thryv Holdings, Inc. | a15-21744_1ex10d1.htm |
| EX-99.4 - EX-99.4 - Thryv Holdings, Inc. | a15-21744_1ex99d4.htm |
Exhibit 99.1
September 11, 2015 Dex Media Long Term Business Plan

Forward-Looking Statements: Some statements included in this presentation constitute forward-looking statements within the meaning of the Private Securities Litigation Reform Act of 1995 and the federal securities laws. Statements that include the words “may,” “will,” “could,” “should,” “would,” “believe,” “anticipate,” “forecast,” “estimate,” “expect,” “preliminary,” “intend,” “plan,” “project,” “outlook” and similar statements of a future or forward-looking nature identify forward-looking statements. You should not place undue reliance on these statements, as they are not guarantees of future performance. Forward-looking statements provide current expectations with respect to our financial performance and future events with respect to our business and industry in general. Forward-looking statements are based on certain assumptions and include any statement that does not directly relate to any historical or current fact. Forward-looking statements address matters that involve risks and uncertainties, and include, without limitation, future operating and financial performance of the Company (including, without limitation, the future prospects for and stability of the industry in which the Dex Media, Inc. (the “Company”) operates, anticipated future revenues, EBITDA margins and free cash flow for the remainder of 2015, the implementation of the business transformation program and the ability of the Company to retain existing business and to obtain and retain new business. Accordingly, there are or will be important factors that could cause our actual results to differ materially from those indicated in these statements. We believe that these factors include, but are not limited to, the risks related to the following: our ability to provide assurance for the long-term continued viability of our business; our ability to comply with the financial covenants and other restrictive covenants in our credit facilities; limitations on our operating and strategic flexibility and the ability to operate our business, finance our capital needs or expand business strategies under the terms of our credit facilities; limited access to capital markets and increased borrowing costs resulting from our leveraged capital structure and debt ratings; our ability to obtain additional financing or refinance our existing indebtedness on satisfactory terms or at all; our ability to accurately report our financial results due to a material weakness in our internal control over financial reporting; possible changes in our credit rating; changes in our operating performance; our ability to implement our business transformation program as planned; our ability to realize the anticipated benefits in the amounts and at the times expected from the business transformation program; the risk that the amount of costs associated with our business transformation program will exceed estimates; the risk that our common stock may be delisted from The Nasdaq Stock Market LLC; reduced advertising spending and increased contract cancellations by our clients, which causes reduced revenue; declining use of print yellow page directories by consumers; our ability to collect trade receivables from clients to whom we extend credit; credit risk associated with our reliance on small and medium sized businesses as clients; our ability to anticipate or respond to changes in technology and user preferences; our ability to maintain agreements with major Internet search and local media companies; competition from other yellow page directory publishers and other traditional and new media including increased competition from existing and emerging digital technologies; changes in the availability and cost of paper and other raw materials used to print our directories; our reliance on third-party providers for printing, publishing and distribution services; our ability to attract and retain qualified key personnel; our ability to maintain good relations with our unionized employees; changes in labor, business, political and economic conditions; changes in governmental regulations and policies and actions of federal, state and local municipalities impacting our businesses; the outcome of pending or future litigation and other claims; and other events beyond our control that may result in unexpected adverse operating results. The foregoing factors should not be construed as exhaustive and should be read together with the other cautionary statements included the Company’s filings made with the Securities and Exchange Commission (“SEC”), including those under “Risk Factors” therein. If one or more events related to these or other risks or uncertainties materialize, or if our underlying assumptions prove to be incorrect, actual results may differ materially from what we anticipate. All forward-looking statements included in this presentation are expressly qualified in their entirety by the foregoing cautionary statements. You are cautioned not to place undue reliance on these forward-looking statements, which speak only as of the date hereof and, other than as required by law, we undertake no obligation to publicly update or revise any forward-looking statements, whether as a result of new information, future events or otherwise. Non-GAAP Information: The Company believes that certain non-GAAP measures of financial results (including EBITDA) provide useful information to management and investors regarding certain financial and business trends relating to the Company’s financial condition and results of operations. The Company’s management uses these non-GAAP measures to compare the Company’s performance to that of prior periods for trend analyses, for purposes of determining management incentive compensation, and for budgeting and planning purposes. These measures are used in monthly financial reports prepared for management and the Company’s board of directors. The Company believes that the use of these non-GAAP financial measures provides an additional tool for investors to use in evaluating ongoing operating results and trends and in comparing the Company’s financial measures with similar companies[, many of which present similar non-GAAP financial measures to investors]. Management does not consider these non-GAAP measures in isolation or as an alternative to financial measures determined in accordance with GAAP. The principal limitation of these non-GAAP financial measures is that they exclude significant expenses and income that are required by GAAP to be recorded in the Company’s financial statements. In addition, they are subject to inherent limitations as they reflect the exercise of judgments by management about which expenses and income are excluded or included in determining these non-GAAP financial measures. In order to compensate for these limitations, management presents non-GAAP financial measures in connection with GAAP results. 2 Confidential and Proprietary Information of Dex Media Safe Harbor Statement

Agenda 3 Confidential and Proprietary Information of Dex Media Current Business New Digital Products Current Trends Key Metrics and Historical Financials Risk and Opportunities Tax Attributes
Current Business 4 Confidential and Proprietary Information of Dex Media

Background Strategy Review – Spring / Summer 2014 Retained by Dex Media Board to assess strategy and develop plan Recognized that Dex Media’s strategy was focused on a high churn, low margin, commodity business Developed new mission / cause to move into high growth, differentiated, sticky Beyond Leads segment 5 Confidential and Proprietary Information of Dex Media
What We Inherited Challenges in Dex Media organization Strategy based on Digital growth at all cost Heavy focus on SEM sales (low margin, high churn) Harvesting of / disinvestment in Print IYPs in maintenance mode (improvements paused) De-emphasis on recurring revenue products (websites, video) Heavy SEM focus led to misalignments / poor execution Management and sales rep incentives misaligned SEM campaigns not competitive No post sales service or follow up Ad Sales metric encouraged ‘pull forward’ sales strategy Other significant organizational challenges: Core systems duplicative, never integrated Customer experience confusing – too many touch-points Complex product set, sales calls meandering Little prospecting, no lead generation for customer acquisition Onerous capital structure 6 Confidential and Proprietary Information of Dex Media
We have a new mission that the company believes in and is excited about: Small businesses are under assault - Larger, regional & national competitors, Local On Demand Economy players, and Google/Amazon/Facebook are grabbing share from SMBs through use of sophisticated web marketing tools, especially mobile. Cause: Help SMBs fight back and thrive using today’s sophisticated web and mobile marketing tools Vision For The Future 7 Confidential and Proprietary Information of Dex Media

Vision For The Future Cornerstone approach: Wedge Product DexHub and DexLnk Print, IYP, and SEM continue to have a role Several critical changes are underway Other Key Elements to Delivering on the Plan Metrics to evaluate the new strategy are being developed 8 Confidential and Proprietary Information of Dex Media
New Digital Products 9 Confidential and Proprietary Information of Dex Media

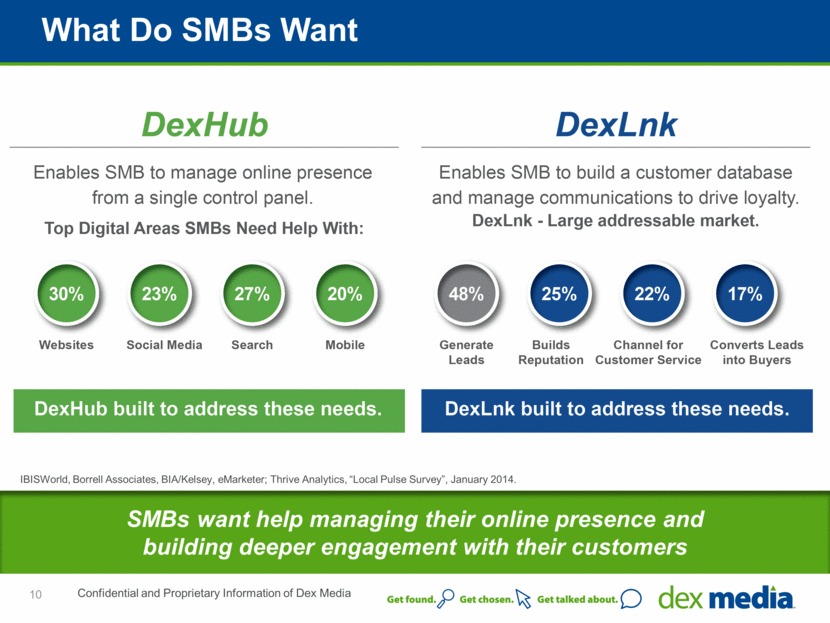
What Do SMBs Want SMBs want help managing their online presence and building deeper engagement with their customers IBISWorld, Borrell Associates, BIA/Kelsey, eMarketer; Thrive Analytics, “Local Pulse Survey”, January 2014. Confidential and Proprietary Information of Dex Media 10
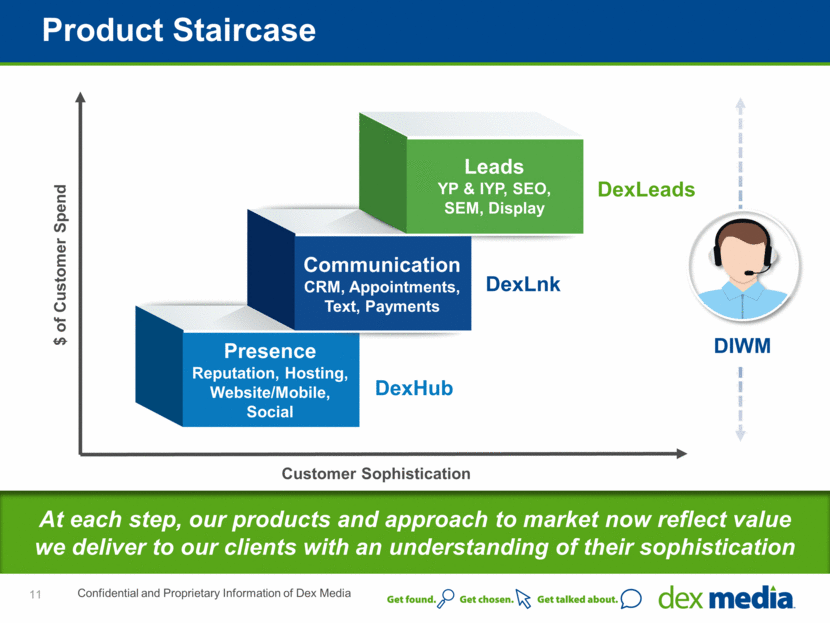
Presence Reputation, Hosting, Website/Mobile, Social Leads YP & IYP, SEO, SEM, Display Communication CRM, Appointments, Text, Payments Product Staircase DexLeads DexLnk DexHub $ of Customer Spend Customer Sophistication At each step, our products and approach to market now reflect value we deliver to our clients with an understanding of their sophistication DIWM 11 Confidential and Proprietary Information of Dex Media
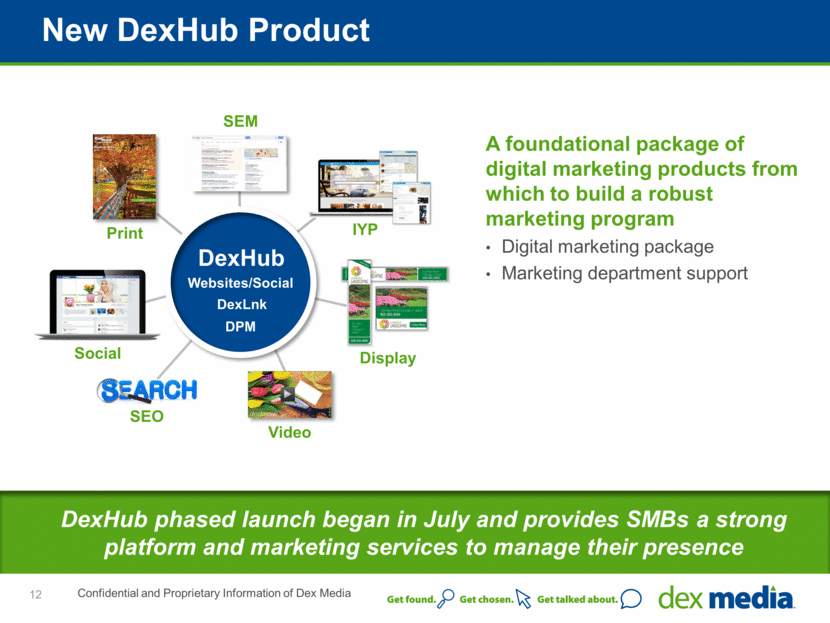
New DexHub Product IYP Print Social Video Display SEM DexHub Websites/Social DPM DexLnk SEO DexHub phased launch began in July and provides SMBs a strong platform and marketing services to manage their presence A foundational package of digital marketing products from which to build a robust marketing program Digital marketing package Marketing department support 12 Confidential and Proprietary Information of Dex Media
A comprehensive and easy way to manage your customer database and appointment scheduling through a simple user interface Customer profiles Targeted messaging Cultivate loyal relationships New DexLnk Product DexLnk CRM pilot launched in April and serves SMBs’ need to build engagement with their customers 13 Confidential and Proprietary Information of Dex Media

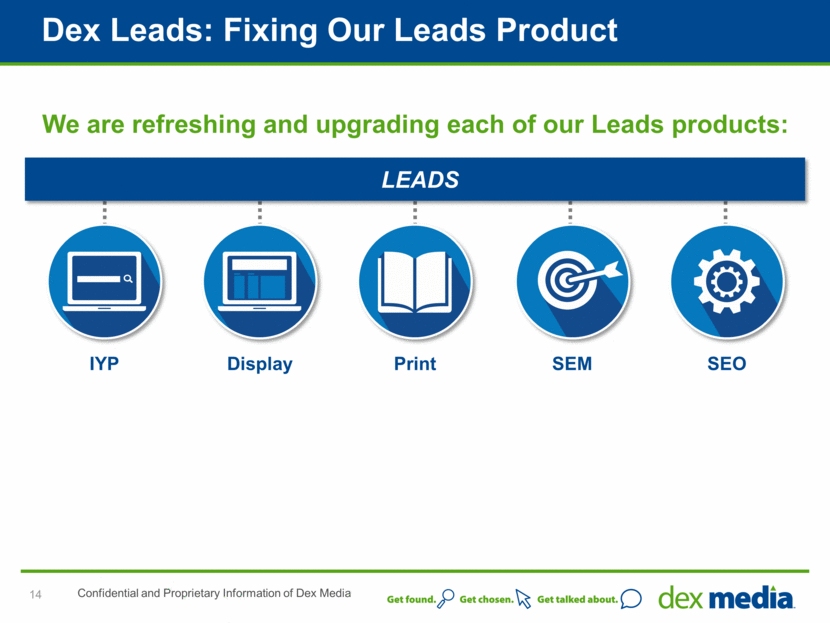
Dex Leads: Fixing Our Leads Product We are refreshing and upgrading each of our Leads products: LEADS Display SEM Print IYP SEO 14 Confidential and Proprietary Information of Dex Media
Driving Prospect Engagement (Leads) Promote solutions to SMB marketing pain points that generate interest and engagement Ramp up effort to generate quality small business leads for Marketing Consultants Increased investment Hired new direct response agency (KERN) Take advantage of improved marketing technology Focus on lead response management 15 Confidential and Proprietary Information of Dex Media Prospects Inquiries MQL (Marketing Qualified Lead) SAL (Sales Accepted Lead) SQL (Sales Qualified Lead) Closed (Won/Lost )

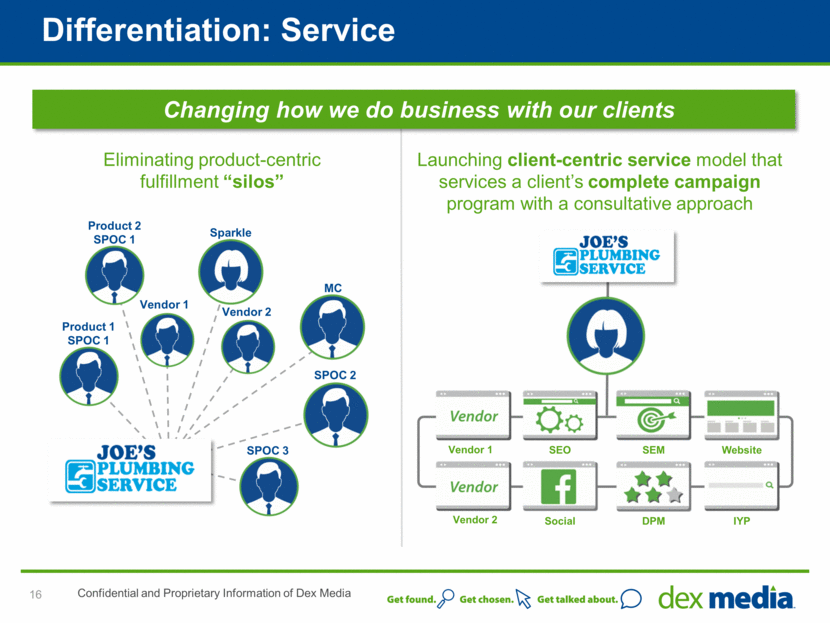
Differentiation: Service Changing how we do business with our clients Eliminating product-centric fulfillment “silos” Launching client-centric service model that services a client’s complete campaign program with a consultative approach MC SPOC 2 SPOC 3 Sparkle Vendor 1 Product 2 SPOC 1 Vendor 2 Product 1 SPOC 1 SEO SEM Website Social DPM IYP Vendor 1 Vendor 2 16 Confidential and Proprietary Information of Dex Media
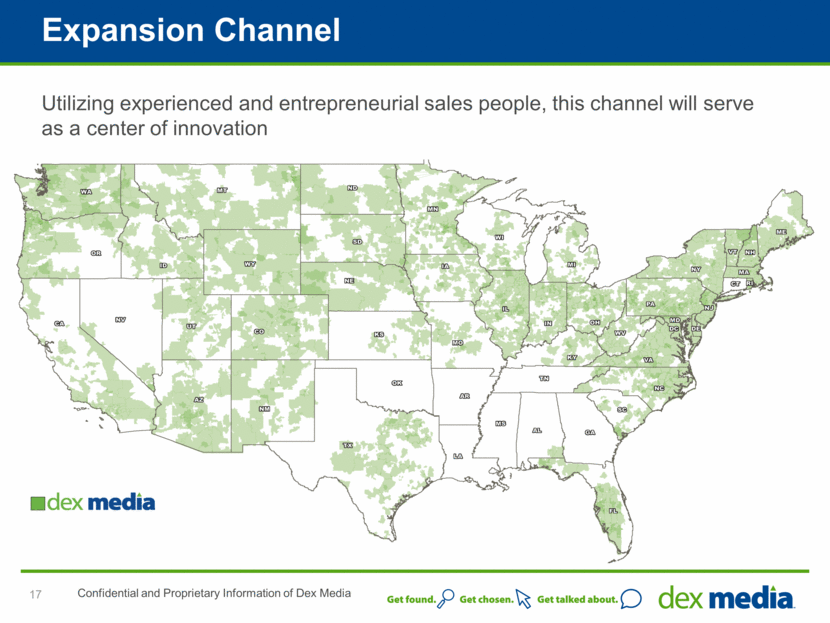
Utilizing experienced and entrepreneurial sales people, this channel will serve as a center of innovation Expansion Channel 17 Confidential and Proprietary Information of Dex Media
Current Trends 18 Confidential and Proprietary Information of Dex Media

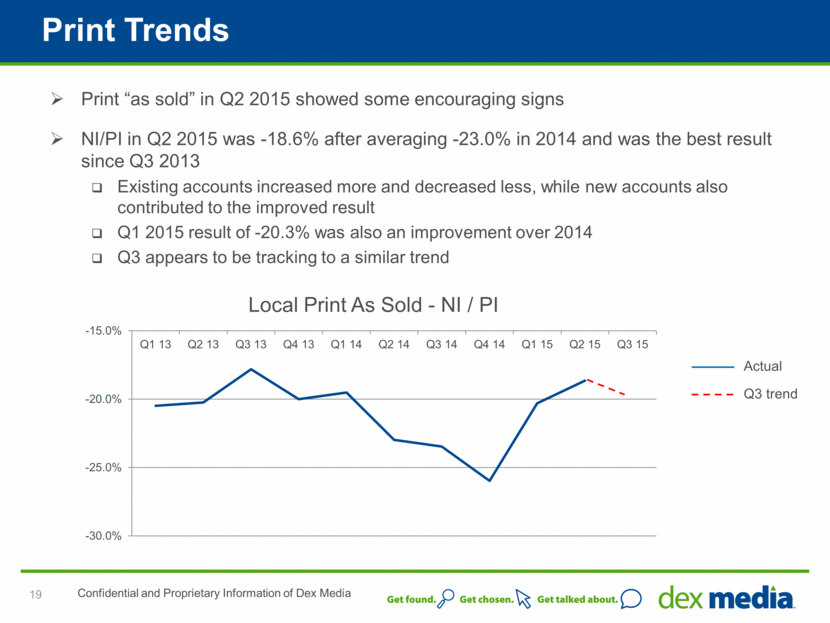
Print Trends 19 > 490,000 Clients 38% Digital Pro Forma EBITDA $715 Million Free Cash Flow $370 Million Confidential and Proprietary Information of Dex Media Print “as sold” in Q2 2015 showed some encouraging signs NI/PI in Q2 2015 was -18.6% after averaging -23.0% in 2014 and was the best result since Q3 2013 Existing accounts increased more and decreased less, while new accounts also contributed to the improved result Q1 2015 result of -20.3% was also an improvement over 2014 Q3 appears to be tracking to a similar trend Actual Q3 trend -30.0% -25.0% -20.0% -15.0% Q1 13 Q2 13 Q3 13 Q4 13 Q1 14 Q2 14 Q3 14 Q4 14 Q1 15 Q2 15 Q3 15 Local Print As Sold - NI / PI
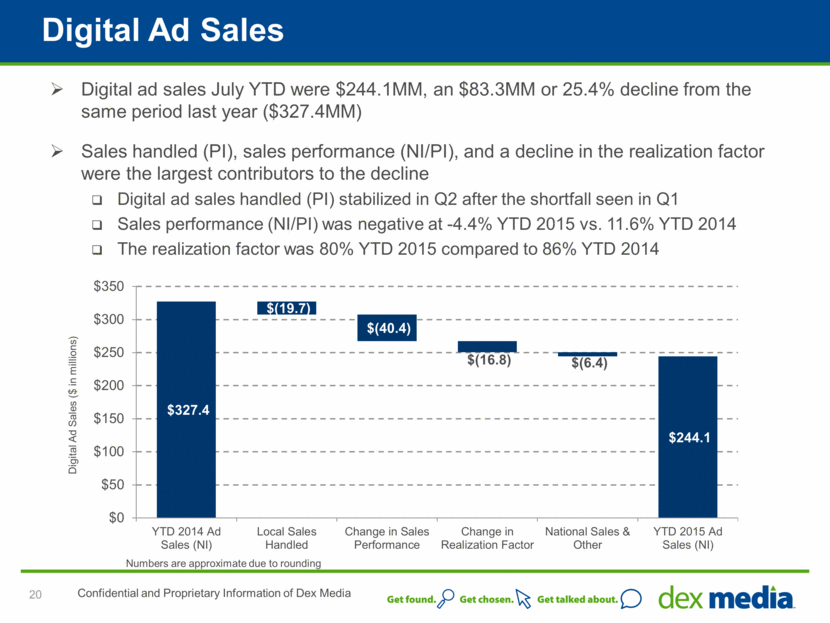
Digital Ad Sales 20 > 490,000 Clients 38% Digital Pro Forma EBITDA $715 Million Free Cash Flow $370 Million Confidential and Proprietary Information of Dex Media Digital ad sales July YTD were $244.1MM, an $83.3MM or 25.4% decline from the same period last year ($327.4MM) Sales handled (PI), sales performance (NI/PI), and a decline in the realization factor were the largest contributors to the decline Digital ad sales handled (PI) stabilized in Q2 after the shortfall seen in Q1 Sales performance (NI/PI) was negative at -4.4% YTD 2015 vs. 11.6% YTD 2014 The realization factor was 80% YTD 2015 compared to 86% YTD 2014 Digital Ad Sales ($ in millions) Numbers are approximate due to rounding $327.4 $(19.7) $(40.4) $(16.8) $(6.4) $244.1 $0 $50 $100 $150 $200 $250 $300 $350 YTD 2014 Ad Sales (NI) Local Sales Handled Change in Sales Performance Change in Realization Factor National Sales & Other YTD 2015 Ad Sales (NI)
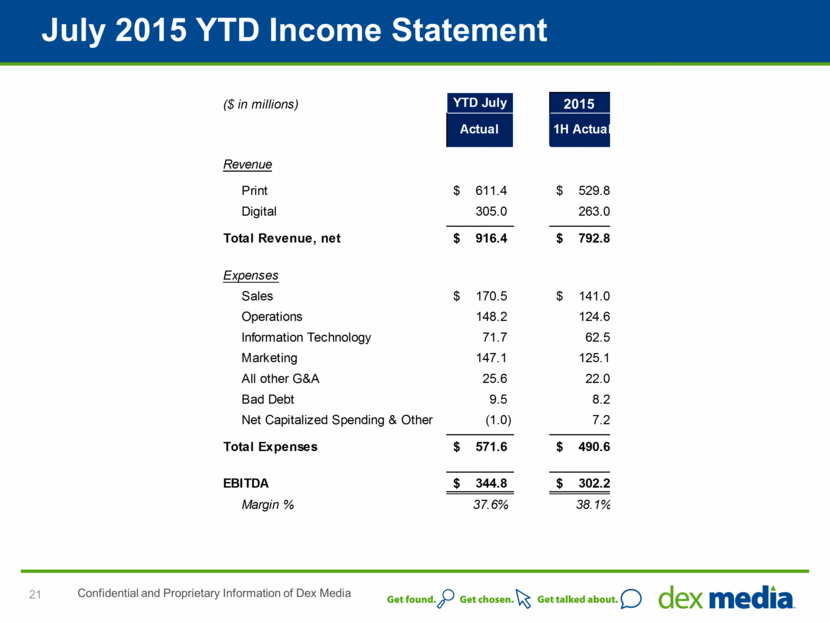
July 2015 YTD Income Statement 21 Confidential and Proprietary Information of Dex Media 2015 ($ in millions) YTD July Revenue Print 611.4 $ 529.8 $ 463.0 $ 992.8 $ Digital 305.0 263.0 247.0 510.0 Total Revenue, net 916.4 $ 792.8 $ 710.0 $ 1,502.8 $ Expenses Sales 170.5 $ 141.0 $ 145.4 $ 286.4 $ Operations 148.2 124.6 120.1 244.7 Information Technology 71.7 62.5 51.7 114.2 Marketing 147.1 125.1 122.2 247.3 All other G&A 25.6 22.0 20.2 42.2 Bad Debt 9.5 8.2 14.7 22.9 Net Capitalized Spending & Other (1.0) 7.2 12.8 20.0 Total Expenses 571.6 $ 490.6 $ 487.1 $ 977.7 $ EBITDA 344.8 $ 302.2 $ 222.9 $ 525.1 $ Margin % 37.6% 38.1% 31.4% 34.9% Notes: EBITDA includes impact of ECL 2015 Actual 1H Actual 2H LTF 2015 LTF
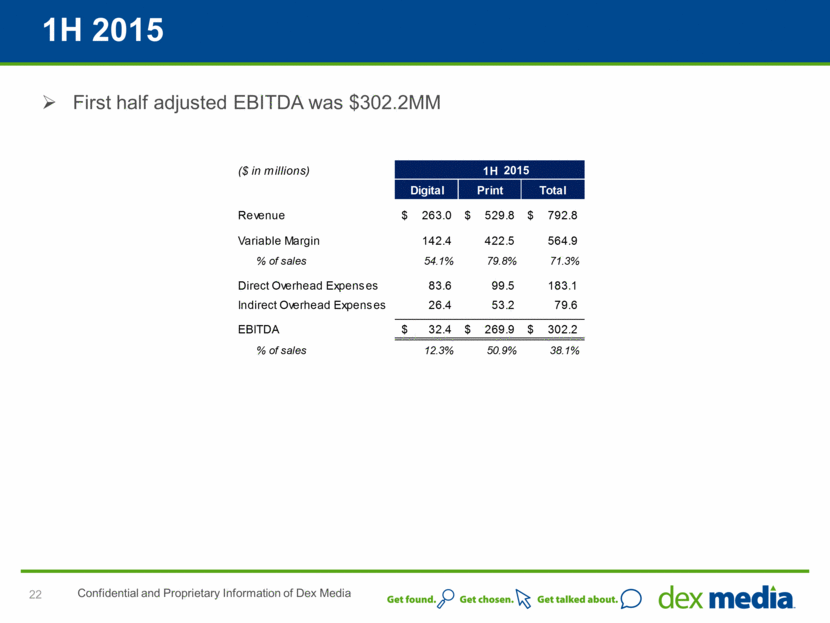
1H 2015 22 Confidential and Proprietary Information of Dex Media First half adjusted EBITDA was $302.2MM 2015 ($ in millions) 1H 2H Variance Digital Print Total Digital Print Total Digital Print Total Revenue 263.0 $ 529.8 $ 792.8 $ 247.0 $ 463.0 $ 710.0 $ (16.0) $ (66.8) $ (82.8) $ Variable Margin 142.4 422.5 564.9 131.4 364.6 496.0 (11.0) (58.0) (69.0) % of sales 54.1% 79.8% 71.3% 53.2% 78.7% 69.9% 68.9% 86.8% 83.3% Direct Overhead Expenses 83.6 99.5 183.1 83.3 102.8 186.1 0.3 (3.3) (3.0) Indirect Overhead Expenses 26.4 53.2 79.6 30.6 56.4 87.0 (4.1) (3.3) (7.4) EBITDA 32.4 $ 269.9 $ 302.2 $ 17.5 $ 205.3 $ 222.9 $ (14.8) $ (64.5) $ (79.4) $ % of sales 12.3% 50.9% 38.1% 7.1% 44.3% 31.4% 92.8% 96.6% 95.9%
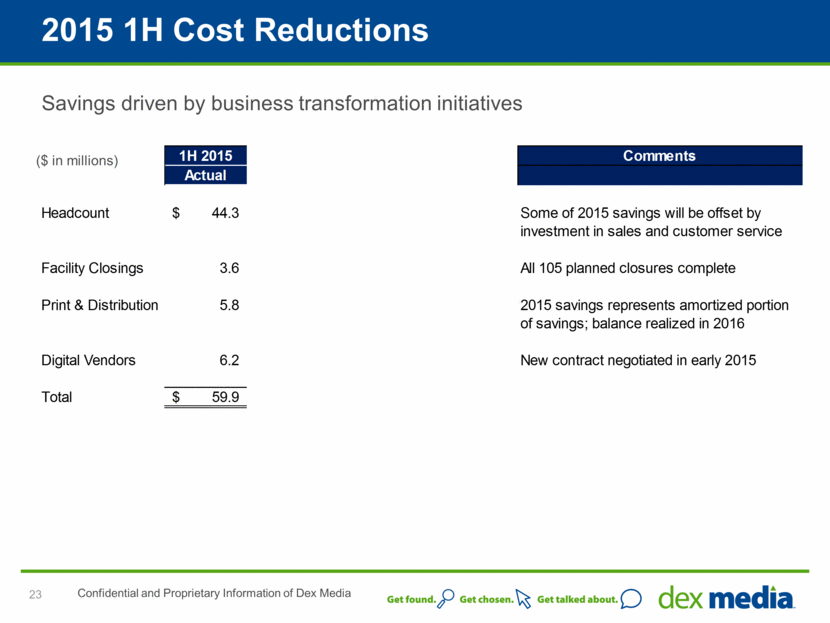
2015 1H Cost Reductions 23 Confidential and Proprietary Information of Dex Media Savings driven by business transformation initiatives ($ in millions) 1H 2015 2H 2015 2015 LTF Run Rate Comments Actual Projected Savings Headcount 44.3 $ 34.7 $ 79.0 $ 87.0 $ Some of 2015 savings will be offset by investment in sales and customer service Facility Closings 3.6 7.4 11.0 19.0 All 105 planned closures complete Print & Distribution 5.8 4.2 10.0 42.0 2015 savings represents amortized portion of savings; balance realized in 2016 Digital Vendors 6.2 3.8 10.0 12.0 New contract negotiated in early 2015 Total 59.9 $ 50.1 $ 110.0 $ 160.0 $
Key Metrics and Historical Financials 24 Confidential and Proprietary Information of Dex Media

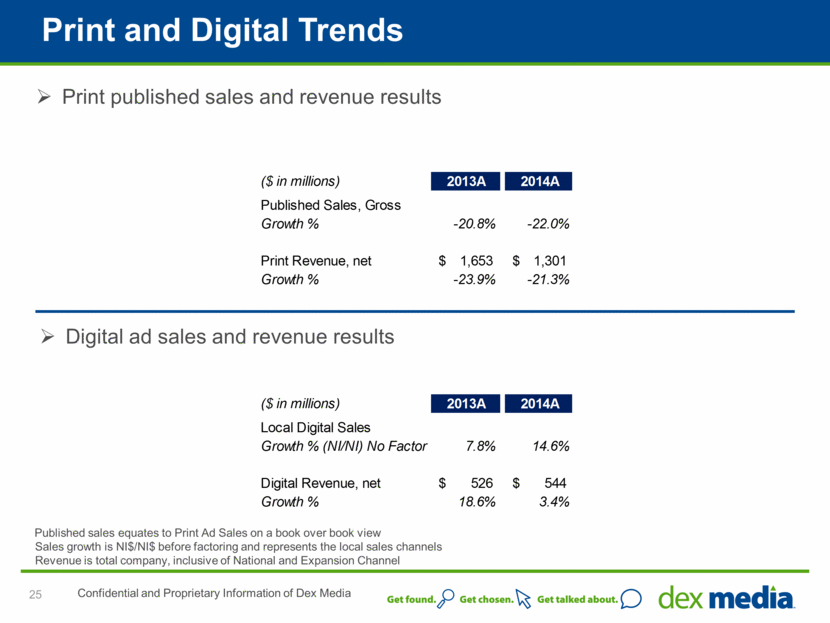
Print and Digital Trends 25 Confidential and Proprietary Information of Dex Media Published sales equates to Print Ad Sales on a book over book view Print published sales and revenue results Digital ad sales and revenue results Sales growth is NI$/NI$ before factoring and represents the local sales channels Revenue is total company, inclusive of National and Expansion Channel ($ in millions) 2013A 2014A 2015P 2016P 2017P 2018P 2019P 2020P Published Sales, Gross Growth % -20.8% -22.0% -23.6% -21.5% -20.0% -20.0% -20.0% -20.0% Print Revenue, net 1,653 $ 1,301 $ 993 $ 775 $ 609 $ 485 $ 388 $ 311 $ Growth % -23.9% -21.3% -23.7% -21.9% -21.5% -20.3% -20.0% -19.9% ($ in millions) 2013A 2014A 2015P 2016P 2017P 2018P 2019P 2020P Local Digital Sales Growth % (NI/NI) No Factor 7.8% 14.6% -11.3% 7.7% 7.6% 8.0% 8.0% 8.0% Digital Revenue, net 526 $ 544 $ 510 $ 540 $ 619 $ 693 $ 777 $ 864 $ Growth % 18.6% 3.4% -6.2% 5.8% 14.6% 12.0% 12.1% 11.2%
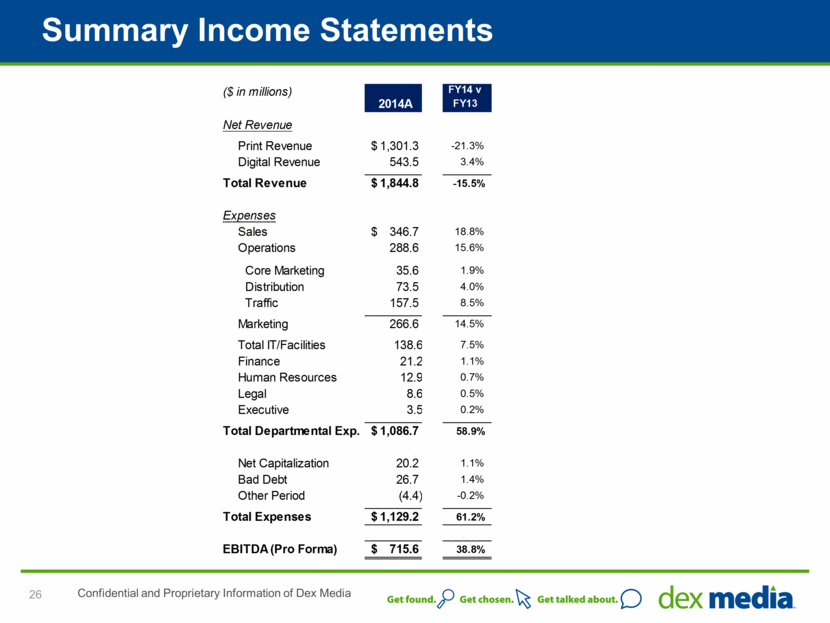
Summary Income Statements 26 Confidential and Proprietary Information of Dex Media ($ in millions) 2014A 2015P 2016P 2017P 2018P 2019P 2020P FY14 v FY13 FY15 v FY14 FY16 v FY15 FY17 v FY16 FY18 v FY17 FY19 v FY18 FY20 v FY19 Net Revenue Growth % Print Revenue 1,301.3 $ 992.8 $ 775.4 $ 608.6 $ 484.9 $ 388.0 $ 310.7 $ -21.3% -23.7% -21.9% -21.5% -20.3% -20.0% -19.9% Digital Revenue 543.5 510.0 539.8 618.6 692.8 776.7 863.6 3.4% -6.2% 5.8% 14.6% 12.0% 12.1% 11.2% Total Revenue 1,844.8 $ 1,502.8 $ 1,315.2 $ 1,227.2 $ 1,177.7 $ 1,164.7 $ 1,174.4 $ -15.5% -18.5% -12.5% -6.7% -4.0% -1.1% 0.8% Expenses % of Revenue Sales 346.7 $ 286.4 $ 257.6 $ 233.3 $ 222.4 $ 215.7 $ 212.1 $ 18.8% 19.1% 19.6% 19.0% 18.9% 18.5% 18.1% Operations 288.6 244.7 220.0 216.9 215.7 217.5 218.8 15.6% 16.3% 16.7% 17.7% 18.3% 18.7% 18.6% Core Marketing 35.6 32.1 29.9 27.2 24.9 23.4 22.5 1.9% 2.1% 2.3% 2.2% 2.1% 2.0% 1.9% Distribution 73.5 51.3 43.0 39.5 36.4 33.7 31.2 4.0% 3.4% 3.3% 3.2% 3.1% 2.9% 2.7% Traffic 157.5 163.9 156.0 178.7 196.6 216.5 234.0 8.5% 10.9% 11.9% 14.6% 16.7% 18.6% 19.9% Marketing 266.6 247.3 228.9 245.4 257.9 273.6 287.7 14.5% 16.5% 17.4% 20.0% 21.9% 23.5% 24.5% Total IT/Facilities 138.6 114.2 99 99 99 99 99 7.5% 7.6% 7.5% 8.1% 8.4% 8.5% 8.4% Finance 21.2 19.6 19.2 17.2 17.2 16 16 1.1% 1.3% 1.5% 1.4% 1.5% 1.4% 1.4% Human Resources 12.9 10.1 9.7 8.5 8.5 7.5 7.5 0.7% 0.7% 0.7% 0.7% 0.7% 0.6% 0.6% Legal 8.6 9.2 7.3 7.3 7.3 7.3 7.3 0.5% 0.6% 0.6% 0.6% 0.6% 0.6% 0.6% Executive 3.5 3.3 3.3 3.3 3.3 3.3 3.3 0.2% 0.2% 0.3% 0.3% 0.3% 0.3% 0.3% Total Departmental Exp. 1,086.7 $ 934.8 $ 845.0 $ 830.9 $ 831.3 $ 839.9 $ 851.7 $ 58.9% 62.2% 64.2% 67.7% 70.6% 72.1% 72.5% Net Capitalization 20.2 40.7 17.4 10.2 7.6 6.1 3.5 1.1% 2.7% 1.3% 0.8% 0.6% 0.5% 0.3% Bad Debt 26.7 22.9 29.6 36.8 43.0 43.7 44.0 1.4% 1.5% 2.3% 3.0% 3.7% 3.8% 3.8% Other Period (4.4) (20.7) 21.9 (9.1) 0.6 4.5 1.3 -0.2% -1.4% 1.7% -0.7% 0.1% 0.4% 0.1% Total Expenses 1,129.2 $ 977.7 $ 913.9 $ 868.8 $ 882.5 $ 894.2 $ 900.5 $ 61.2% 65.1% 69.5% 70.8% 74.9% 76.8% 76.7% EBITDA (Pro Forma) 715.6 $ 525.1 $ 401.3 $ 358.4 $ 295.2 $ 270.5 $ 273.8 $ 38.8% 34.9% 30.5% 29.2% 25.1% 23.2% 23.3% ($ in millions) 2014A 2015P 2016P 2017P 2018P 2019P 2020P FY14 v FY13 FY15 v FY14 FY16 v FY15 FY17 v FY16 FY18 v FY17 FY19 v FY18 FY20 v FY19 Net Revenue Growth % Print Revenue 1,301.3 $ 992.8 $ 775.4 $ 608.6 $ 484.9 $ 388.0 $ 310.7 $ -21.3% -23.7% -21.9% -21.5% -20.3% -20.0% -19.9% Digital Revenue 543.5 510.0 539.8 618.6 692.8 776.7 863.6 3.4% -6.2% 5.8% 14.6% 12.0% 12.1% 11.2% Total Revenue 1,844.8 $ 1,502.8 $ 1,315.2 $ 1,227.2 $ 1,177.7 $ 1,164.7 $ 1,174.4 $ -15.5% -18.5% -12.5% -6.7% -4.0% -1.1% 0.8% Expenses % of Revenue Sales 346.7 $ 286.4 $ 257.6 $ 233.3 $ 222.4 $ 215.7 $ 212.1 $ 18.8% 19.1% 19.6% 19.0% 18.9% 18.5% 18.1% Operations 288.6 244.7 220.0 216.9 215.7 217.5 218.8 15.6% 16.3% 16.7% 17.7% 18.3% 18.7% 18.6% Core Marketing 35.6 32.1 29.9 27.2 24.9 23.4 22.5 1.9% 2.1% 2.3% 2.2% 2.1% 2.0% 1.9% Distribution 73.5 51.3 43.0 39.5 36.4 33.7 31.2 4.0% 3.4% 3.3% 3.2% 3.1% 2.9% 2.7% Traffic 157.5 163.9 156.0 178.7 196.6 216.5 234.0 8.5% 10.9% 11.9% 14.6% 16.7% 18.6% 19.9% Marketing 266.6 247.3 228.9 245.4 257.9 273.6 287.7 14.5% 16.5% 17.4% 20.0% 21.9% 23.5% 24.5% Total IT/Facilities 138.6 114.2 99 99 99 99 99 7.5% 7.6% 7.5% 8.1% 8.4% 8.5% 8.4% Finance 21.2 19.6 19.2 17.2 17.2 16 16 1.1% 1.3% 1.5% 1.4% 1.5% 1.4% 1.4% Human Resources 12.9 10.1 9.7 8.5 8.5 7.5 7.5 0.7% 0.7% 0.7% 0.7% 0.7% 0.6% 0.6% Legal 8.6 9.2 7.3 7.3 7.3 7.3 7.3 0.5% 0.6% 0.6% 0.6% 0.6% 0.6% 0.6% Executive 3.5 3.3 3.3 3.3 3.3 3.3 3.3 0.2% 0.2% 0.3% 0.3% 0.3% 0.3% 0.3% Total Departmental Exp. 1,086.7 $ 934.8 $ 845.0 $ 830.9 $ 831.3 $ 839.9 $ 851.7 $ 58.9% 62.2% 64.2% 67.7% 70.6% 72.1% 72.5% Net Capitalization 20.2 40.7 17.4 10.2 7.6 6.1 3.5 1.1% 2.7% 1.3% 0.8% 0.6% 0.5% 0.3% Bad Debt 26.7 22.9 29.6 36.8 43.0 43.7 44.0 1.4% 1.5% 2.3% 3.0% 3.7% 3.8% 3.8% Other Period (4.4) (20.7) 21.9 (9.1) 0.6 4.5 1.3 -0.2% -1.4% 1.7% -0.7% 0.1% 0.4% 0.1% Total Expenses 1,129.2 $ 977.7 $ 913.9 $ 868.8 $ 882.5 $ 894.2 $ 900.5 $ 61.2% 65.1% 69.5% 70.8% 74.9% 76.8% 76.7% EBITDA (Pro Forma) 715.6 $ 525.1 $ 401.3 $ 358.4 $ 295.2 $ 270.5 $ 273.8 $ 38.8% 34.9% 30.5% 29.2% 25.1% 23.2% 23.3%
Risk and Opportunities 27 Confidential and Proprietary Information of Dex Media

Print performance trend does not improve Consumers continue to defect from using the product ROI degrades for clients Targeted distribution does not maintain product profitability Digital performance trend does not improve We are not able to clearly communicate and/or deliver on product performance expectations, negatively impacting loyalty, retention and renewal Dex Media is not differentiated as the marketing department: for example, new service model does not improve onboarding, fulfillment, and ongoing service experience Expansion channel clients do not grow at expected rates after being acquired Traffic costs remain higher than anticipated Unsuccessful shifting to presence products Market demand for variable billed products maintains or increases Risks Confidential and Proprietary Information of Dex Media 28
Opportunities Confidential and Proprietary Information of Dex Media 29 Improved Print Performance Content enhancements maintain usage due to distribution enhancements Product ROI maintained for clients, improving retention and renewal Changes to pricing/bundle structures incent clients to maintain print spend longer, bringing the performance trend closer to the product’s natural market decline Improved Digital Performance We communicate and deliver on product performance expectations improving loyalty, retention and renewal Product simplification focuses the sales call and improves conversion and upsell New service model improves onboarding, fulfillment, and ongoing service experience, differentiating Dex Media as the marketing department Expansion channel leverages unique value proposition and differentiated service model to capture new market growth Traffic cost reduced by migrating clients to fixed SEM and Presence products
Tax Attributes 30 Confidential and Proprietary Information of Dex Media
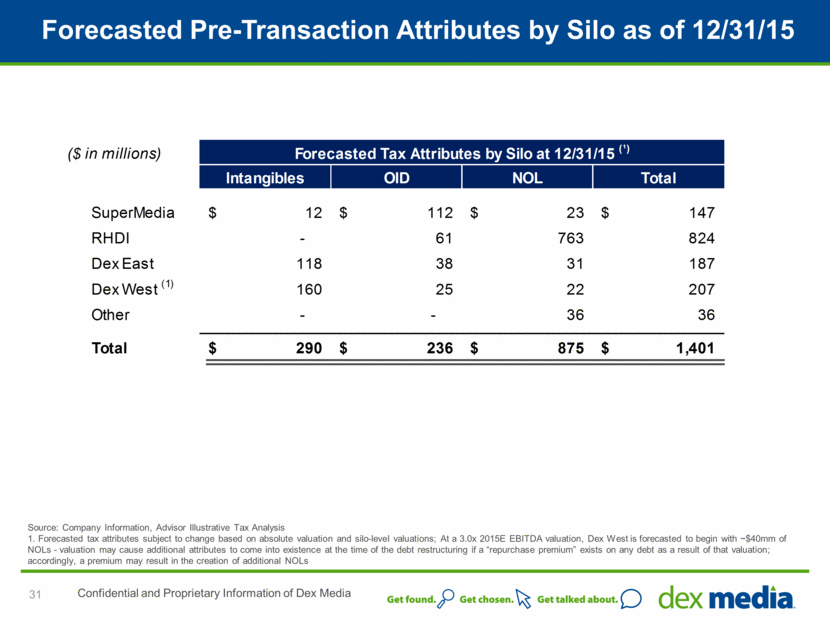
Forecasted Pre-Transaction Attributes by Silo as of 12/31/15 31 Confidential and Proprietary Information of Dex Media Source: Company Information, Advisor Illustrative Tax Analysis 1. Forecasted tax attributes subject to change based on absolute valuation and silo-level valuations; At a 3.0x 2015E EBITDA valuation, Dex West is forecasted to begin with ~$40mm of NOLs - valuation may cause additional attributes to come into existence at the time of the debt restructuring if a “repurchase premium” exists on any debt as a result of that valuation; accordingly, a premium may result in the creation of additional NOLs ($ in millions) Intangibles OID NOL Total SuperMedia 12 $ 112 $ 23 $ 147 $ RHDI - 61 763 824 Dex East 118 38 31 187 Dex West (1) 160 25 22 207 Other - - 36 36 Total 290 $ 236 $ 875 $ 1,401 $ Forecasted Tax Attributes by Silo at 12/31/15 (¹)
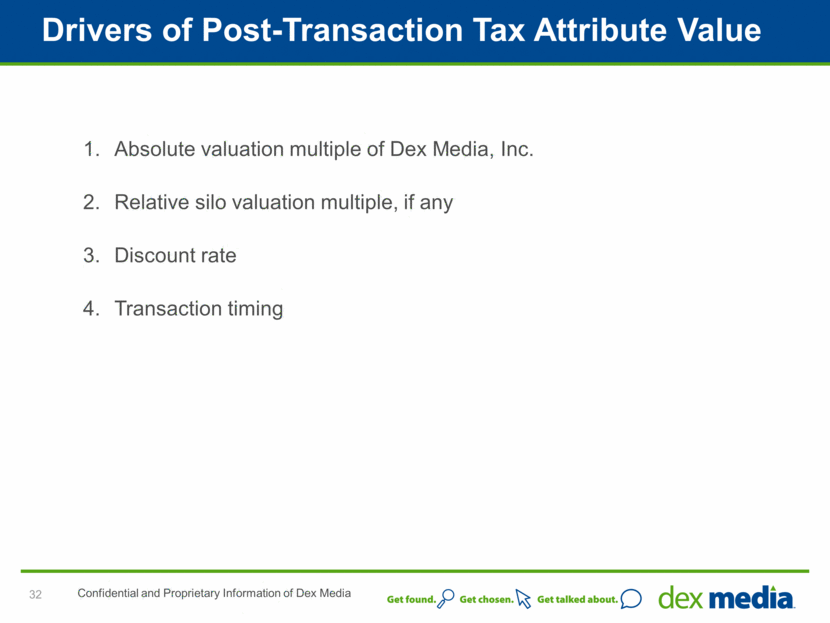
Drivers of Post-Transaction Tax Attribute Value 32 Confidential and Proprietary Information of Dex Media Absolute valuation multiple of Dex Media, Inc. Relative silo valuation multiple, if any Discount rate Transaction timing
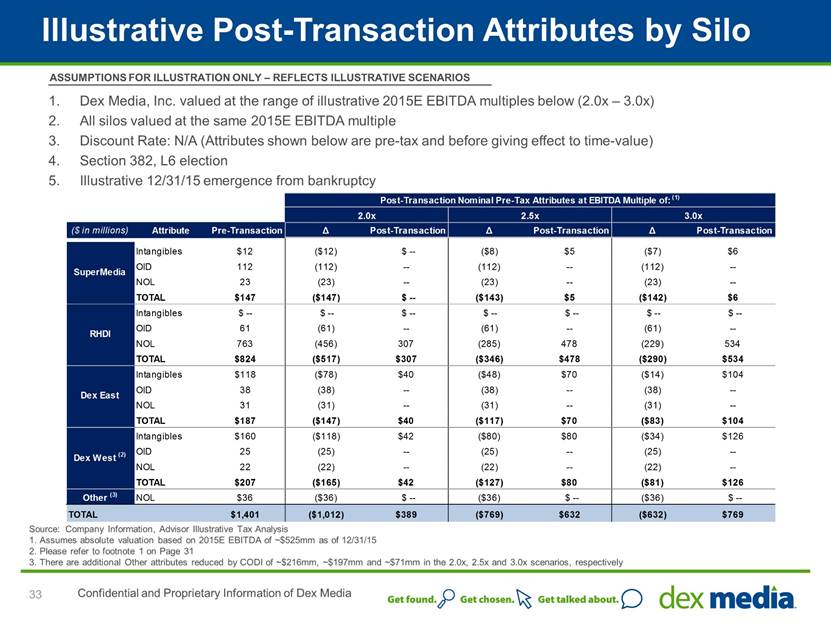
Illustrative Post-Transaction Attributes by Silo 33 Confidential and Proprietary Information of Dex Media Dex Media, Inc. valued at the range of illustrative 2015E EBITDA multiples below (2.0x – 3.0x) All silos valued at the same 2015E EBITDA multiple Discount Rate: N/A (Attributes shown below are pre-tax and before giving effect to time-value) Section 382, L6 election Illustrative 12/31/15 emergence from bankruptcy ASSUMPTIONS FOR ILLUSTRATION ONLY – REFLECTS ILLUSTRATIVE SCENARIOS Source: Company Information, Advisor Illustrative Tax Analysis 1. Assumes absolute valuation based on 2015E EBITDA of ~$525mm as of 12/31/15 2. Please refer to footnote 1 on Page 38 3. There are additional Other attributes reduced by CODI of ~$216mm, ~$197mm and ~$71mm in the 2.0x, 2.5x and 3.0x scenarios, respectively Post-Transaction Nominal Pre-Tax Attributes at EBITDA Multiple of: (1) 2.0x 2.5x 3.0x Attribute Pre-Transaction ? Post-Transaction ? Post-Transaction ? Post-Transaction Intangibles $12 ($12) $ -- ($8) $5 ($7) $6 OID 112 (112) -- (112) -- (112) -- NOL 23 (23) -- (23) -- (23) -- TOTAL $147 ($147) $ -- ($143) $5 ($142) $6 Intangibles $ -- $ -- $ -- $ -- $ -- $ -- $ -- OID 61 (61) -- (61) -- (61) -- NOL 763 (456) 307 (285) 478 (229) 534 TOTAL $824 ($517) $307 ($346) $478 ($290) $534 Intangibles $118 ($78) $40 ($48) $70 ($14) $104 OID 38 (38) -- (38) -- (38) -- NOL 31 (31) -- (31) -- (31) -- TOTAL $187 ($147) $40 ($117) $70 ($83) $104 Intangibles $160 ($118) $42 ($80) $80 ($34) $126 OID 25 (25) -- (25) -- (25) -- NOL 22 (22) -- (22) -- (22) -- TOTAL $207 ($165) $42 ($127) $80 ($81) $126 NOL $36 ($36) $ -- ($36) $ -- ($36) $ -- TOTAL $1,401 ($1,012) $389 ($769) $632 ($632) $769 Other (3) ($ in millions) SuperMedia RHDI Dex East Dex West (2)
Appendices 34 Confidential and Proprietary Information of Dex Media
Appendices 35 Confidential and Proprietary Information of Dex Media July Consolidated Balance Sheet ...................................................36 July YTD Free Cash Flow . 37 Silo Comparison . ....38
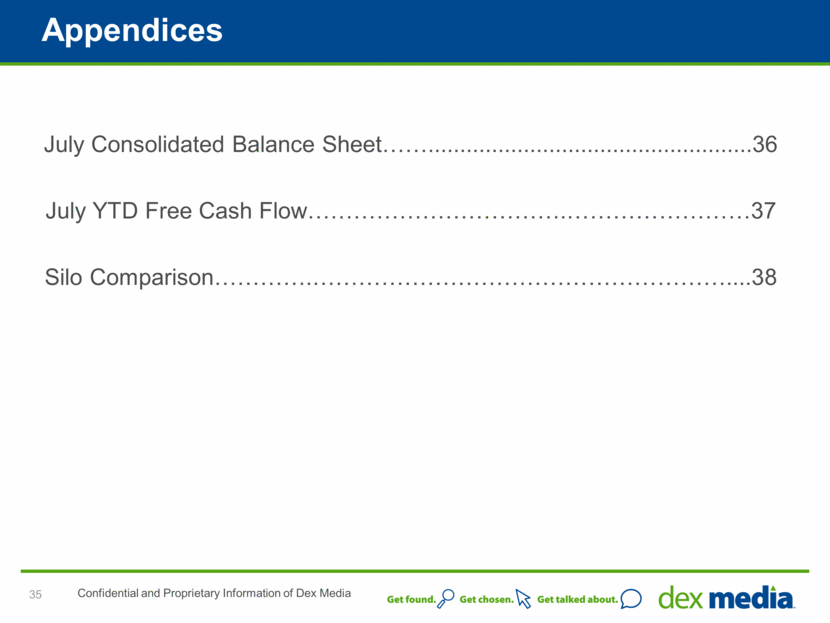
July Consolidated Balance Sheet 36 Confidential and Proprietary Information of Dex Media ($ in millions) Actual July '15 Assets Current assets Cash and cash equivalents 185 $ Accounts receivable, net 131 Deferred directory costs 139 Deferred tax assets - Prepaid expenses and other 18 Assets held for sale - Total current assets 473 42 Goodwill 315 Intangible assets, net 577 Pension assets 45 Other non-current assets 6 Fixed assets and capitalized software, net ($ in millions) Actual July '15 Liabilities and Shareholders' Equity (Deficit) Current liabilities Current maturities of long-term debt 98 $ 120 Affiliates payable, net - Accrued interest 26 Deferred revenue 78 Current deferred tax liabilities - Total current liabilities 322 Long-term debt 2,218 Employee benefit obligations 118 Deferred tax liabilities 28 Unrecognized tax benefits 11 Investment in subsidiaries - Other liabilities 3 Accounts payable and accrued liabilities Total Assets 1,458 $ Total Liabilities 2,700 $ Shareholders' Equity (Deficit) (1,242) 1,458 $ Total Liabilities and Shareholders' Equity (Deficit)
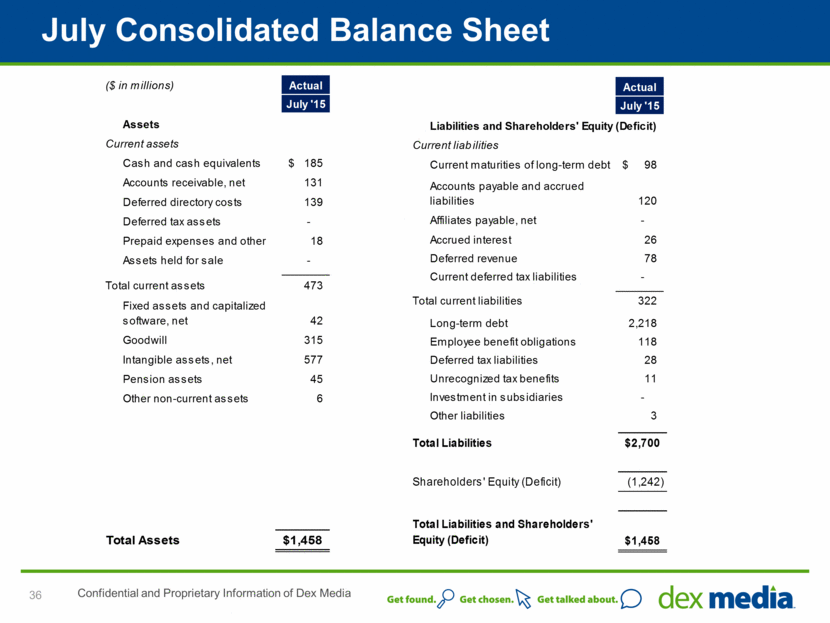
July 2015 YTD Free Cash Flow 37 Confidential and Proprietary Information of Dex Media Note: Free cash flow does not include any amortization or pay down of debt or debt amendment fees ($ in millions) Year-to-Date $ % Flash Adjusted Proforma EBITDA 344.7 $ 429.1 $ (84.4) $ -19.7% Non-cash EBITDA Adjustments (1.5) (11.5) 10.0 -87.0% Tax Refunds/(Payments) (6.7) (2.1) (4.6) -219.0% Late Fees 3.5 4.8 (1.3) -27.1% Merger Integration - Cash - (30.9) 30.9 -100.0% Business Transformation - Cash (45.9) - (45.9) 0.0% Pension Funding (2.3) (5.0) 2.7 54.0% Net Capitalized Spending - - - 0.0% Working Capital/Other 4.4 7.3 (2.9) -39.7% Cash from Operating Activities 296.2 $ 391.7 $ (95.5) $ -24.4% Capital Expenditures (9.8) (10.9) 1.1 10.1% Free Cash Flow (before debt service) 286.4 $ 380.8 $ (94.4) $ -24.8% Interest Payments (137.5) (154.3) 16.8 10.9% Free Cash Flow, before Restructuring 148.9 $ 226.5 $ (77.6) $ -34.3% Restructuring - Cash (2.0) - (2.0) 0.0% Free Cash Flow, after Restructuring 146.9 $ 226.5 $ (79.6) $ -35.1% Actual Prior Year Variance
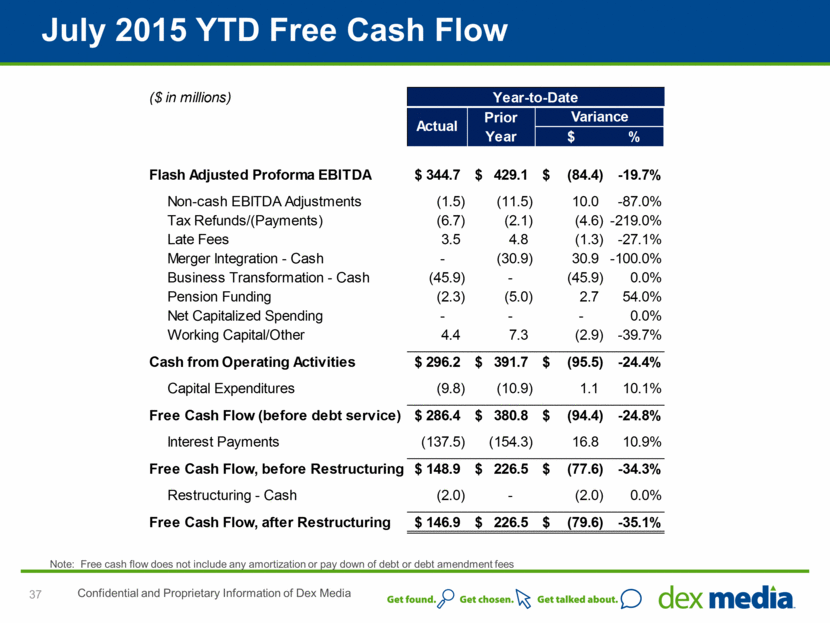
Summary Silo Comparison Confidential and Proprietary Information of Dex Media 38 [1] YTD through June 2015 SPMD RHD DME DMW Total EBITDA Margins 2014 Revenue ($ MM) 926.9 $ 388.4 $ 252.4 $ 277.2 $ 1,844.8 $ EBITDA ($ MM) 352.1 $ 154.1 $ 108.7 $ 113.7 $ 715.5 $ EBITDA Margin % 38.0% 39.7% 43.1% 41.0% 38.8% 2015 (YTD) [1] Revenue ($ MM) 392.1 $ 169.8 $ 110.6 $ 120.5 $ 793.0 $ EBITDA ($ MM) 146.8 $ 72.3 $ 42.7 $ 47.0 $ 302.4 $ EBITDA Margin % 37.4% 42.6% 38.6% 39.0% 38.1% Mix of Print / Digital 2014 % Print Revenue 72.9% 66.6% 69.3% 69.1% 70.5% % Digital Revenue 27.1% 33.4% 30.7% 30.9% 29.5% 2015 (YTD) [1] % Print Revenue 68.5% 63.3% 66.6% 66.3% 66.8% % Digital Revenue 31.5% 36.7% 33.4% 33.7% 33.2%
Dex Media, Inc.
Reconciliation of Non-GAAP Measures for Slide 21 in Dex Media Long Term Business Plan
|
Unaudited |
|
Seven Mos. |
| |
|
|
|
|
| |
|
Net (Loss) - GAAP |
|
$ |
(125 |
) |
|
Add/(subtract) non-operating items: |
|
|
| |
|
Provision (benefit) for income taxes |
|
(2 |
) | |
|
Interest expense, net |
|
201 |
| |
|
Gain on early extinguishment of debt |
|
(1 |
) | |
|
Operating Income - GAAP |
|
73 |
| |
|
Depreciation and amortization |
|
243 |
| |
|
EBITDA (non-GAAP) |
|
316 |
| |
|
|
|
|
| |
|
Adjustments and pro forma items: |
|
|
| |
|
Business transformation costs |
|
28 |
| |
|
Long term incentive compensation |
|
1 |
| |
|
Adjusted EBITDA (non-GAAP) Per Slide 21 (EBITDA) |
|
$ |
345 |
|
|
|
|
|
| |
|
Operating Revenue - GAAP |
|
$ |
916 |
|
|
|
|
|
| |
|
Operating income margin - GAAP |
|
8.0 |
% | |
|
Impact of depreciation and amortization |
|
26.5 |
% | |
|
EBITDA margin (non-GAAP) |
|
34.5 |
% | |
|
Impact of adjustments and pro forma Items |
|
3.1 |
% | |
|
Adjusted EBITDA margin (non-GAAP) Per Slide 21 (Margin %) |
|
37.6 |
% | |
Dex Media, Inc.
Reconciliation of Non-GAAP Measures for Slide 22 in Dex Media Long Term Business Plan
|
Unaudited |
|
Six Mos. Ended |
| |
|
|
|
|
| |
|
Net (Loss) - GAAP |
|
$ |
(101 |
) |
|
Add/(subtract) non-operating items: |
|
|
| |
|
Provision (benefit) for income taxes |
|
(2 |
) | |
|
Interest expense, net |
|
172 |
| |
|
Gain on early extinguishment of debt |
|
(1 |
) | |
|
Operating Income - GAAP |
|
68 |
| |
|
Depreciation and amortization |
|
209 |
| |
|
EBITDA (non-GAAP) |
|
277 |
| |
|
|
|
|
| |
|
Adjustments and pro forma items: |
|
|
| |
|
Business transformation costs |
|
24 |
| |
|
Long term incentive compensation |
|
1 |
| |
|
Adjusted EBITDA (non-GAAP) Per Slide 22 (EBITDA) |
|
$ |
302 |
|
|
|
|
|
| |
|
Operating Revenue - GAAP |
|
$ |
793 |
|
|
|
|
|
| |
|
Operating income margin - GAAP |
|
8.6 |
% | |
|
Impact of depreciation and amortization |
|
26.3 |
% | |
|
EBITDA margin (non-GAAP) |
|
34.9 |
% | |
|
Impact of adjustments and pro forma Items |
|
3.2 |
% | |
|
Adjusted EBITDA margin (non-GAAP) Per Slide 22 (% of Sales) |
|
38.1 |
% | |
Dex Media, Inc.
Reconciliation of Non-GAAP Measures for Slide 25 in Dex Media Long Term Business Plan
|
|
|
|
|
(dollars in millions) |
| ||
|
|
|
Year Ended |
|
Year Ended |
| ||
|
Unaudited |
|
12/31/14 |
|
12/31/13 |
| ||
|
|
|
|
|
|
| ||
|
Operating Revenue - GAAP |
|
$ |
1,815 |
|
$ |
1,444 |
|
|
SuperMedia revenue excluded from GAAP revenue |
|
30 |
|
740 |
| ||
|
Pro Forma Operating Revenue (non-GAAP) |
|
$ |
1,845 |
|
$ |
2,184 |
|
|
|
|
|
|
|
| ||
|
Print Revenue, net per slide 25 |
|
$ |
1,301 |
|
$ |
1,653 |
|
|
Digital Revenue, net per slide 25 |
|
544 |
|
526 |
| ||
|
Miscellaneous revenue |
|
— |
|
5 |
| ||
|
Pro Forma Operating Revenue (non-GAAP) |
|
$ |
1,845 |
|
$ |
2,184 |
|
Dex Media, Inc.
Reconciliation of Non-GAAP Measures for Slide 26 in Dex Media Long Term Business Plan
|
Unaudited |
|
Year Ended |
| |
|
|
|
|
| |
|
Net (Loss) - GAAP |
|
$ |
(371 |
) |
|
Add/(subtract) non-operating items: |
|
|
| |
|
Provision (benefit) for income taxes |
|
13 |
| |
|
Interest expense, net |
|
356 |
| |
|
Gain on early extinguishment of debt |
|
(2 |
) | |
|
Operating Income - GAAP |
|
(4 |
) | |
|
Depreciation and amortization |
|
643 |
| |
|
EBITDA (non-GAAP) |
|
639 |
| |
|
|
|
|
| |
|
Adjustments and pro forma items: |
|
|
| |
|
Adjustments for SuperMedia acquisition accounting |
|
21 |
| |
|
Merger integration costs |
|
41 |
| |
|
Business transformation costs |
|
43 |
| |
|
Employee benefit plan amendments |
|
(42 |
) | |
|
Long term incentive compensation |
|
10 |
| |
|
Asset write downs |
|
3 |
| |
|
Adjusted EBITDA (non-GAAP) Per Slide 26 (EBITDA Pro Forma) |
|
$ |
715 |
|
|
|
|
|
| |
|
Operating Revenue - GAAP |
|
$ |
1,815 |
|
|
SuperMedia revenue excluded from GAAP revenue |
|
30 |
| |
|
Operating Revenue - GAAP and Pro Forma Operating Revenue (non-GAAP) |
|
$ |
1,845 |
|
|
|
|
|
| |
|
Operating income margin -GAAP |
|
-0.2 |
% | |
|
Impact of depreciation and amortization |
|
35.4 |
% | |
|
EBITDA margin (non-GAAP) |
|
35.2 |
% | |
|
Impact of adjustments and pro forma Items |
|
3.6 |
% | |
|
Adjusted EBITDA margin (non-GAAP) Per Slide 26 (EBITDA Pro Forma %) |
|
38.8 |
% | |
Dex Media, Inc.
EBITDA Walkforward - GAAP to Adjusted and Adjusted Pro Forma Basis (Non-GAAP)
YTD June 2015 and 2014
Reconciliation of Non-GAAP Measures for Slide 38 in Dex Media Long Term Business Plan
|
|
|
For the Six Months Ended June 30, 2015 |
| ||||||||||
|
|
|
R.H. |
|
Dex Media |
|
Dex Media |
|
Super |
|
Parent/ |
|
Dex Media |
|
|
|
|
Donnelley |
|
East |
|
West |
|
Media |
|
Other/Elims |
|
Consolidated |
|
|
|
|
(in millions) |
| ||||||||||
|
|
|
|
|
|
|
|
|
|
|
|
|
|
|
|
Revenue - Per GAAP financials |
|
170 |
|
111 |
|
120 |
|
392 |
|
— |
|
793 |
|
|
|
|
|
|
|
|
|
|
|
|
|
|
|
|
|
Operating Income - Per GAAP financials |
|
27 |
|
(5 |
) |
(10 |
) |
61 |
|
(5 |
) |
68 |
|
|
Add Back: Depreciation and amortization |
|
39 |
|
44 |
|
53 |
|
73 |
|
— |
|
209 |
|
|
EBITDA - Per GAAP Financials |
|
66 |
|
39 |
|
43 |
|
134 |
|
(5 |
) |
277 |
|
|
|
|
|
|
|
|
|
|
|
|
|
|
|
|
|
Adjustments: |
|
|
|
|
|
|
|
|
|
|
|
|
|
|
Business Transformation Costs |
|
6 |
|
4 |
|
3 |
|
12 |
|
(1 |
) |
24 |
|
|
Long-Term Incentive Plans |
|
— |
|
— |
|
|
|
1 |
|
— |
|
1 |
|
|
Total Adjustments |
|
6 |
|
4 |
|
3 |
|
13 |
|
(1 |
) |
25 |
|
|
|
|
|
|
|
|
|
|
|
|
|
|
|
|
|
Adjusted EBITDA - Non-GAAP |
|
72 |
|
43 |
|
46 |
|
147 |
|
(6 |
) |
302 |
|
|
|
|
|
|
|
|
|
|
|
|
|
|
|
|
|
Operating income margin - GAAP |
|
15.9 |
% |
-4.5 |
% |
-8.3 |
% |
15.6 |
% |
NA |
|
8.6 |
% |
|
Impact of depreciation and amortization |
|
22.9 |
% |
39.6 |
% |
44.2 |
% |
18.6 |
% |
NA |
|
26.4 |
% |
|
EBITDA margin (non-GAAP) |
|
38.8 |
% |
35.1 |
% |
35.8 |
% |
34.2 |
% |
NA |
|
34.9 |
% |
|
Impact of adjustments |
|
3.8 |
% |
3.5 |
% |
3.2 |
% |
3.2 |
% |
NA |
|
3.2 |
% |
|
Adjusted EBITDA margin (non-GAAP) Per Slide 38 (EBITDA Pro Forma %) |
|
42.6 |
% |
38.6 |
% |
39.0 |
% |
37.4 |
% |
NA |
|
38.1 |
% |
|
|
|
For the Year Ended December 31, 2014 |
| ||||||||||
|
|
|
R.H. |
|
Dex Media |
|
Dex Media |
|
Super |
|
Parent/ |
|
Dex Media |
|
|
|
|
Donnelley |
|
East |
|
West |
|
Media |
|
Other/Elims |
|
Consolidated |
|
|
|
|
(in millions) |
| ||||||||||
|
|
|
|
|
|
|
|
|
|
|
|
|
|
|
|
Revenue - Per GAAP financials |
|
389 |
|
252 |
|
277 |
|
897 |
|
— |
|
1,815 |
|
|
Adjustments for SuperMedia Acquisition accounting |
|
— |
|
— |
|
— |
|
30 |
|
— |
|
30 |
|
|
Adjusted Pro Forma Revenue - Non-GAAP |
|
389 |
|
252 |
|
277 |
|
927 |
|
— |
|
1,845 |
|
|
|
|
|
|
|
|
|
|
|
|
|
|
|
|
|
Operating Income - Per GAAP financials |
|
18 |
|
(32 |
) |
(60 |
) |
94 |
|
(24 |
) |
(4 |
) |
|
Add Back: Depreciation and amortization |
|
117 |
|
130 |
|
160 |
|
236 |
|
— |
|
643 |
|
|
EBITDA - Per GAAP Financials |
|
135 |
|
98 |
|
100 |
|
330 |
|
(24 |
) |
639 |
|
|
|
|
|
|
|
|
|
|
|
|
|
|
|
|
|
Adjustments: |
|
|
|
|
|
|
|
|
|
|
|
|
|
|
Adjustments for SuperMedia Jan-March Pro Forma |
|
— |
|
— |
|
— |
|
21 |
|
— |
|
21 |
|
|
Merger Integration Costs |
|
9 |
|
6 |
|
6 |
|
20 |
|
— |
|
41 |
|
|
Business Transformation Costs |
|
8 |
|
4 |
|
6 |
|
16 |
|
9 |
|
43 |
|
|
Asset Writedowns |
|
— |
|
— |
|
— |
|
3 |
|
— |
|
3 |
|
|
Long-Term Incentive Plans |
|
2 |
|
1 |
|
1 |
|
4 |
|
2 |
|
10 |
|
|
Employee Benefit Plan Amendments |
|
— |
|
— |
|
— |
|
(42 |
) |
— |
|
(42 |
) |
|
Total Adjustments |
|
19 |
|
11 |
|
13 |
|
22 |
|
11 |
|
76 |
|
|
|
|
|
|
|
|
|
|
|
|
|
|
|
|
|
Adjusted Pro Forma EBITDA - Non-GAAP |
|
154 |
|
109 |
|
113 |
|
352 |
|
(13 |
) |
715 |
|
|
|
|
|
|
|
|
|
|
|
|
|
|
|
|
|
Operating income margin - GAAP |
|
4.6 |
% |
-12.7 |
% |
-21.7 |
% |
10.5 |
% |
NA |
|
-0.2 |
% |
|
Impact of depreciation and amortization |
|
30.1 |
% |
51.6 |
% |
57.8 |
% |
25.1 |
% |
NA |
|
34.8 |
% |
|
EBITDA margin (non-GAAP) |
|
34.7 |
% |
38.9 |
% |
36.1 |
% |
35.6 |
% |
NA |
|
34.6 |
% |
|
Impact of adjustments and pro forma Items |
|
5.0 |
% |
4.2 |
% |
4.9 |
% |
2.4 |
% |
NA |
|
4.2 |
% |
|
Adjusted EBITDA margin (non-GAAP) Per Slide 38 (EBITDA Pro Forma %) |
|
39.7 |
% |
43.1 |
% |
41.0 |
% |
38.0 |
% |
NA |
|
38.8 |
% |
