Attached files
| file | filename |
|---|---|
| 8-K - 8-K - CASCADE BANCORP | cacb8k12215investorpresent.htm |

December 2015 Investor Presentation NASDAQ: CACB
CAUTIONARY STATEMENT REGARDING FORWARD-LOOKING STATEMENTS This document contains forward-looking statements about Cascade Bancorp’s plans and anticipated results of operations and financial condition. These statements include, but are not limited to, our plans, objectives, expectations, and intentions and are not statements of historical fact. When used in this report, the word "expects," "believes," "anticipates,” “could,” “may,” “will,” “should,” “plan,” “predicts,” “projections,” “continue” and other similar expressions constitute forward- looking statements, as do any other statements that expressly or implicitly predict future events, results or performance, and such statements are made pursuant to the safe harbor provisions of the Private Securities Litigation Reform Act of 1995. Certain risks and uncertainties and Cascade Bancorp’s success in managing such risks and uncertainties could cause actual results to differ materially from those projected, including among others, the following factors: local and national economic conditions could be less favorable than expected or could have a more direct and pronounced effect on us than expected and adversely affect our results of operations and financial condition; the local housing/real estate market could continue to decline for a longer period than we anticipate; the risks presented by a continued economic recession, which could continue to adversely affect credit quality, collateral values, including real estate collateral and OREO properties, investment values, liquidity and loan originations, reserves for loan losses and charge offs of loans and loan portfolio delinquency rates and may be exacerbated by our concentration of operations in the States of Oregon and Idaho generally, and Central, Southern and Northwest Oregon, as well as the greater Boise/Treasure Valley, Idaho area, specifically; interest rate changes could significantly reduce net interest income and negatively affect funding sources; competition among financial institutions could increase significantly; competition or changes in interest rates could negatively affect net interest margin, as could other factors listed from time to time in Cascade Bancorp’s Securities and Exchange Commission (“SEC”) reports; the reputation of the financial services industry could further deteriorate, which could adversely affect our ability to access markets for funding and to acquire and retain customers; and existing regulatory requirements, changes in regulatory requirements and legislation (including without limitation, the Dodd-Frank Wall Street Reform and Consumer Protection Act) and our inability to meet those requirements, including capital requirements and increases in our deposit insurance premium, could adversely affect the businesses in which we are engaged, our results of operations and financial condition. Such forward-looking statements also include, but are not limited to, statements about the benefits of the business combination transaction involving Cascade Bancorp and Home Federal Bancorp, Inc., including future financial and operating results, the combined company’s plans, objectives, expectations and intentions and other statements that are not historical facts. These forward-looking statements are subject to numerous assumptions, risks and uncertainties which change over time. Forward-looking statements speak only as of the date they are made and we assume no duty to update forward-looking statements. Important factors that could cause actual results to differ materially from those indicated by such forward-looking statements include risks and uncertainties relating to: (i) the risk that the businesses will not be integrated successfully; (ii) the risk that the cost savings and any other synergies from the transaction may not be fully realized or may take longer to realize than expected; (iii) disruption from the transaction making it more difficult to maintain relationships with customers, employees or vendors; (iv) the diversion of management time on post-merger and integration-related issues; (v) general worldwide economic conditions and related uncertainties; (vi) liquidity risk affecting Cascade’s ability to meet its obligations when they come due; (vii) excessive loan losses; (viii) the effect of changes in governmental regulations; and (ix) other factors we discuss or refer to in the “Risk Factors” section of Cascade’s most recent Annual Report on Form 10-K filed with the SEC on March 31, 2014. These risks as well as other additional risks and uncertainties are identified and discussed in Cascade’s reports filed with the SEC and available at the SEC’s website at www.sec.gov. These forward-looking statements speak only as of the date of this document. Cascade Bancorp undertakes no obligation to publish revised forward-looking statements to reflect the occurrence of unanticipated events or circumstances after the date hereof. Readers should carefully review all disclosures filed by Cascade Bancorp from time to time with the SEC. 2

(1) Ranking and Percentage Market share SNL financial CASCADE BANCORP OVERVIEW 3 Cascade Bancorp • Headquarters: • Assets: • Deposits: • Loans: • Footprint: • Ticker: • Market Capitalization: • Shares Outstanding 9/30/15 • Float: • Bend, OR • $2.5 billion • $2.1 billion • $1.6 billion • 37 branches / 2 states • CACB • $431.9 mm (as of 11/16/2015) • 72.8 mm shares • 30.0 mm shares Deposit Franchise (1) Metro Area Boise, ID Bend, OR Eugene, OR Medford, OR Grants Pass, OR Prineville, OR # Offices 14 10 3 3 2 1 Deposit Share 7.3% 27.6% 2.9% 2.8% 10.3% 35.9% Rank 4 1 11 11 4 1

INVESTMENT HIGHLIGHTS • Top market share in fast-growing Pacific Northwest markets • Region-leading core deposit franchise • Assertive M&A to enhance franchise value • Building toward $5 billion franchise • Increasing scale with $700 million branch purchase (Q1 2016 close) • Leverage new funds with Seattle LPO (opened Q4 2015) • Enhancing regional delivery structure • Loan growth performance above peers since HFB integration • Adding bankers to drive organic loan growth • Diversified product offerings & geographic reach • Top quartile non-interest income performance • Progress toward delivering region-leading returns and profitability • Experienced and outcome-driven management team and Board 4
MANAGEMENT TEAM 5

DRIVING ORGANIC GROWTH 6(1) Expense reduction as compared to September YTD 2013 annualized combined expense run rate Cross Sell Expand Product Offerings Expand Geographic Reach • 8 bps cost of funds, ~58% in checking accounts • Deploy excess community bank funds = diversification by geography & type • Pay-for-performance culture designed to drive profitable growth • SBA – began January 2013. #1 community bank SBA lender in Oregon • Customer Swaps – $147mm notional book – unique capability • Startup Aircraft niche with experienced lender – Q1 2015 • Opportunistic expansion in metro LPO’s • Seattle metro LPO opened Q4 2015 • Model after success in Portland “skyscraper” LPO Low Cost Deposit Base • Revenue and cross-sell synergies in process • Card penetration, mortgage production, advanced cash management, customer swaps, and SBA

SEATTLE LOAN PRODUCTION OFFICE 7 • New Commercial banking center - outside CACB’s core branch network • Open Q4 2015 • Deploy excess ‘community bank’ deposits • Opportunity to maximize deployment of new funds from BofA branch acquisition • Further diversifies loan portfolio • Strategic positioning to replicate success of existing Portland LPO • Portland LPO has contributed 15% of total loans and 7% of total deposits since inception • Seasoned team of bankers with experience in the Seattle market • Led by Brandon Elieff – 15 years experience in Seattle, formerly of Northwest Bank and Northern Trust • Expand initial banking team • C&I origination is priority • Opportunity for cross sell • SBA/SWAPS/Treasury management • Leverage with possible M&A activity in Puget Sound
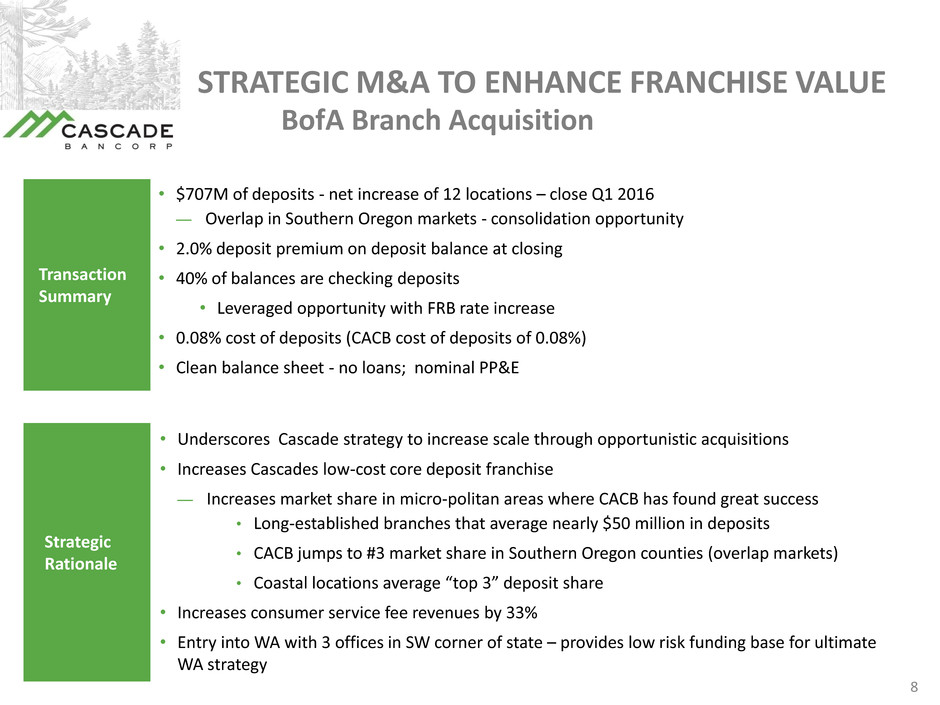
BofA Branch Acquisition 8 STRATEGIC M&A TO ENHANCE FRANCHISE VALUE Transaction Summary • $707M of deposits - net increase of 12 locations – close Q1 2016 — Overlap in Southern Oregon markets - consolidation opportunity • 2.0% deposit premium on deposit balance at closing • 40% of balances are checking deposits • Leveraged opportunity with FRB rate increase • 0.08% cost of deposits (CACB cost of deposits of 0.08%) • Clean balance sheet - no loans; nominal PP&E • Underscores Cascade strategy to increase scale through opportunistic acquisitions • Increases Cascades low-cost core deposit franchise — Increases market share in micro-politan areas where CACB has found great success • Long-established branches that average nearly $50 million in deposits • CACB jumps to #3 market share in Southern Oregon counties (overlap markets) • Coastal locations average “top 3” deposit share • Increases consumer service fee revenues by 33% • Entry into WA with 3 offices in SW corner of state – provides low risk funding base for ultimate WA strategy Strategic Rationale
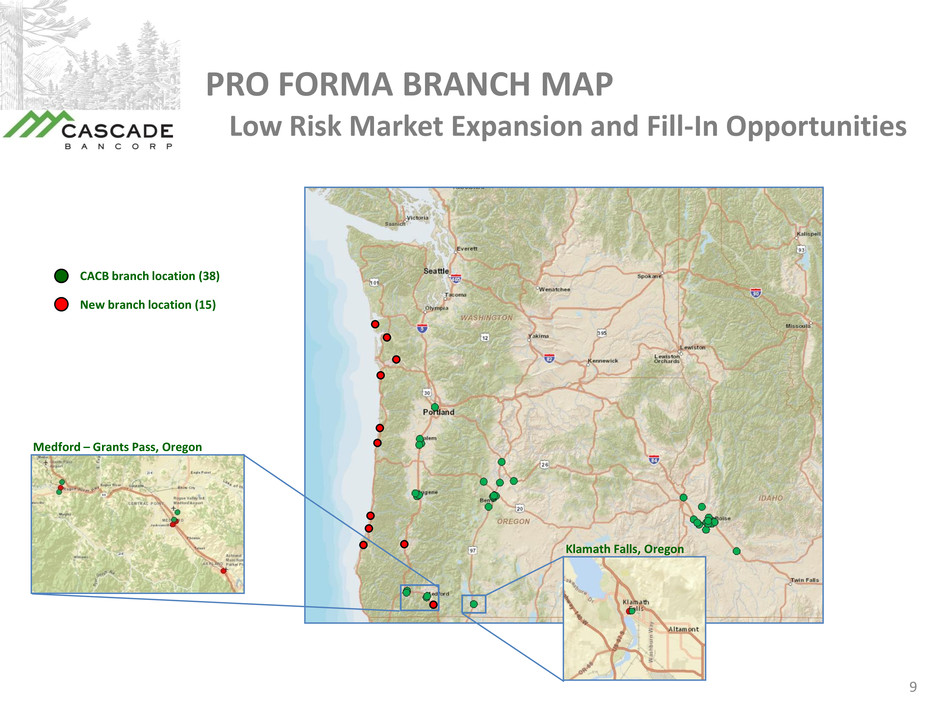
9 PRO FORMA BRANCH MAP Medford – Grants Pass, Oregon New branch location (15) CACB branch location (38) Klamath Falls, Oregon Low Risk Market Expansion and Fill-In Opportunities

10 Cascade Bancorp Bank of America Branches Pro Forma Bank of America Branches and Pro Forma composition reflect data as of June 30, 2015 and do not account for any assumed deposit run-off Total Deposits: $2,047 million Cost of Deposits: 0.08% Total Deposits: $707 million Cost of Deposits: 0.08% Total Deposits: $2,754 million PRO FORMA DEPOSIT COMPOSITION Time Deposits 15% Int Bearing 45% Checking 40% Time Deposits 11% Int Bearing 53% Checking 36% Time Deposits 10% Int Bearing 56% Checking 34%

FINANCIAL IMPACT AND ASSUMPTIONS • Deposit Retention: projecting 80% retained at closing — Approximately $565M (of current $707M balance) • Reinvestment of Funds: 1.92% blended yield on new securities — Compared to CACB yield on existing securities of 2.64% • Conservative deployment of liquidity into loans over time • Non-interest income/expense assumptions: — Retain 60% BofA service fee revenues — Incur 100% BofA direct costs • Modest integration costs 11 Conservative Assumptions Financially Attractive • Approximately 6.4% accretive to EPS in second half 2016 and 9.9% in 2017 • TBVPS payback and IRR at acceptable levels • Financial metrics improve dramatically with only a modest rate increase • Strong pro-forma balance sheet and capital ratios Conservative Assumptions & Low Risk Profile

FINANCIAL HIGHLIGHTS - Third Quarter 2015 • Net income of $5.1 million, or $0.07 per share, compared to $4.8 million or $0.07 per share in the previous quarter. • Return on average assets was 0.82% compared to 0.80% in the linked quarter • Return on equity was 6.16% compared to 5.92% in the linked quarter • Third quarter organic loan growth was approximately $26.3 million, or 7.7% annualized (net of a large construction payoff), and gross loans were $1.6 billion. • Total deposits were up $36.5 million, to $2.1 billion, with 57.5% in checking balances and 0.08% cost of funds • Solid credit quality metrics including $3.1 million of net recoveries, and an increased allowance for loan losses of 1.62% of gross loans • Net interest margin of 3.72%, compared to 3.70% in the linked quarter 12

LOAN COMPOSITION September 30, 2015 (1) Business loans < $1 million per CRA 2013 annual survey 13 Total Loans & Leases – $1.65 Billion Strong Credit Quality and Growth • #1 small business lender Bend MSA(1) • #4 small business lender Boise MSA(1) • Progress toward top SBA originator • Net recoveries every quarter since acquisition Commercial real estate: Owner occupied 19% Commerical real estate: Non- owner occupied 32%Construction 8% Residential real estate 17% Commercial and Industrial 22% Consumer 2%

MMDA & Savings, 69% DEPOSIT COMPOSITION September 30, 2015 (1) Peer set includes all banks nationwide with assets between $1B and $5B 14 Total Deposits – $2.10B Low Cost Core Deposits • Non-interest bearings deposits accounts up $44.7 million v. prior quarter • Up 6.3% linked quarter • 57.5% of total deposits are in checking account balances • 0.08% cost of funds • Ranks in top quartile of peer set Demand 36% Interest bearing demand 49% Savings 6% Time 9%

15 HOME had significant excess liquidity LOAN TO DEPOSIT RATIO 72.7% 74.1% 76.8% 78.2% 77.7% 68.0% 70.0% 72.0% 74.0% 76.0% 78.0% 80.0% 3Q14 4Q14 1Q15 2Q15 3Q15 Loa n t o D e po si t R at io • Building toward +80% loan to deposit ratio

16 Net Interest Margin NET INTEREST MARGIN & INCOME 3.63% 3.68% 3.74% 3.70% 3.72% 3.56% 3.58% 3.60% 3.62% 3.64% 3.66% 3.68% 3.70% 3.72% 3.74% 3.76% 3Q14 4Q14 1Q15 2Q15 3Q15 N et In te re st Ma rg in ( % ) • Progress on loan to deposit ratio • Cost of Funds improved to just 8 bps in Q3 2015 Net Interest Income ($000’s) 18,592 19,088 18,964 19,352 20,411 8,000 10,000 12,000 14,000 16,000 18,000 20,000 22,000 3Q14 4Q14 1Q15 2Q15 3Q15

17 Non Interest Income ($000’s) NON INTEREST INCOME & NON-INTEREST EXPENSE 5,533 6,472 6,122 6,695 6,384 2,000 3,000 4,000 5,000 6,000 7,000 3Q14 4Q14 1Q15 2Q15 3Q15 19,728 17,538 18,820 18,391 19,070 8,000 10,000 12,000 14,000 16,000 18,000 20,000 22,000 3Q14 4Q14 1Q15 2Q15 3Q15 Non-Interest Expense ($000’s)

$- $20,000 $40,000 $60,000 $80,000 $100,000 $120,000 $140,000 $160,000 Q3 Q4 Q1 Q2 Q3 Q4 Q1 Q2 Q3 Q4*Q1*Q2*Q3* 2012 2013 2014 2015 0% 10% 20% 30% 40% 50% 60% 70% 80% 90% Non-Performing Assets ($000s) IMPROVING CREDIT METRICS (Resolutions of NPA’s & Criticized and Classified Loans) Classified Assets to Tier 1 + ALLL ($000s) Classified Assets Total Classified Assets % of Tier 1+ALLL 18 Home Acquisition Total Non-Performing Assets Non-Performing Assets as a % of Total Assets * Excludes covered loans $- $5,000 $10,000 $15,000 $20,000 $25,000 $30,000 Q3 Q4 Q1 Q2 Q3 Q4 Q1 Q2 Q3 Q4*Q1*Q2*Q3* 2012 2013 2014 2015 0.0% 0.5% 1.0% 1.5% 2.0% 2.5% * Excludes covered loans Home Acquisition

Q&A
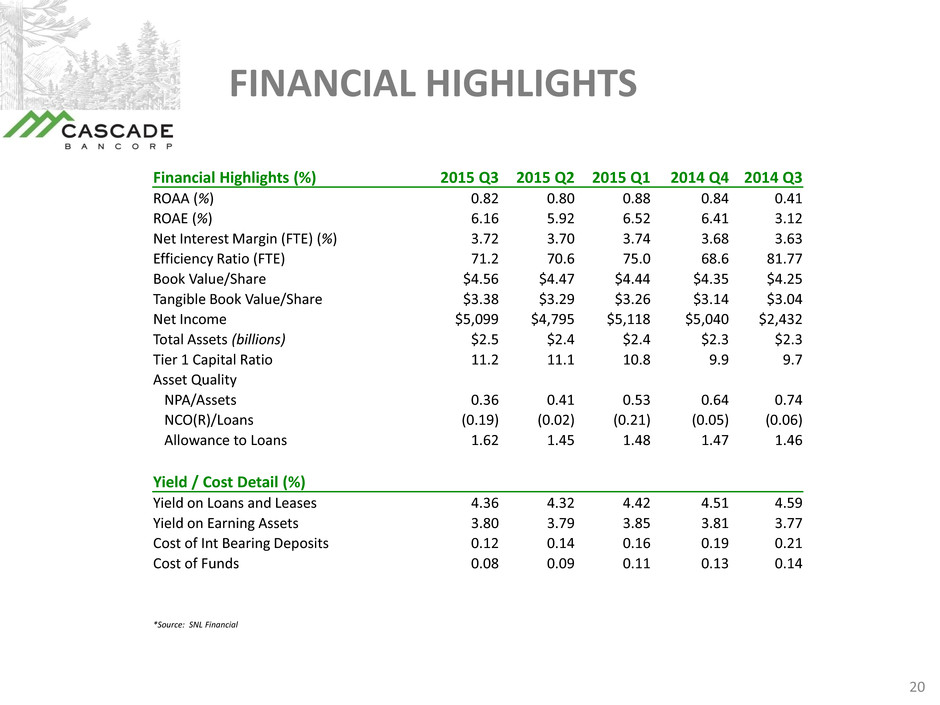
FINANCIAL HIGHLIGHTS 20 Financial Highlights (%) 2015 Q3 2015 Q2 2015 Q1 2014 Q4 2014 Q3 ROAA (%) 0.82 0.80 0.88 0.84 0.41 ROAE (%) 6.16 5.92 6.52 6.41 3.12 Net Interest Margin (FTE) (%) 3.72 3.70 3.74 3.68 3.63 Efficiency Ratio (FTE) 71.2 70.6 75.0 68.6 81.77 Book Value/Share $4.56 $4.47 $4.44 $4.35 $4.25 Tangible Book Value/Share $3.38 $3.29 $3.26 $3.14 $3.04 Net Income $5,099 $4,795 $5,118 $5,040 $2,432 Total Assets (billions) $2.5 $2.4 $2.4 $2.3 $2.3 Tier 1 Capital Ratio 11.2 11.1 10.8 9.9 9.7 Asset Quality NPA/Assets 0.36 0.41 0.53 0.64 0.74 NCO(R)/Loans (0.19) (0.02) (0.21) (0.05) (0.06) Allowance to Loans 1.62 1.45 1.48 1.47 1.46 Yield / Cost Detail (%) Yield on Loans and Leases 4.36 4.32 4.42 4.51 4.59 Yield on Earning Assets 3.80 3.79 3.85 3.81 3.77 Cost of Int Bearing Deposits 0.12 0.14 0.16 0.19 0.21 Cost of Funds 0.08 0.09 0.11 0.13 0.14 *Source: SNL Financial
