Attached files
| file | filename |
|---|---|
| EX-99.1 - EXHIBIT 99.1 - TOYS R US INC | bamlconference120215.pdf |
| 8-K - FORM 8-K - TOYS R US INC | tru1222015form8-k.htm |
Bank of America Merrill Lynch 2015 Leveraged Finance Conference December 2, 2015

2 This presentation contains “forward‐looking” statements within the meaning of the federal securities laws, and such statements are intended to be covered by the safe harbors created thereby. These forward‐looking statements reflect our current views with respect to, among other things, our operations and financial performance. All statements herein or therein that are not historical facts, including statements about our beliefs or expectations, are forward‐looking statements. We generally identify these statements by words or phrases, such as “anticipate,” “estimate,” “plan,” “project,” “expect,” “believe,” “intend,” “foresee,” “forecast,” “will,” “may,” “outlook” or the negative version of these words or other similar words or phrases. These statements discuss, among other things, our strategy, store openings, integration and remodeling, the development, implementation and integration of our Internet business, future financial or operational performance, projected sales for certain periods, same store sales from one period to another, cost savings, results of store closings and restructurings, outcome or impact of pending or threatened litigation, domestic or international developments, amount and allocation of future capital expenditures, growth initiatives, inventory levels, cost of goods, selection and type of merchandise, marketing positions, implementation of safety standards, future financings, estimates regarding future effective tax rates, and other goals and targets and statements of the assumptions underlying or relating to any such statements. These statements are subject to risks, uncertainties and other factors, including, among others, the seasonality of our business, competition in the retail industry, changes in our product distribution mix and distribution channels, general economic factors in the United States and other countries in which we conduct our business, consumer spending patterns, birth rates, our ability to implement our strategy including implementing initiatives for season, our ability to recognize cost savings, implementation and operation of our new eCommerce platform, marketing strategies, the availability of adequate financing, access to trade credit, changes in consumer preferences, changes in employment legislation, our dependence on key vendors for our merchandise, political and other developments associated with our international operations, potential savings in connection with any store closings, costs of goods that we sell, labor costs, transportation costs, domestic and international events affecting the delivery of toys and other products to our stores, product safety issues including product recalls, the existence of adverse litigation, changes in laws that impact our business, our substantial level of indebtedness and related debt‐service obligations, restrictions imposed by covenants in our debt agreements and other risks, uncertainties and factors set forth under Item 1A entitled “RISK FACTORS” of Toys“R”Us, Inc.’s Annual Report on Form 10‐K for the fiscal year ended January 31, 2015 and its other reports and documents filed with the Securities and Exchange Commission. In addition, we typically earn a disproportionate part of our annual operating earnings in the fourth quarter as a result of seasonal buying patterns and these buying patterns are difficult to forecast with certainty. These factors should not be construed as exhaustive, and should be read in conjunction with the other cautionary statements that are included in those reports and documents. We believe that all forward-looking statements are based on reasonable assumptions when made; however, we caution that it is impossible to predict actual results or outcomes or the effects of risks, uncertainties or other factors on anticipated results or outcomes and that, accordingly, one should not place undue reliance on these statements. Forward‐looking statements speak only as of the date they were made, and we undertake no obligation to update these statements in light of subsequent events or developments unless required by the Securities and Exchange Commission’s rules and regulations. Actual results and outcomes may differ materially from anticipated results or outcomes discussed in any forward‐looking statement. PRELIMINARY ESTIMATES The presentation includes estimates for the third quarter of fiscal 2015 (LTM, QTD and YTD), which are based on preliminary internal financial reports and are subject to revision based on the completion of the third fiscal quarter accounting and financial reporting processes. Accordingly, our actual results may differ from these estimates and such difference may be material. FORWARD LOOKING STATEMENTS
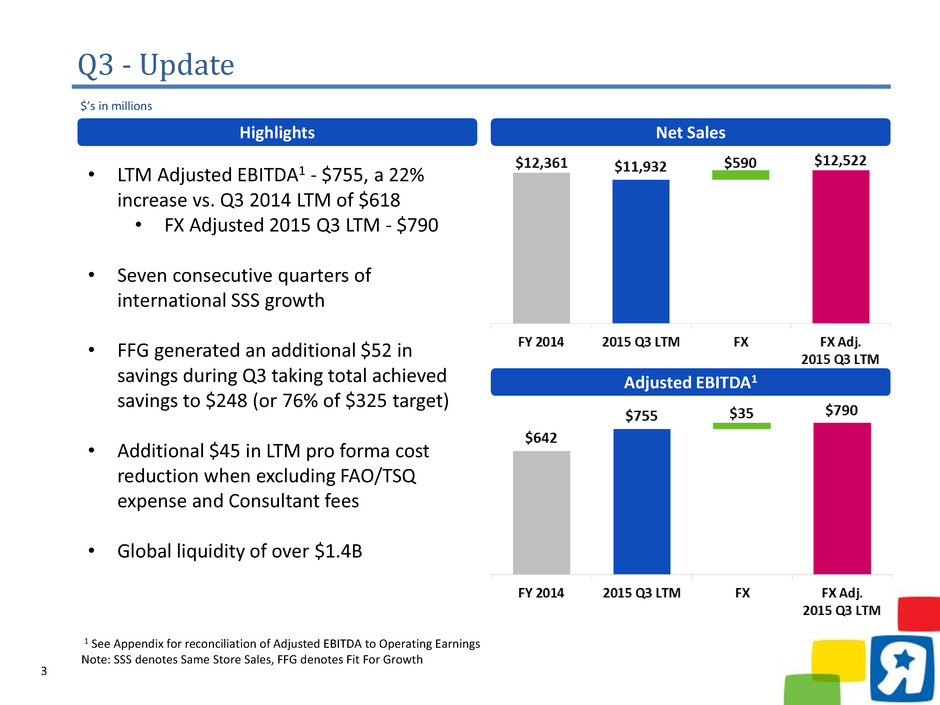
3 Q3 - Update $’s in millions • LTM Adjusted EBITDA1 - $755, a 22% increase vs. Q3 2014 LTM of $618 • FX Adjusted 2015 Q3 LTM - $790 • Seven consecutive quarters of international SSS growth • FFG generated an additional $52 in savings during Q3 taking total achieved savings to $248 (or 76% of $325 target) • Additional $45 in LTM pro forma cost reduction when excluding FAO/TSQ expense and Consultant fees • Global liquidity of over $1.4B Adjusted EBITDA1 Net SalesHighlights 1 See Appendix for reconciliation of Adjusted EBITDA to Operating Earnings Note: SSS denotes Same Store Sales, FFG denotes Fit For Growth
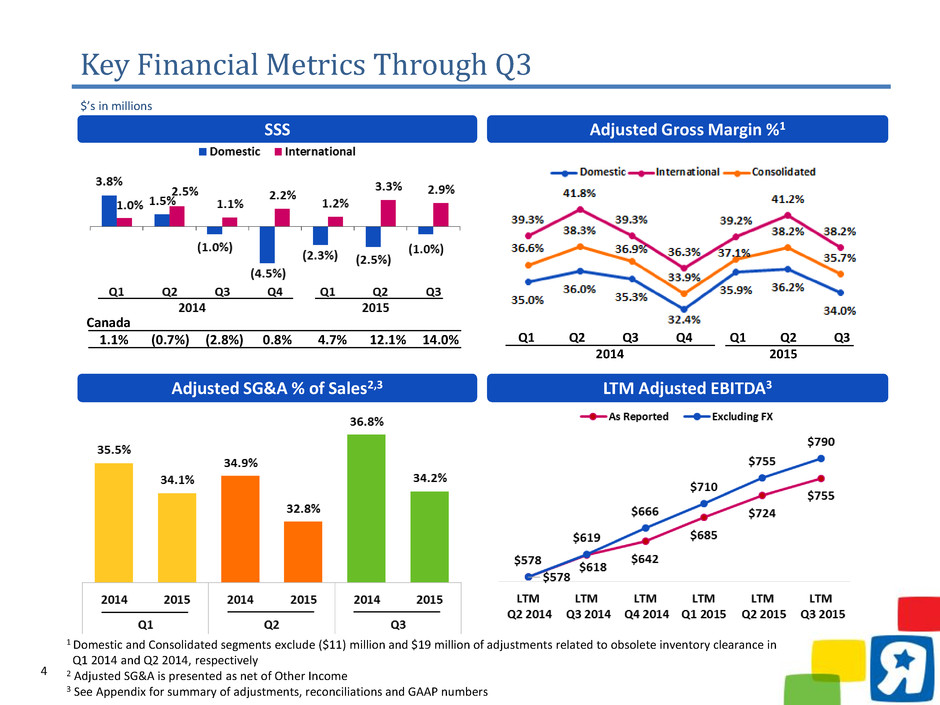
4 Key Financial Metrics Through Q3 SSS Q1 Q2 Q3 Q4 Q1 Q2 Q3 2014 2015 Adjusted Gross Margin %1 Adjusted SG&A % of Sales2,3 Canada 1.1% (0.7%) (2.8%) 0.8% 4.7% 12.1% 14.0% 1 Domestic and Consolidated segments exclude ($11) million and $19 million of adjustments related to obsolete inventory clearance in Q1 2014 and Q2 2014, respectively 2 Adjusted SG&A is presented as net of Other Income 3 See Appendix for summary of adjustments, reconciliations and GAAP numbers LTM Adjusted EBITDA3 $’s in millions
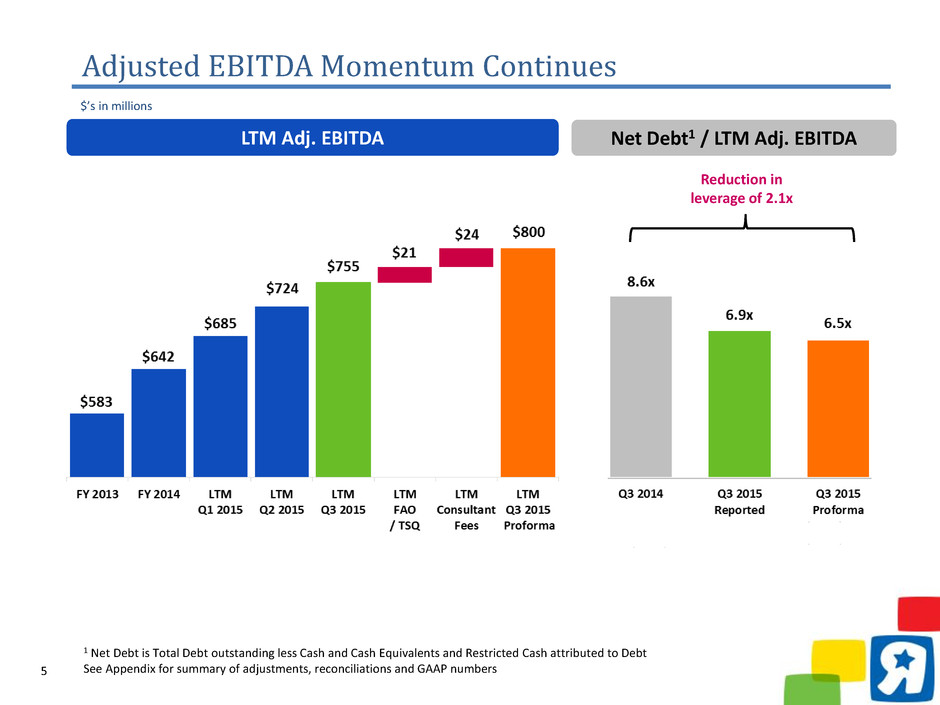
5 Adjusted EBITDA Momentum Continues LTM Adj. EBITDA Net Debt1 / LTM Adj. EBITDA Reduction in leverage of 2.1x 1 Net Debt is Total Debt outstanding less Cash and Cash Equivalents and Restricted Cash attributed to Debt See Appendix for summary of adjustments, reconciliations and GAAP numbers $’s in millions

6 FFG Update Fit For Growth $’s in millions 76% of FFG Target Achieved Q3 Progress Initiatives Dom. Intl. Con. Marketing Eff. $84 $-- $84 End-to-End 27 -- 27 Private Label 18 12 30 Sub-total Margin $129 $12 $141 In-Store Operations $50 $15 $65 Supply Chain 3 6 9 Organizational Eff. 25 12 37 Procurement & Other 56 17 73 Sub-total SG&A $134 $50 $184 Fit For Growth Target $263 $62 $325 Fit For Growth Achieved $220 $28 $248 Balance Remaining $43 $34 $77 Margin SG&A
7 OUR PASSION IS TO HELP FAMILIES ON THEIR JOURNEY TO RAISE HAPPY, HEALTHY, THRIVING CHILDREN!

8 Grow and Build the TRU and BRU Brands Throughout the World • Invest in stores • Become Birthday celebration destination • Grow private label • Smaller concept stores • Faster international expansion Create a World Class Experience for Our Customers • Develop empowered in-store teams • Successfully complete the e-commerce insourcing project • Fix “leaky bucket” customer attrition • Redefine customer complaints handling system Create a Strong Financial Foundation • Continue to drive savings from Fit For Growth • Transition to growth phase • Create global “centers of excellence” around key functions • Joint business planning with key partners Make Talent and Culture a Competitive Advantage • Create opportunities for sharing “Best Practices” • Enhance career development programs • Improve succession planning process • Launch a new variable pay program Strategic Pillars

9 • Deliver authority through deep assortment of key brands and categories • Implement new marketing campaign to build engagement • Ensure full shelves with improved approach to in-stocks • Drive continuous improvement in customer experience and omnichannel execution Focus for Holiday Season
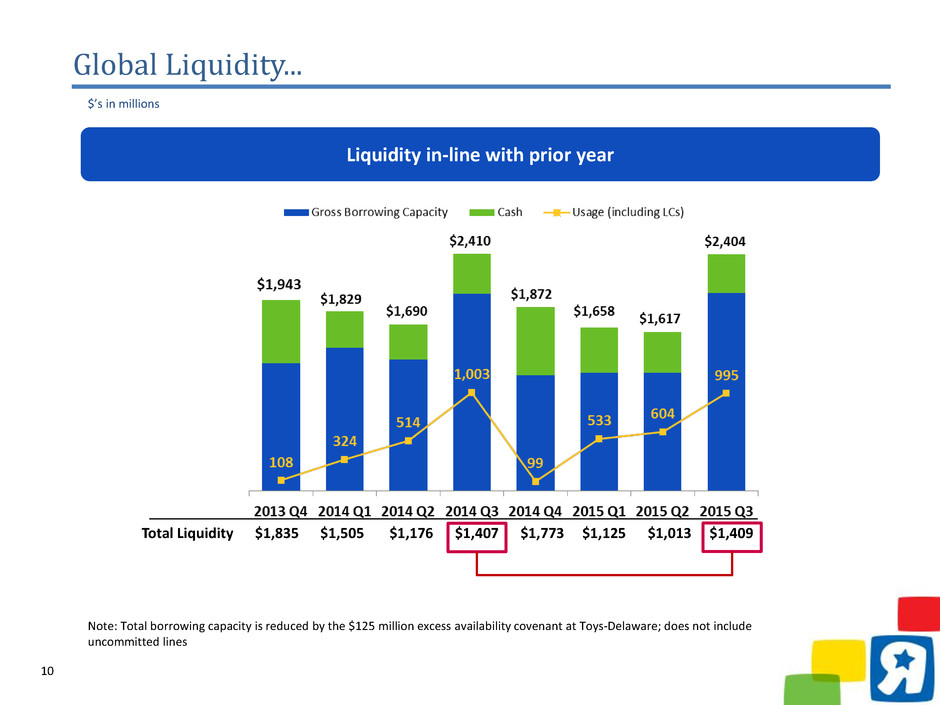
10 Total Liquidity $1,835 $1,505 $1,176 $1,407 $1,773 $1,125 $1,013 $1,409 Global Liquidity... $’s in millions Liquidity in-line with prior year Note: Total borrowing capacity is reduced by the $125 million excess availability covenant at Toys-Delaware; does not include uncommitted lines
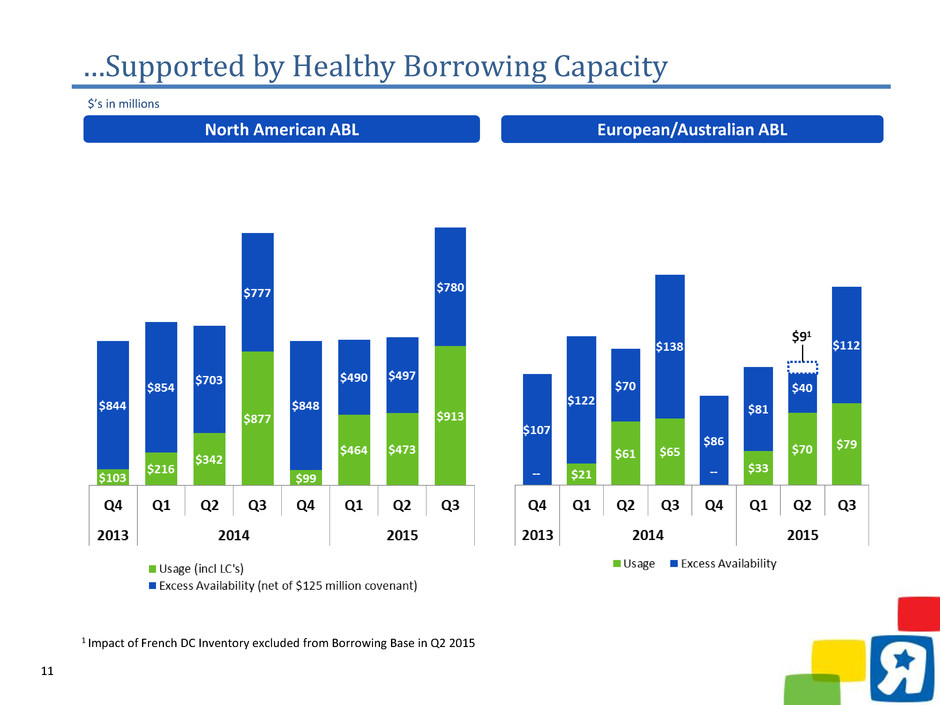
11 …Supported by Healthy Borrowing Capacity European/Australian ABLNorth American ABL 1 Impact of French DC Inventory excluded from Borrowing Base in Q2 2015 $’s in millions
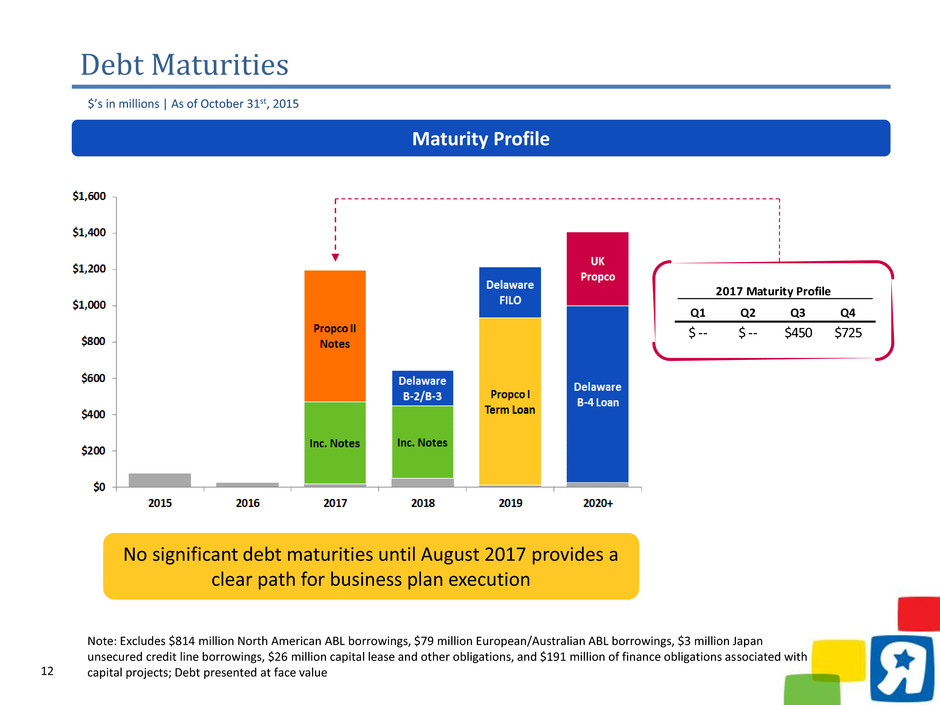
12 Debt Maturities Maturity Profile Note: Excludes $814 million North American ABL borrowings, $79 million European/Australian ABL borrowings, $3 million Japan unsecured credit line borrowings, $26 million capital lease and other obligations, and $191 million of finance obligations associated with capital projects; Debt presented at face value 2017 Maturity Profile Q1 Q2 Q3 Q4 $ -- $ -- $450 $725 No significant debt maturities until August 2017 provides a clear path for business plan execution $’s in millions | As of October 31st, 2015
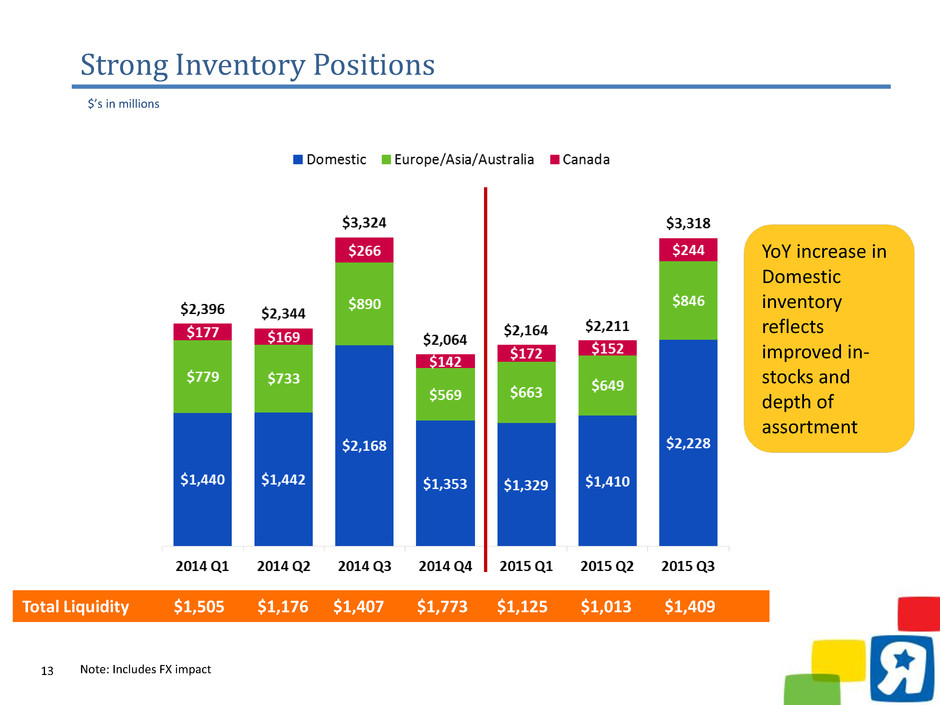
13 Strong Inventory Positions Note: Includes FX impact Total Liquidity $1,505 $1,176 $1,407 $1,773 $1,125 $1,013 $1,409 YoY increase in Domestic inventory reflects improved in- stocks and depth of assortment $’s in millions

14 Appendix
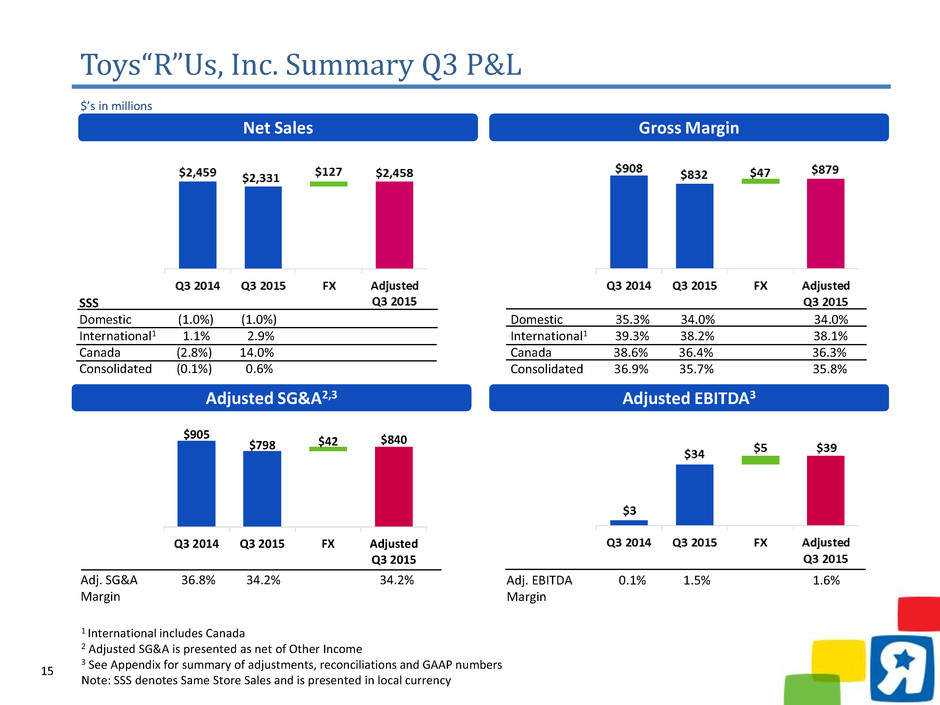
15 Net Sales Gross Margin Toys“R”Us, Inc. Summary Q3 P&L Adjusted SG&A2,3 Adjusted EBITDA3 Adj. SG&A 36.8% 34.2% 34.2% Margin Adj. EBITDA 0.1% 1.5% 1.6% Margin $’s in millions 1 International includes Canada 2 Adjusted SG&A is presented as net of Other Income 3 See Appendix for summary of adjustments, reconciliations and GAAP numbers Note: SSS denotes Same Store Sales and is presented in local currency SSS Domestic (1.0%) (1.0%) International1 1.1% 2.9% Canada (2.8%) 14.0% Consolidated (0.1%) 0.6% Domestic 35.3% 34.0% 34.0% International1 39.3% 38.2% 38.1% Canada 38.6% 36.4% 36.3% Consolidated 36.9% 35.7% 35.8% $905 $798 $840 $42 Q3 2014 Q3 2015 FX Adjusted Q3 2015
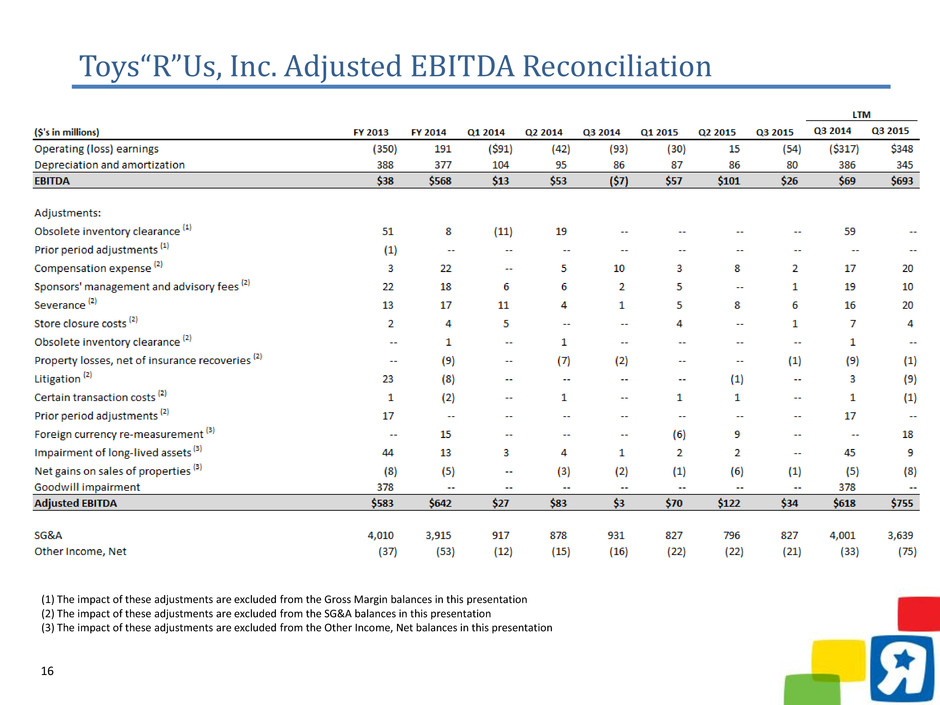
16 Toys“R”Us, Inc. Adjusted EBITDA Reconciliation (1) The impact of these adjustments are excluded from the Gross Margin balances in this presentation (2) The impact of these adjustments are excluded from the SG&A balances in this presentation (3) The impact of these adjustments are excluded from the Other Income, Net balances in this presentation
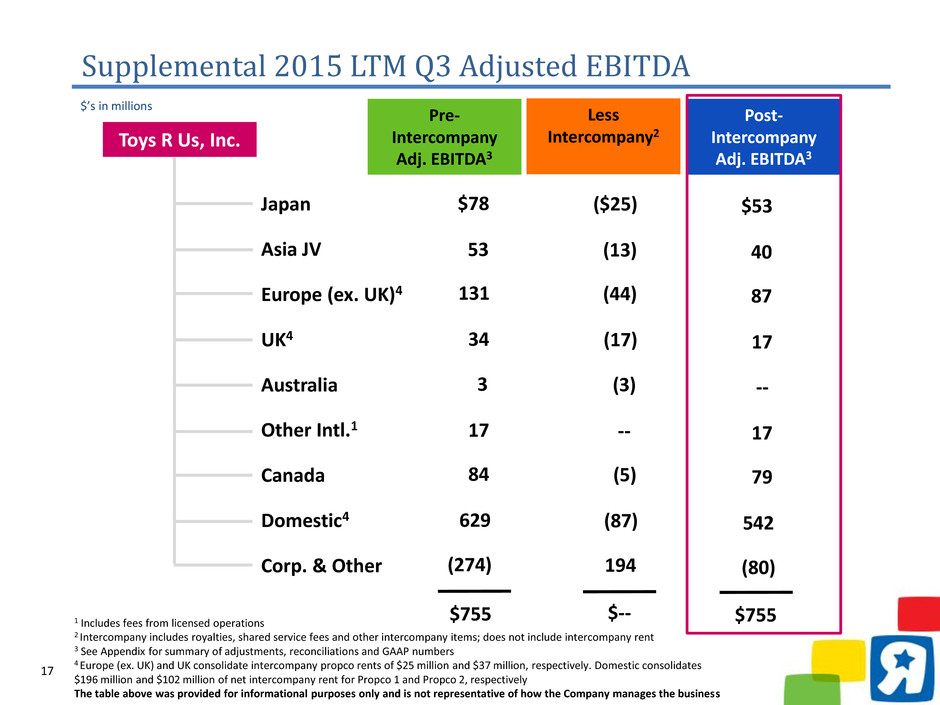
17 Supplemental 2015 LTM Q3 Adjusted EBITDA $’s in millions $78 53 131 34 3 17 84 629 (274) ($25) (13) (44) (17) (3) -- (5) (87) 194 $53 40 87 17 -- 17 79 542 (80) $755 $-- $755 Japan Asia JV Europe (ex. UK)4 UK4 Australia Other Intl.1 Canada Domestic4 Corp. & Other 1 Includes fees from licensed operations 2 Intercompany includes royalties, shared service fees and other intercompany items; does not include intercompany rent 3 See Appendix for summary of adjustments, reconciliations and GAAP numbers 4 Europe (ex. UK) and UK consolidate intercompany propco rents of $25 million and $37 million, respectively. Domestic consolidates $196 million and $102 million of net intercompany rent for Propco 1 and Propco 2, respectively The table above was provided for informational purposes only and is not representative of how the Company manages the business Post- Intercompany Adj. EBITDA3 Pre- Intercompany Adj. EBITDA3 Toys R Us, Inc. Less Intercompany2

18 Supplemental Adjusted LTM Q3 2015 EBITDA Reconciliation (1) The impact of these adjustments are excluded from the SG&A balances in this presentation (2) The impact of these adjustments are excluded from Other Income, Net balances in this presentation Note: Intercompany includes royalties, shared service fees and other intercompany items

19 (1) The impact of these adjustments are excluded from the SG&A balances in this presentation (2) The impact of these adjustments are excluded from Other Income, Net balances in this presentation Note: Intercompany includes royalties, shared service fees and other intercompany items Supplemental Adjusted YTD Q3 2015 EBITDA Reconciliation
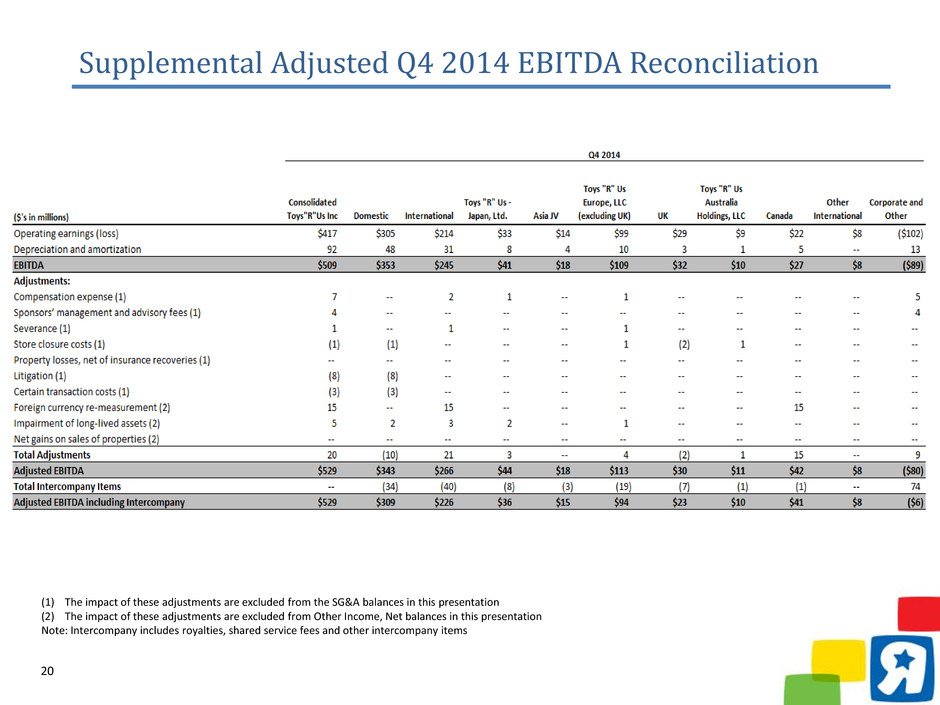
20 (1) The impact of these adjustments are excluded from the SG&A balances in this presentation (2) The impact of these adjustments are excluded from Other Income, Net balances in this presentation Note: Intercompany includes royalties, shared service fees and other intercompany items Supplemental Adjusted Q4 2014 EBITDA Reconciliation

21 Simplified Capital Structure Toys“R”Us, Inc. Toys“R”Us Property Company II, LLC (“PropCo II”) Term Loan | $929 Properties | 322 Senior Notes | $850 Note: Chart has been simplified and does not include all entities; debt balances presented at face value and excludes capital leases and other and finance obligations associated with capital projects Toys“R”Us Property Company I, LLC (“PropCo I”) Toys“R”Us- Delaware, Inc. (Toys-Delaware) Toys“R”Us Europe Toys“R”Us Japan Asia Joint Venture Credit Lines| $3 Bank Loans | $56 Short-term borrowings| $8 Secured Notes | $725 Properties | 123 European PropCos (UK, France, & Spain) Loans | $483 Properties | 66 ABL | $814 B4 Term Loan | $1,018 Loans and Notes | $499 ABL | $79 Wayne Real Estate Parent Company, LLC Guaranty of B4 Term Loan $’s in millions | As of October 31st, 2015
