Attached files
| file | filename |
|---|---|
| 8-K - 8-K - RCI HOSPITALITY HOLDINGS, INC. | v425823_8k.htm |
Exhibit 99.1

NASDAQ: RICK LD Micro Investor Conference December 3, 2015 www.rcihospitality.com 2015 – 20 th Anniversary of RCI’s IPO Two decades of innovation in the adult club segment of the hospitality industry

2 Forward Looking Statements Certain statements contained in this presentation regarding RCI Hospitality future operating results or performance or business plans or prospects and any other statements not constituting historical fact are "forward - looking statements" subject to the safe harbor created by the Private Securities Litigation Reform Act of 1995. Where possible, the words "believe," "expect," "anticipate," "intent," "would," "will," "planned ," "estimated," "potential," "goal," "outlook," and similar expressions, as they relate to the company or its management have been used to identify such f orw ard - looking statements. All forward - looking statements reflect only current beliefs and assumptions with respect to future business plans, prospects, de cisions and results, and are based on information currently available to the company. Accordingly, the statements are subject to significant risks, uncertainties and contingencies, which could cause the company‘ s a ctual operating results, performance or business plans or prospects to differ materially from those expressed in, or implied by, these statements. Such risks, uncertainties and contingencies include, but are not limited to, risks and uncertainties associated with (i) oper ati ng and managing an adult business, (ii) the business climates in cities where the company operates, (iii) the success or lack thereof in launching and bu ilding the company’s businesses, (iv) the operational and financial results of the company's adult nightclubs, (v) conditions relevant to real estate transactions, (vi) the loss of key personnel, (vii) laws governing the operation of adult entertainment businesses, and (viii) the inability to open and operate our restaurants at a profit. Additional factors that could cause the company’s results to differ materially from those described in the forward - looking state ments are described in forms filed with the SEC from time to time and available at www.rcihospitality.com or on the SEC's internet website at www.sec.gov. Unless required by law, RCI Hospitality does not undertake any obligation to update publicly any forward - looking statements, whether as a result of new information, future events, or otherwise. December 2015 Investor Presentation

Leader in Gentlemen’s Clubs and Sports Bars/Restaurants 3 December 2015 Investor Presentation • Pioneered elegant gentlemen's clubs • Powerful brands, quality environments, beautiful entertainers, excellent restaurants • Since IPO, transformed RCI into a leading hospitality company • Subsidiaries own/operate 43 adult clubs and restaurant/bars • Larger units in major cities: New York, Miami, Philadelphia, Dallas/Ft. Worth, Minneapolis • Smaller units through South/Southwest • High gross margin, low cap - ex, high cash flow business that often requires real estate ownership Founded 1983 IPO (NASDAQ) 1995 Total Revenues (TTM*) $143 million GAAP EPS (TTM*) $1.27 Non - GAAP EPS (TTM*) $1.48 Shares Out (6/30/15) 10.245 million Market Cap (11/1/15) $102 million Major Brands / Variety of Formats * 12 months ended 6/30/15
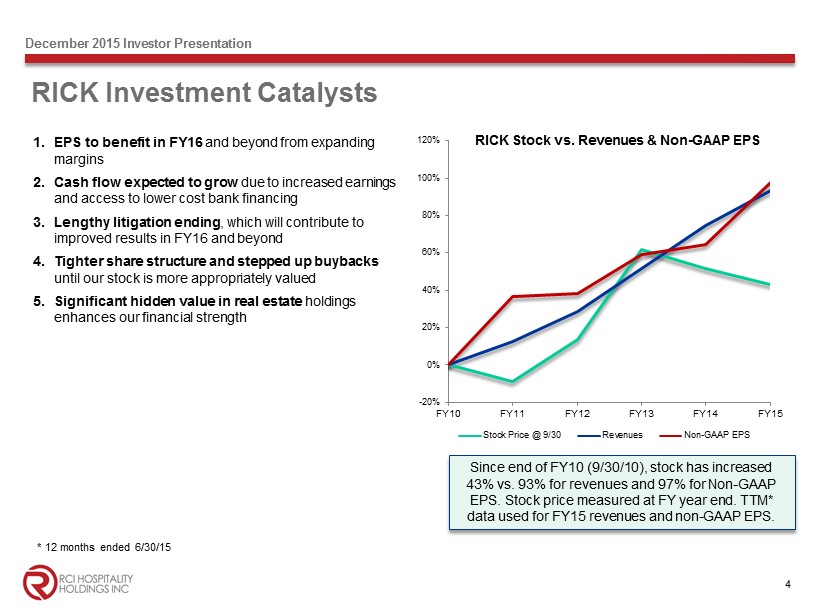
RICK Investment Catalysts 4 December 2015 Investor Presentation -20% 0% 20% 40% 60% 80% 100% 120% FY10 FY11 FY12 FY13 FY14 FY15 RICK Stock vs. Revenues & Non - GAAP EPS Stock Price @ 9/30 Revenues Non-GAAP EPS Since end of FY10 (9/30/10), stock has increased 43% vs. 93% for revenues and 97% for Non - GAAP EPS. Stock price measured at FY year end. TTM* data used for FY15 revenues and non - GAAP EPS. 1. EPS to benefit in FY16 and beyond from expanding margins 2. Cash flow expected to grow due to increased earnings and access to lower cost bank financing 3. Lengthy litigation ending , which will contribute to improved results in FY16 and beyond 4. Tighter share structure and stepped up buybacks until our stock is more appropriately valued 5. Significant hidden value in real estate holdings enhances our financial strength * 12 months ended 6/30/15
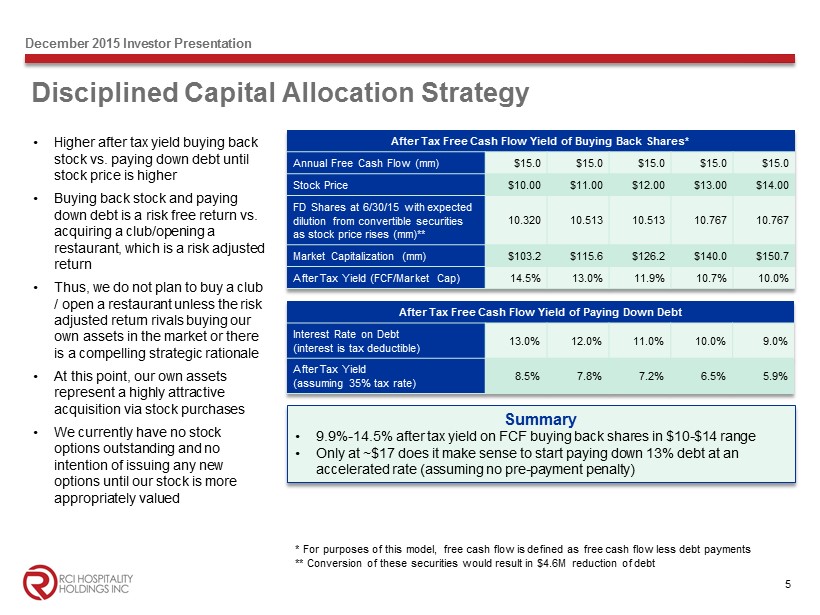
Disciplined Capital Allocation Strategy 5 December 2015 Investor Presentation After Tax Free Cash Flow Yield of Buying Back Shares* Annual Free Cash Flow (mm) $15.0 $15.0 $15.0 $15.0 $15.0 Stock Price $10.00 $11.00 $12.00 $13.00 $14.00 FD Shares at 6/30/15 with expected dilution from convertible securities as stock price rises (mm )** 10.320 10.513 10.513 10.767 10.767 Market Capitalization (mm) $103.2 $115.6 $126.2 $140.0 $150.7 After Tax Yield (FCF/Market Cap) 14.5% 13.0% 11.9% 10.7% 10.0% • Higher after tax yield buying back stock vs. paying down debt until stock price is higher • Buying back stock and paying down debt is a risk free return vs. acquiring a club/opening a restaurant, which is a risk adjusted return • Thus, we do not plan to buy a club / open a restaurant unless the risk adjusted return rivals buying our own assets in the market or there is a compelling strategic rationale • At this point, our own assets represent a highly attractive acquisition via stock purchases • We currently have no stock options outstanding and no intention of issuing any new options until our stock is more appropriately valued Summary • 9.9% - 14.5% after tax yield on FCF buying back shares in $10 - $14 range • Only at ~$ 17 does it make sense to start paying down 13% debt at an accelerated rate (assuming no pre - payment penalty) * For purposes of this model, free cash flow is defined as free cash flow less debt payments ** Conversion of these securities would result in $4.6M reduction of debt After Tax Free Cash Flow Yield of Paying Down Debt Interest Rate on Debt (interest is tax deductible) 13.0% 12.0% 11.0% 10.0% 9.0% After Tax Yield (assuming 35% tax rate) 8.5% 7.8% 7.2% 6.5% 5.9%

6 December 2015 Investor Presentation Adjusted EBITDA* Growth ($ in millions) $7.3 $9.4 $8.0 $7.6 $9.7 $10.2 $8.2 $0 $3 $6 $9 $12 1Q14 2Q14 3Q14 4Q14 1Q15 2Q15 3Q15 $18.0 $23.5 $24.0 $28.5 $32.5 $0 $10 $20 $30 $40 2010 2011 2012 2013 2014 • Reflects RCI’s cash generating power to buy back stock and finance growth • 9M15: Up ~$4M YoY • FY10 - 14: Up 80% • We also have at least ~$50M in off balance sheet, unencumbered real estate value, based on conservative estimates * See Appendix for reconciliation to GAAP

7 December 2015 Investor Presentation • 9M15 buyback spend exceeds FY12 • $6.6M of remaining Board authorization at 6/30/15 • FY16’s buyback spend will likely exceed FY11’s Undervaluation Spurs Share Buybacks ($ in millions) $3.3 $2.1 $1.6 $1.2 $2.3 $0 $1 $2 $3 $4 FY11 FY12 FY13 FY14 9M15 Capital Returned via Buybacks 415,384 262,054 192,455 101,330 225,280 0 125,000 250,000 375,000 500,000 FY11 FY12 FY13 FY14 9M15 Shares Retired via Buybacks

Major Legal Issues Behind Us 8 December 2015 Investor Presentation Item Resolution ($ in millions) NYS FLSA Lawsuit • Possible $20M or more judgement • Settled for a maximum of $15M in FY15; established $10.3M accrual • All contracts since 2011 contain no class action participation/arbitration clauses Texas Patron Tax • Possible $17M payment • Settled for $10M in FY15 to be paid over 84 months • Resulted in $8.2M FY15 pre - tax gain • No additional tax increase
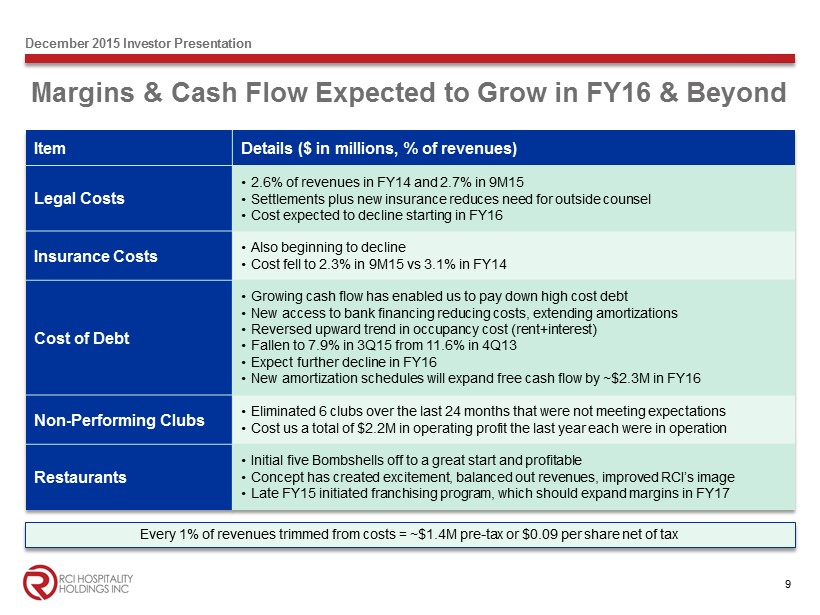
Margins & Cash Flow Expected to Grow in FY16 & Beyond 9 December 2015 Investor Presentation Item Details ($ in millions, % of revenues) Legal Costs • 2.6% of revenues in FY14 and 2.7% in 9M15 • Settlements plus new insurance reduces need for outside counsel • Cost expected to decline starting in FY16 Insurance Costs • Also beginning to decline • Cost fell to 2.3% in 9M15 vs 3.1% in FY14 Cost of Debt • Growing cash flow has enabled us to pay down high cost debt • New access to bank financing reducing costs, extending amortizations • Reversed upward trend in occupancy cost (rent+interest) • Fallen to 7.9% in 3Q15 from 11.6% in 4Q13 • Expect further decline in FY16 • New amortization schedules will expand free cash flow by ~$2.3M in FY16 Non - Performing Clubs • Eliminated 6 clubs over the last 24 months that were not meeting expectations • Cost us a total of $2.2M in operating profit the last year each were in operation Restaurants • Initial five Bombshells off to a great start and profitable • Concept has created excitement, balanced out revenues, improved RCI’s image • Late FY15 initiated franchising program, which should expand margins in FY17 Every 1% of revenues trimmed from costs = ~$1.4M pre - tax or $0.09 per share net of tax
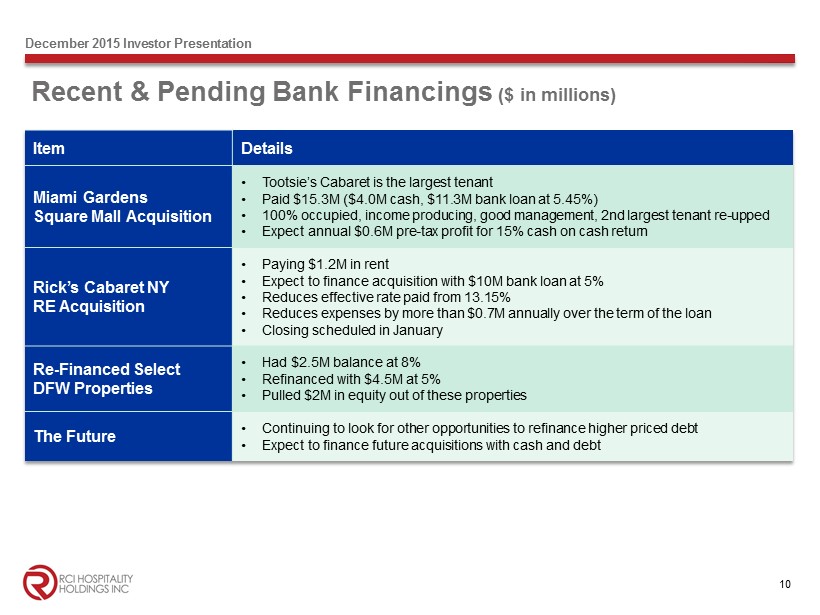
10 December 2015 Investor Presentation Recent & Pending Bank Financings ($ in millions) Item Details Miami Gardens Square Mall Acquisition • Tootsie’s Cabaret is the largest tenant • Paid $15.3M ($4.0M cash, $11.3M bank loan at 5.45%) • 100% occupied, income producing, good management, 2nd largest tenant re - upped • Expect annual $0.6M pre - tax profit for 15% cash on cash return Rick’s Cabaret NY RE Acquisition • Paying $1.2M in rent • Expect to finance acquisition with $10M bank loan at 5% • Reduces effective rate paid from 13.15% • Reduces expenses by more than $0.7M annually over the term of the loan • Closing scheduled in January Re - Financed Select DFW Properties • Had $2.5M balance at 8% • Refinanced with $4.5M at 5% • Pulled $2M in equity out of these properties The Future • Continuing to look for other opportunities to refinance higher priced debt • Expect to finance future acquisitions with cash and debt

Rent+Interest Falling (as % of total revenues) December 2015 Investor Presentation 5.2 4.2 3.5 3.9 3.3 3.1 3.2 3.3 6.4 6.8 5.9 6.2 5.2 4.4 4.8 4.6 11.6 11.0 9.4 10.1 8.5 7.5 8.0 7.9 2 3 4 5 6 7 8 9 10 11 12 4Q13 1Q14 2Q14 3Q14 4Q14 1Q15 2Q15 3Q15 Rent Interest Rent+Interest RCI views Rent+Interest as our cost of occupancy 11

Nightclubs: Best in the Business 12 December 2015 Investor Presentation • Our subsidiaries own 38 of the best, most well run gentlemen’s clubs in the country • 27 (71%) in Texas, with different formats and customer bases • 11 (29%) mostly larger clubs outside of Texas, many of them with national reputations • Tootsies Cabaret Miami: The nation’s largest adult club, with 74,000 square feet • Rick’s Cabaret New York and Vivid Cabaret New York: The top two clubs in Manhattan • FY10 - 14: ~80% new clubs acquired, 20% developed in house • Due to licensing, more opportunities for acquiring clubs than opening new ones Why Are Our Clubs So Successful? • Constant innovation • Applying hospitality industry best practices to adult clubs • Friendly, elegant atmosphere for customers and entertainers • Recruiting highly skilled, highly motivated managers/staff • Las Vegas style cash/credit card systems/security

13 December 2015 Investor Presentation $ in millions 9M15 9M14 Change Revenues $93.6 $91.0 2.8% Units (at 6/30/15 and 6/30/14) 39 39 -- Adjusted Operating Income* $29.8 $29.5 1.0% Adjusted Operating Margin* 31.8% 32.3% (55 bps) Nightclubs Segment Results * See Appendix for reconciliation to GAAP

Nightclubs Future 14 December 2015 Investor Presentation • Universe of ~500 clubs we would consider owning out of total ~3,500 US clubs • Many owners plan to retire in the years ahead • With increasing access to bank financing, we can consolidate the industry • Focus on club groups with market presence or “fill - in” acquisitions to leverage resources — no “one offs” unless unique • RCI has developed proven methods to analyze potential acquisitions and then expand revenue and margins under our ownership • Selective opportunities to continue to develop clubs in - house The Seville Club (Minneapolis) May 2015 • Elegant atmosphere • Near existing Rick’s and Downtown Cabaret • $8.5M for club, building and RE Down in Texas Saloon (Austin) January 2015 • Country - themed club • Near existing Rick’s and Bombshells • $6.8M for club, building and RE Recent Acquisitions

Bombshells: We’ve Proven the Concept 15 December 2015 Investor Presentation • First military - themed franchise in the sports bar/casual dining segment • Theme comes alive through design strategy and Bombshell Girls • Feature local bands, DJs, large outdoor patios, and +75 flat screen TVs, complete bar and menu • Attracts families, singles and couples, for lunch, dinner and late night • First unit in Dallas in 2013, now 5 in Texas, 2015 first full year of operation • Approximately 50% liquor • Typical units: 7,500 - 10,000 square feet • Initial investment: $1.75M - $3.1M, depending on size and type of space • Launched nationwide franchising in October (royalty is 5.5% of gross sales) Investment Highlights • Leverages core hospitality expertise • Requires less cash investment than nightclubs • Can lease, not own; less rigorous licensing • With proven concept, new unit success depends on right location and staff

16 December 2015 Investor Presentation $ in millions 9M15 9M14 Change Revenues $14.5 $3.7 4.0x Units 5 2 2.5x Operating Income $1.5 ($0.268) +$1.75 Operating Margin 10.2% (7.3%) +1751 bps Bombshells Segment Results Bombshells Future • Gradually roll out new units • Sell first franchises in FY16 • FY17 should see significantly higher sales and margins

17 December 2015 Investor Presentation Steady Total Revenue Growth ($ in millions ) • 9M15: Up 14.7% YoY • FY10 - 14: 14.9% CAGR $74.1 $83.5 $95.2 $112.2 $129.2 $95.6 $109.7 $30 $55 $80 $105 $130 2010 2011 2012 2013 2014 9M14 9M15

18 December 2015 Investor Presentation Continued Non - GAAP EPS* Growth $0.76 $1.04 $1.05 $1.21 $1.25 $0.99 $1.22 $0.25 $0.50 $0.75 $1.00 $1.25 2010 2011 2012 2013 2014 9M14 9M15 • As of 9M15, we have earned nearly as much as all of FY14 • 9M15: Up 23.2% YoY • FY10 - 14: 13.3% CAGR * See Appendix for reconciliation to GAAP

Summary: Why Invest in RICK? 19 December 2015 Investor Presentation -20% 0% 20% 40% 60% 80% 100% 120% FY10 FY11 FY12 FY13 FY14 FY15 RICK Stock vs. Revenues & Non - GAAP EPS Stock Price @ 9/30 Revenues Non-GAAP EPS Since end of FY10 (9/30/10), stock has increased 43% vs. 93% for revenues and 97% for Non - GAAP EPS. Stock price measured at FY year end. TTM* data used for FY15 revenues and non - GAAP EPS. 1. EPS to benefit in FY16 and beyond from expanding margins 2. Cash flow expected to grow due to increased earnings and access to lower cost bank financing 3. Lengthy litigation ending , which will contribute to improved results in FY16 and beyond 4. Tighter share structure and stepped up buybacks until our stock is more appropriately valued 5. Significant hidden value in real estate holdings enhances our financial strength * 12 months ended 6/30/15

APPENDIX 2015 – 20 th Anniversary of RCI’s IPO Two decades of innovation in the adult club segment of the hospitality industry
Explanation of Non - GAAP Terms In addition to our financial information presented in accordance with GAAP, management uses certain “non - GAAP financial measures ” within the meaning of the SEC Regulation G, to clarify and enhance understanding of past performance and prospects for the future. Gener all y, a non - GAAP financial measure is a numerical measure of a company’s operating performance, financial position or cash flows that excludes or includes amounts that are included in or excluded from the most directly comparable measure calculated and presented in accordance with GAAP. We monitor non - GAAP financial measures because it describes the operating performance of the company and helps management and investors gaug e o ur ability to generate cash flow, excluding some recurring charges that are included in the most directly comparable measures calculated an d p resented in accordance with GAAP. Relative to each of the non - GAAP financial measures, we further set forth our rationale as follows: • Non - GAAP Operating Income and Non - GAAP Operating Margin. We exclude from non - GAAP operating income and non - GAAP operating margin amortization of intangibles, gain on settlement of patron tax case, pre - opening costs, gains and losses from asset sales, stock - based compensation charges, litigation and other one - time legal settlements and acquisition costs. We believe that excluding these items assists in vestors in evaluating period - over - period changes in our operating income and operating margin without the impact of items that are not a result of our day - to - day business and operations. While we were in litigation in the patron tax case, we also included patron taxes as an exclusion, but after settlement of the case, we no longer exclude patron taxes from operating income. • Non - GAAP Net Income and Non - GAAP Net Income per Basic Share and per Diluted Share. We exclude from non - GAAP net income and non - GAAP net income per diluted share and per basic share amortization of intangibles, gain on settlement of patron tax case, pre - opening costs, income tax expense, impairment charges, gains and losses from asset sales, stock - based compensation, litigation and other one - time legal se ttlements and acquisition costs, and include the Non - GAAP provision for income taxes, calculated as the tax - effect at 35% effective tax rate o f the pre - tax non - GAAP income before taxes less stock - based compensation, because we believe that excluding such measures helps management and inv estors better understand our operating activities. While we were in litigation in the patron tax case, we also included patron taxe s a s an exclusion, but after settlement of the case, we no longer exclude patron taxes from net income. • Adjusted EBITDA. We exclude from Adjusted EBITDA depreciation expense, amortization of intangibles, income tax, interest expense, interest income, gains and losses from asset sales, acquisition costs, litigation and other one - time legal settlements, gain on settlemen t of patron tax case and impairment charges because we believe that adjusting for such items helps management and investors better understand oper ati ng activities. Adjusted EBITDA provides a core operational performance measurement that compares results without the need to adjust for Fede ral , state and local taxes which have considerable variation between domestic jurisdictions. Also, we exclude interest cost in our calculat ion of Adjusted EBITDA. The results are, therefore, without consideration of financing alternatives of capital employed. We use Adjusted EBITDA as on e g uideline to assess our unleveraged performance return on our investments. Adjusted EBITDA is also the target benchmark for our acquisitions of n igh tclubs. Our Form 10 - Q for the fiscal third quarter ended June 30, 2015 and our August 10, 2015 news release contain additional details r elative to the non - GAAP financial measures and are posted on our website at www.rcihospitality.com . 21 December 2015 Investor Presentation

Annual Non - GAAP Reconciliation Data 22 December 2015 Investor Presentation (in thousands, except per share data) 2010 2011 2012 2013 2014 Reconciliation of GAAP net income to Adjusted EBITDA GAAP net income (7,958)$ 7,846$ 7,578$ 9,191$ 11,240$ Income tax expense 2,998 5,403 4,292 5,414 5,916 Interest expense and income and gain on derivative 4,504 4,042 4,177 7,067 7,752 Litigation and other one-time settlements - - 2,533 707 3,696 Impairment of assets 3,574 - - - 2,294 Pre-opening costs - - - 660 800 Acquisition costs 88 119 462 166 124 Depreciation and amortization 3,225 3,904 4,965 5,337 6,316 Loss from discontinued operations 11,603 2,195 Gain on contractual debt reduction - - - - (5,642) Adjusted EBITDA 18,034$ 23,509$ 24,007$ 28,542$ 32,496$ Reconcilation of GAAP net income (loss) to non-GAAP net income GAAP net income (7,958)$ 7,846$ 7,578$ 9,191$ 11,240$ Amortization of intangibles 414 459 463 409 336 (Gain) loss on change in fair value of derivative instruments 31 (129) (117) (1) - Stock-based compensation 405 8 315 847 282 Litigation and other one-time settlements - - 2,533 707 3,696 Income tax expense 2,998 5,403 4,292 5,414 5,916 Impairment of assets 3,574 - - - 2,294 Pre-opening costs - - - 660 800 Acquisition costs 88 100 462 166 124 Loss from discontinued operations, net of income taxes 11,603 2,195 Gain on contractual debt reduction - - - - (5,642) Non-GAAP provision for income taxes (3,763) (5,556) (5,324) (5,791) (6,567) Non-GAAP net income 7,393$ 10,326$ 10,202$ 11,602$ 12,479$

Annual Non - GAAP Reconciliation Data 23 December 2015 Investor Presentation (in thousands, except per share data) 2010 2011 2012 2013 2014 Reconciliation of GAAP diluted net income per share to non-GAAP diluted net income per share Fully diluted shares 9,697 9,932 9,697 9,615 10,637 GAAP net income (0.82)$ 0.79$ 0.78$ 0.96$ 1.13$ Amortization of intangibles 0.04 0.05 0.05 0.04 0.03 (Gain) loss on change in fair value of derivative instruments 0.00 (0.01) (0.01) (0.00) - Stock-based compensation 0.04 0.00 0.03 0.09 0.03 Litigation and other one-time settlements - - 0.26 0.07 0.35 Impairment of assets 0.31 0.54 0.44 0.56 0.56 Income tax expense 0.37 - - - 0.22 Pre-opening costs - - - 0.07 0.08 Acquisition costs 0.01 0.01 0.05 0.02 0.01 Loss from discontinued operations, net of income taxes 1.20 0.22 - - - Gain on contractual debt reduction - - - - (0.53) Non-GAAP provision for income taxes (0.39) (0.56) (0.55) (0.60) (0.62) Non-GAAP diluted net income per share 0.76$ 1.04$ 1.05$ 1.21$ 1.25$ Reconciliation of GAAP operating income to non-GAAP operating income GAAP operating income 11,388$ 18,794$ 16,513$ 21,883$ 18,875$ Amortization of intangibles 414 459 463 409 336 Stock-based compensation 405 8 315 847 282 Litigation and other one-time settlements - - 2,533 707 3,696 Impairment of assets 3,574 - - - 2,294 Pre-opening costs - - - 660 800 Acquisition costs 88 100 462 166 124 Non-GAAP operating income 15,869$ 19,361$ 20,286$ 24,672$ 26,407$ Reconciliation of GAAP operating margin to non-GAAP operating margin GAAP operating income 15.4% 22.5% 17.3% 19.5% 14.6% Amortization of intangibles 0.6% 0.5% 0.5% 0.4% 0.3% Stock-based compensation 0.5% 0.0% 0.3% 0.8% 0.2% Litigation and other one-time settlements 0.0% 0.0% 2.7% 0.6% 2.9% Impairment of assets 4.8% 0.0% 0.0% 0.0% 1.8% Pre-opening costs 0.0% 0.0% 0.0% 0.6% 0.6% Acquisition costs 0.1% 0.1% 0.5% 0.1% 0.1% Non-GAAP operating margin 21.5% 23.2% 21.3% 22.0% 20.5%

Quarterly Non - GAAP Reconciliation Data 24 December 2015 Investor Presentation (in thousands, except per share data) 1Q14 2Q14 3Q14 4Q14 1Q15 2Q15 3Q15 Reconciliation of GAAP net income to Adjusted EBITDA GAAP net income (loss) 2,404$ 3,722$ 691$ 4,424$ 3,360$ (2,841)$ 8,267$ Income tax expense 1,322 1,922 203 2,468 1,846 (1,265) 4,442 Interest expense and income and gain on derivative and Drink Robust investment 2,012 1,924 2,060 1,868 1,029 1,783 1,630 Litigation and other one-time settlements 120 150 3,233 193 247 10,303 10 Pre-opening costs 89 122 306 57 158 268 Acquisition costs - - 22 13 83 95 105 Impairment of assets - - - 2,294 1,358 - - Depreciation and amortization 1,392 1,513 1,532 1,878 1,645 1,886 1,923 Gain on contractual debt reduction - - - (5,642) - - - Gain on settlement of Patron tax case - - - - - - (8,167) Adjusted EBITDA 7,339$ 9,353$ 8,047$ 7,553$ 9,726$ 10,229$ 8,210$ Reconcilation of GAAP net income (loss) to non-GAAP net income GAAP net income (loss) 2,404$ 3,722$ 691$ 4,423$ 3,360$ (2,841)$ 8,267$ Amortization of intangibles 89 82 82 82 244 336 312 Gain on derivative and Drink Robust investment - - - - (577) - - Stock-based compensation 3 151 2 126 120 120 120 Litigation and other one-time settlements 120 150 3,233 193 247 10,303 10 Pre-opening costs 89 122 306 57 158 268 - Income tax expense 1,322 1,922 203 2,468 1,846 (1,265) 4,442 Acquisition costs - 18 22 13 83 95 105 Impairment of assets - - - 2,294 1,358 - - Gain on contractual debt reduction - - - (5,642) - - - Gain on settlement of Patron tax case - - - - - - (8,167) Non-GAAP provision for income taxes (1,408) (2,106) (1,588) (1,361) (2,352) (2,414) (1,739) Non-GAAP net income 2,619$ 4,061$ 2,951$ 2,653$ 4,487$ 4,602$ 3,350$
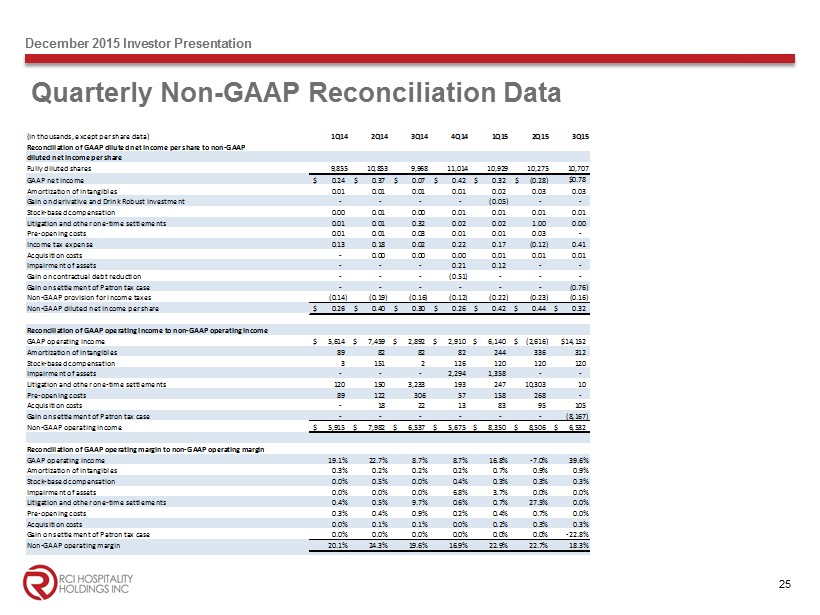
Quarterly Non - GAAP Reconciliation Data 25 December 2015 Investor Presentation (in thousands, except per share data) 1Q14 2Q14 3Q14 4Q14 1Q15 2Q15 3Q15 Reconciliation of GAAP diluted net income per share to non-GAAP diluted net income per share Fully diluted shares 9,855 10,853 9,968 11,014 10,929 10,275 10,707 GAAP net income 0.24$ 0.37$ 0.07$ 0.42$ 0.32$ (0.28)$ $0.78 Amortization of intangibles 0.01 0.01 0.01 0.01 0.02 0.03 0.03 Gain on derivative and Drink Robust investment - - - - (0.05) - - Stock-based compensation 0.00 0.01 0.00 0.01 0.01 0.01 0.01 Litigation and other one-time settlements 0.01 0.01 0.32 0.02 0.02 1.00 0.00 Pre-opening costs 0.01 0.01 0.03 0.01 0.01 0.03 - Income tax expense 0.13 0.18 0.02 0.22 0.17 (0.12) 0.41 Acquisition costs - 0.00 0.00 0.00 0.01 0.01 0.01 Impairment of assets - - - 0.21 0.12 - - Gain on contractual debt reduction - - - (0.51) - - - Gain on settlement of Patron tax case - - - - - - (0.76) Non-GAAP provision for income taxes (0.14) (0.19) (0.16) (0.12) (0.22) (0.23) (0.16) Non-GAAP diluted net income per share 0.26$ 0.40$ 0.30$ 0.26$ 0.42$ 0.44$ 0.32$ Reconciliation of GAAP operating income to non-GAAP operating income GAAP operating income 5,614$ 7,459$ 2,892$ 2,910$ 6,140$ (2,616)$ $14,152 Amortization of intangibles 89 82 82 82 244 336 312 Stock-based compensation 3 151 2 126 120 120 120 Impairment of assets - - - 2,294 1,358 - - Litigation and other one-time settlements 120 150 3,233 193 247 10,303 10 Pre-opening costs 89 122 306 57 158 268 - Acquisition costs - 18 22 13 83 95 105 Gain on settlement of Patron tax case - - - - - - (8,167) Non-GAAP operating income 5,915$ 7,982$ 6,537$ 5,675$ 8,350$ 8,506$ 6,532$ Reconciliation of GAAP operating margin to non-GAAP operating margin GAAP operating income 19.1% 22.7% 8.7% 8.7% 16.8% -7.0% 39.6% Amortization of intangibles 0.3% 0.2% 0.2% 0.2% 0.7% 0.9% 0.9% Stock-based compensation 0.0% 0.5% 0.0% 0.4% 0.3% 0.3% 0.3% Impairment of assets 0.0% 0.0% 0.0% 6.8% 3.7% 0.0% 0.0% Litigation and other one-time settlements 0.4% 0.5% 9.7% 0.6% 0.7% 27.5% 0.0% Pre-opening costs 0.3% 0.4% 0.9% 0.2% 0.4% 0.7% 0.0% Acquisition costs 0.0% 0.1% 0.1% 0.0% 0.2% 0.3% 0.3% Gain on settlement of Patron tax case 0.0% 0.0% 0.0% 0.0% 0.0% 0.0% -22.8% Non-GAAP operating margin 20.1% 24.3% 19.6% 16.9% 22.9% 22.7% 18.3%

Non - GAAP Reconciliation Data for Nightclubs Segment 26 December 2015 Investor Presentation (in thousands) Reconciliation of Nightclubs GAAP operating income to non-GAAP operating income Nightclubs operating income $ 26,000 $ 25,947 Gain on settlement of Patron tax case (8,167) - Litigation and other one-time settlements 10,560 3,503 Impairment of assets 1,358 - Nightclubs non-GAAP operating income $ 29,751 $ 29,450 Nightclubs non-GAAP operating margin 31.8% 32.3% 2015 2014 For the Nine Months Ended June 30,

Strong Management Team 27 December 2015 Investor Presentation Executive Background Eric Langan Chairman, CEO, President • President and CEO since 1999 • Involved in nightclub/restaurant business since 1989 • Acquired his first club at age 21 with proceeds from the sale of his baseball cards • Merged his XTC Cabaret chain with RCI in 1998 Ed Anakar Director of Operations • Joined RCI 2003, Director of Operations since 2009 • Grew up in the hospitality industry – started at a young age as a waiter • Worked his way up to district manager for a large management company that operated hotels, restaurants and nightclubs across the US • Launched and operated numerous RCI venues, including Tootsie’s Cabaret in Miami, Rick’s Cabaret New York, Vivid Cabaret New York, and Bombshells Phillip Marshall Chief Financial Officer • Joined RCI 2007 as CFO • Began his public accounting career with KMG and became a partner in 1980 • Continued as a partner after merger with Peat Marwick • Partner in charge of the audit practice at Jackson & Rhodes 1992 - 2003 • Chief Financial Officer of CDT Systems, Inc. (publicly traded) 2003 - 2006 Travis Reese EVP & Director of Technology • Joined RCI 1999 as VP - Director of Technology • VP with Digital Publishing Resources, Inc. 1995 - 1997 • Senior network administrator at St. Vincent's Hospital 1997 - 1999

Corporate Office 10959 Cutten Road Houston, TX 77066 Phone: (281) 397 - 6730 Investor Relations Gary Fishman Steven Anreder Phone: (212) 532 - 3232 IR Website www.rcihospitality.com NasdaqGM: RICK Contact Information 28 December 2015 Investor Presentation