Attached files
| file | filename |
|---|---|
| 8-K - FORM 8-K - Arlington Asset Investment Corp. | v425918_8k.htm |
Exhibit 99.1

Investor Presentation November 30, 2015
1 Information Related to Forward - Looking Statements This presentation contains “forward - looking statements” within the meaning of the Private Securities Litigation Reform Act of 19 95. These include statements regarding future results or expectations about our investments, interest rates, portfolio allocation, divi den ds, financing agreements, returns on invested capital, investment strategy, taxes, portfolio, earnings, book value, housing market, compens ati on, growth in capital, agency MBS spreads, prepayments, hedging instruments, duration, credit performance of private - label MBS, cash flow and benefit of deferred tax asset value. Forward - looking statements can be identified by forward - looking language, including words such as “be lieves,” “anticipates,” “views,” “expects,” “estimates,” “intends,” “may,” “plans,” “projects,” “potential,” “prospective,” “will” and si milar expressions, or the negative of these words. Such forward - looking statements are based on facts and conditions as they exist at the time such statements are made. Forward - looking statements are also based on predictions as to future facts and conditions, the accurate p rediction of which may be difficult and involve the assessment of events beyond our control. Forward - looking statements are further based on various operating and return assumptions. Caution must be exercised in relying on forward - looking statements. Due to known and unknown risks, actual results may differ materially from expectations or projections. You should carefully consider these risks when you make a decision concerning an investment in our common stock or senior not es , along with the following factors, among others, that may cause our actual results to differ materially from those described in any for ward - looking statements: availability of, and our ability to deploy, capital; growing our business primarily through a strategy focused on ac quiring primarily private - label mortgage - backed securities (“MBS”) and agency MBS; yields on MBS; our ability to successfully implement our hedgin g strategy; our ability to realize reflation on our private - label MBS; the credit performance of our private - label MBS; current co nditions and adverse developments in the residential mortgage market and the overall economy; potential risk attributable to our mortgage - rel ated portfolios; impacts of regulatory changes, including actions taken by the SEC, the U.S. Federal Reserve, the Federal Housing Fin ance Agency and the U.S. Treasury and changes affecting Fannie Mae and Freddie Mac; overall interest rate environment and changes in inte res t rates, interest rate spreads, the yield curve and prepayment rates; changes in anticipated earnings and returns; the amount and grow th in our cash earnings and distributable income; growth in our book value per share; our ability to maintain adequate liquidity; our use of le verage and dependence on repurchase agreements and other short - term borrowings to finance our mortgage - related holdings; the loss of our ex clusion from the definition of “investment company” under the Investment Company Act of 1940; our ability to forecast our tax attribu tes and protect and use our net operating loss carry - forwards and net capital loss carry - forwards to offset future taxable income and gains; cha nges in our business, acquisition, leverage, asset allocation, operational, hedging and financing strategies and policies; our ability an d w illingness to make future dividends; changes in, and our ability to remain in compliance with, law, regulations or governmental policies affecti ng our business; and the factors described in the sections entitled “Risk Factors” in our Annual Report on Form 10 - K for the year ended December 31, 2014, subsequent Quarterly Reports on Form 10 - Q and other documents filed by the Company with the SEC from time to time. You should n ot place undue reliance on these forward - looking statements, which apply only as of the date of this presentation. We undertake no obligation to update or revise any forward - looking statement, whether written or oral, relating to matters discussed in this presentation, exc ept as may be required by applicable securities laws.
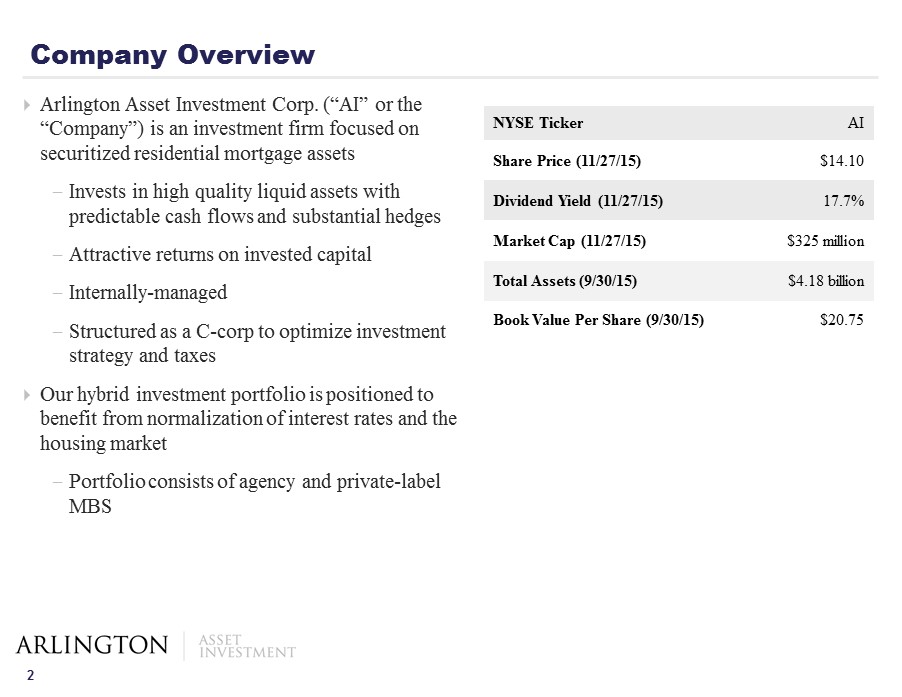
2 Company Overview Arlington Asset Investment Corp. (“AI” or the “Company”) is an investment firm focused on securitized residential mortgage assets - Invests in high quality liquid assets with predictable cash flows and substantial hedges - Attractive returns on invested capital - Internally - managed - Structured as a C - corp to optimize investment strategy and taxes Our hybrid investment portfolio is positioned to benefit from normalization of interest rates and the housing market - Portfolio consists of agency and private - label MBS NYSE Ticker AI Share Price (11/27/15) $14.10 Dividend Yield (11/27/15) 17.7% Market Cap (11 /27/15) $325 million Total Assets (9/30/15) $4.18 billion Book Value P er Share (9/30/15) $20.75
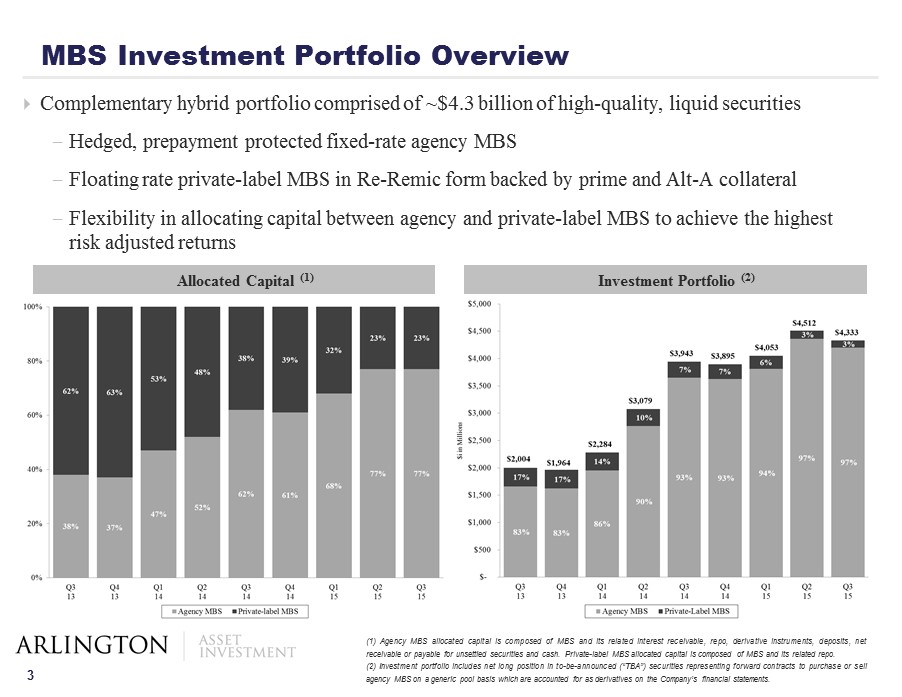
3 Complementary hybrid portfolio comprised of ~$4.3 billion of high - quality, liquid securities - Hedged, prepayment protected fixed - rate agency MBS - Floating rate private - label MBS in Re - Remic form backed by prime and Alt - A collateral - Flexibility in allocating capital between agency and private - label MBS to achieve the highest risk adjusted returns MBS Investment Portfolio Overview ( 1 ) Agency MBS allocated capital is composed of MBS and its related interest receivable, repo, derivative instruments, deposits, net receivable or payable for unsettled securities and cash . Private - label MBS allocated capital is composed of MBS and its related repo . ( 2 ) Investment portfolio includes net long position in to - be - announced (“TBA”) securities representing forward contracts to purchase or sell agency MBS on a generic pool basis which are accounted for as derivatives on the Company’s financial statements . Investment Portfolio (2) Allocated Capital (1)
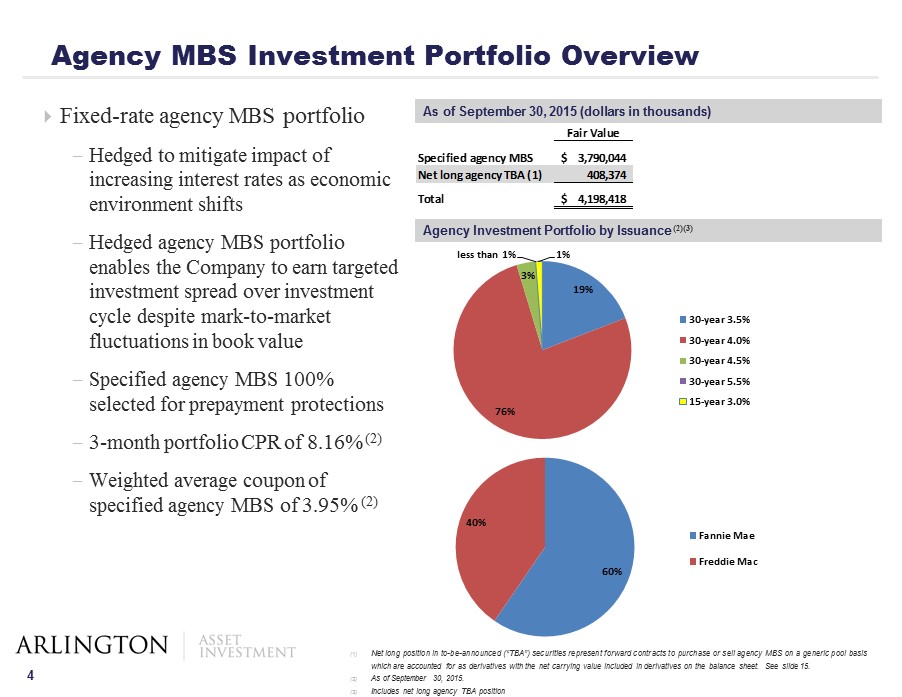
4 Fixed - rate agency MBS portfolio - Hedged to mitigate impact of increasing interest rates as economic environment shifts - Hedged agency MBS portfolio enables the Company to earn targeted investment spread over investment cycle despite mark - to - market fluctuations in book value - Specified agency MBS 100% selected for prepayment protections - 3 - month portfolio CPR of 8.16% (2) - Weighted average coupon of specified agency MBS of 3.95% (2) Agency MBS Investment Portfolio Overview As of September 30, 2015 (dollars in thousands) (1) Net long position in to - be - announced (“TBA”) securities represent forward contracts to purchase or sell agency MBS on a generic pool basis which are accounted for as derivatives with the net carrying value included in derivatives on the balance sheet . See slide 15 . (2) As of September 30 , 2015 . (3) Includes net long agency TBA position Fair Value Specified agency MBS 3,790,044$ Net long agency TBA (1) 408,374 Total 4,198,418$ Agency Investment Portfolio by Issuance (2)(3) 19% 76% 3% less than 1% 1% 30-year 3.5% 30-year 4.0% 30-year 4.5% 30-year 5.5% 15-year 3.0% 60% 40% Fannie Mae Freddie Mac
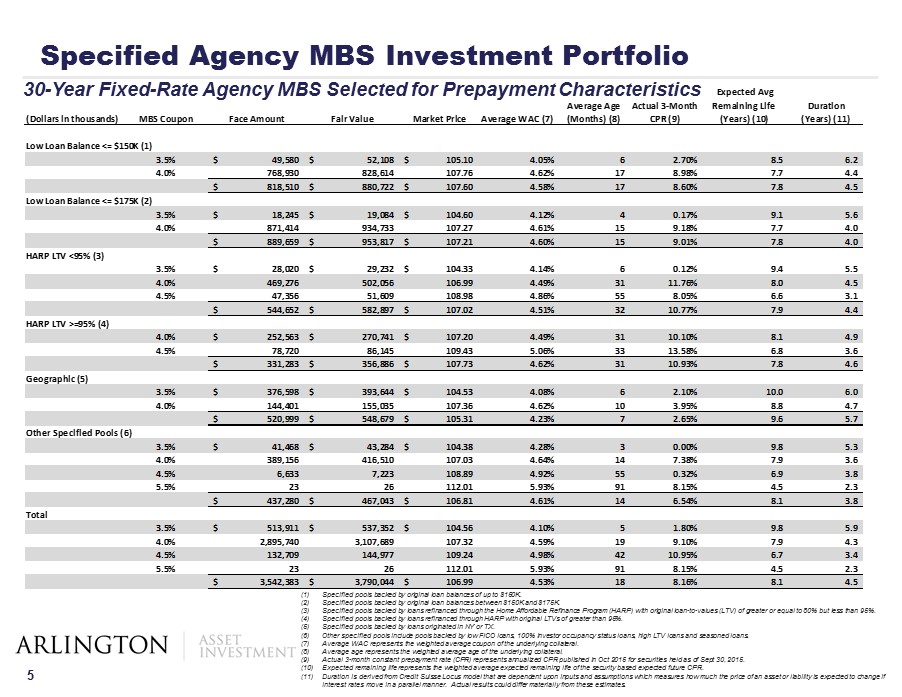
5 Specified Agency MBS Investment Portfolio (1) Specified pools backed by original loan balances of up to $150K. (2) Specified pools backed by original loan balances between $150K and $175K. (3) Specified pools backed by loans refinanced through the Home Affordable Refinance Program (HARP) with original loan - to - values (LT V) of greater or equal to 80% but less than 95%. (4) Specified pools backed by loans refinanced through HARP with original LTVs of greater than 95%. (5) Specified pools backed by loans originated in NY or TX. (6) Other specified pools include pools backed by low FICO loans, 100% investor occupancy status loans, high LTV loans and season ed loans. (7) Average WAC represents the weighted average coupon of the underlying collateral. (8) Average age represents the weighted average age of the underlying collateral. (9) Actual 3 - month constant prepayment rate (CPR) represents annualized CPR published in Oct 2015 for securities held as of Sept 30, 2015. (10) Expected remaining life represents the weighted average expected remaining life of the security based expected future CPR. (11) Duration is derived from Credit Suisse Locus model that are dependent upon inputs and assumptions which measures how much the pr ice of an asset or liability is expected to change if interest rates move in a parallel manner. Actual results could differ materially from these estimates. 30 - Year Fixed - Rate Agency MBS Selected for Prepayment Characteristics (Dollars in thousands) MBS Coupon Face Amount Fair Value Market Price Average WAC (7) Average Age (Months) (8) Actual 3-Month CPR (9) Expected Avg Remaining Life (Years) (10) Duration (Years) (11) Low Loan Balance <= $150K (1) 3.5% 49,580$ 52,108$ 105.10$ 4.05% 6 2.70% 8.5 6.2 4.0% 768,930 828,614 107.76 4.62% 17 8.98% 7.7 4.4 818,510$ 880,722$ 107.60$ 4.58% 17 8.60% 7.8 4.5 Low Loan Balance <= $175K (2) 3.5% 18,245$ 19,084$ 104.60$ 4.12% 4 0.17% 9.1 5.6 4.0% 871,414 934,733 107.27 4.61% 15 9.18% 7.7 4.0 889,659$ 953,817$ 107.21$ 4.60% 15 9.01% 7.8 4.0 HARP LTV <95% (3) 3.5% 28,020$ 29,232$ 104.33$ 4.14% 6 0.12% 9.4 5.5 4.0% 469,276 502,056 106.99 4.49% 31 11.76% 8.0 4.5 4.5% 47,356 51,609 108.98 4.86% 55 8.05% 6.6 3.1 544,652$ 582,897$ 107.02$ 4.51% 32 10.77% 7.9 4.4 HARP LTV >=95% (4) 4.0% 252,563$ 270,741$ 107.20$ 4.49% 31 10.10% 8.1 4.9 4.5% 78,720 86,145 109.43 5.06% 33 13.58% 6.8 3.6 331,283$ 356,886$ 107.73$ 4.62% 31 10.93% 7.8 4.6 Geographic (5) 3.5% 376,598$ 393,644$ 104.53$ 4.08% 6 2.10% 10.0 6.0 4.0% 144,401 155,035 107.36 4.62% 10 3.95% 8.8 4.7 520,999$ 548,679$ 105.31$ 4.23% 7 2.65% 9.6 5.7 Other Specified Pools (6) 3.5% 41,468$ 43,284$ 104.38$ 4.28% 3 0.00% 9.8 5.3 4.0% 389,156 416,510 107.03 4.64% 14 7.38% 7.9 3.6 4.5% 6,633 7,223 108.89 4.92% 55 0.32% 6.9 3.8 5.5% 23 26 112.01 5.93% 91 8.15% 4.5 2.3 437,280$ 467,043$ 106.81$ 4.61% 14 6.54% 8.1 3.8 Total 3.5% 513,911$ 537,352$ 104.56$ 4.10% 5 1.80% 9.8 5.9 4.0% 2,895,740 3,107,689 107.32 4.59% 19 9.10% 7.9 4.3 4.5% 132,709 144,977 109.24 4.98% 42 10.95% 6.7 3.4 5.5% 23 26 112.01 5.93% 91 8.15% 4.5 2.3 3,542,383$ 3,790,044$ 106.99$ 4.53% 18 8.16% 8.1 4.5
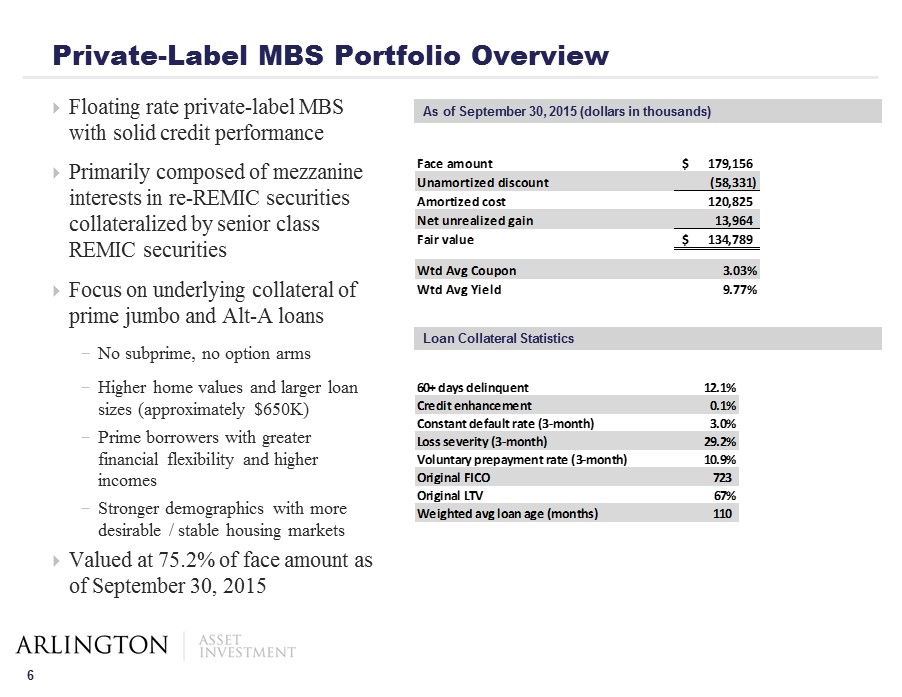
6 Floating rate private - label MBS with solid credit performance Primarily composed of mezzanine interests in re - REMIC securities collateralized by senior class REMIC securities Focus on underlying collateral of prime jumbo and A lt - A loans - No subprime, no option arms - Higher home values and larger loan sizes (approximately $ 650K ) - Prime borrowers with greater financial flexibility and higher incomes - Stronger demographics with more desirable / stable housing markets Valued at 75.2% of face amount as of September 30, 2015 Private - Label MBS Portfolio Overview As of September 30, 2015 (dollars in thousands) Face amount 179,156$ Unamortized discount (58,331) Amortized cost 120,825 Net unrealized gain 13,964 Fair value 134,789$ Wtd Avg Coupon 3.03% Wtd Avg Yield 9.77% Loan Collateral Statistics 60+ days delinquent 12.1% Credit enhancement 0.1% Constant default rate (3-month) 3.0% Loss severity (3-month) 29.2% Voluntary prepayment rate (3-month) 10.9% Original FICO 723 Original LTV 67% Weighted avg loan age (months) 110
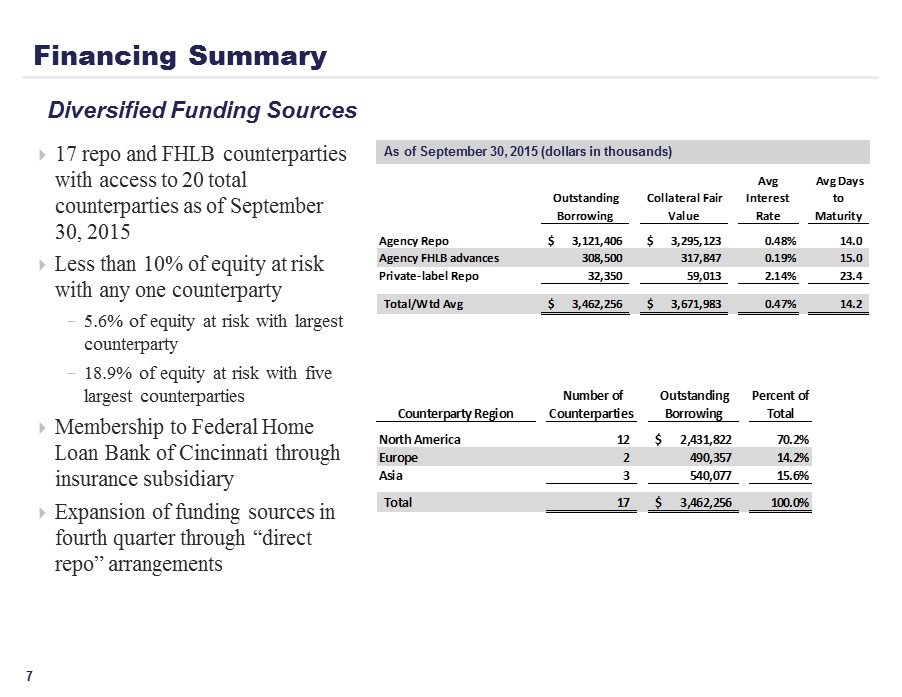
7 Financing Summary 17 repo and FHLB counterparties with access to 20 total counterparties as of September 30, 2015 Less than 10% of equity at risk with any one counterparty - 5.6% of equity at risk with largest counterparty - 18.9% of equity at risk with five largest counterparties Membership to Federal Home Loan Bank of Cincinnati through insurance subsidiary Expansion of funding sources in fourth quarter through “direct repo” arrangements Diversified Funding Sources As of September 30, 2015 (dollars in thousands) Outstanding Borrowing Collateral Fair Value Avg Interest Rate Avg Days to Maturity Agency Repo 3,121,406$ 3,295,123$ 0.48% 14.0 Agency FHLB advances 308,500 317,847 0.19% 15.0 Private-label Repo 32,350 59,013 2.14% 23.4 Total/Wtd Avg 3,462,256$ 3,671,983$ 0.47% 14.2 Counterparty Region Number of Counterparties Outstanding Borrowing Percent of Total North America 12 2,431,822$ 70.2% Europe 2 490,357 14.2% Asia 3 540,077 15.6% Total 17 3,462,256$ 100.0%
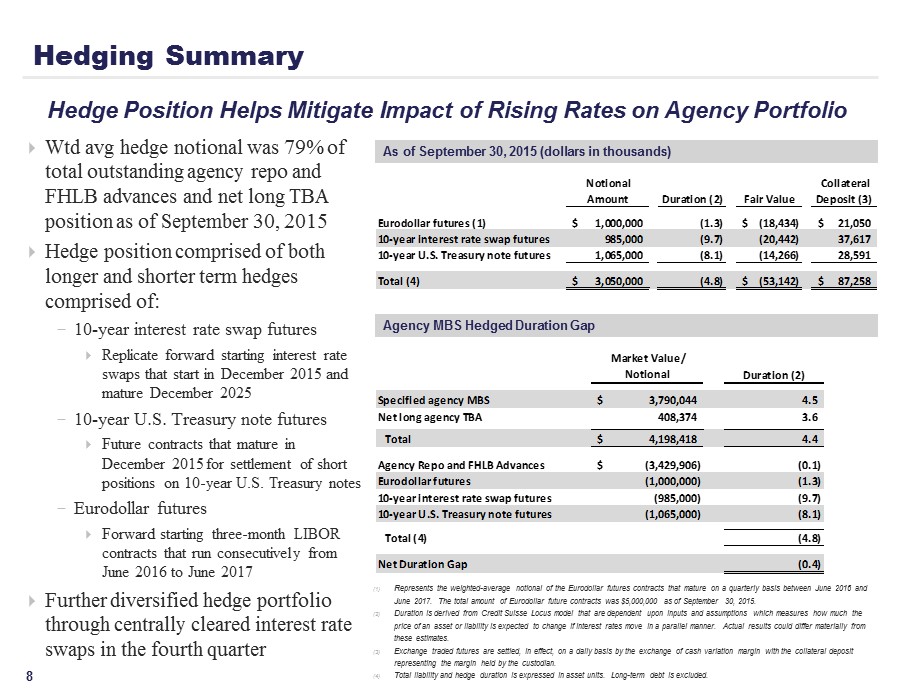
8 Hedgin g Summary Wtd a vg hedge notional was 79% of total outstanding agency repo and FHLB advances and net long TBA position as of September 30, 2015 Hedge position comprised of both longer and shorter term hedges comprised of: - 10 - year interest rate swap futures Replicate forward starting interest rate swaps that start in December 2015 and mature December 2025 - 10 - year U.S. Treasury note futures Future contracts that mature in December 2015 for settlement of short positions on 10 - year U.S. Treasury notes - Eurodollar futures Forward starting three - month LIBOR contracts that run consecutively from June 2016 to June 2017 Further diversified hedge portfolio through centrally cleared interest rate swaps in the fourth quarter Hedge Position Helps Mitigate Impact of Rising Rates on Agency Portfolio As of September 30, 2015 (dollars in thousands) (1) Represents the weighted - average notional of the Eurodollar futures contracts that mature on a quarterly basis between June 2016 and June 2017. The total amount of Eurodollar future contracts was $5,000,000 as of September 30, 2015. (2) Duration is derived from Credit Suisse Locus model that are dependent upon inputs and assumptions which measures how much the price of an asset or liability is expected to change if interest rates move in a parallel manner. Actual results could diffe r m aterially from these estimates. (3) Exchange traded futures are settled, in effect, on a daily basis by the exchange of cash variation margin with the collateral deposit representing the margin held by the custodian. (4) Total liability and hedge duration is expressed in asset units. Long - term debt is excluded. Agency MBS Hedged Duration Gap Notional Amount Duration (2) Fair Value Collateral Deposit (3) Eurodollar futures (1) 1,000,000$ (1.3) (18,434)$ 21,050$ 10-year interest rate swap futures 985,000 (9.7) (20,442) 37,617 10-year U.S. Treasury note futures 1,065,000 (8.1) (14,266) 28,591 Total (4) 3,050,000$ (4.8) (53,142)$ 87,258$ Market Value/ Notional Duration (2) Specified agency MBS 3,790,044$ 4.5 Net long agency TBA 408,374 3.6 Total 4,198,418$ 4.4 Agency Repo and FHLB Advances (3,429,906)$ (0.1) Eurodollar futures (1,000,000) (1.3) 10-year interest rate swap futures (985,000) (9.7) 10-year U.S. Treasury note futures (1,065,000) (8.1) Total (4) (4.8) Net Duration Gap (0.4)
9 Our C - corp structure provides flexibility as we are not required to distribute taxable earnings to stockholders - Provides option to reinvest earnings and opportunistically benefit from market dislocation - Allows investment flexibility as we are not bound by any substantial restrictions - Protects public debt holders as cash earnings are available to service debt without any negative tax implications Benefits stockholders by providing tax - advantaged dividend as we continue to utilize our net operating loss and net capital loss carry - forwards - 17.7% annualized dividend yield (1) 23.9% annualized dividend yield, on a tax adjusted basis (2) - $103 million of net deferred tax asset value or $4.48 per share if all are realized ( 1 ) Based on the Company’s Class A common stock closing price on the NYSE of $ 14 . 10 on 11 / 27 / 2015 . The annual dividend rate presented is calculated by annualizing the 3 rd quarter of 2015 dividend payment of $ 0 . 625 per share of Class A common stock . The Company maintains a variable dividend policy and the Board of Directors, in its sole discretion, approves the payment of dividends . Actual dividends in the future may differ materially from historical practice and from the annualized dividend rate presented . (2) The Company's distributions to shareholders of current or accumulated earnings and profits (“E&P”) are qualified dividends eligible for the 23 % federal income tax rate whereas similar distributions to shareholders by a REIT of current or accumulated E&P are nonqualified divide nds subject to the higher 43.4% tax rate on ordinary income. Any distributions in excess of current or accumulated E&P would be reported as a return of capi tal instead of qualified dividends. Distributions that are classified as returns of capital are nontaxable to the extent they do not exceed a shareholder’s adjus ted tax basis in the Company’s common stock, or as a capital gain to the extent that the amount of the distribution exceeds a shareholder’s adjusted tax bas is in the Company’s common stock. To provide the same after - tax return to a shareholder of distributions of current or accumulated E&P eligible for the 23.8% rate on qualified dividend income and otherwise subject to the maximum marginal rate on ordinary income, a REIT would be required to pay dividends providin g a 23.9% yield. Corporate Structure Provides Flexibility and Capital Growth
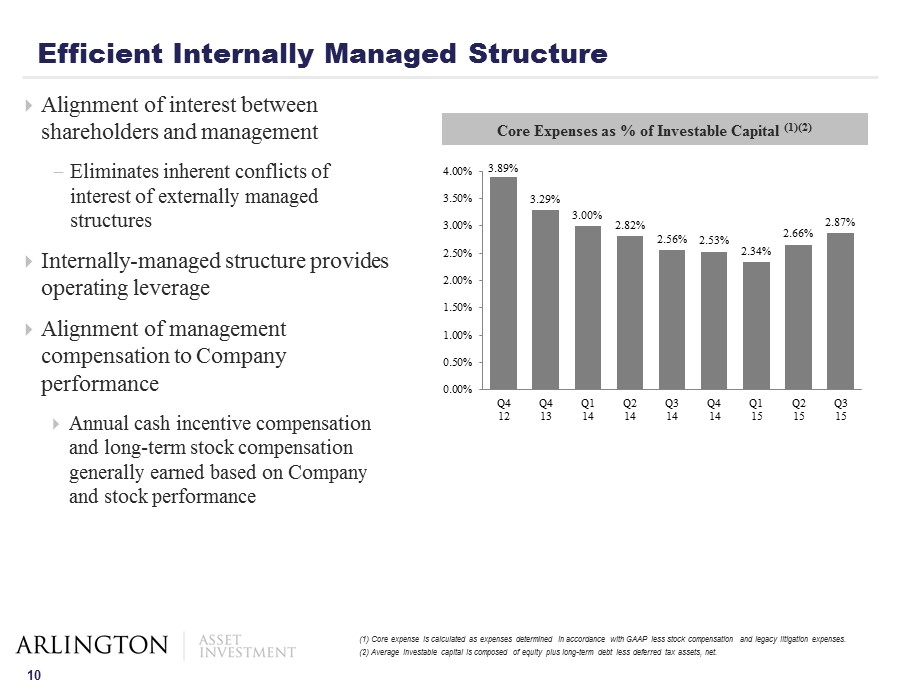
10 Alignment of interest between shareholders and management - Eliminates inherent conflicts of interest of externally managed structures Internally - managed structure provides operating leverage Alignment of management compensation to Company performance Annual cash incentive compensation and long - term stock compensation generally earned based on Company and stock performance Core Expenses as % of Investable Capital (1)(2) Efficient Internally Managed Structure (1) Core expense is calculated as expenses determined in accordance with GAAP less stock compensation and legacy litigation e xpe nses. (2) Average investable capital is composed of equity plus long - term debt less deferred tax assets, net . 3.89% 3.29% 3.00% 2.82% 2.56% 2.53% 2.34% 2.66% 2.87% 0.00% 0.50% 1.00% 1.50% 2.00% 2.50% 3.00% 3.50% 4.00% Q4 12 Q4 13 Q1 14 Q2 14 Q3 14 Q4 14 Q1 15 Q2 15 Q3 15
11 Appendix
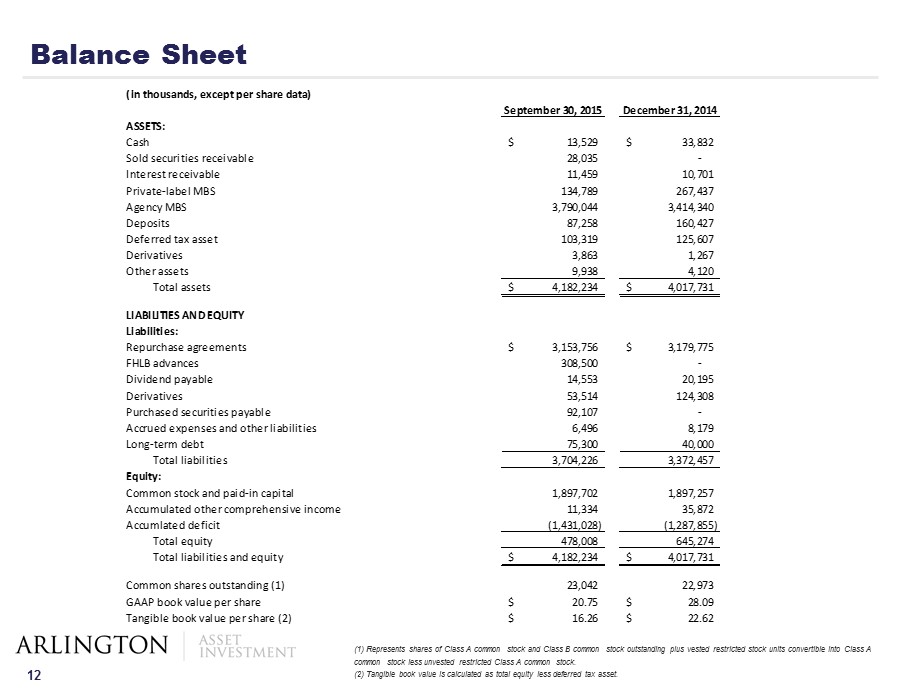
12 Balance Sheet (1) Represents shares of Class A common stock and Class B common stock outstanding plus vested restricted stock units convertible into Class A common stock less unvested restricted Class A common stock. (2) Tangible book value is calculated as total equity less deferred tax asset. (in thousands, except per share data) September 30, 2015 December 31, 2014 ASSETS: Cash 13,529$ 33,832$ Sold securities receivable 28,035 - Interest receivable 11,459 10,701 Private-label MBS 134,789 267,437 Agency MBS 3,790,044 3,414,340 Deposits 87,258 160,427 Deferred tax asset 103,319 125,607 Derivatives 3,863 1,267 Other assets 9,938 4,120 Total assets 4,182,234$ 4,017,731$ LIABILITIES AND EQUITY Liabilities: Repurchase agreements 3,153,756$ 3,179,775$ FHLB advances 308,500 - Dividend payable 14,553 20,195 Derivatives 53,514 124,308 Purchased securities payable 92,107 - Accrued expenses and other liabilities 6,496 8,179 Long-term debt 75,300 40,000 Total liabilities 3,704,226 3,372,457 Equity: Common stock and paid-in capital 1,897,702 1,897,257 Accumulated other comprehensive income 11,334 35,872 Accumlated deficit (1,431,028) (1,287,855) Total equity 478,008 645,274 Total liabilities and equity 4,182,234$ 4,017,731$ Common shares outstanding (1) 23,042 22,973 GAAP book value per share 20.75$ 28.09$ Tangible book value per share (2) 16.26$ 22.62$
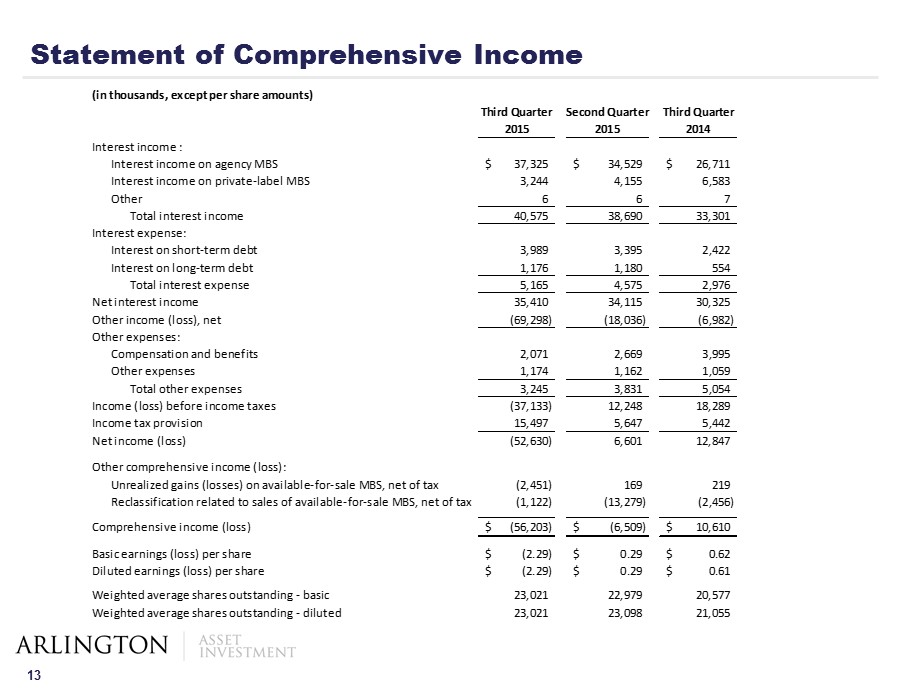
13 Statement of Comprehensive Income (in thousands, except per share amounts) Third Quarter Second Quarter Third Quarter 2015 2015 2014 Interest income : Interest income on agency MBS 37,325$ 34,529$ 26,711$ Interest income on private-label MBS 3,244 4,155 6,583 Other 6 6 7 Total interest income 40,575 38,690 33,301 Interest expense: Interest on short-term debt 3,989 3,395 2,422 Interest on long-term debt 1,176 1,180 554 Total interest expense 5,165 4,575 2,976 Net interest income 35,410 34,115 30,325 Other income (loss), net (69,298) (18,036) (6,982) Other expenses: Compensation and benefits 2,071 2,669 3,995 Other expenses 1,174 1,162 1,059 Total other expenses 3,245 3,831 5,054 Income (loss) before income taxes (37,133) 12,248 18,289 Income tax provision 15,497 5,647 5,442 Net income (loss) (52,630) 6,601 12,847 Other comprehensive income (loss): Unrealized gains (losses) on available-for-sale MBS, net of tax (2,451) 169 219 Reclassification related to sales of available-for-sale MBS, net of tax (1,122) (13,279) (2,456) Comprehensive income (loss) (56,203)$ (6,509)$ 10,610$ Basic earnings (loss) per share (2.29)$ 0.29$ 0.62$ Diluted earnings (loss) per share (2.29)$ 0.29$ 0.61$ Weighted average shares outstanding - basic 23,021 22,979 20,577 Weighted average shares outstanding - diluted 23,021 23,098 21,055
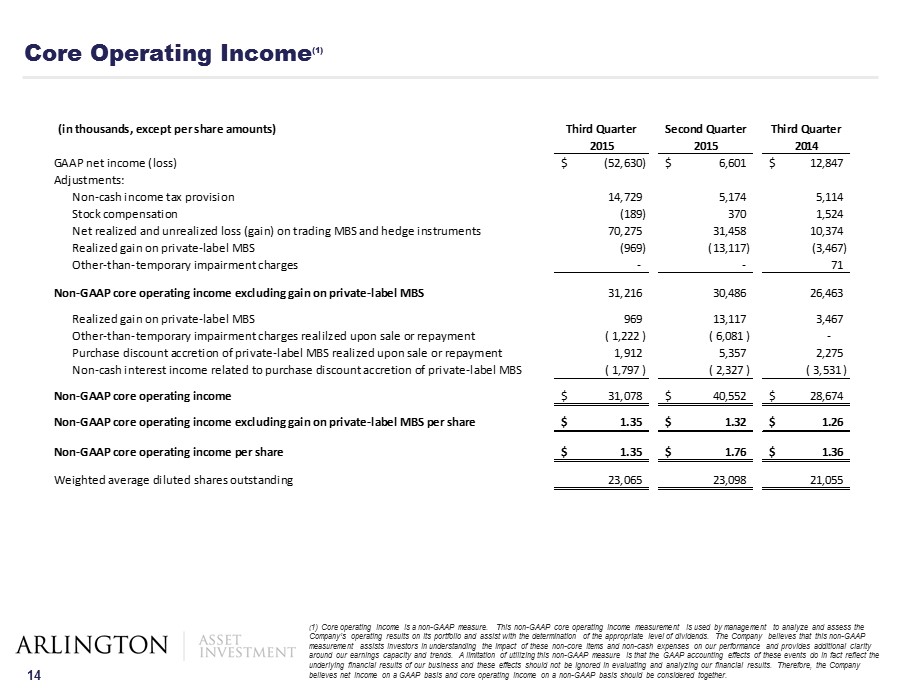
14 Core Operating Income (1 ) ( 1) Core operating income is a non - GAAP measure. This non - GAAP core operating income measurement is used by management to analyz e and assess the Company’s operating results on its portfolio and assist with the determination of the appropriate level of dividends. The Co mpa ny believes that this non - GAAP measurement assists investors in understanding the impact of these non - core items and non - cash expenses on our performance and p rovides additional clarity around our earnings capacity and trends. A limitation of utilizing this non - GAAP measure is that the GAAP accounting effects of these events do in fact reflect the underlying financial results of our business and these effects should not be ignored in evaluating and analyzing our financia l r esults. Therefore, the Company believes net income on a GAAP basis and core operating income on a non - GAAP basis should be considered together. (in thousands, except per share amounts) Third Quarter Second Quarter Third Quarter 2015 2015 2014 GAAP net income (loss) (52,630)$ 6,601$ 12,847$ Adjustments: Non-cash income tax provision 14,729 5,174 5,114 Stock compensation (189) 370 1,524 Net realized and unrealized loss (gain) on trading MBS and hedge instruments 70,275 31,458 10,374 Realized gain on private-label MBS (969) (13,117) (3,467) Other-than-temporary impairment charges - - 71 Non-GAAP core operating income excluding gain on private-label MBS 31,216 30,486 26,463 Realized gain on private-label MBS 969 13,117 3,467 Other-than-temporary impairment charges realilzed upon sale or repayment ( 1,222 ) ( 6,081 ) - Purchase discount accretion of private-label MBS realized upon sale or repayment 1,912 5,357 2,275 Non-cash interest income related to purchase discount accretion of private-label MBS ( 1,797 ) ( 2,327 ) ( 3,531 ) Non-GAAP core operating income 31,078$ 40,552$ 28,674$ Non-GAAP core operating income excluding gain on private-label MBS per share 1.35$ 1.32$ 1.26$ Non-GAAP core operating income per share 1.35$ 1.76$ 1.36$ Weighted average diluted shares outstanding 23,065 23,098 21,055
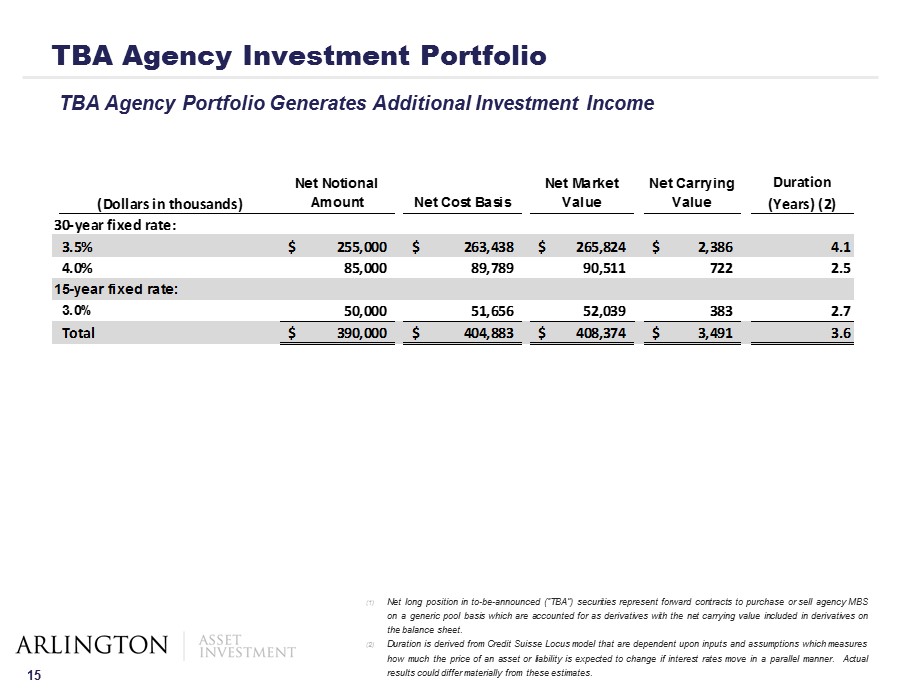
15 TBA Agency Investment Portfolio (1) Net long position in to - be - announced (“TBA”) securities represent forward contracts to purchase or sell agency MBS on a generic pool basis which are accounted for as derivatives with the net carrying value included in derivatives on the balance sheet . (2) Duration is derived from Credit Suisse Locus model that are dependent upon inputs and assumptions which measures how much the price of an asset or liability is expected to change if interest rates move in a parallel manner . Actual results could differ materially from these estimates . (Dollars in thousands) Net Notional Amount Net Cost Basis Net Market Value Net Carrying Value Duration (Years) (2) 30-year fixed rate: 3.5% 255,000$ 263,438$ 265,824$ 2,386$ 4.1 4.0% 85,000 89,789 90,511 722 2.5 15-year fixed rate: 3.0% 50,000 51,656 52,039 383 2.7 Total 390,000$ 404,883$ 408,374$ 3,491$ 3.6 TBA Agency Portfolio Generates Additional Investment Income
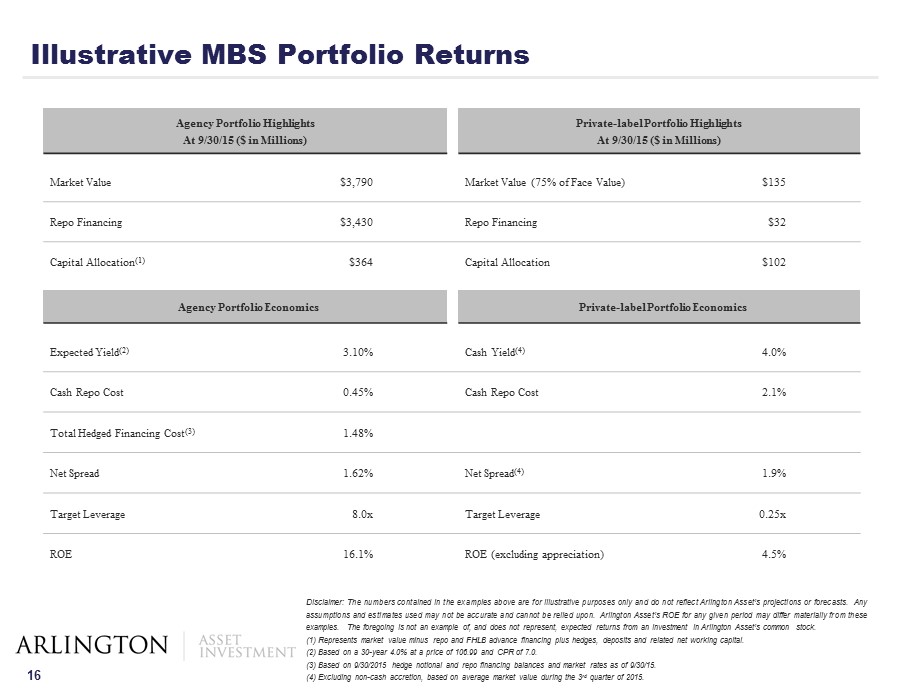
16 Disclaimer : The numbers contained in the examples above are for illustrative purposes only and do not reflect Arlington Asset’s projections or forecasts . Any assumptions and estimates used may not be accurate and cannot be relied upon . Arlington Asset’s ROE for any given period may differ materially from these examples . The foregoing is not an example of, and does not represent, expected returns from an investment in Arlington Asset’s common stock . ( 1 ) Represents market value minus repo and FHLB advance financing plus hedges, deposits and related net working capital . ( 2 ) Based on a 30 - year 4 . 0 % at a price of 106 . 99 and CPR of 7 . 0 . ( 3 ) Based on 9 / 30 / 2015 hedge notional and repo financing balances and market rates as of 9 / 30 / 15 . ( 4 ) Excluding non - cash accretion, based on average market value during the 3 rd quarter of 2015 . Agency Portfolio Highlights At 9/30/15 ($ in Millions) Private - label Portfolio Highlights At 9/30/15 ($ in Millions) Market Value $3,790 Market Value (75% of Face Value) $135 Repo Financing $3,430 Repo Financing $32 Capital Allocation (1) $364 Capital Allocation $102 Agency Portfolio Economics Private - label Portfolio Economics Expected Yield (2) 3.10% Cash Yield (4) 4.0% Cash Repo Cost 0.45% Cash Repo Cost 2.1% Total Hedged Financing Cost (3) 1.48% Net Spread 1.62% Net Spread (4) 1.9% Target Leverage 8.0x Target Leverage 0.25x ROE 16.1% ROE (excluding appreciation) 4.5% Illustrative MBS Portfolio Returns
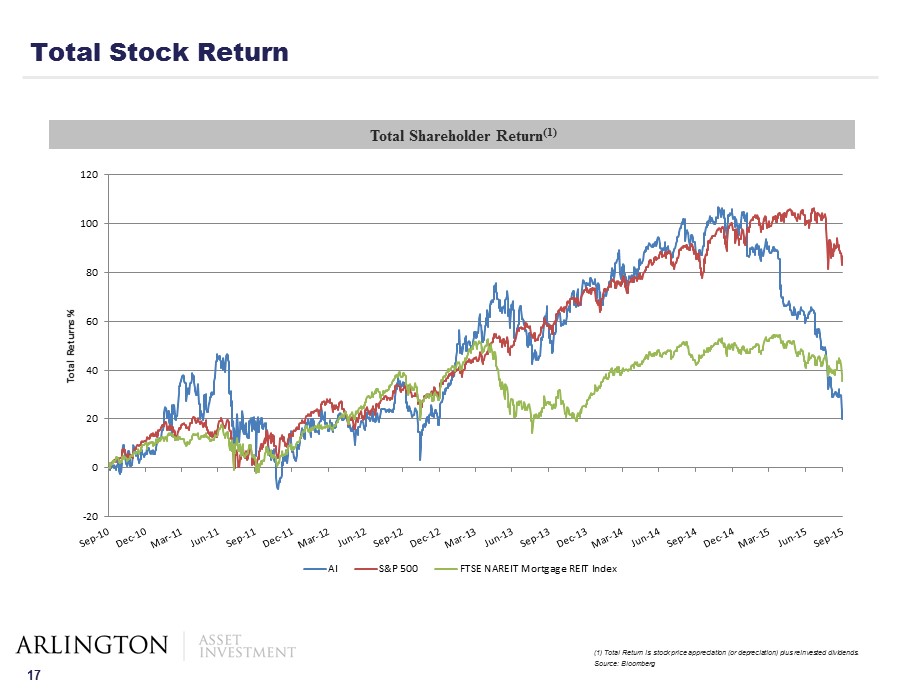
17 Total Stock Return Total Shareholder Return (1 ) ( 1 ) Total Return is stock price appreciation (or depreciation) plus reinvested dividends . Source : Bloomberg -20 0 20 40 60 80 100 120 Total Returns % AI S&P 500 FTSE NAREIT Mortgage REIT Index
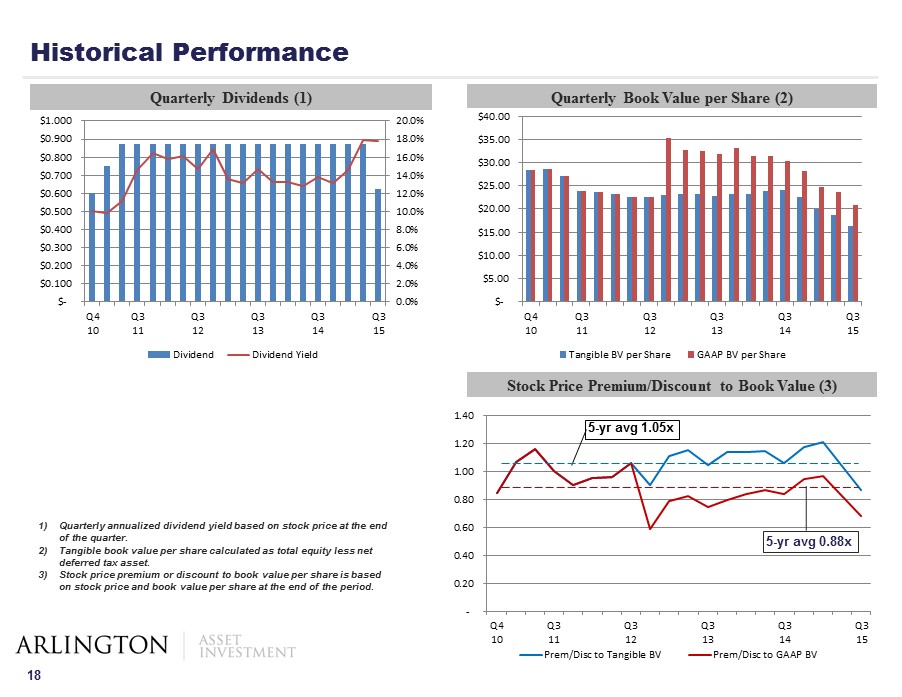
18 Historical Performance 0.0% 2.0% 4.0% 6.0% 8.0% 10.0% 12.0% 14.0% 16.0% 18.0% 20.0% $- $0.100 $0.200 $0.300 $0.400 $0.500 $0.600 $0.700 $0.800 $0.900 $1.000 Q4 10 Q3 11 Q3 12 Q3 13 Q3 14 Q3 15 Dividend Dividend Yield Quarterly Dividends (1) $- $5.00 $10.00 $15.00 $20.00 $25.00 $30.00 $35.00 $40.00 Q4 10 Q3 11 Q3 12 Q3 13 Q3 14 Q3 15 Tangible BV per Share GAAP BV per Share Quarterly Book Value per Share (2) Stock Price Premium/Discount to Book Value (3) - 0.20 0.40 0.60 0.80 1.00 1.20 1.40 Q4 10 Q3 11 Q3 12 Q3 13 Q3 14 Q3 15 Prem/Disc to Tangible BV Prem/Disc to GAAP BV 5 - yr a vg 1.05x 5 - yr avg 0.88x 1) Quarterly annualized dividend yield based on stock price at the end of the quarter. 2) Tangible book value per share calculated as total equity less net deferred tax asset. 3) Stock price premium or discount to book value per share is based on stock price and book value per share at the end of the period.
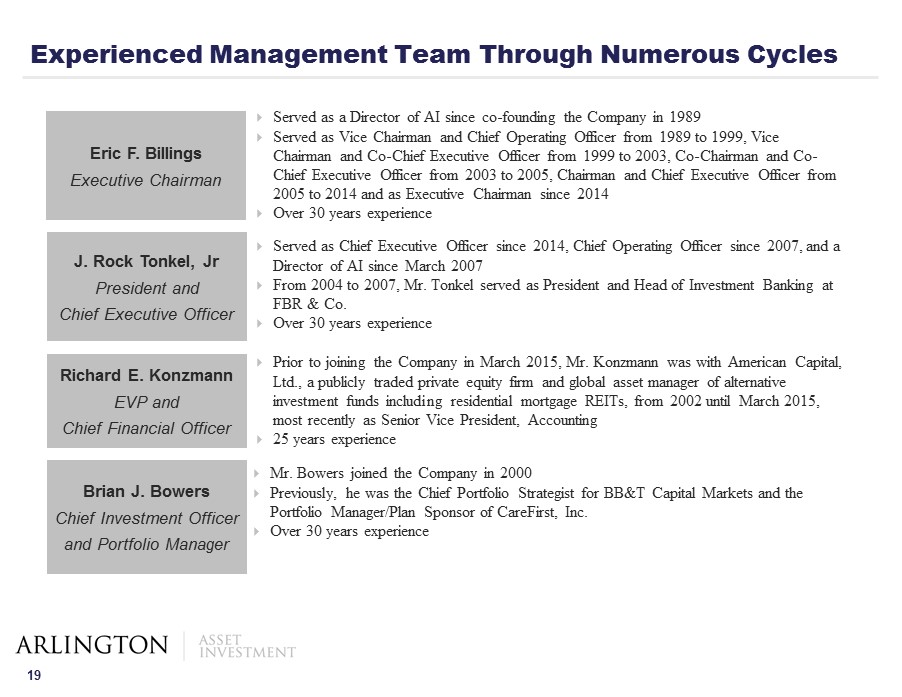
19 Served as a Director of AI since co - founding the Company in 1989 Served as Vice Chairman and Chief Operating Officer from 1989 to 1999, Vice Chairman and Co - Chief Executive Officer from 1999 to 2003, Co - Chairman and Co - Chief Executive Officer from 2003 to 2005, Chairman and Chief Executive Officer from 2005 to 2014 and as Executive Chairman since 2014 Over 30 years experience Served as Chief Executive Officer since 2014, Chief Operating Officer since 2007, and a Director of AI since March 2007 From 2004 to 2007, Mr. Tonkel served as President and Head of Investment Banking at FBR & Co. Over 30 years experience J. Rock Tonkel, Jr President and Chief Executive Officer Richard E. Konzmann EVP and Chief Financial Officer Brian J. Bowers Chief Investment Officer and Portfolio Manager Prior to joining the Company in March 2015, Mr. Konzmann was with American Capital, Ltd., a publicly traded private equity firm and global asset manager of alternative investment funds including residential mortgage REITs, from 2002 until March 2015, most recently as Senior Vice President, Accounting 2 5 years experience Mr. Bowers joined the Company in 2000 Previously, he was the Chief Portfolio Strategist for BB&T Capital Markets and the Portfolio Manager/Plan Sponsor of CareFirst, Inc. Over 30 years experience Experienced Management Team Through Numerous Cycles Eric F. Billings Executive Chairman