Attached files
| file | filename |
|---|---|
| 8-K - CURRENT REPORT OF MATERIAL EVENTS OR CORPORATE CHANGES - Behringer Harvard Opportunity REIT I, Inc. | a15-23693_18k.htm |
Exhibit 99.1
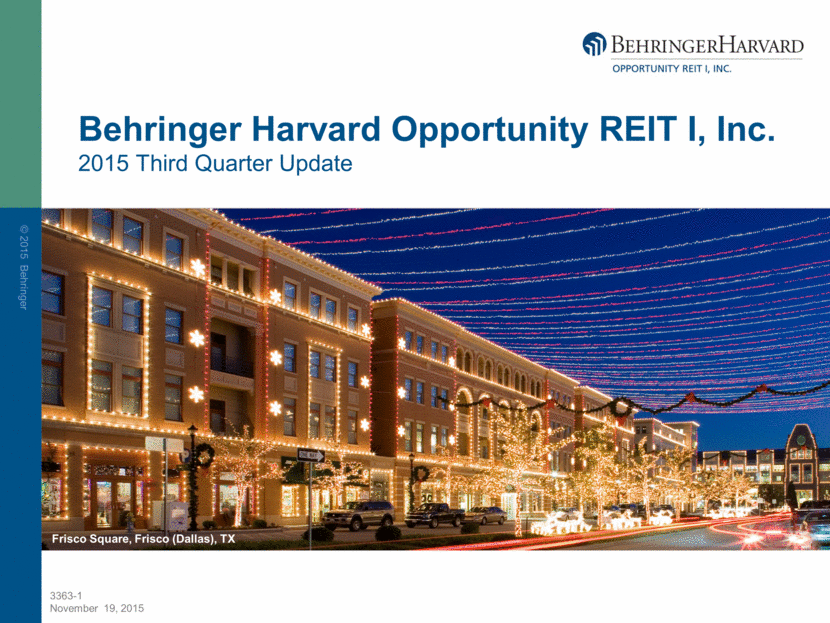
Behringer Harvard Opportunity REIT I, Inc. 2015 Third Quarter Update Frisco Square, Frisco (Dallas), TX
Dial-In and Replay Information To listen to today’s call: Dial: 888-287-5534 Conference ID: 7398270 For a replay of today’s call: Dial: 888-203-1112 Conference ID: 7398270

Forward-Looking Statements This presentation contains forward-looking statements, including discussion and analysis of the financial condition of us and our subsidiaries and other matters. These forward-looking statements are not historical facts but are the intent, belief or current expectations of our management based on their knowledge and understanding of our business and industry. Words such as “may,” “anticipates,” “expects,” “intends,” “plans,” “believes,” “seeks,” “estimates,” “would,” “could,” “should” and variations of these words and similar expressions are intended to identify forward-looking statements. We intend that such forward-looking statements be subject to the safe harbor provisions created by Section 27A of the Securities Act of 1933 and Section 21E of the Securities Exchange Act of 1934. These statements are not guarantees of future performance and are subject to risks, uncertainties and other factors, some of which are beyond our control, are difficult to predict and could cause actual results to differ materially from those expressed or forecasted in the forward-looking statements. Forward-looking statements that were true at the time made may ultimately prove to be incorrect or false. We caution you not to place undue reliance on forward-looking statements, which reflect our management's view only as of the date of this presentation. We undertake no obligation to update or revise forward-looking statements to reflect changed assumptions the occurrence of unanticipated events or changes to future operating results.
Forward-Looking Statements Factors that could cause actual results to differ materially from any forward-looking statements made in the presentation include but are not limited to: market and economic challenges experienced by the U.S. and global economies or real estate industry as a whole and the local economic conditions in the markets in which our properties are located; the availability of cash flow from operating activities for capital expenditures; conflicts of interest arising out of our relationships with our advisor and its affiliates; our ability to retain our executive officers and other key personnel of our advisor, our property manager and their affiliates; our level of debt and the terms and limitations imposed on us by our debt agreements; the availability of credit generally, and any failure to refinance or extend our debt as it comes due or a failure to satisfy the conditions and requirements of that debt; the need to invest additional equity in connection with debt financings as a result of reduced asset values and requirements to reduce overall leverage; future increases in interest rates; our ability to raise capital in the future by issuing additional equity or debt securities, selling our assets or otherwise; impairment charges; unfavorable changes in laws or regulations impacting our business or our assets; and factors that could affect our ability to qualify as a real estate investment trust. The forward-looking statements should be read in light of these and other risk factors identified in the “Risk Factors” section of our Annual Report on Form 10-K for the year ended December 31, 2014 and Form 10-Q for the quarter ended September 30, 2015, as filed with the Securities and Exchange Commission.
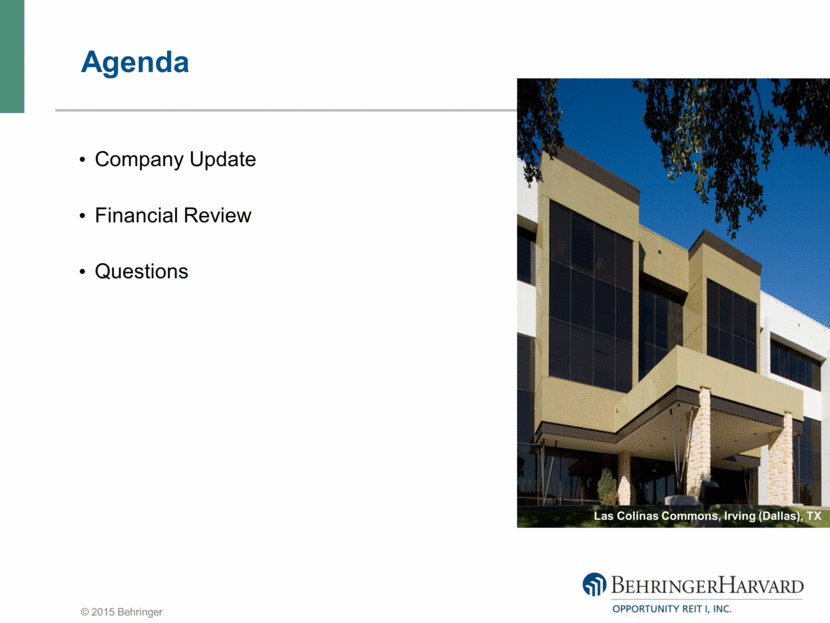
Agenda Company Update Financial Review Questions Las Colinas Commons, Irving (Dallas), TX
Company Update Continue in the asset disposition phase All remaining investments are in various stages of the marketing process Key areas of focus: Providing liquidity to investors through the orderly disposition of assets Winding-up the Company Making a liquidating distribution in late-2016, early-2017
Northborough Tower Houston, Texas Being marketed for sale Original purchase price was $32.9 million Leased to single tenant Positive cash flow Property debt: $18.7 million Workout discussions with lender Texas Office Properties Dallas/Houston, Texas Las Colinas Commons Irving (Dallas), Texas Being marketed for sale Original purchase price was $15.9 million 60%-leased to multiple tenants Positive cash flow Property debt: $11.3 million Northpoint Central Houston, Texas Being marketed for sale Original allocated purchase price was $21 million 96%-leased to multiple tenants Positive cash flow Property debt: $15.4 million This image cannot currently be displayed.

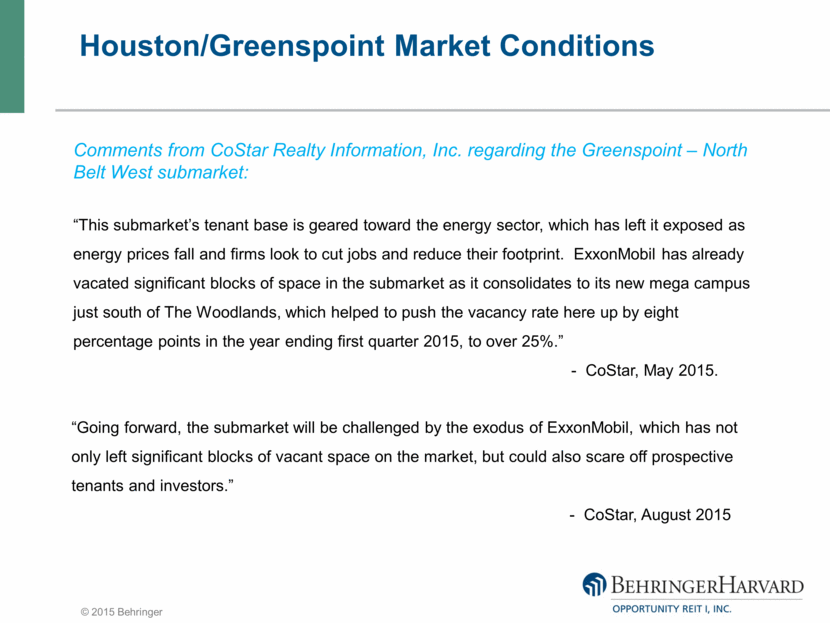
Houston/Greenspoint Market Conditions c “This submarket’s tenant base is geared toward the energy sector, which has left it exposed as energy prices fall and firms look to cut jobs and reduce their footprint. ExxonMobil has already vacated significant blocks of space in the submarket as it consolidates to its new mega campus just south of The Woodlands, which helped to push the vacancy rate here up by eight percentage points in the year ending first quarter 2015, to over 25%.” - CoStar, May 2015. “Going forward, the submarket will be challenged by the exodus of ExxonMobil, which has not only left significant blocks of vacant space on the market, but could also scare off prospective tenants and investors.” - CoStar, August 2015 Comments from CoStar Realty Information, Inc. regarding the Greenspoint – North Belt West submarket:
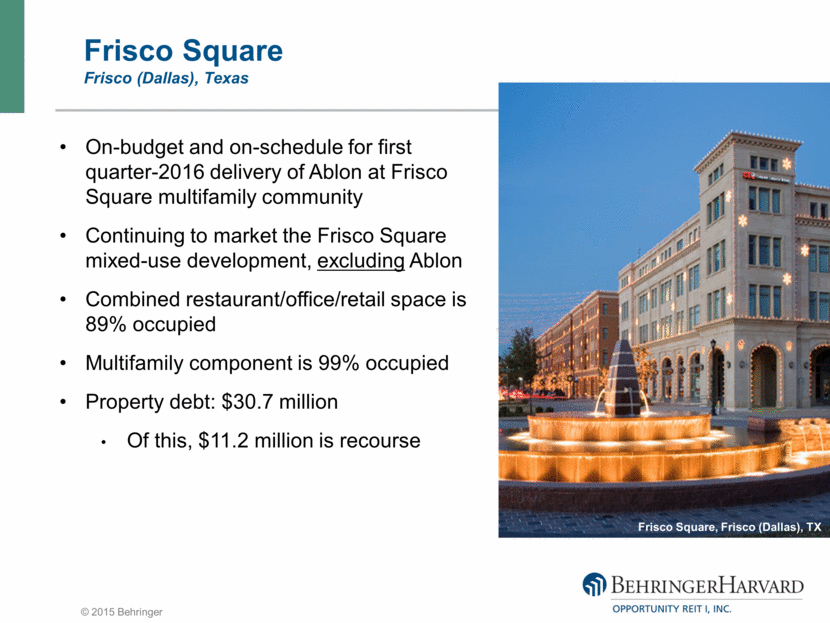
Frisco Square Frisco (Dallas), Texas On-budget and on-schedule for first quarter-2016 delivery of Ablon at Frisco Square multifamily community Continuing to market the Frisco Square mixed-use development, excluding Ablon Combined restaurant/office/retail space is 89% occupied Multifamily component is 99% occupied Property debt: $30.7 million Of this, $11.2 million is recourse Frisco Square, Frisco (Dallas), TX
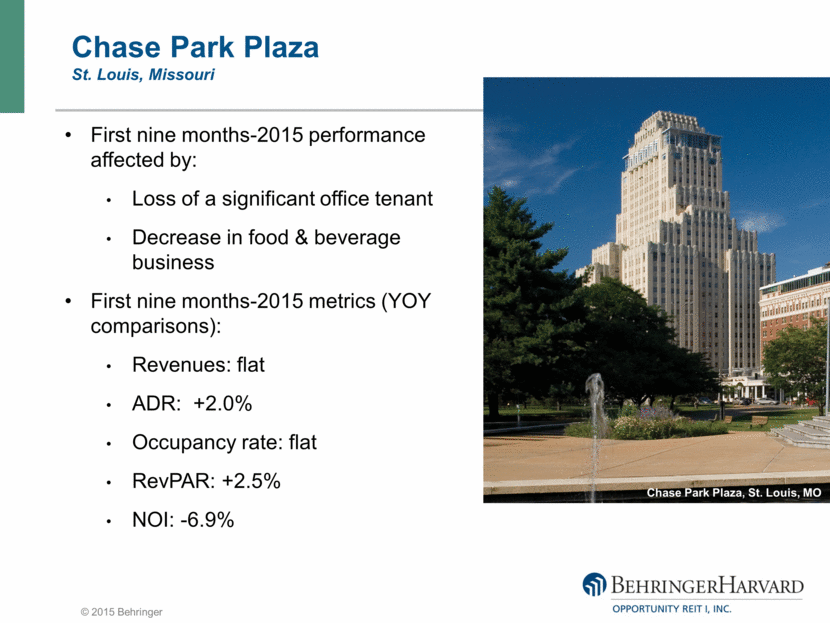
Chase Park Plaza St. Louis, Missouri First nine months-2015 performance affected by: Loss of a significant office tenant Decrease in food & beverage business First nine months-2015 metrics (YOY comparisons): Revenues: flat ADR: +2.0% Occupancy rate: flat RevPAR: +2.5% NOI: -6.9% Chase Park Plaza, St. Louis, MO
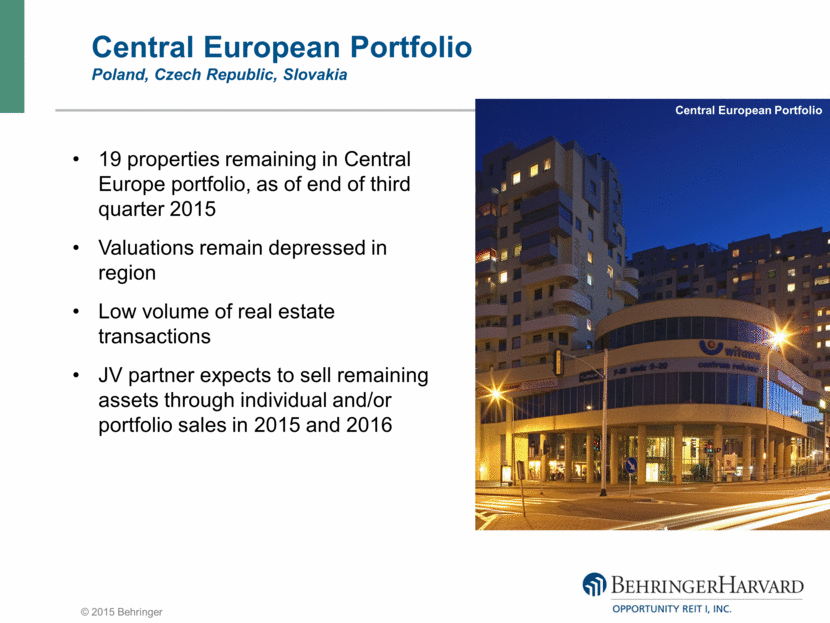
Central European Portfolio Poland, Czech Republic, Slovakia 19 properties remaining in Central Europe portfolio, as of end of third quarter 2015 Valuations remain depressed in region Low volume of real estate transactions JV partner expects to sell remaining assets through individual and/or portfolio sales in 2015 and 2016 Central European Portfolio
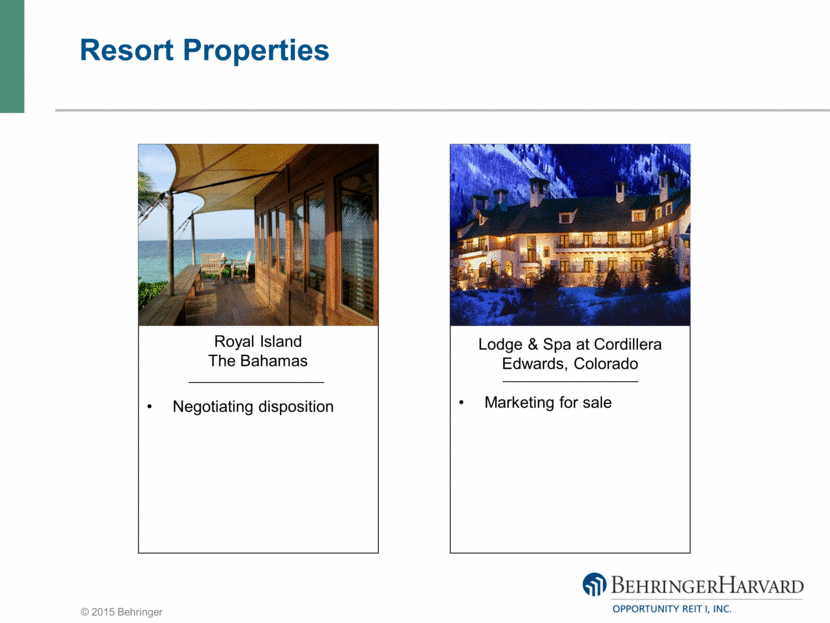
Resort Properties Lodge & Spa at Cordillera Edwards, Colorado Marketing for sale Royal Island The Bahamas Negotiating disposition
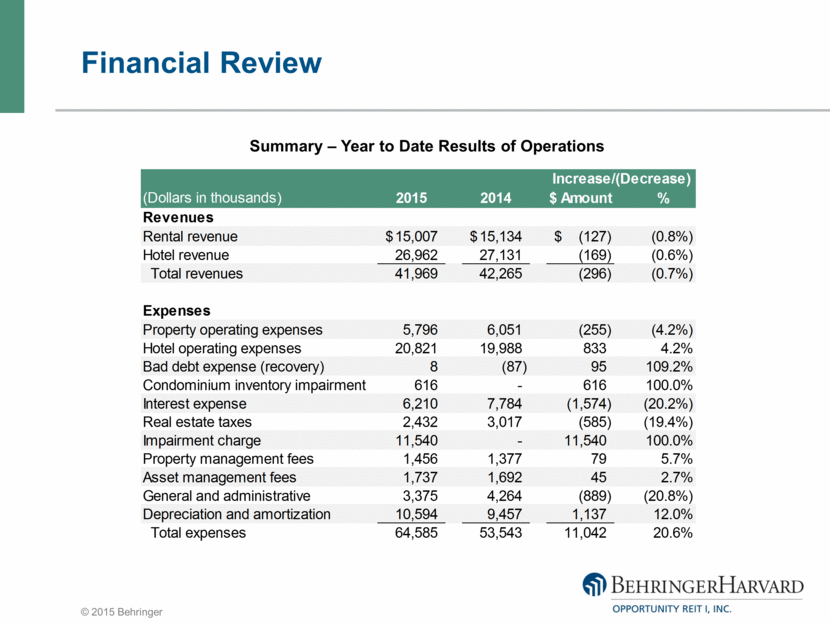
Financial Review Chase Park Plaza, St. Louis, MO Summary – Year to Date Results of Operations (Dollars in thousands) 2015 2014 $ Amount % Revenues Rental revenue 15,007 $ 15,134 $ (127) $ (0.8%) Hotel revenue 26,962 27,131 (169) (0.6%) Total revenues 41,969 42,265 (296) (0.7%) Expenses Property operating expenses 5,796 6,051 (255) (4.2%) Hotel operating expenses 20,821 19,988 833 4.2% Bad debt expense (recovery) 8 (87) 95 109.2% Condominium inventory impairment 616 - 616 100.0% Interest expense 6,210 7,784 (1,574) (20.2%) Real estate taxes 2,432 3,017 (585) (19.4%) Impairment charge 11,540 - 11,540 100.0% Property management fees 1,456 1,377 79 5.7% Asset management fees 1,737 1,692 45 2.7% General and administrative 3,375 4,264 (889) (20.8%) Depreciation and amortization 10,594 9,457 1,137 12.0% Total expenses 64,585 53,543 11,042 20.6% Increase/(Decrease)
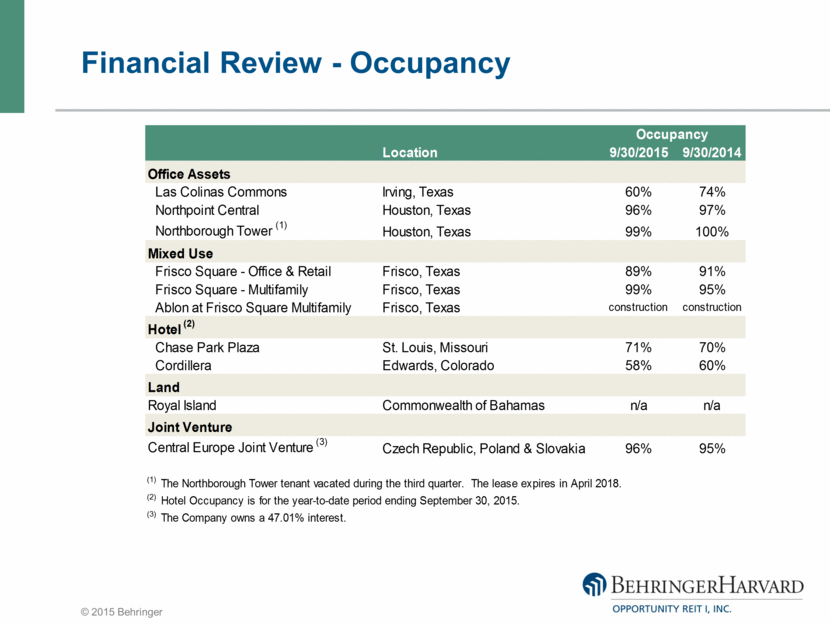
Financial Review - Occupancy Occupancy Location 9/30/2015 9/30/2014 Office Assets Las Colinas Commons Irving, Texas 60% 74% Northpoint Central Houston, Texas 96% 97% Northborough Tower (1) Houston, Texas 99% 100% Mixed Use Frisco Square - Office & Retail Frisco, Texas 89% 91% Frisco Square - Multifamily Frisco, Texas 99% 95% Ablon at Frisco Square Multifamily Frisco, Texas Under construction Under construction Hotel (2) Chase Park Plaza St. Louis, Missouri 71% 70% Cordillera Edwards, Colorado 58% 60% Land Royal Island Commonwealth of Bahamas n/a n/a Joint Venture Central Europe Joint Venture (3) Czech Republic, Poland & Slovakia 96% 95% (1) The Northborough Tower tenant vacated during the third quarter. The lease expires in April 2018. (2) Hotel Occupancy is for the year-to-date period ending September 30, 2015. (3) The Company owns a 47.01% interest.
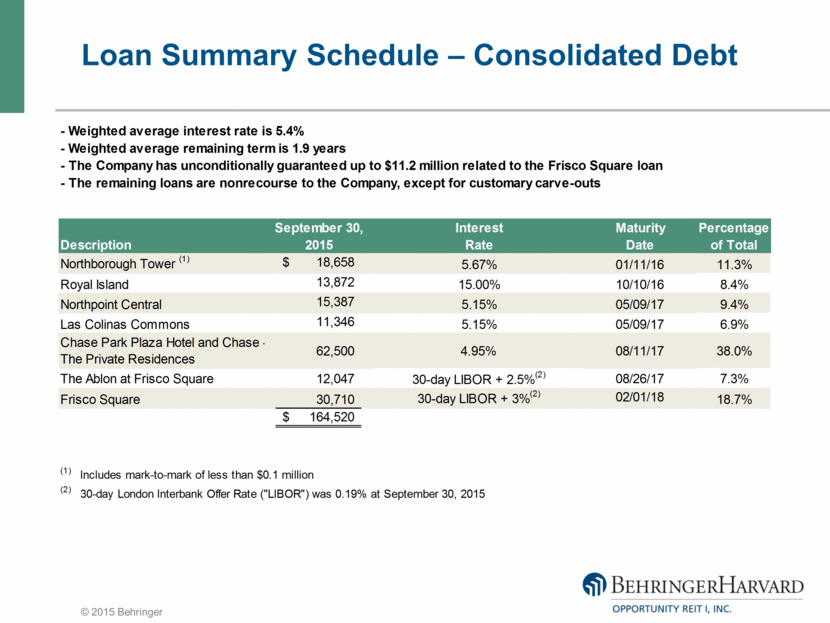
Loan Summary Schedule – Consolidated Debt Notes Payable Schedule As of September 30, 2015 - Debt-to-total assets (book value) is 53.7% - Weighted average interest rate is 5.4% - Weighted average remaining term is 1.9 years - The Company has unconditionally guaranteed up to $11.2 million related to the Frisco Square loan - The remaining loans are nonrecourse to the Company, except for customary carve-outs September 30, Interest Maturity Percentage Year to Description 2015 Rate Date of Total Maturity LIBOR +Base Pay rate Northborough Tower (1) $ 18,658 5.67% 01/11/16 11.3% 0.29 0.03 5.67% 5.67% 0.64% Royal Island 13,872 15.00% 10/10/16 8.4% 1.04 0.09 15.00% 15.00% 1.26% Northpoint Central 15,387 5.15% 05/09/17 9.4% 1.63 0.15 5.15% 5.15% 0.48% Las Colinas Commons 11,346 5.15% 05/09/17 6.9% 1.63 0.11 5.15% 5.15% 0.36% Chase Park Plaza Hotel and Chase - The Private Residences 62,500 4.95% 08/11/17 38.0% 1.89 0.72 4.95% 4.95% 1.88% The Ablon at Frisco Square 12,047 30-day LIBOR + 2.5%(2) 08/26/17 7.3% 1.93 0.14 0.19% 2.50% 2.69% 0.20% Frisco Square 30,710 30-day LIBOR + 3%(2) 02/01/18 18.7% 2.38 0.44 0.19% 3.00% 3.19% 0.60% $ 164,520 Weighted Avg Term 1.69 Weighted Average Rate 5.42% (1) Includes mark-to-mark of less than $0.1 million (2) 30-day London Interbank Offer Rate ("LIBOR") was 0.19% at September 30, 2015
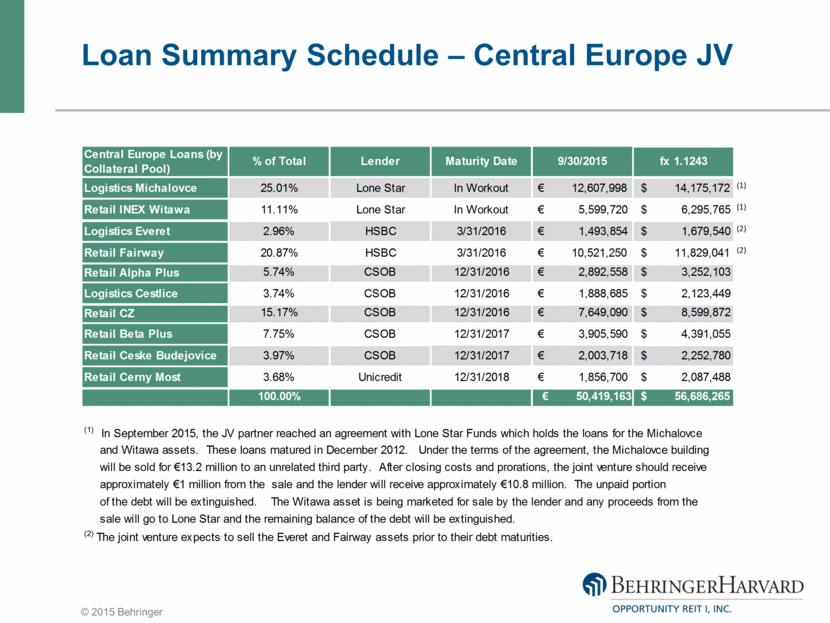
Loan Summary Schedule – Central Europe JV Central Europe Loans (by Collateral Pool) % of Total Lender Maturity Date 9/30/2015 fx 1.1243 Logistics Michalovce 25.01% Lone Star In Workout € 12,607,998 $ 14,175,172 (1) Retail INEX Witawa 11.11% Lone Star In Workout € 5,599,720 $ 6,295,765 (1) Logistics Everet 2.96% HSBC 3/31/2016 € 1,493,854 $ 1,679,540 (2) Retail Fairway 20.87% HSBC 3/31/2016 € 10,521,250 $ 11,829,041 (2) Retail Alpha Plus 5.74% CSOB 12/31/2016 € 2,892,558 $ 3,252,103 Logistics Cestlice 3.74% CSOB 12/31/2016 € 1,888,685 $ 2,123,449 Retail CZ 15.17% CSOB 12/31/2016 € 7,649,090 $ 8,599,872 Retail Beta Plus 7.75% CSOB 12/31/2017 € 3,905,590 $ 4,391,055 Retail Ceske Budejovice 3.97% CSOB 12/31/2017 € 2,003,718 $ 2,252,780 Retail Cerny Most 3.68% Unicredit 12/31/2018 € 1,856,700 $ 2,087,488 100.00% € 50,419,163 $ 56,686,265 (1) In September 2015, the JV partner reached an agreement with Lone Star Funds which holds the loans for the Michalovce and Witawa assets. These loans matured in December 2012. Under the terms of the agreement, the Michalovce building will be sold for €13.2 million to an unrelated third party. After closing costs and prorations, the joint venture should receive approximately €1 million from the sale and the lender will receive approximately €10.8 million. The unpaid portion of the debt will be extinguished. The Witawa asset is being marketed for sale by the lender and any proceeds from the sale will go to Lone Star and the remaining balance of the debt will be extinguished. (2) The joint venture expects to sell the Everet and Fairway assets prior to their debt maturities.
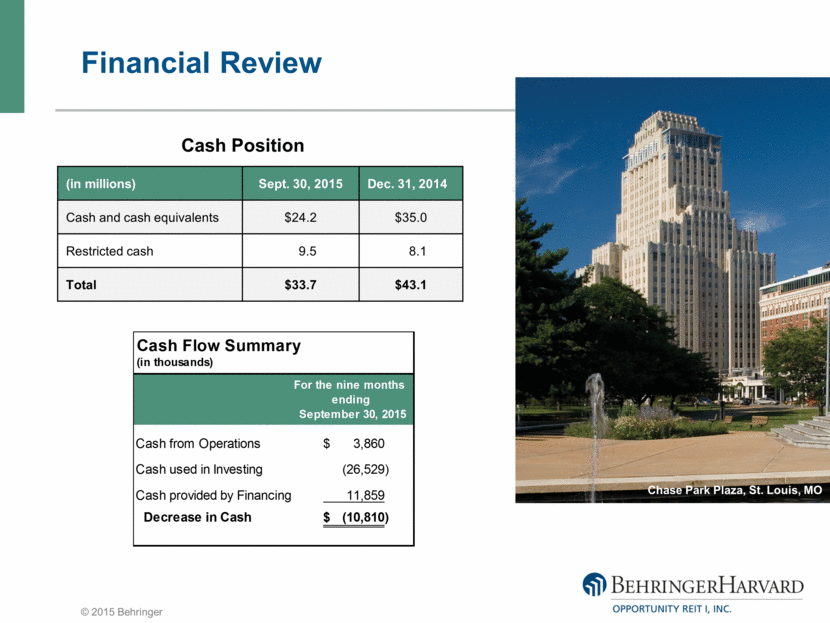
Financial Review Cash Position (in millions) Sept. 30, 2015 Dec. 31, 2014 Cash and cash equivalents $24.2 $35.0 Restricted cash 9.5 8.1 Total $33.7 $43.1 Chase Park Plaza, St. Louis, MO Cash from Operations 3,860 $ Cash used in Investing (26,529) Cash provided by Financing 11,859 Decrease in Cash (10,810) $ For the nine months ending September 30, 2015 Cash Flow Summary (in thousands)
Funds From Operations Year to Date and Trailing Four Quarters ($ in thousands) For a reconciliation of Funds From Operations to Net Income, refer to Current Report on Form 8-K filed on November 19, 2015. C:\JMS\105537\15-23693-1\task1111 Year to Date Ended 9/30/2015 9/30/2015 6/30/2015 3/31/2015 12/31/2015 (23,600) $ (16,463) $ (2,842) $ (4,295) $ (13,587) $ Adjustments for (1) : Impairment charge 13,394 12,778 616 - 9,371 11,820 4,751 3,475 3,594 3,679 Gain on sale of real estate (230) (194) - (36) (18) Funds from Operations (FFO) 1,384 $ 872 $ 1,249 $ (737) $ (555) $ (1) Includes our pro rata share of those unconsolidated investments which we account for under the equity method of accounting and the noncontrolling interest adjustment for the third-party partners' share. For the Quarter Ended Net Loss attributable to common shareholders Real estate depreciation and amortization

Closing Remarks All investments are in various stages of the marketing process As assets are not under contract, cannot project the date the fund will close or final distribution amounts Expect final distribution to be less than most recent ESV of $3.58 Goal is to wind-up operations in late-2016, early-2017 Most likely, a final liquidating distribution will be made following wind-up, rather than as individual assets are sold
Playback Information Representatives may log on to the password-protected portion of the Behringer website (www.behringerinvestments.com) in the Financial Professional’s log-in section for a playback of today’s call Investors may dial toll free (888) 203-1112 and use conference ID 7398270 to access a playback of today’s call Replays will be available until December 18, 2015.
