Attached files
| file | filename |
|---|---|
| 8-K - 8-K - STORE CAPITAL Corp | a15-23544_18k.htm |
Exhibit 99.1
2015 Third Quarter Presentation November 2015 The LEADER in Middle Market Real Estate Capital Solutions SINGLE TENANT OPERATIONAL REAL ESTATE

Disclaimer This presentation includes forward-looking statements within the meaning of Section 27A of the Securities Act of 1933, as amended, that are subject to the “safe harbor” created by that section. These forward-looking statements include comments with respect to our objectives and strategies, and the results of our operations and our business. Forward-looking statements can be identified by the fact that they do not relate strictly to historical or current facts. They often include words such as “expects,” “assumes,” “anticipates,” “intends,” “plans,” “believes,” “seeks,” “estimates” or words of similar meaning, or future or conditional words such as “assuming,” “will,” “would,” “possible,” “proposed,” “projected,” “positioned,” “vision,” “opportunity,” “should,” “could,” “indicative,” “target” or “may.” FORWARD-LOOKING STATEMENTS INVOLVE NUMEROUS RISKS AND UNCERTAINTIES, AND YOU SHOULD NOT RELY ON THEM AS PREDICTIONS OF FUTURE EVENTS. FORWARD-LOOKING STATEMENTS DEPEND ON ASSUMPTIONS, DATA OR METHODS THAT MAY BE INCORRECT OR IMPRECISE, AND WE MAY NOT BE ABLE TO REALIZE THEM. WE DO NOT GUARANTEE THAT THE TRANSACTIONS AND EVENTS DESCRIBED WILL HAPPEN AS DESCRIBED (OR THAT THEY WILL HAPPEN AT ALL). THE FOLLOWING FACTORS, AMONG OTHERS, COULD CAUSE ACTUAL RESULTS AND FUTURE EVENTS TO DIFFER MATERIALLY FROM THOSE SET FORTH OR CONTEMPLATED IN THE FORWARD-LOOKING STATEMENTS: general business and economic conditions; continued volatility and uncertainty in the credit markets and broader financial markets, including potential fluctuations in the consumer price index; other risks inherent in the real estate business, including tenant defaults, potential liability relating to environmental matters, illiquidity of real estate investments, and potential damages from natural disasters; availability of suitable properties to acquire and our ability to acquire and lease those properties on favorable terms; ability to renew leases, lease vacant space or re-lease space as existing leases expire or are terminated; the degree and nature of our competition; our failure to generate sufficient cash flows to service our outstanding indebtedness; access to debt and equity capital markets; fluctuating interest rates; availability of qualified personnel and our ability to retain our key management personnel; changes in, or the failure or inability to comply with, government regulation, including Maryland laws; failure to maintain our status as a REIT; changes in the U.S. tax law and other U.S. laws, whether or not specific to REITs; and the risks described in the Company’s Annual Report on Form 10-K for the fiscal year ended December 31, 2014. This presentation contains references to our copyrights, trademarks and service marks and to those belonging to other entities. Solely for convenience, copyrights, trademarks, trade names and service marks referred to in this presentation may appear without the © or ® or TM or SM symbols, but such references are not intended to indicate, in any way, that we will not assert, to the fullest extent under applicable law, our rights or the rights of the applicable licensor to these copyrights, trademarks, trade names and service marks. We do not intend our use or display of other companies’ trade names, copyrights, trademarks or service marks to imply a relationship with, or endorsement or sponsorship of us by, any other companies.
S│T│O│R│E Overview S│T│O│R│E is Single Tenant Operational Real Estate The leader in middle market net-lease solutions: Our management team has a 35-year track record and has originated more than $13 billion of investments in STORE assets. A $2.5 trillion market for single-tenant “profit center” real estate: We have a $7.4 billion pipeline1 of potential targeted investments. One of the fastest growing net-lease REITs in the US: We have invested $3.7 billion since our organization in 2011. High quality portfolio subject to long-term leases: S T O R E believes that, on average, approximately 75% of contracts are equivalent to investment grade (internal S T O R E rating of Baa3 or above) Efficient capital structure: We are one of very few REITs to have both an A+ rated debt conduit and a corporate investment-grade credit rating. Scalable platform positioned for growth: We have market-leading external and internal growth. Data as of September 30, 2015. 3 S T O R E’s pipeline as of September 30, 2015. See slide 7 for more information about S T O R E's pipeline, including its composition. S T O R E may never acquire properties in its pipeline for a variety of reasons as described in the Company’s Annual Report on Form 10-K for the fiscal year ended December 31, 2014.
S│T│O│R│E’s Key Achievements Generated a total return to shareholders of 22.5% since IPO, versus 5.6% for the MSCI U.S. REIT Index1 Invested $949 million year-to-date at an initial weighted average cap rate of 8.1%2 Increased our pipeline of potential targeted investments to approximately $7.4 billion3 Expanded our portfolio to 1,246 property locations, representing 288 customers across more than 80 industry groups4 Obtained a BBB- credit rating from Fitch Ratings, Inc., complementing existing access to an A+ rated secured debt conduit Declared a third quarter dividend of $0.27 per common share, representing an 8% increase over the second quarter 2015 dividends declared year-to-date total $0.77 per common share, representing a payout ratio of 71% based on AFFO per common share of $1.09 for the nine months ended September 30, 2015 1 Source: Bloomberg. Represents total return over period from November 17, 2014 through October 30, 2015; based on IPO price of $18.50 on November 17, 2014 for S T O R E. Past performance is not necessarily an indicator of our future performance. 2 Represents acquisitions of real estate and investment in loans receivable between January 1, 2015 and September 30, 2015. 3 S T O R E’s pipeline as of September 30, 2015. See slide 7 for more information about S T O R E's pipeline, including its composition. S T O R E may never acquire properties in its pipeline for a variety of reasons as described in the Company’s Annual Report on Form 10-K for the fiscal year ended December 31, 2014. 4 As of September 30, 2015.
Experienced Leadership Team with a Proven Track Record Management team with 35-year track record More than $13 billion invested in 8,500+ STORE assets Investor returns in management’s prior investment vehicles have outperformed benchmarks1 Guided the formation, and ultimate sale, of two successful NYSE-listed REITs: Franchise Finance Corporation of America (“FFCA”)(NYSE: FFA) and Spirit Finance (NYSE: SFC) FFCA Spirit Finance 17 Privately Traded Funds (16 SEC Registered) S│T│O│R│E Spirit Finance sold FFCA sold Data as of September 30, 2015. 1 Prior performance is not necessarily an indicator of future performance, and S T O R E’s future returns may not exceed industry benchmarks. We believe we have originated more single-tenant operational real estate investments than anyone 1981 – 2015 investment activity ($MM)1
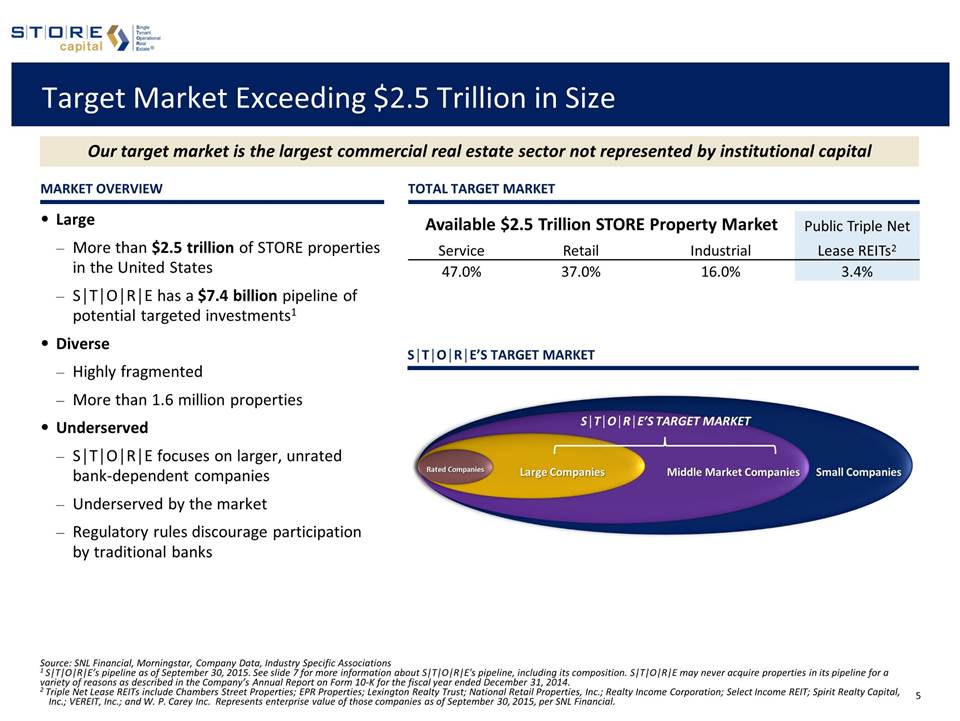
Target Market Exceeding $2.5 Trillion in Size Large More than $2.5 trillion of STORE properties in the United States S│T│O│R│E has a $7.4 billion pipeline of potential targeted investments1 Diverse Highly fragmented More than 1.6 million properties Underserved S│T│O│R│E focuses on larger, unrated bank-dependent companies Underserved by the market Regulatory rules discourage participation by traditional banks Market Overview S│T│O│R│E’s Target Market Source: SNL Financial, Morningstar, Company Data, Industry Specific Associations 1 S T O R E’s pipeline as of September 30, 2015. See slide 7 for more information about S T O R E's pipeline, including its composition. S T O R E may never acquire properties in its pipeline for a variety of reasons as described in the Company’s Annual Report on Form 10-K for the fiscal year ended December 31, 2014. 2 Triple Net Lease REITs include Chambers Street Properties; EPR Properties; Lexington Realty Trust; National Retail Properties, Inc.; Realty Income Corporation; Select Income REIT; Spirit Realty Capital, Inc.; VEREIT, Inc.; and W. P. Carey Inc. Represents enterprise value of those companies as of September 30, 2015, per SNL Financial. Small Companies Middle Market Companies Large Companies Rated Companies S│T│O│R│E’s Target market Available $2.5 Trillion STORE Property Market Public Triple Net Service Retail Industrial Lease REITs2 47.0% 37.0% 16.0% 3.4% Our target market is the largest commercial real estate sector not represented by institutional capital Total Target Market
Superior Direct Origination Platform Direct sourcing and lease contract creation designed to allow us to generate higher yields from same tenants Direct calling efforts on thousands of companies and financial sponsors DIRECT Tenant introductions through real estate broker relationships Virtual Salesforce >75% <25% 1.8%– 1.9% Source: NNNetAdvisors.com and Company data Source: NNNetAdvisors.com and Company data. As of September 30, 2015. 1 Represents the initial weighted average cap rate. 2 Includes national restaurant concepts that have a minimum of 100 franchised locations and no corporate guarantee from the franchisor. Represents the average cap rate for 3Q 2015. 3 Includes retail, industrial and medical office concepts that have a minimum of 100 locations and are leased to a tenant under a lease with 10 or more years remaining on the base lease term, with retail comprising the bulk of this category. Represents the average cap rate for 3Q 2015. OUR NET-LEASE PRICING ADVANTAGE 8.4% 7.8% 6.0% 5.9% 5.0% 5.5% 6.0% 6.5% 7.0% 7.5% 8.0% 8.5% 9.0% STORE Avg. Cap Rate (since Inception)¹ STORE Avg. Cap Rate (Q3'15)¹ Industry Avg. Nat'l Restaurant Franchisee² Industry Avg. Leases Longer than 10 Years³
We have a $7.4 billion Pipeline¹ of Potential Investments S│T│O│R│E is selective, closing just ~5% of all identified opportunities PIPELINE Stages (Since Inception) Pipeline Sector Distribution as of September 30, 20152 ¹ Data as of September 30, 2015. S T O R E may never acquire properties in its pipeline for a variety of reasons, including the discovery of previously unknown liabilities or other items uncovered during its diligence process, unsuccessful negotiations with potential sellers and the failure of closing conditions to be satisfied. In addition, the pipeline is dynamic, and its size and composition, as well as the timing and probability of investment closing, are likely to vary substantially over time. Accordingly, you should not place undue reliance on the pipeline disclosures in this presentation. ² Based on properties for which an industry sector had been identified. Investment Opportunities 34% Letter of Intent Sent 13% Letter of Intent Executed 7% Approved 5.4% Contract Executed 5.3% Close 50% Actionable Opportunities $7.4 billion total pipeline as of September 30, 2015 Restaurant 25% Retail 17% Industrial 11% Gyms 8% Storage 7% Other 6% Specialty Medical 6% Education 5% Auto 5% Entertainment 5% Theaters 4% Grocery 1%
Time-Tested Underwriting Approach S│T│O│R│E’s bottom-up approach to underwriting has remained consistent over the past 35 years Unit-Level Profitability Each asset in which we invest has its own discrete profit and loss statement, which is our primary source of payment Corporate Credit Should the assets we invest in fail to produce profits, then payments are received from cash flows from other corporate assets Underlying Real Estate Value while our focus has become more refined based on studying years of empirical data to find the highest predictors of default and recovery Property Sale or Re-let 2000 2012 We use a sophisticated, data-driven underwriting approach Seminal FFCA fixed income research portfolio studies 1997 & Spirit Finance performance Sector research, management evaluation and contract documentation
S│T│O│R│E Contracts vs. Investment Grade Tenant Leases TYPICAL LEASE STRUCTURE FOR SELECT COMPANIES vs. S│T│O│R│E Tenant credit ratings are transient and only one payment source Over 15 years, half of investment-grade companies lose their investment-grade ratings1 Contracts can encompass more permanent characteristics Investment-grade profit-center contracts provide the following: Source: Company filings, CoStar, Standard & Poor’s Ratings Services 1 “2013 Annual Global Corporate Default Study and Ratings Transitions”, Standard & Poor’s Ratings Services 2 CoStar as of September 30, 2015 (prior 18 month average for reported transactions). 3 Home Depot comparative $/PSF represents average of S T O R E’s electronic and home goods stores. LA Fitness comparative $/PSF represents average of S T O R E’s fitness centers. Walgreens comparative $/PSF represents average of S T O R E s urgent care centers and drugstores. Dollar General comparative value represents average of S T O R E’s dollar stores. The comparability of the assets is not necessarily an indicator of future results and assets may not be fully comparable as a result of S T O R E ’s sample size and market or locational differences. Data as of September 30, 2015. A BB tenant with a strong contract is generally equal to or better than an investment-grade tenant with a weak contract Feature Importance Rational investment amounts Lower investment risk Master leases & cross-defaults Alignment & investment diversity Unit-level reporting Site & payment stream quality indication Home Depot LA Fitness Walgreens Dollar General S│T│O│R│E Rent Bumps Unit Level Reporting Master Lease/ Cross Default Triple Net Avg. $/PSF2 $193 $295 $435 $165 S│T│O│R│E Comparatives3 $107 $163 $316 $96 Our investment portfolio is comprised of approximately 75% investment-grade contracts CONTRACTS GOVERN RISK
Portfolio Contract Quality Expected default frequency & STORE score equivalent Ratings Data as of September 30, 2015. We measure the credit quality of our portfolio on a contract-by-contract basis using the STORE Score, which is a risk measure reflective of both the credit risk of our tenants and the profitability of the operations at our properties. The STORE Score is a quantitative measurement of contract risk computed by multiplying tenant default probabilities (using Moody’s RiskCalc) and estimated store closure probabilities (using a simple algorithm we developed that has closure probabilities ranging from 100% to 10%, depending on unit-level profitability). However, qualitative features can also impact investment risk, such as low property investment amounts, the presence of third party guarantors or other factors. Such qualitative factors may serve to further mitigate investment risk. We have maintained lease contract quality, averaging approximately 75% investment-grade.
Portfolio – At a Glance OUR PORTFOLIO as of September 30, 2015 Investment Property Locations 1,246 Customers 288 Industries in which our Customers Operate 81 States 46 Proportion of Portfolio from Direct Origination ~75% Weighted Average Annual Lease Escalation1 1.7% Weighted Average Remaining Lease Contract Term ~15 Years Occupancy2 99.8% # of Properties not currently operating but subject to a Lease3 7 # of Investment Locations subject to a Ground Lease 9 % of Investment Portfolio subject to NNN Leases (based on annualized base rent and interest) 97% % of Investment Portfolio subject to Master Leases (based on annualized base rent and interest)4 81% Average Investment Amount / Replacement Cost (new) 5 82% % of Investment Locations Providing Unit-Level Financial Reporting 96% Median Unit Fixed Charge Coverage Ratio (FCCR)/4-Wall Coverage Ratio6 2.07x/2.53x Proportion of Investment Contracts Rated Investment Grade7 ~75% Note: See page 22 for the definitions and footnotes referenced above. “ABR” is annualized base rent and interest.
Diversified Across Geographies¹ Now in 46 states, with expected national distribution 1 Shown as of September 30, 2015 by % of annualized base rent and interest.
Diversified Across Tenants and Industries 1 Shown as of September 30, 2015, by % of annualized base rent and interest (annualized based on rates in effect on September 30, 2015, for all of leases, loans and direct financing receivables in place as of that date). 2SMH Theatres, Inc. has announced that it has entered into an agreement to be acquired by AMC Entertainment Holdings, Inc., subject to regulatory approval and customary closing conditions. TOP TENANT ROSTER Sector breakdown Customer Industry % Annualized Base Rent and Interest¹ Number of Properties Building Square Footage (in thousands) Restaurants – full service 16.76 % 287 2,071 Restaurants – limited service 9.66 % 328 940 Health clubs 7.17 % 48 1,574 Movie theaters 7.04 % 33 1,296 Early childhood education centers 6.82 % 129 1,342 Colleges and professional schools 2.53 % 6 466 Automotive repairs and maintenance 1.76 % 42 168 Family entertainment centers 1.55 % 6 336 All other service industries (34) 19.67 % 181 5,706 Total service 72.96 % 1,060 13,899 Furniture stores 4.55 % 26 1,574 Sporting goods stores 3.41 % 16 1,050 All other retail industries (11) 6.63 % 59 2,542 Total retail 14.59 % 101 5,166 Total industrial (26) 12.45 % 85 8,893 Total 100.00 % 1,246 27,958 Customer % Annualized Base Rent and Interest1 Number of Properties Gander Mountain Company 2.92 % 13 SMH Theatres, Inc.2 (Starplex/Showplex) 2.32 % 10 RMH Franchise Holdings, Inc. (Applebee’s) 2.10 % 33 O’Charley’s LLC 1.83 % 30 Sailormen, Inc. (Popeye’s Louisiana Kitchen) 1.47 % 41 FreedomRoads, LLC (Camping World) 1.44 % 8 Rainbow Early Education Holding, LLC 1.41 % 36 Bellisio Foods, Inc. 1.36 % 2 Hill Country Holdings, LLC (Ashley Furniture) 1.14 % 6 Conn’s, Inc. 1.14 % 7 All other (278 customers) 82.87 % 1,060 Total 100.00 % 1,246 Seek diversity across industries with sustained relevance No single tenant represents > 3% of rent and interest
High Quality Portfolio Most Diversified Tenant Base Source: Latest publicly available quarterly financial statements as of September 30, 2015. 1 Includes: Chambers Street Properties; EPR Properties; Lexington Realty Trust; Spirit Realty Capital, Inc.; VEREIT, Inc.; and W. P. Carey Inc. (weighted average lease term in years) Longest Lease Term Lowest Near-Term Renewal Exposure (% top 5 tenants, based on current annual rent) (% expirations by period, based on current annual rent) Our portfolio has superior term and diversification over market comparables
Flexible, Conservative Capital Structure CAPITAL STRUCTURE as of september 30, 2015 S│T│O│R│E was initially capitalized through funds managed by Oaktree Capital Management, together with various institutional co-investors. The company was introduced into the public market in 2014. We are amongst the very few REITs to have an A+ rated debt conduit together with an investment-grade corporate credit rating. We maintain a flexible, conservative capital structure designed to benefit all stakeholders Target all-in funded debt/EBITDA of ~6x – 7x Target 2015 Net Acquisitions: $1.1 billion2 Target AFFO Payout Ratio: 65% to 75% Note: Columns may not sum due to rounding effects. 1 Represents Adjusted Debt / Annualized Adjusted EBITDA calculated based on an estimated Annualized Adjusted EBITDA using base rent and interest, annualized based on rates in effect on September 30, 2015 for all leases, loans and direct financing receivables in place as of that date. This reported figure has many important limitations, and you should not unduly rely on it. Please see Appendix for a description of these limitations and a reconciliation of adjusted debt and EBITDA to their most comparable GAAP measures. 2 Our target acquisitions pace is subject to numerous assumptions and factors, many of which are beyond our control, and our actual acquisitions in 2015 may be significantly less than expected. Accordingly, you should not place undue reliance on our target amount of net acquisitions in 2015. $ millions Drawn Credit Facility $192 Long-Term Debt: Master Funding A+ Rated Conduit 1,439 Other Term Borrowings 197 Total Debt $1,828 Less: Cash & Cash Equivalents (29) Net Debt $1,799 Undrawn Credit Facility 208 Total Liquidity $237 Unencumbered Real Estate Assets $1,356 Adjusted Debt / Annualized Adjusted EBITDA - Current Estimated Run Rate1 6.3x We have an A+ rated debt conduit and industry-leading capital flexibility CAPITALIZATION HIGHLIGHTS
Prudent Leverage Philosophy and Investment-Grade Borrowings A+ Master Funding BBB- Unsecured Notes Greater Access to Capital at a Low Cost ü ü Flexible Asset Management ü ü Differentiated Investor Base ü ü Ability to Re-Lever ü ü Source: SEC company filings. Data as of September 30, 2015. 1 Excludes non-permanent debt such as revolving credit facilities and lines of credit. 2 Weighted average figures calculated using reported data. Where a range of maturities is reported for a given tranche of debt, calculation uses latest maturity specified for that tranche. Cost of fixed rate debt includes preferred equity. Go long Be judicious Ladder debt maturities Be mindful of mean reversion Use the three means of interest rate risk mitigation Lease escalations Free cash flow levels Secured debt principal paydowns STORE has broad access to investment-grade borrowings Advantages of Our Master Funding Program Our Borrowing Spread Philosophy Our Cost of Fixed rate Debt vs. KEY Peers Our LONG-TERM Debt MATURITY vs. KEY Peers1
S│T│O│R│E’s Performance 1 Represents acquisitions of real estate and investment in loans receivable. 2 Refer to Appendix for reconciliation to GAAP net income. 3 Gross Return represents initial cap rate plus weighted average annual lease escalators. We have built a rapidly growing REIT with a highly scalable platform Cap Rates, Gross Returns3 & Borrowing Costs Investment Spreads over borrowing costs NOI and AFFO ($MM)2 Annual Acquisitions ($MM)1
Our Dividend Policy and Growth Dividend policy We have a current annualized dividend rate of $1.08 per share Our dividend represents a 4.8% yield1 We have a stated target AFFO payout ratio of 65% – 75% Our dividend payout ratio is amongst the lowest of net lease peer companies TARGET Internal AFFO per share Growth OF 3% TO 4% External growth is expected to be the main driver of AFFO growth Driven by expected new investment activities that are high relative to our asset base, Backed by a strong $7.4 billion pipeline of potential investments2, Backed by a well-staffed origination platform, And driven by historically favorable investment spreads. 1 Based on closing stock price as of October 30, 2015. 2 As of September 30, 2015. See slide 7 for more information about S T O R E’s pipeline, including its composition. S T O R E may never acquire properties in its pipeline for a variety of reasons as described in the Company’s Annual Report on Form 10-K for the fiscal year ended December 31, 2014. 3 Shown as of September 30, 2015, by % of annualized base rent and interest (annualized based on rates in effect on September 30, 2015, for all leases, loans and direct financing receivables in place as of that date). External AFFO per share Growth Our internal growth is driven by attractive average annual lease escalations of 1.7%, And also by our low dividend payout ratio that is designed to permit added portfolio investments.
S│T│O│R│E is a Highly Compelling Risk-Adjusted Return Story Historical EPS Growth² >8.0% 8 47 Historical Dividend Yield >4.0% Source: SEC company filings, IBES Thomson Reuters. Data as of October 30, 2015. ¹ Ratios are calculated as: share price / 2015E AFFO per share, divided by the sum of (a) 2015-2016E AFFO per share growth and (b) 2015E AFFO yield (with 2015E AFFO yield calculated as 2015E AFFO per share divided by the share price). Figures use median consensus 2016E and 2015E AFFO per share estimates per SNL Financial and share prices as of October 30, 2015. ² Represents 3-year historical normalized diluted EPS growth of eight companies: AT&T, Inc., Host Hotels & Resorts Inc., L Brands, Inc., Murphy Oil Corporation, Realty Income Corporation, Verizon Communications Inc., Welltower Inc., and Weyerhaeuser Co. S&P 500 500 Among a Small Group of PREMIER Investor Stories PEER PRICE / AFFO Growth RatioS¹ AFFO Multiple 18.2x 16.8x 15.0x 17.0x 19.0x AFFO Growth 4.4% 5.3% 8.0% 12.0% 16.0%
Investment Highlights Our business model is positioned to deliver dividends as well as internal and external growth 2 We believe we employ a market-leading, direct origination approach in an underserved $2.5 trn market 1 Our leadership team has a 35-year track record of out-performance1 6 4 Our underwriting and management processes are designed to deliver investment-grade contract risk 5 Our differentiated capital markets strategy is designed to achieve an ideal capital structure We own a high quality, highly diversified and growing portfolio of STORE properties 3 1 Based on annualized total returns earned by management’s prior investment vehicles while operating as a public company, compared to annualized total returns on the MSCI US REIT Index during the same periods. The past performance of these investment vehicles is not an indicator of S T O R E’s future performance, and S T O R E’s performance may be significantly less favorable than the past performance data included in this presentation. Moreover, some of the past performance data covers periods with economic characteristics and cycles and interest rate environments that are significantly different from those S T O R E faces today and may face in the future.
Appendix
Definitions and Footnotes 1 Weighted average annual lease escalation represents the weighted average annual escalation rate of the entire portfolio as if the escalations in all leases were expressed on an annual basis and assumes the contracts that increase based on changes in CPI increase at the minimum of the stated fixed percentage in the contract. 2 S T O R E defines occupancy as a property being subject to a lease or loan contract. 3 The number of properties not currently operating but subject to a lease represents the number of our investment locations that have been closed by the tenant but remain subject to a lease. 4 The percentage of investment portfolio subject to master leases represents the percentage of the investment portfolio in multiple properties with a single customer subject to master leases. Based on annualized base rent and interest, 81% of the investment portfolio involves multiple properties with a single customer, whether or not subject to a master lease. 5 The average investment amount/replacement cost (new) represents the ratio of purchase price to replacement cost (new) at acquisition. 6 S T O R E calculates unit fixed charge coverage ratio generally as the ratio of (i) the unit’s EBITDAR, less a standardized corporate overhead expense based on estimated industry standards, to (ii) the unit’s total fixed charges, which are its lease expense, interest expense and scheduled principal payments on indebtedness. The 4-Wall coverage ratio refers to a unit’s FCCR before taking into account standardized corporate overhead expense. 7 The proportion of investment contracts rated investment grade represents the percentage of our contracts that have a STORE Score that is investment grade or higher. We measure the credit quality of our portfolio on a contract-by-contract basis using the STORE Score, which is a risk measure reflective of both the credit risk of our tenants and the profitability of the operations at the properties. See Slide 11
Supplemental Reporting Measures Funds from Operations, or FFO, and Adjusted Funds from Operations, or AFFO Our reported results are presented in accordance with U.S. generally accepted accounting principles, or GAAP. We also disclose Funds from Operations, or FFO, and Adjusted Funds from Operations, or AFFO, both of which are non-GAAP measures. We believe these two non-GAAP financial measures are useful to investors because they are widely accepted industry measures used by analysts and investors to compare the operating performance of REITs. FFO and AFFO do not represent cash generated from operating activities and are not necessarily indicative of cash available to fund cash requirements; accordingly, they should not be considered alternatives to net income as a performance measure or to cash flows from operations as reported on our statement of cash flows as a liquidity measure and should be considered in addition to, and not in lieu of, GAAP financial measures. We compute FFO in accordance with the definition adopted by the Board of Governors of the National Association of Real Estate Investment Trusts, or NAREIT. NAREIT defines FFO as GAAP net income, excluding gains (or losses) from extraordinary items and sales of depreciable property, real estate impairment losses and depreciation and amortization expense from real estate assets, including the pro rata share of such adjustments of unconsolidated subsidiaries. To derive AFFO, we modify the NAREIT computation of FFO to include other adjustments to GAAP net income related to non-cash revenues and expenses such as straight-line rents, amortization of deferred financing costs and stock-based compensation. In addition, in deriving AFFO, we exclude transaction costs associated with acquiring real estate subject to existing leases. FFO is used by management, investors and analysts to facilitate meaningful comparisons of operating performance between periods and among our peers primarily because it excludes the effect of real estate depreciation and amortization and net gains on sales, which are based on historical costs and implicitly assume that the value of real estate diminishes predictably over time, rather than fluctuating based on existing market conditions. Management believes that AFFO provides more useful information to investors and analysts because it modifies FFO to exclude additional non-cash revenues and expenses such as straight-line rents, amortization of deferred financing costs and stock-based compensation as such items may cause short-term fluctuations in net income but have no impact on operating cash flows or long-term operating performance. Additionally, in deriving AFFO, we exclude transaction costs associated with acquiring real estate subject to existing leases. We view transaction costs to be a part of our investment in the real estate we acquire, similar to the treatment of acquisition and closing costs on our sale-leaseback transactions, which are capitalized as a part of the investment in the asset. We believe that transaction costs are not an ongoing cost of the portfolio in place at the end of each reporting period and, for these reasons, we add back the portion expensed when computing AFFO. As a result, we believe AFFO to be a more meaningful measurement of ongoing performance that allows for greater performance comparability. Therefore, we disclose both FFO and AFFO and reconcile them to the most appropriate GAAP performance metric, which is net income. STORE Capital’s FFO and AFFO may not be comparable to similarly titled measures employed by other companies.
Supplemental Reporting Measures (Continued) EBITDA, Adjusted EBITDA, Annualized Adjusted EBITDA and Adjusted Debt EBITDA represents earnings before interest, taxes, depreciation and amortization. Adjusted EBITDA represents EBITDA modified to include other adjustments to GAAP net income for transaction costs, non-cash impairment charges and gains on dispositions of real estate. Annualized Adjusted EBITDA is calculated by multiplying Adjusted EBITDA for the quarter by four. Annualized Adjusted EBITDA – Current Estimated Run Rate is calculated based on an estimated Adjusted EBITDA as if all leases and loans in place as of September 30, 2015 had been in place as of July 1, 2015; then annualizing the Adjusted EBITDA for the quarter by multiplying it by four. You should not unduly rely on this metric as it is based on several assumptions and estimates that may prove to be inaccurate. Our actual reported Adjusted EBITDA for future periods may be significantly less than that implied by our reported Annualized Adjusted EBITDA – Current Estimated Run Rate for a variety of reasons. Adjusted Debt represents our outstanding debt (including the unsecured credit facility and non-recourse debt obligations of consolidated special purpose entities) excluding unamortized net debt premium, further reduced for cash and cash equivalents and restricted cash deposits held for the benefit of lenders. We believe excluding unamortized net debt premium, cash and cash equivalents and restricted cash deposits held for the benefit of lenders provides an estimate of the net contractual amount of borrowed capital to be repaid which we believe is a beneficial disclosure to investors and analysts. Adjusted Debt to Annualized Adjusted EBITDA Adjusted Debt to Annualized Adjusted EBITDA, or leverage, is a supplemental non-GAAP financial measure we use to evaluate the level of borrowed capital being used to increase the potential return of our real estate investments. We calculate leverage by dividing Adjusted Debt by Annualized Adjusted EBITDA. Because our portfolio growth level is significant to the overall size of the Company, we believe that presenting this leverage metric on a run rate basis is more meaningful than presenting the metric for the historical quarterly period, and we refer to this metric as Adjusted Debt to Annualized Adjusted EBITDA—Current Estimated Run Rate. Leverage should be considered as a supplemental measure of the level of risk to which stockholder value may be exposed. Our computation of leverage may differ from the methodology employed by other companies, and, therefore, may not be comparable to other measures.
GAAP Reconciliations: Net Income to NOI Note: Columns may not sum due to rounding effects. From Inception (May 17, 2011) through December 31, 2011 Year Ended December 31, Nine Months Ended September 30, $ millions 2012 2013 2014 2014 2015 Net (Loss) / Income $ (2.0) $ 8.2 $ 26.3 $ 48.1 $ 30.7 $ 59.7 Less: gain on dispositions of real estate - - - (4.5) (1.3) (1.9) Less: income from discontinued operations, net of tax (0.7) (0.9) (4.0) (1.1) (1.1) - (Loss) / Income from Continuing Operations $ (2.7) $ 7.3 $ 22.3 $ 42.5 $ 28.3 $ 57.8 Adjustments: Income tax expense - 0.1 0.2 0.2 0.2 0.2 Depreciation and amortization 1.0 11.0 30.3 57.0 40.2 63.7 General and administrative 4.0 10.4 14.1 19.5 14.0 21.0 Transaction costs 0.4 0.4 2.6 2.8 2.0 1.0 Interest 1.1 11.5 39.2 68.0 50.1 59.3 Provision for impairment of real estate - - - - - 1.0 Net Operating Income $ 3.9 $ 40.6 $ 108.8 $ 190.0 $ 134.9 $ 204.0
GAAP Reconciliations: Net Income to FFO and AFFO Note: Columns may not sum due to rounding effects. From Inception (May 17, 2011) through December 31, 2011 Year Ended December 31, Nine Months Ended September 30, $ millions 2012 2013 2014 2014 2015 Net (Loss) / Income $ (2.0) $ 8.2 $ 26.3 $ 48.1 $ 30.7 $ 59.7 Depreciation and amortization of real estate assets: Continuing operations 1.0 10.9 30.1 56.7 40.0 63.5 Discontinued operations 0.0 0.1 0.6 - - - Provision for impairment of real estate - - - - - 1.0 Loss/(Gain) on dispositions of real estate, net of tax 0.0 (0.2) (2.2) (5.5) (2.2) (1.9) Funds From Operations $ (1.0) $ 19.0 $ 54.8 $ 99.4 $ 68.5 $ 122.3 Adjustments: Straight-line rental revenue, net - (0.2) (1.4) (2.4) (2.2) (1.5) Transaction costs 0.4 0.4 2.6 2.8 2.0 1.0 Non-cash equity-based compensation - 0.4 1.2 2.3 1.7 3.4 Non-cash interest expense 0.5 2.1 4.2 7.1 5.7 4.8 Amortization of lease-related intangibles and costs - 0.1 0.3 0.7 0.5 0.8 Adjusted Funds From Operations (AFFO) $ (0.0) $ 21.7 $ 61.7 $ 109.9 $ 76.1 $ 130.9
GAAP Reconciliations: Debt to Adj. Debt and Net Income to Adj. EBITDA $ millions As of September 30, 2015 Debt $ 1,827.9 Adjustments: Unamortized net debt premium (0.1 ) Cash and cash equivalents (29.0 ) Restricted cash deposits held for the benefit of lenders (15.8 ) Adjusted Debt $ 1,783.0 $ millions Three Months Ended September 30, 2015 Net income $ 23.0 Adjustments: Interest 21.4 Depreciation and amortization 23.3 Income tax expense 0.1 EBITDA $ 67.7 Adjustments: Transaction costs 0.1 Gain on dispositions of real estate (0.7 ) Adjusted EBITDA $ 67.2 Estimated additional Adjusted EBITDA for the quarter had all leases and loans in place as of September 30, 2015 been in place as of July 1, 2015 3.2 Adjusted EBITDA – Current Estimated Run Rate $ 70.4 Annualized Adjusted EBITDA – Current Estimated Run Rate $ 281.5 Adjusted Debt / Annualized Adjusted EBITDA – Current Estimated Run Rate 6.3 x Note: Columns may not sum due to rounding effects.