Attached files
| file | filename |
|---|---|
| 8-K - 8-K - AVAYA INC | form8-k_4q15earningsrel.htm |
| EX-99.2 - EXHIBIT 99.2 - AVAYA INC | ex992erpresentation4q15.htm |
Media Inquiries: Investor Inquiries: Jeremiah Glodoveza John Nunziati 408-496-3190 408-562-3780 jglodoveza@avaya.com jfnunziati@avaya.com Avaya Reports Fourth Quarter and Fiscal Year 2015 Financial Results Fourth Quarter Fiscal 2015: Revenue of $1,008 million Operating Income of $100 million, Non-GAAP Operating Income(1) of $202 million Adjusted EBITDA(1) of $246 million, 24.4% of revenue Fiscal Year 2015: Revenue of $4,081 million Operating Income of $371 million, Non-GAAP Operating Income(1) of $718 million Adjusted EBITDA(1) of $900 million, 22.1% of revenue Record levels for Product Gross Margin and Service Gross Margin Santa Clara, Calif. — Wednesday, November 11, 2015 – Avaya reported financial results for the fourth fiscal quarter and fiscal year ended September 30, 2015. Total revenue for the fourth quarter was $1,008 million, up $9 million compared to the prior quarter, down year-over-year, and within the Company’s expected range. For the quarter, adjusted EBITDA(1) was $246 million which compares to adjusted EBITDA of $207 million for the prior quarter and $253 million for the fourth quarter of fiscal 2014. GAAP operating income was $100 million and non-GAAP operating income was $202 million which compares to non-GAAP operating income of $161 million for the prior quarter and $212 million for the fourth quarter of fiscal 2014. For fiscal 2015, Avaya reported revenue of $4,081 million, down 7% compared to fiscal 2014 revenue of $4,371 million, or down 4% in constant currency. GAAP operating income was $371 million and non-GAAP operating income was $718 million in fiscal 2015 compared to $727 million in fiscal 2014. Fiscal 2015 adjusted EBITDA of $900 million was $2 million higher Exhibit 99.1
compared to fiscal 2014. Free cash flow was $91 million for the fiscal year, with cash and cash equivalents totaling $323 million as of September 30, 2015. “The transformation of the company advanced throughout fiscal 2015. We saw positive leading indicators of demand and grew revenue in our areas of investment and diversification. Operationally, we extended our multi-year upward trend of increased gross margin and adjusted EBITDA percentage for the fifth consecutive year,” said Kevin Kennedy, president and CEO. “In fiscal 2016, Avaya will continue to focus on operational optimization to increase its margins and will continue providing the market with industry leading products and services.” Fourth Fiscal Quarter Highlights Product book-to-bill for the quarter was greater than 1.0. Total bookings for the fourth quarter were 3% below the prior year in constant currency Total revenue under contract was $3.0 billion and increased 1% from the fourth quarter of fiscal 2014 in constant currency. Included in revenue under contract is contracted revenue for private cloud and managed services which increased 11% from the fourth quarter of fiscal 2014 in constant currency, ending the quarter at over $800 million Revenue from flagship products and services accounted for a record 49% of total revenue and revenue from core products and services accounted for 43% of total revenue Gross margin was 61.1% compared to 58.5% for the prior quarter and 58.2% for the fourth quarter of fiscal 2014 Non-GAAP gross margin was 62.0% compared to 59.5% for the prior quarter and 59.7% for the fourth quarter of fiscal 2014 Adjusted EBITDA was $246 million or 24.4% of revenue compared to $207 million or 20.7% of revenue for the prior quarter and $253 million or 22.5% of revenue for the fourth quarter of fiscal 2014 For the fourth fiscal quarter, percentage of revenue by geography was: - U.S. – 56% - EMEA – 24% - Asia-Pacific – 11% - Americas International – 9% Fiscal Year Highlights Total bookings for the fiscal year were down 2% compared to fiscal 2014 in constant currency Revenue of $4,081 million was down $290 million compared to fiscal 2014, and was $168 million lower in constant currency Product revenue of $2,029 million was down $167 million compared to fiscal 2014, and was $123 million lower in constant currency Services revenue of $2,052 million down $123 million compared to fiscal 2014, and was $45 million lower in constant currency Gross margin was 59.5% compared to 57.2% for fiscal 2014 Non-GAAP gross margin was 60.5% compared to 58.9% for fiscal 2014
Adjusted EBITDA was $900 million or 22.1% of revenue compared to $898 million or 20.5% of revenue for fiscal 2014 For the fiscal year, percentage of revenue by geography was: - U.S. – 54% - EMEA – 26% - Asia-Pacific – 10% - Americas International – 10% Conference Call and Webcast Avaya will host a financial results webcast and conference call to discuss its financial results and Q&A at 11:00 AM PST on November 11, 2015. On the call will be Kevin Kennedy, president and CEO, and Dave Vellequette, CFO. The call will be moderated by John Nunziati, senior director of investor relations. To join the financial results live webcast and view supplementary materials, listeners should access the investor page of Avaya’s website (www.avaya.com/investors). Following the live webcast, a replay will be available at the same web address in the event archives. To access the financial results live webcast by phone, dial 877-876-9177 in the U.S. or Canada and 785-424-1666 for international callers, using the conference ID: AVQ415. Listeners should access the webcast or the call 10-15 minutes before the start time to ensure they are connected prior to the start time. A replay of the financial results live webcast and conference call will be available beginning at 11:00 AM PST on November 12 through December 12, 2015, by dialing 800-688-4915 within the United States or 402-220-1319 outside the United States. 2015 Analyst and Investor Meeting Avaya announced previously that it will be hosting a meeting for analysts and investors on Thursday, November 12, 2015 at 1:00 PM PST. The meeting will be webcast live for remote participation. Details for accessing the webcast and supporting slides, which will be posted before the start of the event, can be found on the Investor Relations page of the company’s website, at this link: http://www.avaya.com/investors/events/avaya-2015-analyst-and-investor- meeting/ Access to an archived replay of the event will be available at the same site, starting at 8 AM PST on Friday, November 13, 2015.
About Avaya Avaya is a leading provider of solutions that enable customer and team engagement across multiple channels and devices for better customer experience, increased productivity and enhanced financial performance. Its world-class contact center and unified communications technologies and services are available in a wide variety of flexible on-premise and cloud deployment options that seamlessly integrate with non-Avaya applications. The Avaya Engagement Environment enables third parties to create and customize business applications for competitive advantage. Avaya’s fabric-based networking solutions help simplify and accelerate the deployment of business critical applications and services. For more information please visit www.avaya.com. Certain statements contained in this press release may be forward-looking statements. These statements may be identified by the use of forward-looking terminology such as "anticipate," "believe," "continue," "could," "estimate," "expect," "intend," "may," "might," "plan," "potential," "predict," "should" or "will" or other similar terminology. We have based these forward-looking statements on our current expectations, assumptions, estimates and projections. While we believe these are reasonable, such forward looking statements involve known and unknown risks and uncertainties, many of which are beyond our control. These and other important factors may cause our actual results to differ materially from any future results expressed or implied by these forward-looking statements. For a list and description of such risks and uncertainties, please refer to Avaya's filings with the SEC that are available at www.sec.gov. Avaya disclaims any intention or obligation to update or revise any forward-looking statements. 1 Refer to Supplemental Financial Information accompanying this press release for a reconciliation of GAAP to non-GAAP numbers and for reconciliation of adjusted EBITDA for the third quarter of fiscal 2015 see our Form 8-K filed with the SEC on August 4, 2015 at www.sec.gov.
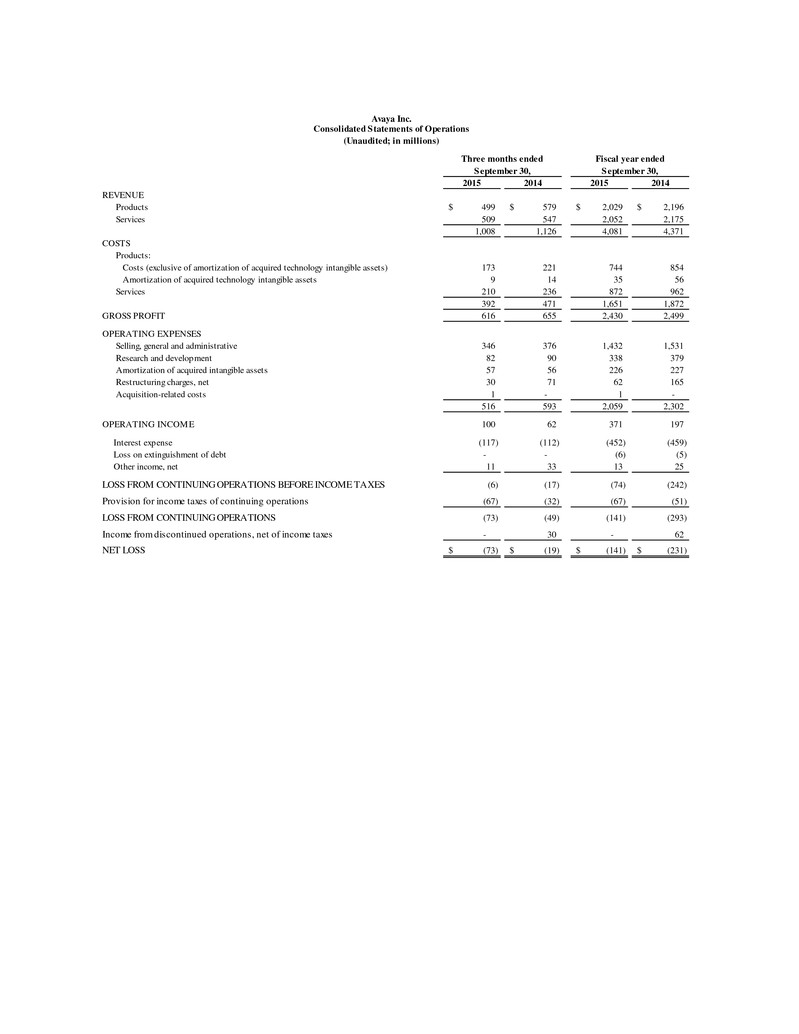
2015 2014 2015 2014 REVENUE Products 499$ 579$ 2,029$ 2,196$ Services 509 547 2,052 2,175 1,008 1,126 4,081 4,371 COSTS Products: Costs (exclusive of amortization of acquired technology intangible assets) 173 221 744 854 Amortization of acquired technology intangible assets 9 14 35 56 Services 210 236 872 962 392 471 1,651 1,872 GROSS PROFIT 616 655 2,430 2,499 OPERATING EXPENSES Selling, general and administrative 346 376 1,432 1,531 Research and development 82 90 338 379 Amortization of acquired intangible assets 57 56 226 227 Restructuring charges, net 30 71 62 165 Acquisition-related costs 1 - 1 - 516 593 2,059 2,302 OPERATING INCOME 100 62 371 197 Interest expense (117) (112) (452) (459) Loss on extinguishment of debt - - (6) (5) Other income, net 11 33 13 25 LOSS FROM CONTINUING OPERATIONS BEFORE INCOME TAXES (6) (17) (74) (242) Provision for income taxes of continuing operations (67) (32) (67) (51) LOSS FROM CONTINUING OPERATIONS (73) (49) (141) (293) Income from discontinued operations, net of income taxes - 30 - 62 NET LOSS (73)$ (19)$ (141)$ (231)$ Three months ended September 30, Avaya Inc. Consolidated Statements of Operations (Unaudited; in millions) Fiscal year ended September 30,
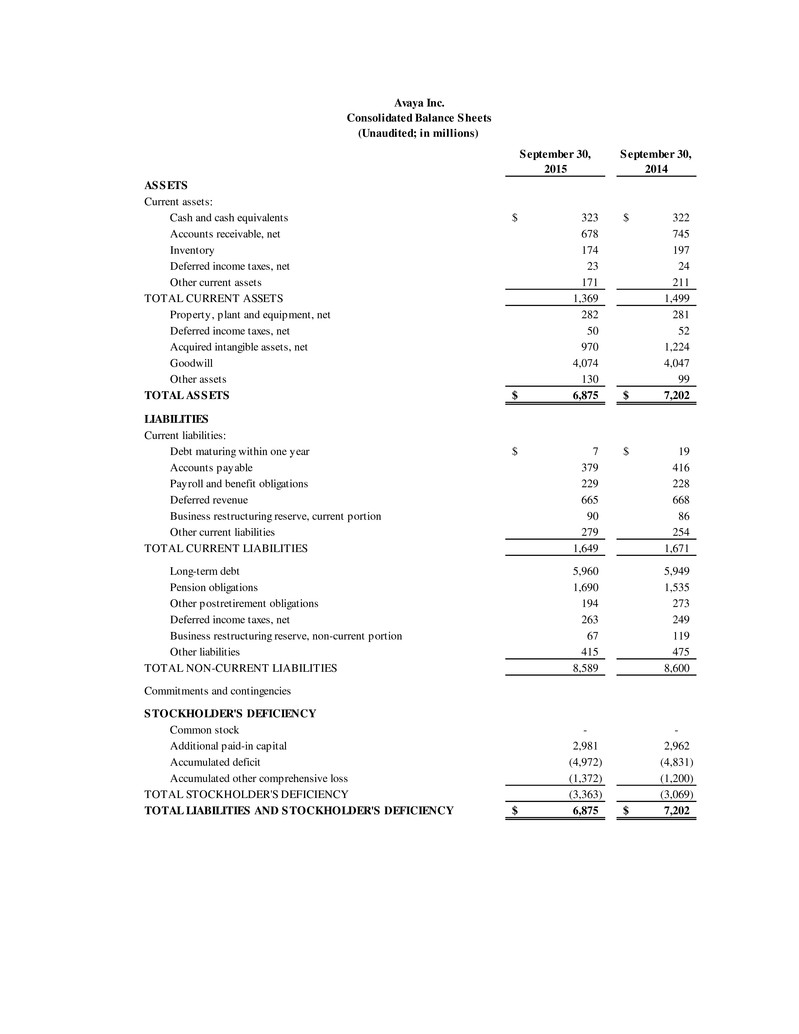
September 30, 2015 September 30, 2014 ASSETS Current assets: Cash and cash equivalents 323$ 322$ Accounts receivable, net 678 745 Inventory 174 197 Deferred income taxes, net 23 24 Other current assets 171 211 TOTAL CURRENT ASSETS 1,369 1,499 Property, plant and equipment, net 282 281 Deferred income taxes, net 50 52 Acquired intangible assets, net 970 1,224 Goodwill 4,074 4,047 Other assets 130 99 TOTAL ASSETS 6,875$ 7,202$ LIABILITIES Current liabilities: Debt maturing within one year 7$ 19$ Accounts payable 379 416 Payroll and benefit obligations 229 228 Deferred revenue 665 668 Business restructuring reserve, current portion 90 86 Other current liabilities 279 254 TOTAL CURRENT LIABILITIES 1,649 1,671 Long-term debt 5,960 5,949 Pension obligations 1,690 1,535 Other postretirement obligations 194 273 Deferred income taxes, net 263 249 Business restructuring reserve, non-current portion 67 119 Other liabilities 415 475 TOTAL NON-CURRENT LIABILITIES 8,589 8,600 Commitments and contingencies STOCKHOLDER'S DEFICIENCY Common stock - - Additional paid-in capital 2,981 2,962 Accumulated deficit (4,972) (4,831) Accumulated other comprehensive loss (1,372) (1,200) TOTAL STOCKHOLDER'S DEFICIENCY (3,363) (3,069) TOTAL LIABILITIES AND STOCKHOLDER'S DEFICIENCY 6,875$ 7,202$ Avaya Inc. (Unaudited; in millions) Consolidated Balance Sheets
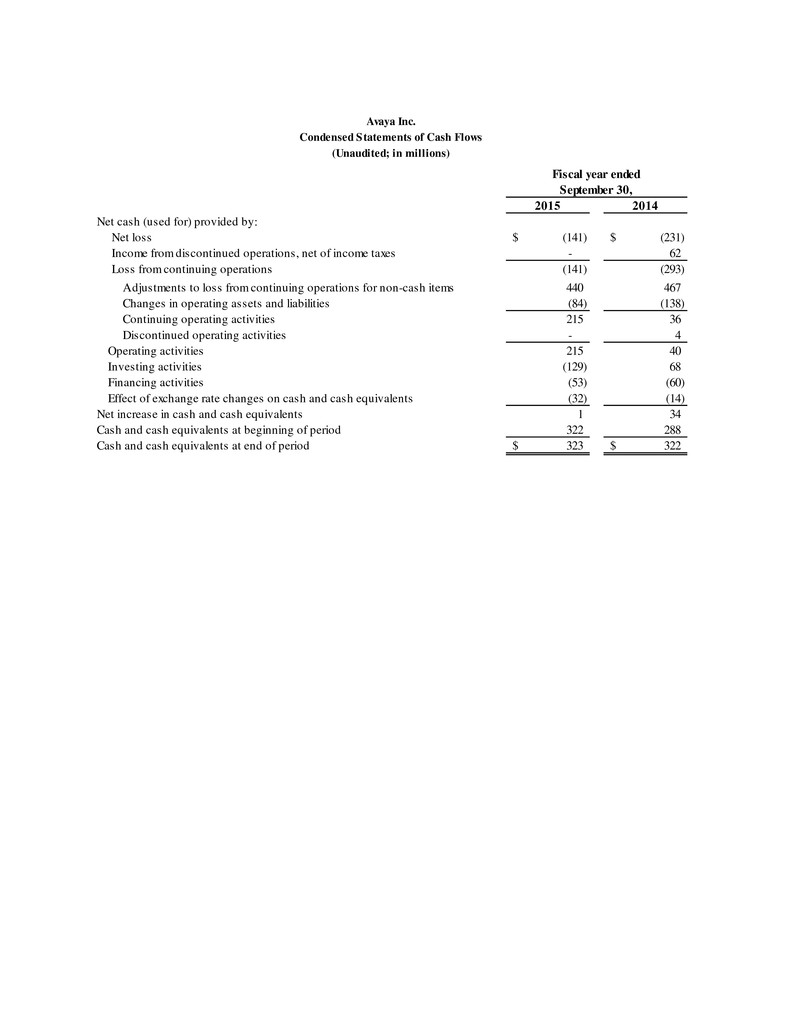
2015 2014 Net cash (used for) provided by: Net lossNet loss (141)$ (231)$ Income from discontinued operations, net of income taxes - 62 Loss from continuing operations (141) (293) Adjustments to loss from continuing operations for non-cash items 440 467 Changes in operating assets and liabilities (84) (138) Continuing operating activities 215 36 Changes in operating assets and liabilitiesDiscontinued operating activities - 4 Operating activities 215 40 Investing activities (129) 68 Financing activities (53) (60) Effect of exchange rate changes on cash and cash equivalents (32) (14) Net increase in cash and cash equivalents 1 34 Cash and cash equivalents at beginning of period 322 288 Cash and cash equivalents at end of period 323$ 322$ Avaya Inc. Condensed Statements of Cash Flows (Unaudited; in millions) Fiscal year ended September 30,
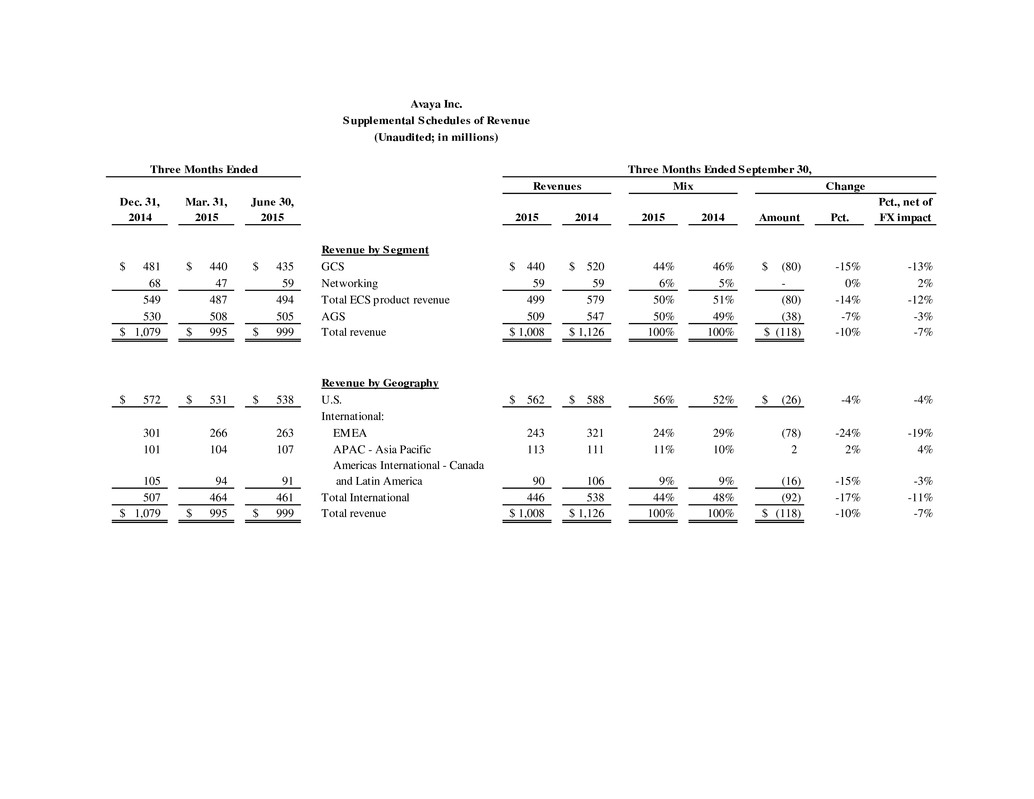
Avaya Inc. Supplemental Schedules of Revenue (Unaudited; in millions) Dec. 31, 2014 Mar. 31, 2015 June 30, 2015 2015 2014 2015 2014 Amount Pct. Pct., net of FX impact Revenue by Segment 481$ 440$ 435$ GCS 440$ 520$ 44% 46% (80)$ -15% -13% 68 47 59 Networking 59 59 6% 5% - 0% 2% 549 487 494 Total ECS product revenue 499 579 50% 51% (80) -14% -12% 530 508 505 AGS 509 547 50% 49% (38) -7% -3% 1,079$ 995$ 999$ Total revenue 1,008$ 1,126$ 100% 100% (118)$ -10% -7% Revenue by Geography 572$ 531$ 538$ U.S. 562$ 588$ 56% 52% (26)$ -4% -4% International: 301 266 263 EMEA 243 321 24% 29% (78) -24% -19% 101 104 107 APAC - Asia Pacific 113 111 11% 10% 2 2% 4% 105 94 91 90 106 9% 9% (16) -15% -3% 507 464 461 Total International 446 538 44% 48% (92) -17% -11% 1,079$ 995$ 999$ Total revenue 1,008$ 1,126$ 100% 100% (118)$ -10% -7% Three Months Ended Mix Americas International - Canada and Latin America Revenues Change Three Months Ended September 30,
Use of non-GAAP (Adjusted) Financial Measures The information furnished in this release includes non-GAAP financial measures that differ from measures calculated in accordance with generally accepted accounting principles in the United States (GAAP), including adjusted EBITDA, non-GAAP gross margin as a percentage of revenue, and non-GAAP operating income. EBITDA is defined as net income (loss) before income taxes, interest expense, interest income and depreciation and amortization and excludes the results of discontinued operations for all periods presented. Adjusted EBITDA is EBITDA further adjusted to exclude certain charges and other adjustments as described in our SEC filings. We believe that including supplementary information concerning Adjusted EBITDA is appropriate because it serves as a basis for determining management and employee compensation. In addition, we believe Adjusted EBITDA provides more comparability between our historical results and results that reflect purchase accounting and our current capital structure. Accordingly, Adjusted EBITDA measures our financial performance based on operational factors that management can impact in the short-term, namely the Company’s pricing strategies, volume, costs and expenses of the organization. Adjusted EBITDA has limitations as an analytical tool. Adjusted EBITDA does not represent net income (loss) or cash flow from operations as those terms are defined by GAAP and does not necessarily indicate whether cash flows will be sufficient to fund cash needs. While adjusted EBITDA and similar measures are frequently used as measures of operations and the ability to meet debt service requirements, these terms are not necessarily comparable to other similarly titled captions of other companies due to the potential inconsistencies in the method of calculation. Adjusted EBITDA does not reflect the impact of earnings or charges resulting from matters that we consider not to be indicative of our ongoing operations. In particular, our formulation of Adjusted EBITDA allows the addition of certain non-cash charges that are deducted in calculating net income (loss), restructuring charges, certain fees payable to our private equity sponsors and other specific cash costs and expenses and that portion of our pension costs, other post-employment benefits costs, and non-retirement post-employment benefits costs representing the amortization of pension service costs and actuarial gain or loss associated with these employment benefits as set forth in the reconciliation of GAAP to non-GAAP numbers shown below. However, these are expenses that may recur, may vary and are difficult to predict. Non-GAAP gross margin excludes the amortization of acquired technology intangible assets, share based compensation, impairment of long lived assets and purchase accounting adjustments. We have included non-GAAP gross margin because we believe it provides additional useful information to investors regarding our operations by excluding those charges that management does not believe are reflective of the Company’s ongoing operating results when assessing the performance of the business. Non-GAAP operating income excludes the amortization of technology intangible assets, restructuring and impairment charges, acquisition and integration related costs, share based compensation, impairment of long lived assets and purchase accounting adjustments. We have included non-GAAP operating income because we believe it provides additional useful information to investors regarding our operations by excluding those charges that management does not believe are reflective of the company’s ongoing operating results when assessing the performance of the business. These non-GAAP measures are not based on any comprehensive set of accounting rules or principles and have limitations as analytical tools in that they do not reflect all of the amounts associated with Avaya’s results of operations as determined in accordance with GAAP. As such,
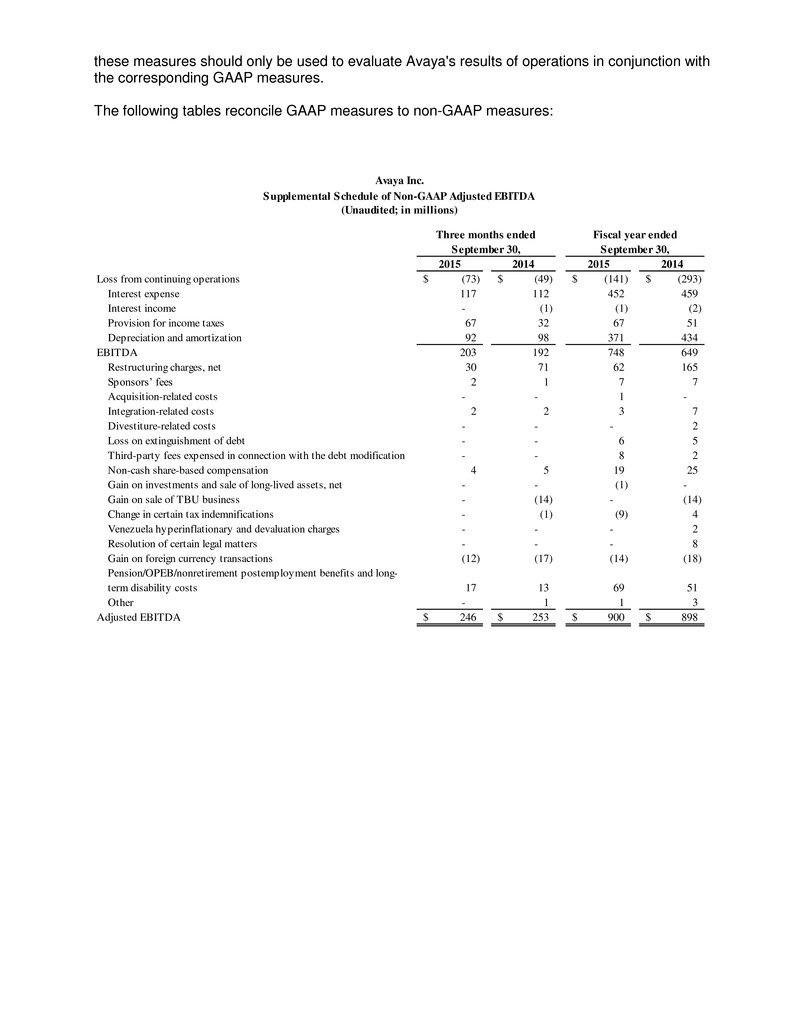
these measures should only be used to evaluate Avaya's results of operations in conjunction with the corresponding GAAP measures. The following tables reconcile GAAP measures to non-GAAP measures: 2015 2014 2015 2014 Loss from continuing operations (73)$ (49)$ (141)$ (293)$ Interest expense 117 112 452 459 Interest income - (1) (1) (2) Provision for income taxes 67 32 67 51 Depreciation and amortization 92 98 371 434 203 192 748 649 Restructuring charges, net 30 71 62 165 Sponsors’ fees 2 1 7 7 Acquisition-related costs - - 1 - Integration-related costs 2 2 3 7 Divestiture-related costs - - - 2 Loss on extinguishment of debt - - 6 5 Third-party fees expensed in connection with the debt modification - - 8 2 Non-cash share-based compensation 4 5 19 25 Gain on investments and sale of long-lived assets, net - - (1) - Gain on sale of TBU business - (14) - (14) Change in certain tax indemnifications - (1) (9) 4 Venezuela hyperinflationary and devaluation charges - - - 2 Resolution of certain legal matters - - - 8 Gain on foreign currency transactions (12) (17) (14) (18) Pension/OPEB/nonretirement postemployment benefits and long- term disability costs 17 13 69 51 Other - 1 1 3 Adjusted EBITDA 246$ 253$ 900$ 898$ EBITDA Three months ended September 30, Avaya Inc. Supplemental Schedule of Non-GAAP Adjusted EBITDA (Unaudited; in millions) Fiscal year ended September 30,
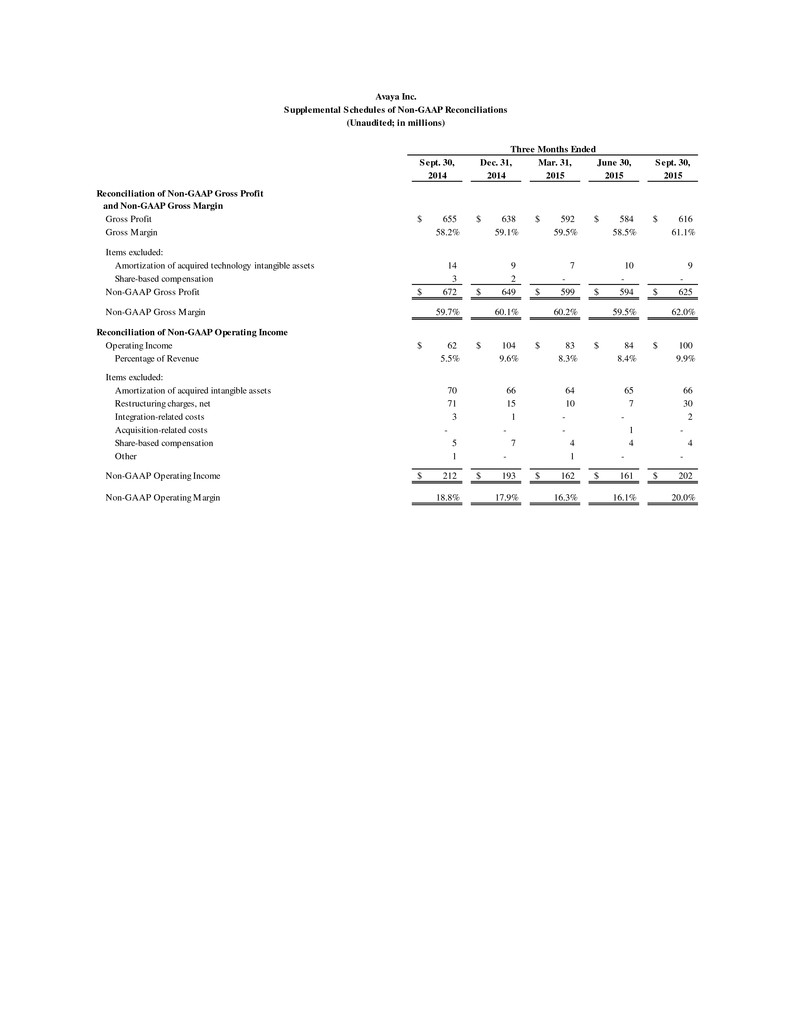
Sept. 30, Dec. 31, Mar. 31, June 30, Sept. 30, 2014 2014 2015 2015 2015 Gross Profit 655$ 638$ 592$ 584$ 616$ Gross Margin 58.2% 59.1% 59.5% 58.5% 61.1% Items excluded: Amortization of acquired technology intangible assets 14 9 7 10 9 Share-based compensation 3 2 - - - Non-GAAP Gross Profit 672$ 649$ 599$ 594$ 625$ Non-GAAP Gross Margin 59.7% 60.1% 60.2% 59.5% 62.0% Reconciliation of Non-GAAP Operating Income Operating Income 62$ 104$ 83$ 84$ 100$ Percentage of Revenue 5.5% 9.6% 8.3% 8.4% 9.9% Items excluded: Amortization of acquired intangible assets 70 66 64 65 66 Restructuring charges, net 71 15 10 7 30 Integration-related costs 3 1 - - 2 Acquisition-related costs - - - 1 - Share-based compensation 5 7 4 4 4 Other 1 - 1 - - Non-GAAP Operating Income 212$ 193$ 162$ 161$ 202$ Non-GAAP Operating Margin 18.8% 17.9% 16.3% 16.1% 20.0% Avaya Inc. Supplemental Schedules of Non-GAAP Reconciliations (Unaudited; in millions) Three Months Ended Reconciliation of Non-GAAP Gross Profit and Non-GAAP Gross Margin
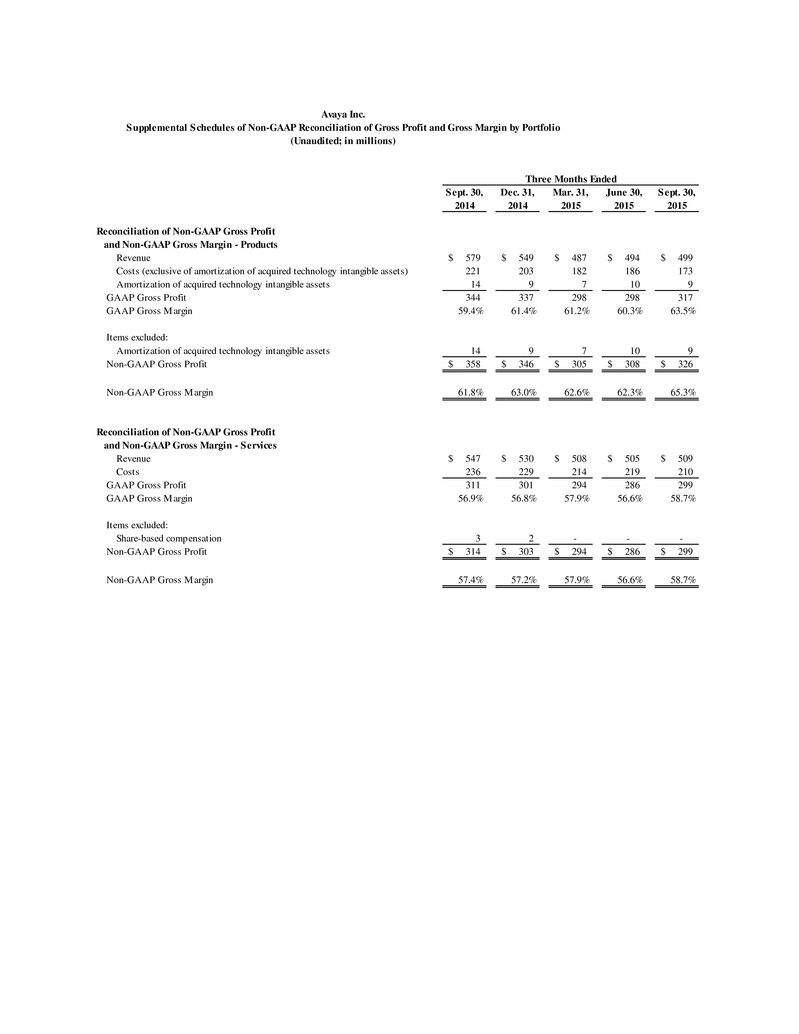
Sept. 30, Dec. 31, Mar. 31, June 30, Sept. 30, 2014 2014 2015 2015 2015 Revenue 579$ 549$ 487$ 494$ 499$ Costs (exclusive of amortization of technology intangible assets)ts (exclusive of amortization of acquired technology intangible assets) 221 203 182 186 173 Amortization of technology intangible assetsortiz tion of acquired technology intangible a sets 14 9 7 10 9 GAAP Gross Profit 344 337 298 298 317 GAAP Gross Margin 59.4% 61.4% 61.2% 60.3% 63.5% Items excluded: Amortization of acquired technology intangible assets 14 9 7 10 9 Non-GAAP Gross Profit 358$ 346$ 305$ 308$ 326$ Non-GAAP Gross Margin 61.8% 63.0% 62.6% 62.3% 65.3% Revenue 547$ 530$ 508$ 505$ 509$ Costs 236 229 214 219 210 GAAP Gross Profit 311 301 294 286 299 GAAP Gross Margin 56.9% 56.8% 57.9% 56.6% 58.7% Items excluded: Share-based compensation 3 2 - - - Non-GAAP Gross Profit 314$ 303$ 294$ 286$ 299$ Non-GAAP Gross Margin 57.4% 57.2% 57.9% 56.6% 58.7% Avaya Inc. (Unaudited; in millions) Reconciliation of Non-GAAP Gross Profit and Non-GAAP Gross Margin - Services Reconciliation of Non-GAAP Gross Profit and Non-GAAP Gross Margin - Products Supplemental Schedules of Non-GAAP Reconciliation of Gross Profit and Gross Margin by Portfolio Three Months Ended
