Attached files
| file | filename |
|---|---|
| 8-K - FORM 8-K - SHORE BANCSHARES INC | v424185_8k.htm |
Exhibit 99.1
Sandler O’Neill & Partners, L.P. East Coast Financial Services Conference November 11, 2015
Safe Harbor Regarding Forward - Looking Statements This presentation may contain “forward - looking statements” within the meaning of the Private Securities Litigation Reform Act of 1995 regarding Shore Bancshares, Inc. (the “Company”). Forward - looking statements often include the words “believes,” “expects,” “anticipates,” “estimates,” “forecasts,” “intends,” “plans,” “targets,” “potentially,” “probably,” “projects,” “outlook” or s imi lar expressions or future or conditional verbs such as “may,” “will,” “should,” “would” and “could.” These forward - looking statements are subjec t to known and unknown risks, uncertainties and other factors that could cause the actual results to differ materially from the fo rwa rd - looking statements, including, without limitation, the following: the strength of the United States economy in general and the streng th of the local economies in which the Company conducts operations; fluctuations in interest rates and in real estate values; monetary and fiscal policies of the Board of Governors of the Federal Reserve System and the U.S. Government and other governmental initiatives a ffe cting the financial services industry; the risks of lending and investing activities, including changes in the level and direction of loan delinquencies and write - offs and changes in estimates of the adequacy of the allowance for loan losses; the Company’s ability to access cost - effective funding; the timely development of and acceptance of the Bank’s new products and services and the perceived overa ll value of these products and services by users, including the features, pricing and quality compared to competitors’ products and services; expected cost savings, synergies and other benefits from the Company’s merger and acquisition activities might not be realize d w ithin the anticipated time frames or at all, and costs or difficulties relating to integration matters, including but not limited to cu sto mer and employee retention, might be greater than expected; fluctuations in real estate values and both residential and commercial re al estate market conditions; demand for loans and deposits in the Company’s market areas; legislative or regulatory changes that advers ely affect the Company’s business; results of examinations of the Company and its subsidiaries by their regulators, including the possib ili ty that such regulators may, among other things, take regulatory enforcement action or require the Company’s bank subsidiaries to inc rea se their reserves for loan losses or to write - down assets; the impact of technological changes; and the Company’s success at managing the risks involved in the foregoing. Any forward - looking statements are based upon management’s beliefs and assumptions at the time they a re made. The Company undertakes no obligation to publicly update or revise any forward - looking statements or to update the reasons why ac tual results could differ from those contained in such statements, whether as a result of new information, future events or otherw ise . In light of these risks, uncertainties and assumptions, the forward - looking statements discussed might not occur, and you should not put undue reliance on any forward - looking statements. Important Statements 2
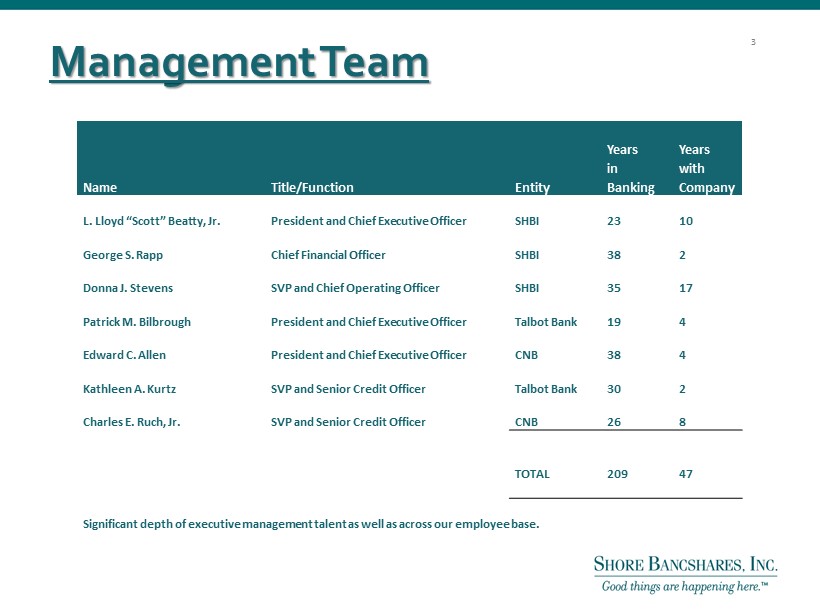
Management Team Name Title/Function Entity Years in Banking Years with Company L . Lloyd “Scott” Beatty, Jr. President and Chief Executive Officer SHBI 23 10 George S. Rapp Chief Financial Officer SHBI 38 2 Donna J. Stevens SVP and Chief Operating Officer SHBI 35 17 Patrick M. Bilbrough President and Chief Executive Officer Talbot Bank 19 4 Edward C. Allen President and Chief Executive Officer CNB 38 4 Kathleen A. Kurtz SVP and Senior Credit Officer Talbot Bank 30 2 Charles E. Ruch, Jr. SVP and Senior Credit Officer CNB 26 8 TOTAL 209 47 Significant depth of executive management talent as well as across our employee base. 3
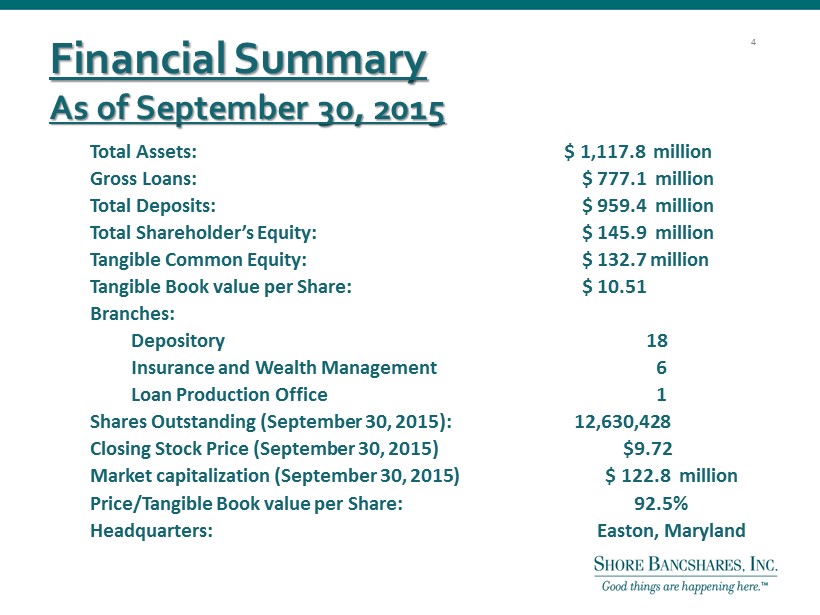
Financial Summary As of September 30, 2015 4 Total Assets: $ 1,117.8 million Gross Loans: $ 777.1 million Total Deposits: $ 959.4 million Total Shareholder’s Equity: $ 145.9 million Tangible Common Equity: $ 132.7 million Tangible Book value per Share: $ 10.51 Branches: Depository 18 Insurance and Wealth Management 6 Loan Production Office 1 Shares Outstanding (September 30, 2015): 12,630,428 Closing Stock Price (September 30, 2015 ) $9.72 Market capitalization (September 30, 2015 ) $ 122.8 million Price/Tangible Book value per Share: 92.5% Headquarters: Easton, Maryland
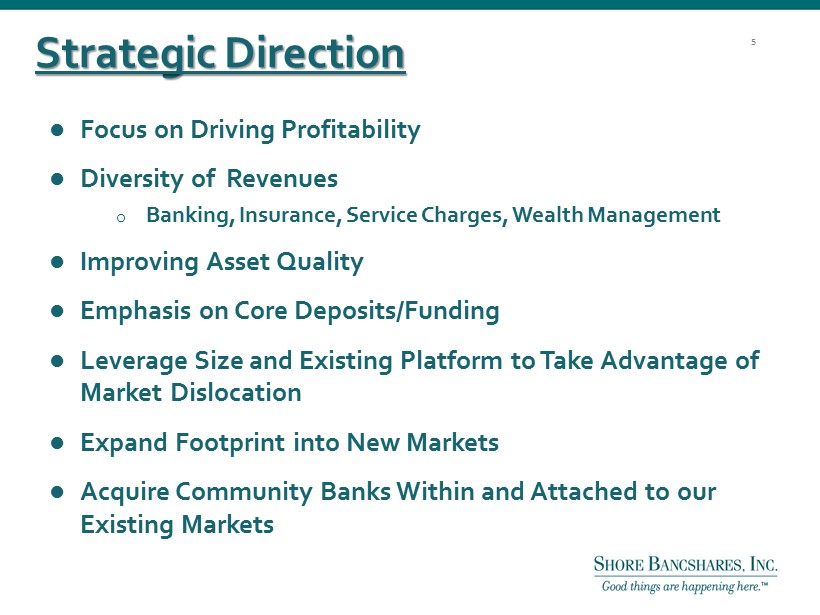
Strategic Direction 5 Focus on Driving Profitability Diversity of Revenues o Banking, Insurance, Service Charges, Wealth Management Improving Asset Quality Emphasis on Core Deposits/Funding Leverage Size and Existing Platform to Take Advantage of Market Dislocation Expand Footprint into New Markets Acquire Community Banks Within and Attached to our Existing Markets
Strategic Direction ● Shore Bancshares has the opportunity to dominate the Delmarva ● Currently dominant independent locally headquartered company in our footprint ● SHBI is striving to be the bank and employer of choice on the Delmarva 6
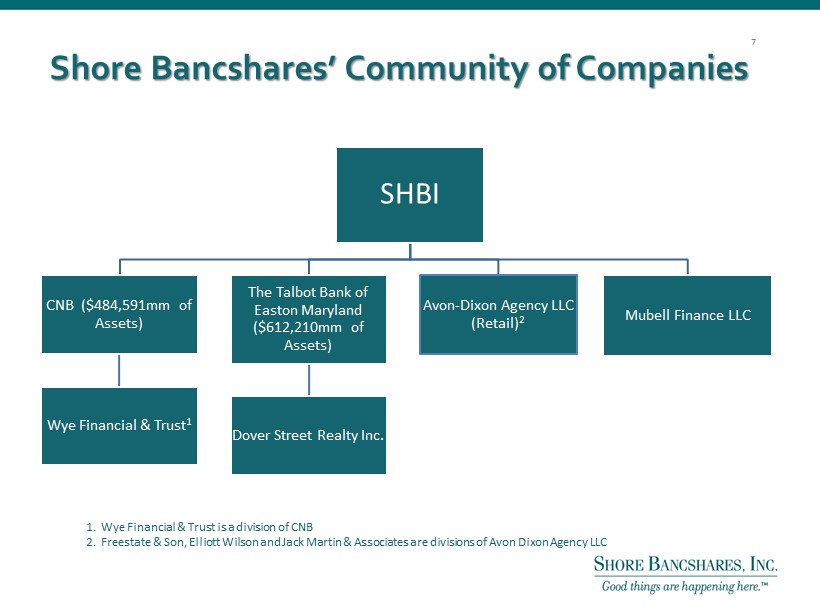
Shore Bancshares’ Community of Companies SHBI CNB ($484,591mm of Assets) Wye Financial & Trust 1 The Talbot Bank of Easton Maryland ($612,210mm of Assets) Dover Street Realty Inc. Avon - Dixon Agency LLC (Retail) 2 Mubell Finance LLC 1. Wye Financial & Trust is a division of CNB 2. Freestate & Son, Elliott Wilson and Jack Martin & Associates are divisions of Avon Dixon Agency LLC 7
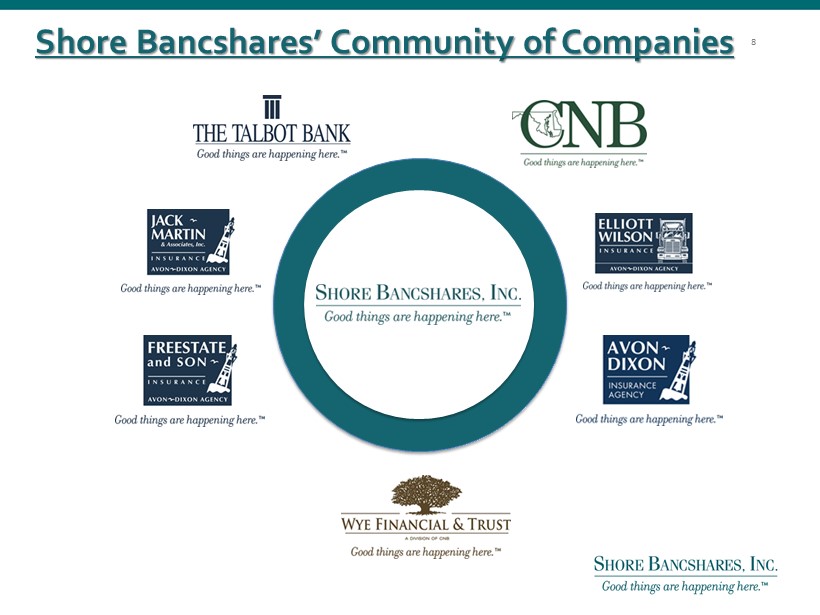
Shore Bancshares’ Community of Companies 8
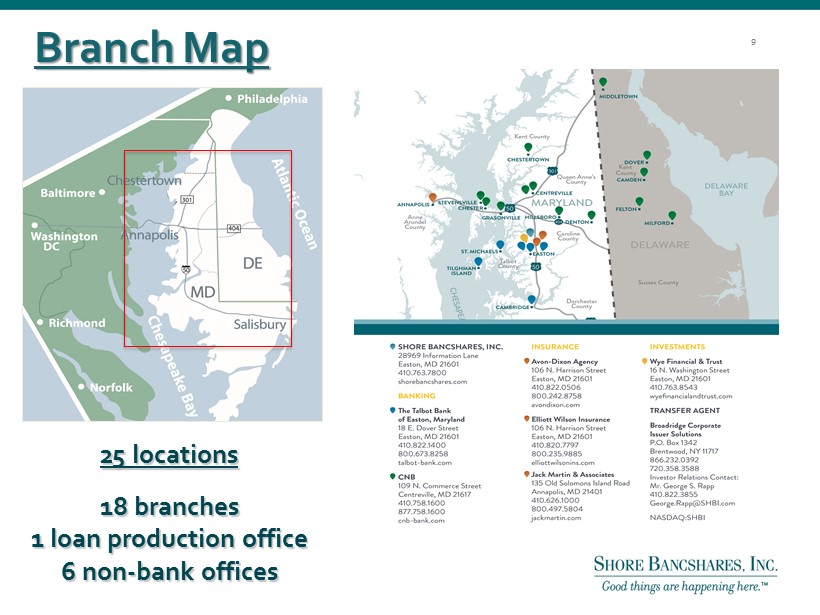
25 locations 18 branches 1 loan production office 6 non - bank offices 9 Branch Map
General Impact of Consolidation 10 Unified policies and procedures; eliminate differences and streamline approval process Streamlined decisioning and meetings Specialist versus generalist
Departments Currently Consolidated 11 Deposit Operations Finance IT Marketing Human Resources Loan Operations
Departments to be Consolidated 12 Retail Sales/Branch Administration Administrative Sales Manager Branch Operations and Security 18 branch locations
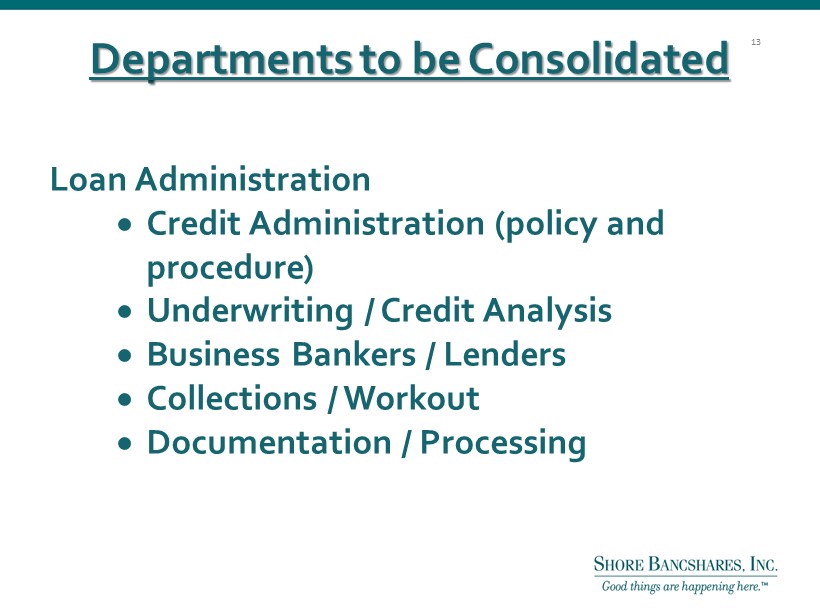
Departments to be Consolidated 13 Loan Administration Credit Administration (policy and procedure) Underwriting / Credit Analysis Business Bankers / Lenders Collections / Workout Documentation / Processing
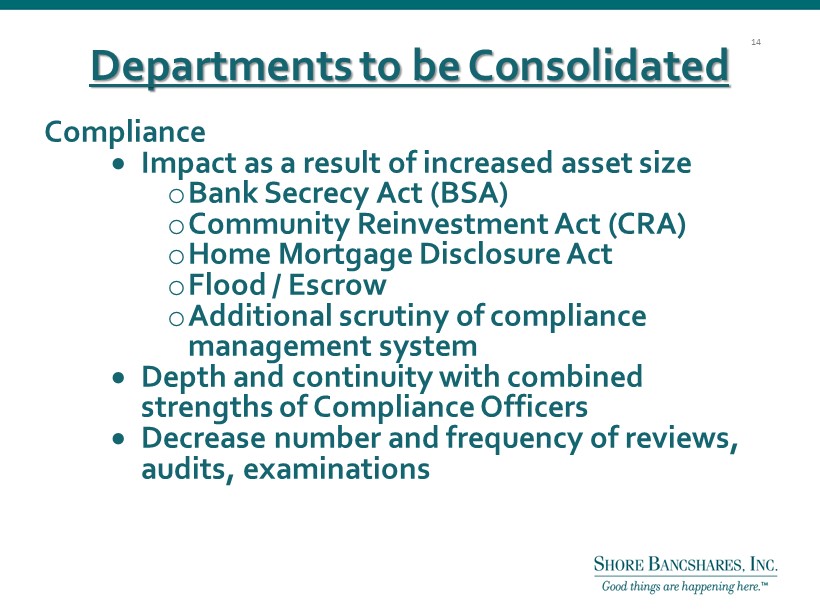
Departments to be Consolidated 14 Compliance Impact as a result of increased asset size o Bank Secrecy Act (BSA) o Community Reinvestment Act (CRA) o Home Mortgage Disclosure Act o Flood / Escrow o Additional scrutiny of compliance management system Depth and continuity with combined strengths of Compliance Officers Decrease number and frequency of reviews, audits, examinations
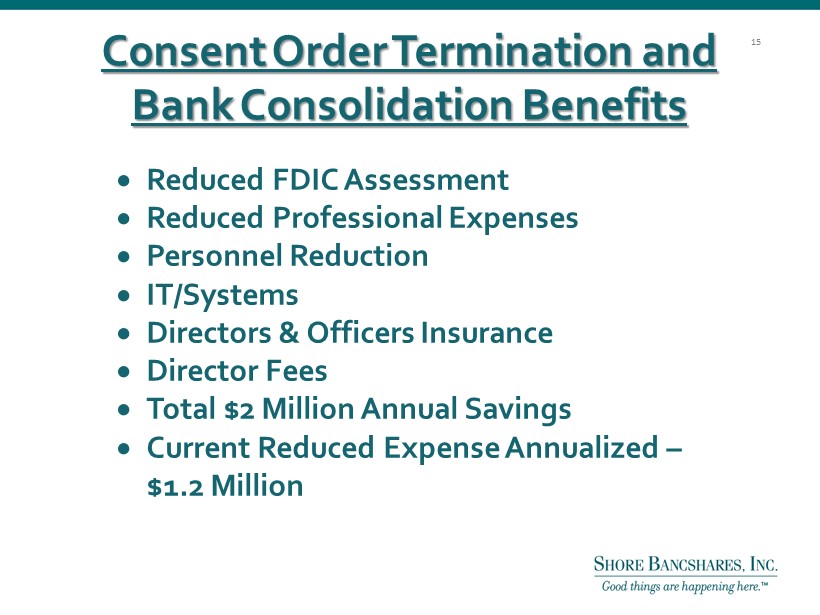
Consent Order Termination and Bank Consolidation Benefits 15 Reduced FDIC Assessment Reduced Professional Expenses Personnel Reduction IT/Systems Directors & Officers Insurance Director Fees Total $2 Million Annual Savings Current Reduced Expense Annualized – $1.2 Million
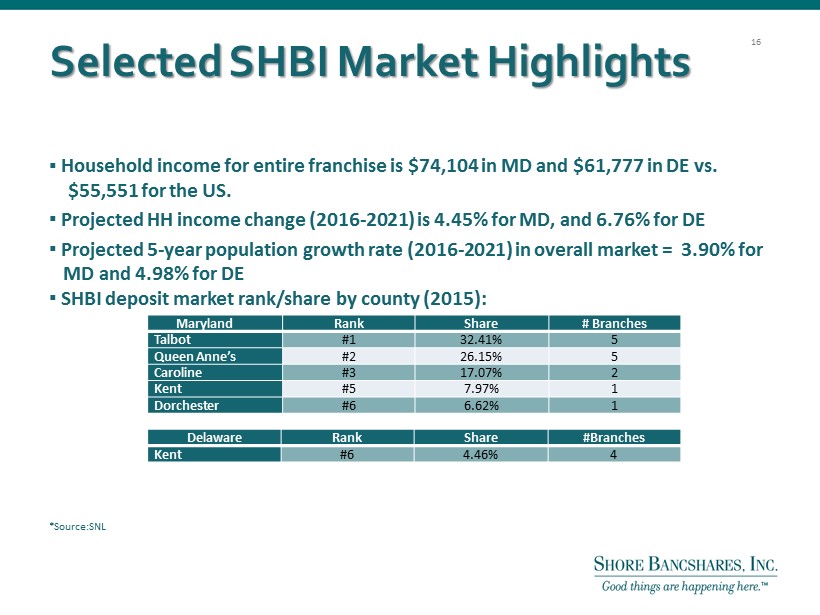
Selected SHBI Market Highlights ▪ Household income for entire franchise is $ 74,104 in MD and $ 61,777 in DE vs. $55,551 for the US. ▪ Projected HH income change ( 2016 - 2021) is 4.45% for MD, and 6.76% for DE ▪ Projected 5 - year population growth rate ( 2016 - 2021) in overall market = 3.90% for MD and 4.98% for DE ▪ SHBI deposit market rank/share by county (2015): * Source:SNL Maryland Rank Share # Branches Talbot #1 32.41% 5 Queen Anne’s #2 26.15% 5 Caroline #3 17.07% 2 Kent #5 7.97% 1 Dorchester #6 6.62% 1 Delaware Rank Share #Branches Kent #6 4.46% 4 16
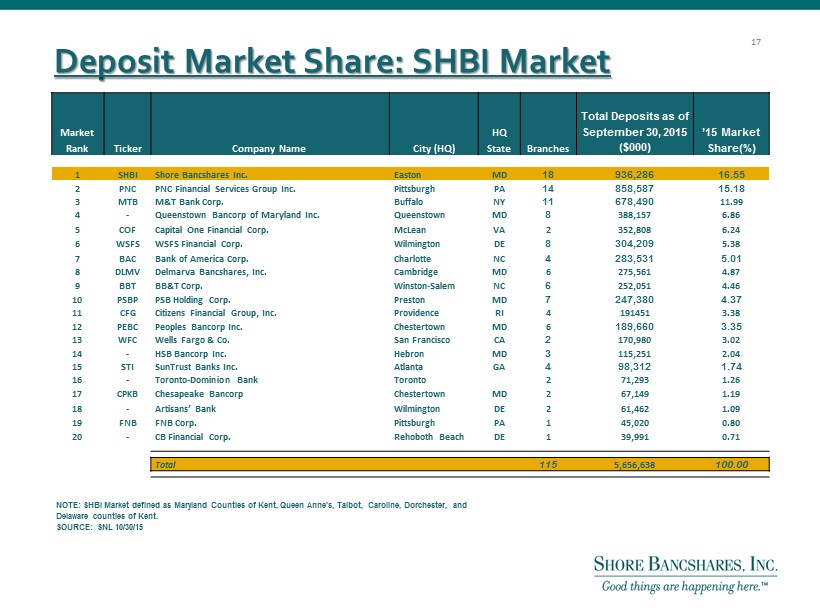
Deposit Market Share: SHBI Market Market Rank Ticker Company Name City (HQ) HQ State Branches Total Deposits as of September 30, 2015 ($000) ’15 Market Share(%) 1 SHBI Shore Bancshares Inc. Easton MD 18 936,286 16.55 2 PNC PNC Financial Services Group Inc. Pittsburgh PA 14 858,587 15.18 3 MTB M&T Bank Corp. Buffalo NY 11 678,490 11.99 4 - Queenstown Bancorp of Maryland Inc. Queenstown MD 8 388,157 6.86 5 COF Capital One Financial Corp. McLean VA 2 352,808 6.24 6 WSFS WSFS Financial Corp. Wilmington DE 8 304,209 5.38 7 BAC Bank of America Corp. Charlotte NC 4 283,531 5.01 8 DLMV Delmarva Bancshares, Inc. Cambridge MD 6 275,561 4.87 9 BBT BB&T Corp. Winston - Salem NC 6 252,051 4.46 10 PSBP PSB Holding Corp. Preston MD 7 247,380 4.37 11 CFG Citizens Financial Group, Inc. Providence RI 4 191451 3.38 12 PEBC Peoples Bancorp Inc. Chestertown MD 6 189,660 3.35 13 WFC Wells Fargo & Co. San Francisco CA 2 170,980 3.02 14 - HSB Bancorp Inc. Hebron MD 3 115,251 2.04 15 STI SunTrust Banks Inc. Atlanta GA 4 98,312 1.74 16 - Toronto - Dominion Bank Toronto 2 71,293 1.26 17 CPKB Chesapeake Bancorp Chestertown MD 2 67,149 1.19 18 - Artisans’ Bank Wilmington DE 2 61,462 1.09 19 FNB FNB Corp. Pittsburgh PA 1 45,020 0.80 20 - CB Financial Corp. Rehoboth Beach DE 1 39,991 0.71 Total 115 5,656,638 100.00 NOTE : SHBI Market defined as Maryland Counties of Kent, Queen Anne's, Talbot, Caroline, Dorchester, and Delaware counties of Kent. SOURCE : SNL 10/30/15 17
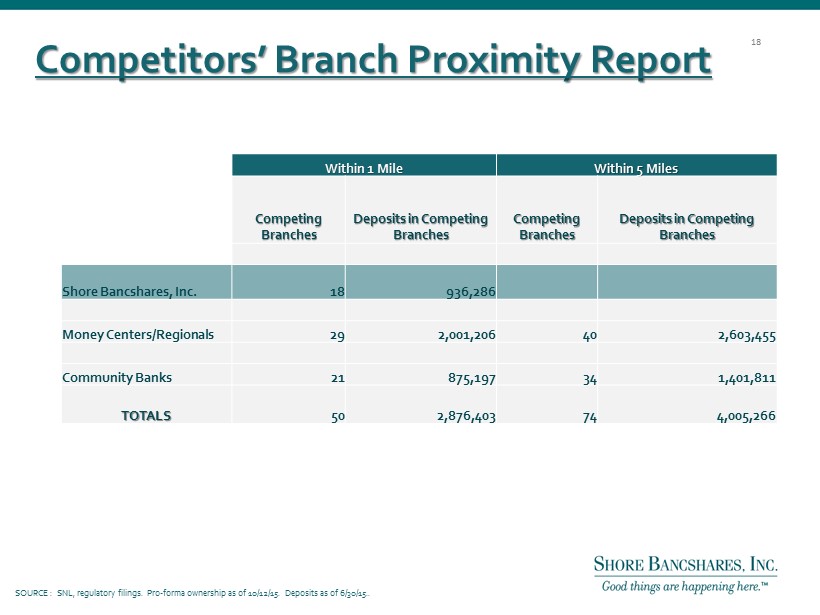
Competitors ’ Branch Proximity Report Within 1 Mile Within 5 Miles Competing Branches Deposits in Competing Branches Competing Branches Deposits in Competing Branches Shore Bancshares, Inc . 18 936,286 Money Centers/Regionals 29 2,001,206 40 2,603,455 Community Banks 21 875,197 34 1,401,811 TOTALS 50 2,876,403 74 4,005,266 SOURCE : SNL, regulatory filings. Pro - forma ownership as of 10/12/15. Deposits as of 6/30/15.. 18
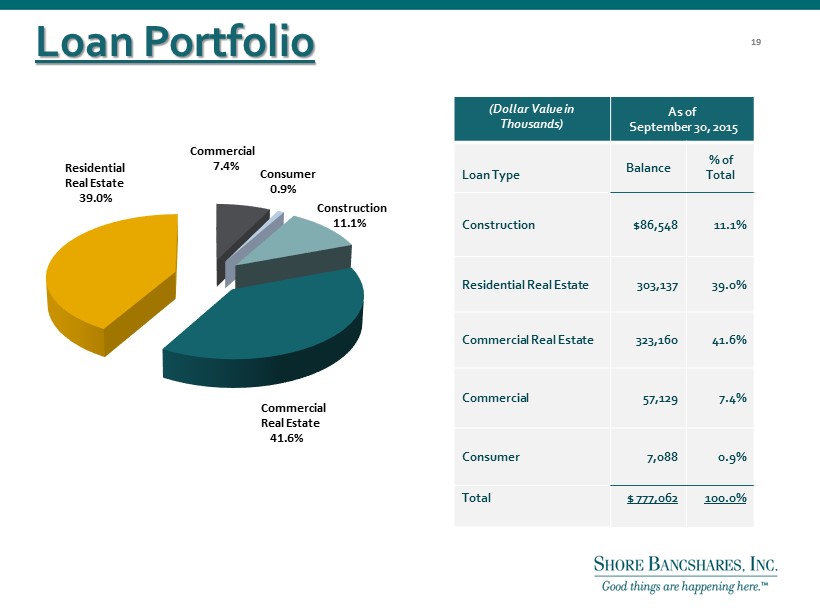
Loan Portfolio (Dollar Value in Thousands) As of September 30, 2015 Loan Type Balance % of Total Construction $86,548 11.1% Residential Real Estate 303,137 39.0% Commercial Real Estate 323,160 41.6% Commercial 57,129 7.4% Consumer 7,088 0.9% Total $ 777,062 100.0% 19 Residential Real Estate 39.0% Commercial 7.4% Consumer 0.9% Construction 11.1% Commercial Real Estate 41.6% 19
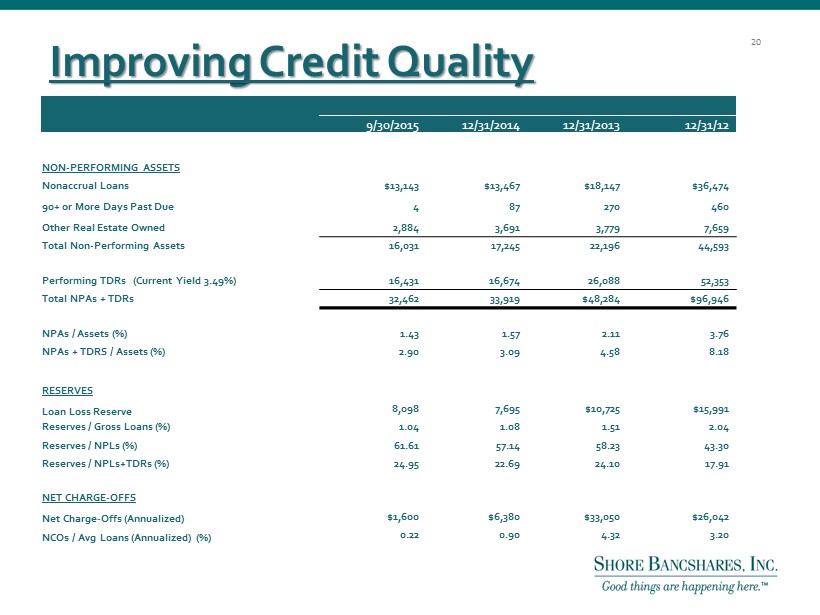
Improving Credit Quality 9/30/2015 12/31/2014 12/31/2013 12/31/12 NON - PERFORMING ASSETS Nonaccrual Loans $13,143 $13,467 $18,147 $36,474 90+ or More Days Past Due 4 87 270 460 Other Real Estate Owned 2,884 3,691 3,779 7,659 Total Non - Performing Assets 16,031 17,245 22,196 44,593 Performing TDRs (Current Yield 3.49%) 16,431 16,674 26,088 52,353 Total NPAs + TDRs 32,462 33,919 $48,284 $96,946 NPAs / Assets (%) 1.43 1.57 2.11 3.76 NPAs + TDRS / Assets (%) 2.90 3.09 4.58 8.18 RESERVES Loan Loss Reserve 8,098 7,695 $10,725 $15,991 Reserves / Gross Loans (%) 1.04 1.08 1.51 2.04 Reserves / NPLs (%) 61.61 57.14 58.23 43.30 Reserves / NPLs+TDRs (%) 24.95 22.69 24.10 17.91 NET CHARGE - OFFS Net Charge - Offs (Annualized) $1,600 $6,380 $33,050 $26,042 NCOs / Avg Loans (Annualized ) (%) 0.22 0.90 4.32 3.20 20
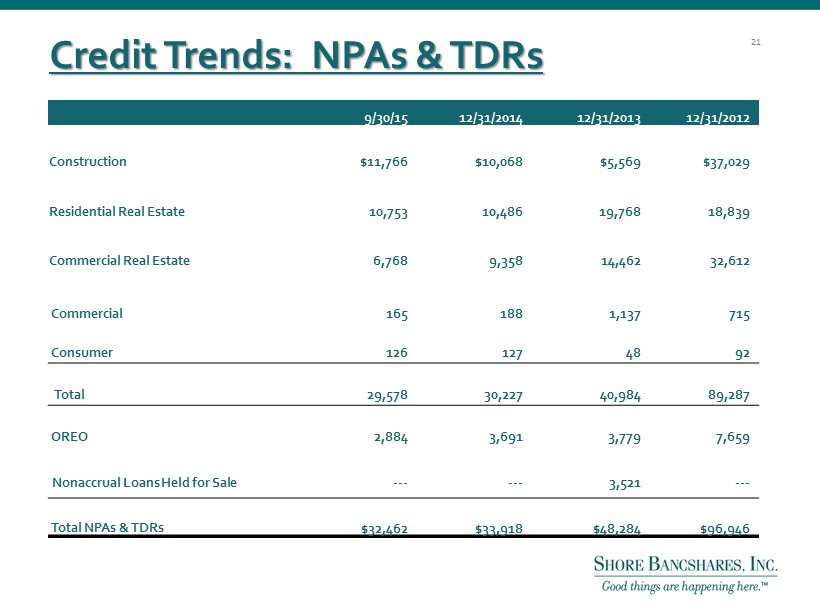
Credit Trends: NPAs & TDRs 9/30/15 12/31/2014 12/31/2013 12/31/2012 Construction $11,766 $10,068 $5,569 $37,029 Residential Real Estate 10,753 10,486 19,768 18,839 Commercial Real Estate 6,768 9,358 14,462 32,612 Commercial 165 188 1,137 715 Consumer 126 127 48 92 Total 29,578 30,227 40,984 89,287 OREO 2,884 3,691 3,779 7,659 Nonaccrual Loans Held for Sale --- --- 3,521 --- Total NPAs & TDRs $32,462 $33,918 $48,284 $96,946 21
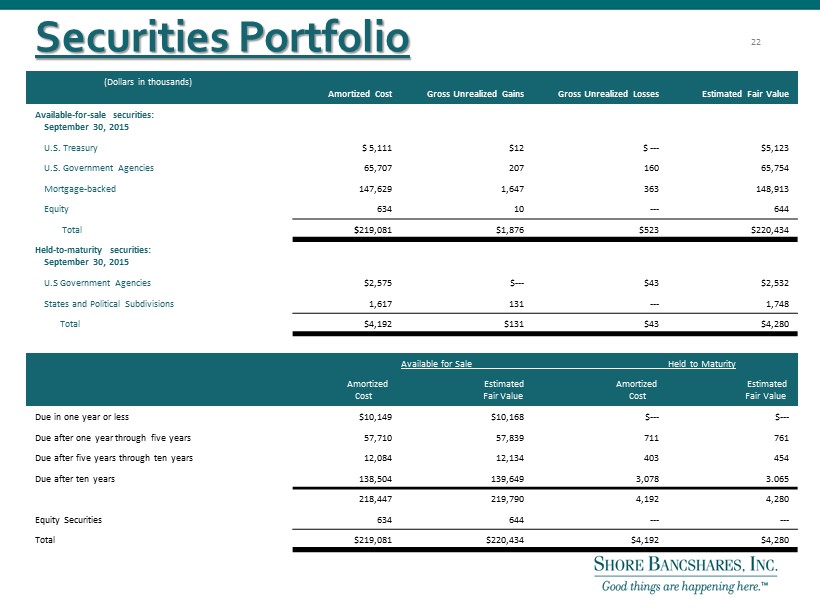
S ecurities Portfolio (Dollars in thousands) Amortized Cost G Gross Unrealized Gains G Gross Unrealized Losses E Estimated Fair Value Available - for - sale securities: September 30, 2015 U.S. Treasury $ 5,111 $12 $ --- $5,123 U.S. Government Agencies 65,707 207 160 65,754 Mortgage - backed 147,629 1,647 363 148,913 Equity 634 10 --- 644 Total $ 219,081 $1,876 $523 $220,434 Held - to - maturity securities: September 30, 2015 U.S Government Agencies $2,575 $ --- $43 $2,532 States and Political Subdivisions 1,617 131 --- 1,748 Total $4,192 $131 $43 $4,280 Available for Sale Held to Maturity Amortized Estimated Cost Fair Value Amortized Estimated Cost Fair Value Due in one year or less $10,149 $10,168 $ --- $ --- Due after one year through five years 57,710 57,839 711 761 Due after five years through ten years 12,084 12,134 403 454 Due after ten years 138,504 139,649 3,078 3.065 218,447 219,790 4,192 4,280 Equity Securities 634 644 --- --- Total $219,081 $220,434 $4,192 $4,280 22
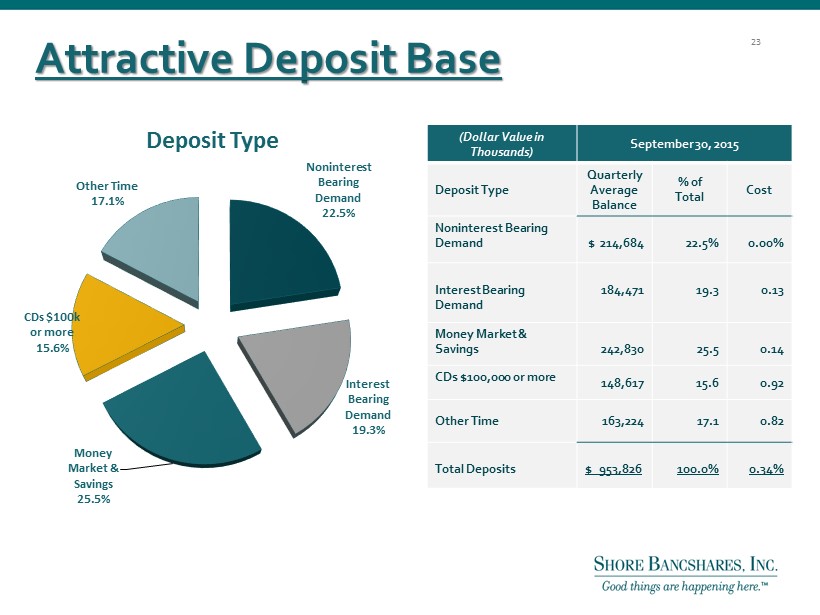
Attractive Deposit Base 23 (Dollar Value in Thousands) September 30, 2015 Deposit Type Quarterly Average Balance % of Total Cost Noninterest Bearing Demand $ 214,684 22.5% 0.00% Interest Bearing Demand 184,471 19.3 0.13 Money Market & Savings 242,830 25.5 0.14 CDs $100,000 or more 148,617 15.6 0.92 Other Time 163,224 17.1 0.82 Total Deposits $ 953,826 100.0% 0.34% Noninterest Bearing Demand 22.5% Interest Bearing Demand 19.3% Money Market & Savings 25.5% CDs $100k or more 15.6% Other Time 17.1% Deposit Type
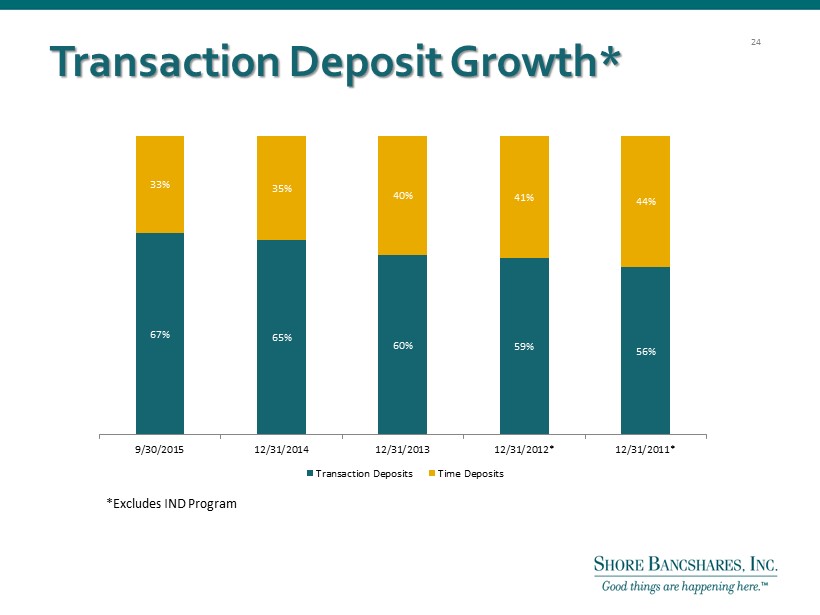
Transaction Deposit Growth* 67% 65% 60% 59% 56% 33% 35% 40% 41% 44% 9/30/2015 12/31/2014 12/31/2013 12/31/2012* 12/31/2011* Transaction Deposits Time Deposits *Excludes IND Program 24
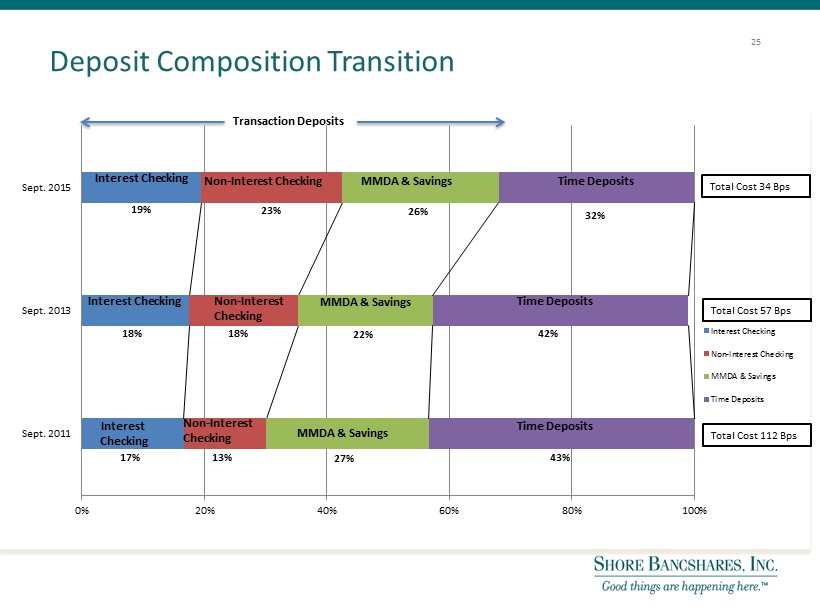
Deposit Composition Transition 17% 18% 19% 13% 18% 23% 27% 22% 26% 43% 42% 32% 0% 20% 40% 60% 80% 100% Sept. 2011 Sept. 2013 Sept. 2015 Interest Checking Non-Interest Checking MMDA & Savings Time Deposits Transaction Deposits Time Deposits Time Deposits Time Deposits MMDA & Savings MMDA & Savings MMDA & Savings Non - Interest Checking Non - Interest Checking Non - Interest Checking Interest Checking Interest Checking Interest Checking Total Cost 34 Bps Total Cost 57 Bps Total Cost 112 Bps 25
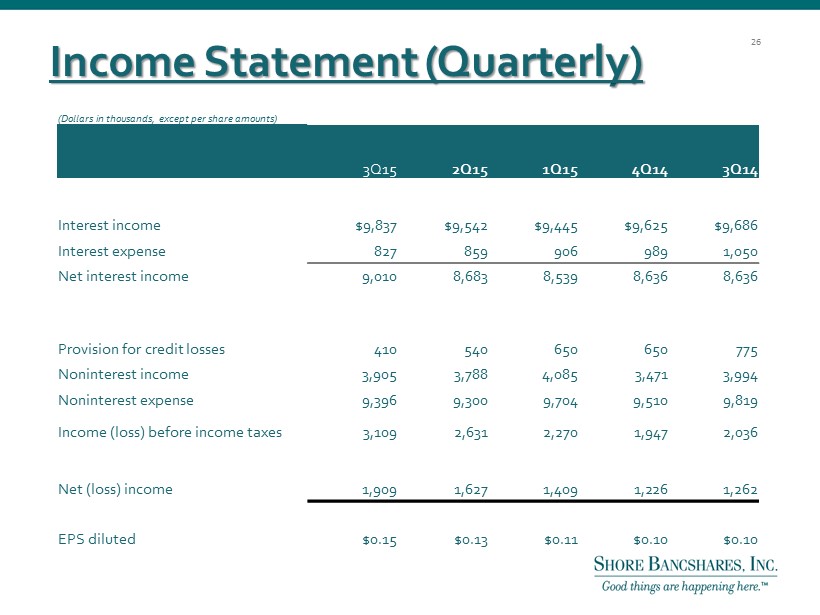
Income Statement (Quarterly) (Dollars in thousands, except per share amounts) 3Q15 2Q15 1Q15 4Q14 3Q14 Interest income $9,837 $9,542 $9,445 $9,625 $9,686 Interest expense 827 859 906 989 1,050 Net interest income 9,010 8,683 8,539 8,636 8,636 Provision for credit losses 410 540 650 650 775 Noninterest income 3,905 3,788 4,085 3,471 3,994 Noninterest expense 9,396 9,300 9,704 9,510 9,819 Income (loss) before income taxes 3,109 2,631 2,270 1,947 2,036 Net (loss) income 1,909 1,627 1,409 1,226 1,262 EPS diluted $0.15 $0.13 $0.11 $0.10 $0.10 26
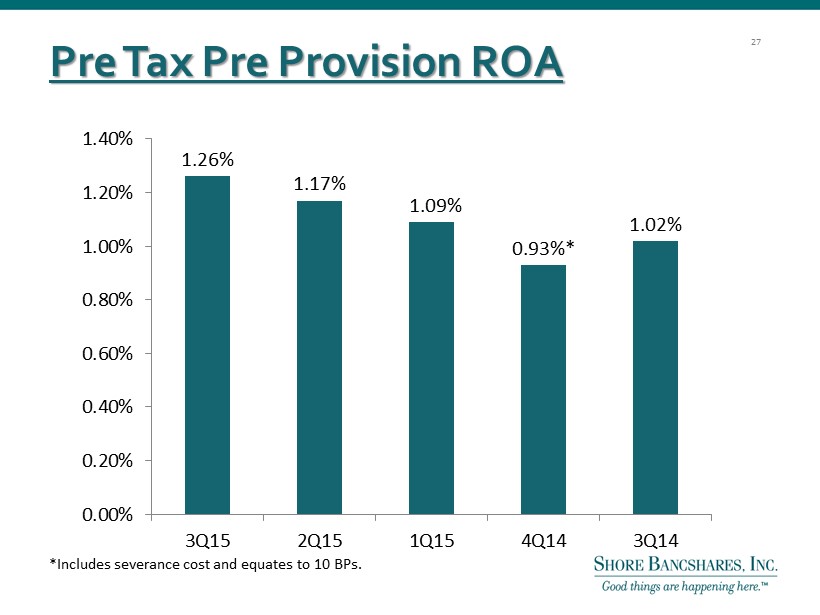
Pre Tax Pre Provision ROA 1.26% 1.17% 1.09% 0.93%* 1.02% 0.00% 0.20% 0.40% 0.60% 0.80% 1.00% 1.20% 1.40% 3Q15 2Q15 1Q15 4Q14 3Q14 *Includes severance cost and equates to 10 BPs. 27
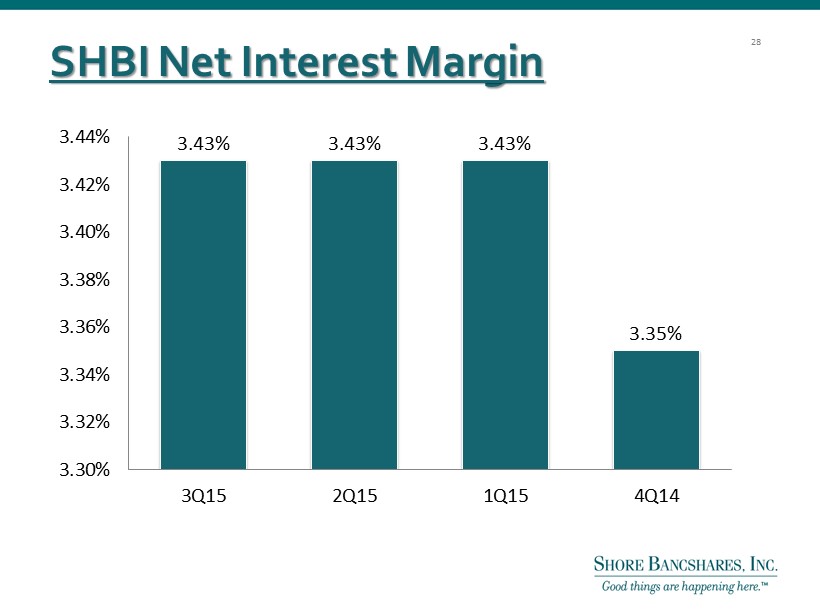
SHBI Net Interest Margin 28 3.43% 3.43% 3.43% 3.35% 3.30% 3.32% 3.34% 3.36% 3.38% 3.40% 3.42% 3.44% 3Q15 2Q15 1Q15 4Q14
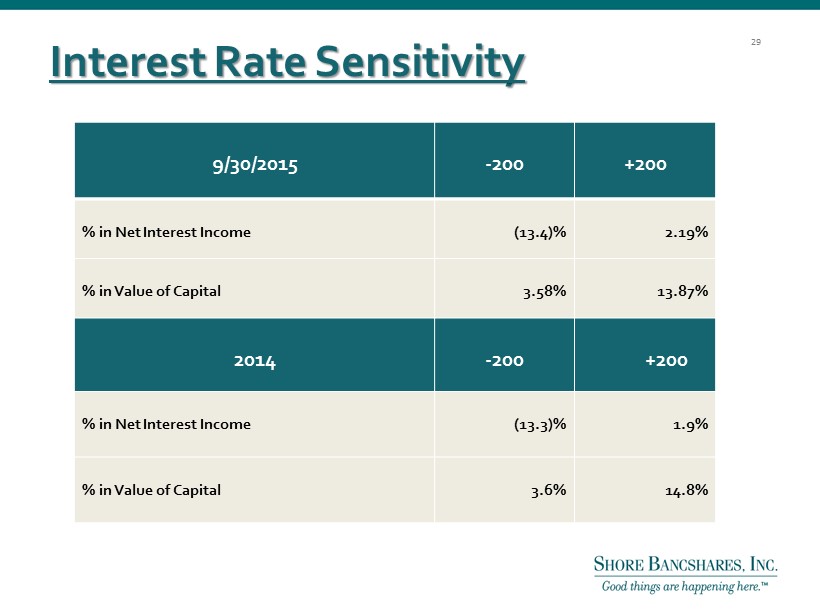
Interest Rate Sensitivity 29 9/30/2015 - 200 +200 % in Net Interest Income (13.4)% 2.19% % in Value of Capital 3.58% 13.87% 2014 - 200 +200 +200 % in Net Interest Income (13.3)% 1.9% % in Value of Capital 3.6% 14.8%
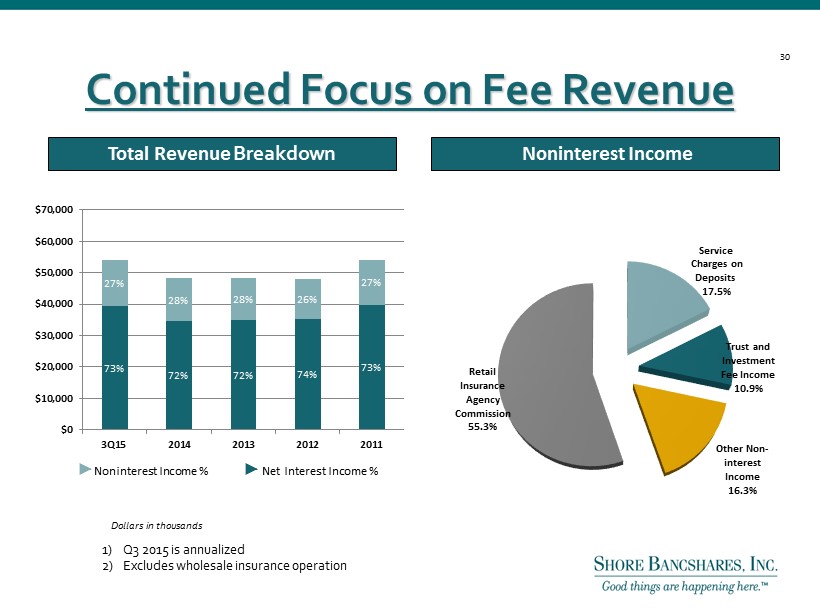
Continued Focus on Fee Revenue Total Revenue Breakdown Noninterest Income 1) Q3 2015 is annualized 2) Excludes wholesale insurance operation Dollars in thousands 24% 25% 26% 34% 32% 31% 73% 72% 72% 74% 73% 27% 28% 28% 26% 27% $0 $10,000 $20,000 $30,000 $40,000 $50,000 $60,000 $70,000 3Q15 2014 2013 2012 2011 30% 30% 31% ٿ Noninterest Income % ٿ Net Interest Income % Trust and Investment Fee Income 10.9% Other Non - interest Income 16.3% Retail Insurance Agency Commission 55.3% Service Charges on Deposits 17.5% 30
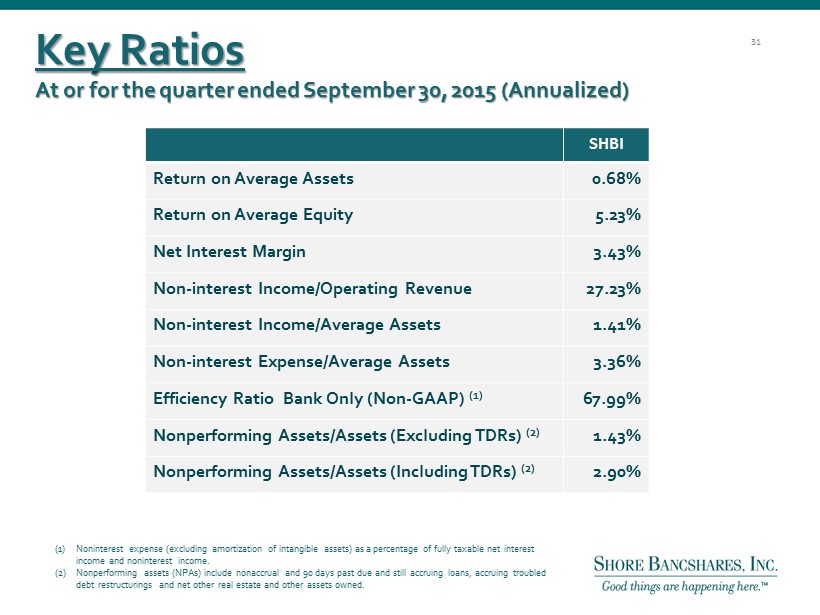
SHBI Return on Average Assets 0.68% Return on Average Equity 5.23% Net Interest Margin 3.43% Non - interest Income/Operating Revenue 27.23% Non - interest Income/Average Assets 1.41% Non - interest Expense/Average Assets 3.36% Efficiency Ratio Bank Only (Non - GAAP) (1) 67.99% Nonperforming Assets/Assets (Excluding TDRs) (2) 1.43% Nonperforming Assets/Assets (Including TDRs) (2) 2.90% Key Ratios At or for the quarter ended September 30, 2015 (Annualized) (1) Noninterest expense (excluding amortization of intangible assets) as a percentage of fully taxable net interest income and noninterest income. (2) Nonperforming assets (NPAs) include nonaccrual and 90 days past due and still accruing loans , accruing troubled debt restructurings and net other real estate and other assets owned . 31
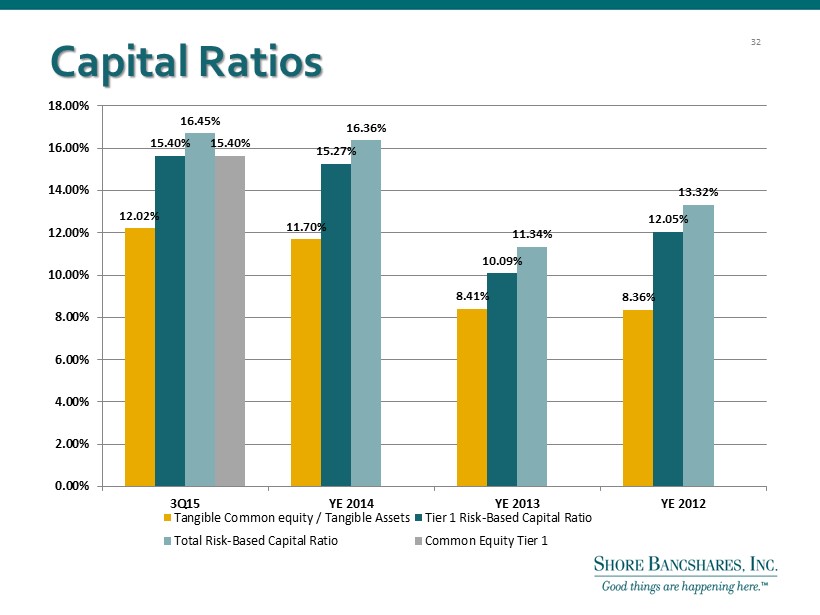
Capital Ratios 32 12.02% 11.70% 8.41% 8.36% 15.40% 15.27% 10.09% 12.05% 16.45% 16.36% 11.34% 13.32% 15.40% 0.00% 2.00% 4.00% 6.00% 8.00% 10.00% 12.00% 14.00% 16.00% 18.00% 3Q15 YE 2014 YE 2013 YE 2012 Tangible Common equity / Tangible Assets Tier 1 Risk-Based Capital Ratio Total Risk-Based Capital Ratio Common Equity Tier 1
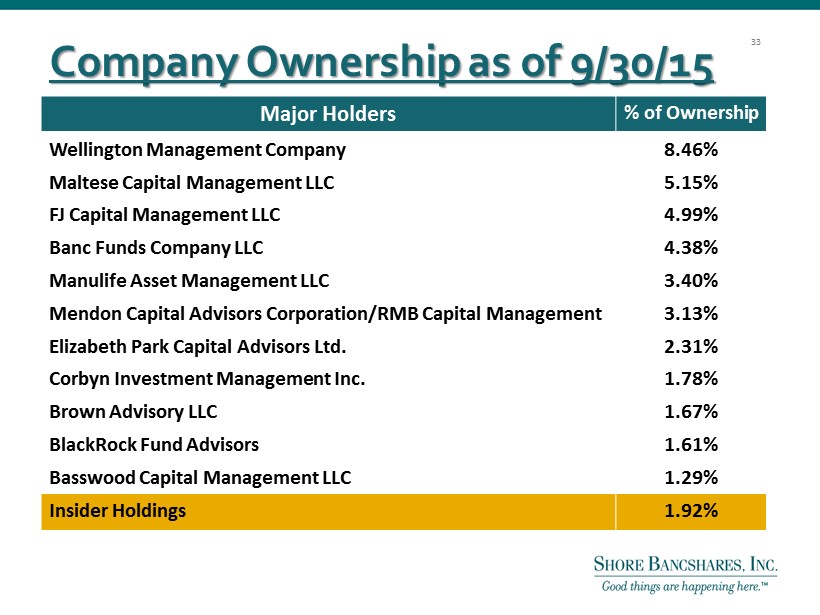
Company Ownership as of 9/30/15 Major Holders % of Ownership Wellington Management Company 8.46% Maltese Capital Management LLC 5.15% FJ Capital Management LLC 4.99% Banc Funds Company LLC 4.38% Manulife Asset Management LLC 3.40% Mendon Capital Advisors Corporation/RMB Capital Management 3.13% Elizabeth Park Capital Advisors Ltd. 2.31% Corbyn Investment Management Inc. 1.78% Brown Advisory LLC 1.67% BlackRock Fund Advisors 1.61% Basswood Capital Management LLC 1.29% Insider Holdings 1.92% 33
What Makes SHBI Unique? ● Diversity of Revenue Sources - - without Mortgage ● Strong Capital Position ● Stable Net Interest Margin ● Strong Control of Operating Expenses ● Dominant Independent Financial Services Company in all Markets within Footprint 34
35 ● We are a very different Company now x Improved credit process x Continuing to build organizational depth x Revamped strategic plan positions for growth x Focused on creating sustainable competitive advantages x Strengthened noninterest revenue sources x Forging a sales culture with new branding approach ● Current valuation is attractive 9/30/15 (trade at 92.5% of TBV)* Compelling Investment Considerations *Market data as of September 30, 2015.
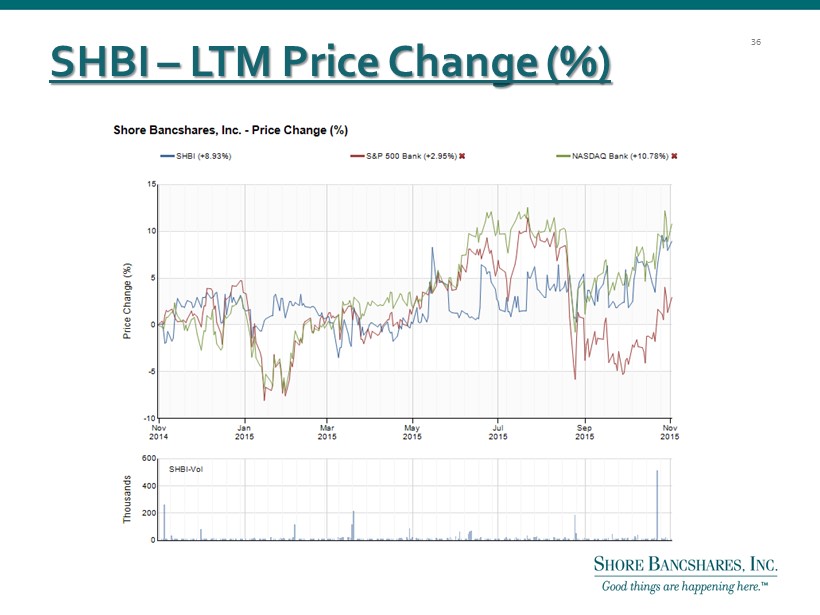
SHBI – LTM Price Change (%) 36
ADDENDUM 37
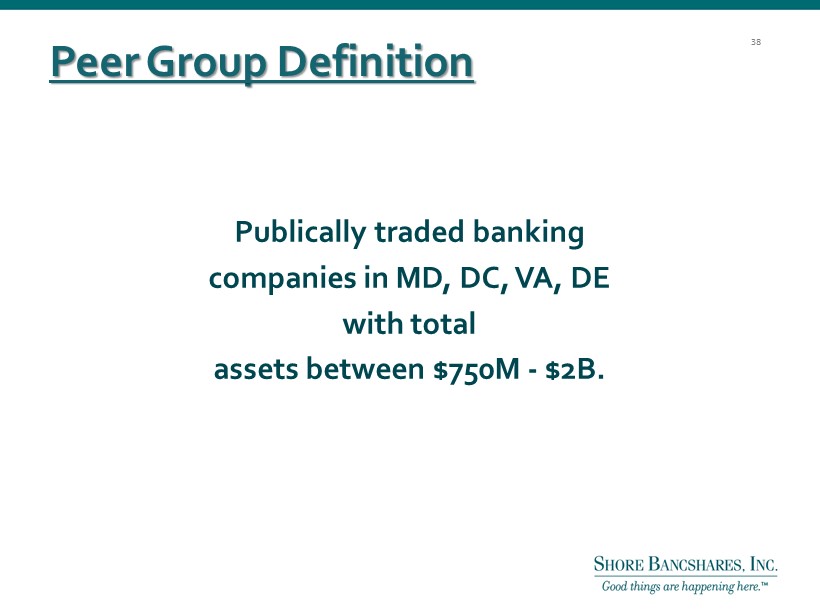
Peer Group Definition 38 Publically traded banking c ompanies in MD, DC, VA, DE w ith total a ssets between $750M - $2B.
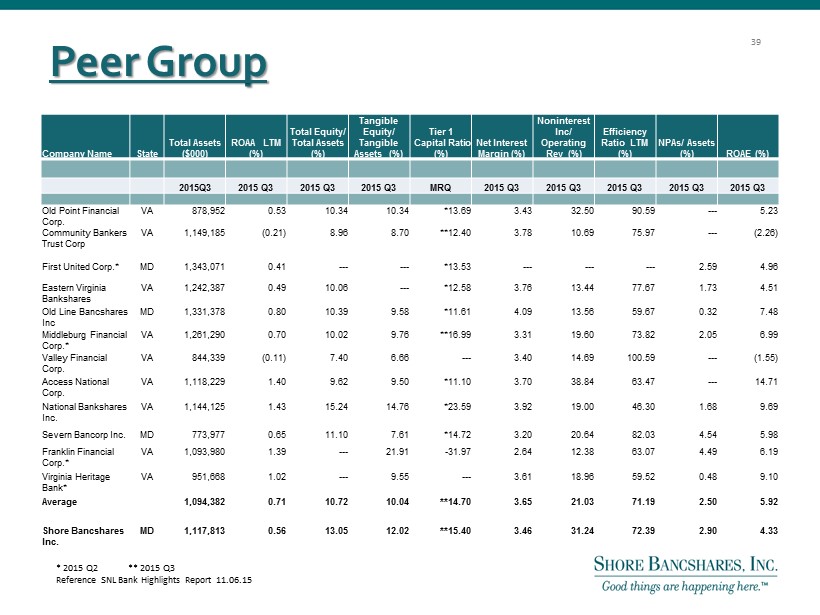
Peer Group 39 Company Name State Total Assets ($000) ROAA LTM (%) Total Equity/ Total Assets (%) Tangible Equity/ Tangible Assets (%) Tier 1 Capital Ratio (%) Net Interest Margin (%) Noninterest Inc/ Operating Rev (%) Efficiency Ratio LTM (%) NPAs/ Assets (%) ROAE (%) 2015Q3 2015 Q3 2015 Q3 2015 Q3 MRQ 2015 Q3 2015 Q3 2015 Q3 2015 Q3 2015 Q3 Old Point Financial Corp. VA 878,952 0.53 10.34 10.34 *13.69 3.43 32.50 90.59 --- 5.23 Community Bankers Trust Corp VA 1,149,185 (0.21) 8.96 8.70 **12.40 3.78 10.69 75.97 --- (2.26) First United Corp .* MD 1,343,071 0.41 --- --- *13.53 --- --- --- 2.59 4.96 Eastern Virginia Bankshares VA 1,242,387 0.49 10.06 --- *12.58 3.76 13.44 77.67 1.73 4.51 Old Line Bancshares Inc MD 1,331,378 0.80 10.39 9.58 *11.61 4.09 13.56 59.67 0.32 7.48 Middleburg Financial Corp .* VA 1,261,290 0.70 10.02 9.76 **16.99 3.31 19.60 73.82 2.05 6.99 Valley Financial Corp . VA 844,339 (0.11) 7.40 6.66 --- 3.40 14.69 100.59 --- (1.55) Access National Corp. VA 1,118,229 1.40 9.62 9.50 *11.10 3.70 38.84 63.47 --- 14.71 National Bankshares Inc. VA 1,144,125 1.43 15.24 14.76 *23.59 3.92 19.00 46.30 1.68 9.69 Severn Bancorp Inc. MD 773,977 0.65 11.10 7.61 *14.72 3.20 20.64 82.03 4.54 5.98 Franklin Financial Corp .* VA 1,093,980 1.39 --- 21.91 - 31.97 2.64 12.38 63.07 4.49 6.19 Virginia Heritage Bank* VA 951,668 1.02 --- 9.55 --- 3.61 18.96 59.52 0.48 9.10 Average 1,094,382 0.71 10.72 10.04 **14.70 3.65 21.03 71.19 2.50 5.92 Shore Bancshares Inc. MD 1,117,813 0.56 13.05 12.02 **15.40 3.46 31.24 72.39 2.90 4.33 * 2015 Q2 ** 2015 Q3 Reference SNL Bank Highlights Report 11.06.15
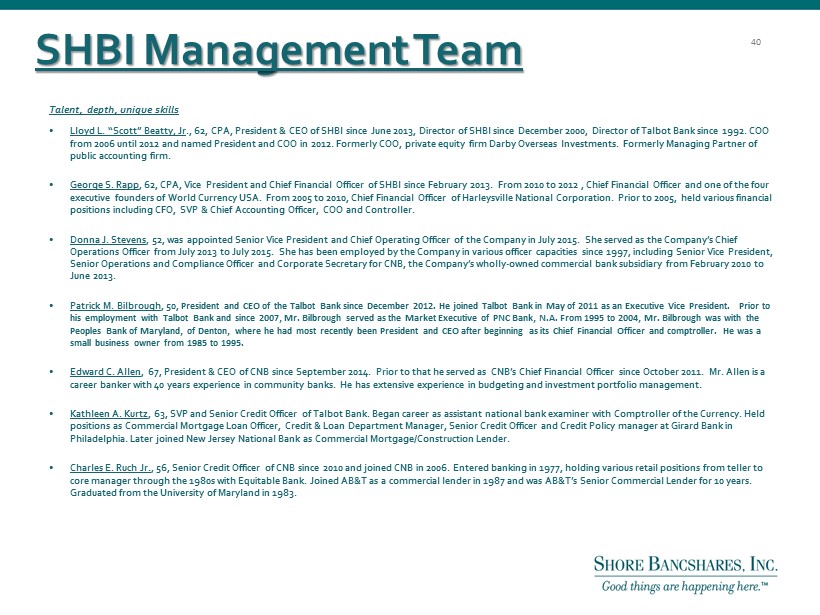
40 Talent, depth, unique skills • Lloyd L. “Scott” Beatty, Jr ., 62, CPA, President & CEO of SHBI since June 2013, Director of SHBI since December 2000, Director of Talbot Bank since 1992. COO from 2006 until 2012 and named President and COO in 2012. Formerly COO, private equity firm Darby Overseas Investments. Formerly Managing Partner of public accounting firm. • George S. Rapp , 62, CPA, Vice President and Chief Financial Officer of SHBI since February 2013. From 2010 to 2012 , Chief Financial Officer and one of th e f our executive founders of World Currency USA. From 2005 to 2010, Chief Financial Officer of Harleysville National Corporation . Prior to 2005, held various financial positions including CFO, SVP & Chief Accounting Officer, COO and Controller . • Donna J. Stevens , 52, was appointed Senior Vice President and Chief Operating Officer of the Company in July 2015. She served as the Company’s Chief Operations Officer from July 2013 to July 2015. She has been employed by the Company in various officer capacities since 199 7, including Senior Vice President, Senior Operations and Compliance Officer and Corporate Secretary for CNB, the Company’s wholly - owned commercial bank subsidiary from February 2010 to June 2013. • Patrick M. Bilbrough , 50, President and CEO of the Talbot Bank since December 2012. He joined Talbot Bank in May of 2011 as an Executive Vice President . Prior to his employment with Talbot Bank and since 2007, Mr. Bilbrough served as the Market Executive of PNC Bank, N.A . From 1995 to 2004, Mr. Bilbrough was with the Peoples Bank of Maryland, of Denton, where he had most recently been President and CEO after beginning as its Chief F inancial O fficer and comptroller. He was a small business owner from 1985 to 1995 . • Edward C. Allen , 67, President & CEO of CNB since September 2014. Prior to that he served as CNB’s Chief Financial Officer since October 2011. Mr. Allen is a career banker with 40 years experience in community banks. He has extensive experience in budgeting and investment portfolio ma nagement. • Kathleen A. Kurtz , 63, SVP and Senior Credit Officer of Talbot Bank. Began career as assistant national bank examiner with Comptroller of the Cur rency. Held positions as Commercial Mortgage Loan Officer, Credit & Loan Department Manager, Senior Credit Officer and Credit Policy mana ger at Girard Bank in Philadelphia. Later joined New Jersey National Bank as Commercial Mortgage/Construction Lender. • Charles E. Ruch Jr. , 56, Senior Credit Officer of CNB since 2010 and joined CNB in 2006. Entered banking in 1977, holding various retail positio ns from teller to core m anager through the 1980s with Equitable Bank. Joined AB&T as a commercial lender in 1987 and was AB&T’s Senior Commercial Len der for 10 years. Graduated from the University of Maryland in 1983. SHBI Management Team
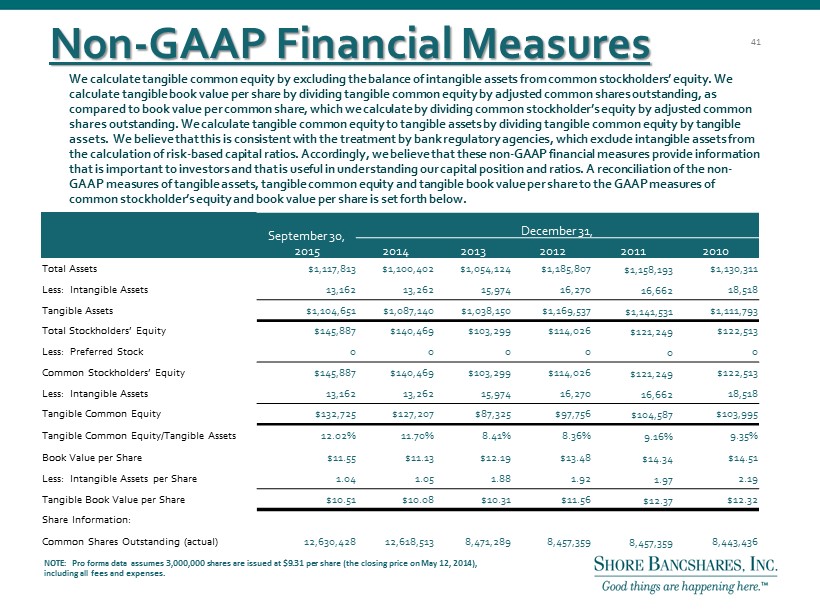
Non - GAAP Financial Measures September 30, 2015 December 31, 2014 2013 2012 2011 2010 Total Assets $1,117,813 $1,100,402 $1,054,124 $1,185,807 $1,158,193 $1,130,311 Less: Intangible Assets 13,162 13,262 15,974 16,270 16,662 18,518 Tangible Assets $1,104,651 $1,087,140 $1,038,150 $1,169,537 $1,141,531 $1,111,793 Total Stockholders’ Equity $145,887 $140,469 $103,299 $114,026 $121,249 $122,513 Less: Preferred Stock 0 0 0 0 0 0 Common Stockholders’ Equity $145,887 $140,469 $103,299 $114,026 $121,249 $122,513 Less: Intangible Assets 13,162 13,262 15,974 16,270 16,662 18,518 Tangible Common Equity $132,725 $127,207 $87,325 $97,756 $104,587 $103,995 Tangible Common Equity/Tangible Assets 12.02% 11.70% 8.41% 8.36% 9.16% 9.35% Book Value per Share $11.55 $11.13 $12.19 $13.48 $14.34 $14.51 Less: Intangible Assets per Share 1.04 1.05 1.88 1.92 1.97 2.19 Tangible Book Value per Share $10.51 $10.08 $10.31 $11.56 $12.37 $12.32 Share Information: Common Shares Outstanding (actual) 12,630,428 12,618,513 8,471,289 8,457,359 8,457,359 8,443,436 We calculate tangible common equity by excluding the balance of intangible assets from common stockholders’ equity. We calculate tangible book value per share by dividing tangible common equity by adjusted common shares outstanding, as compared to book value per common share, which we calculate by dividing common stockholder’s equity by adjusted common shares outstanding. We calculate tangible common equity to tangible assets by dividing tangible common equity by tangible assets. We believe that this is consistent with the treatment by bank regulatory agencies, which exclude intangible assets f rom the calculation of risk - based capital ratios. Accordingly, we believe that these non - GAAP financial measures provide information that is important to investors and that is useful in understanding our capital position and ratios. A reconciliation of the n on - GAAP measures of tangible assets, tangible common equity and tangible book value per share to the GAAP measures of common stockholder’s equity and book value per share is set forth below. NOTE: Pro forma data assumes 3,000,000 shares are issued at $9.31 per share (the closing price on May 12, 2014), including all fees and expenses. 41