Attached files
| file | filename |
|---|---|
| EX-21 - EX-21 - Hill International, Inc. | a15-20629_1ex21.htm |
| EX-32.2 - EX-32.2 - Hill International, Inc. | a15-20629_1ex32d2.htm |
| EX-31.2 - EX-31.2 - Hill International, Inc. | a15-20629_1ex31d2.htm |
| EX-32.1 - EX-32.1 - Hill International, Inc. | a15-20629_1ex32d1.htm |
| EX-31.1 - EX-31.1 - Hill International, Inc. | a15-20629_1ex31d1.htm |
| EX-23.1 - EX-23.1 - Hill International, Inc. | a15-20629_1ex23d1.htm |
UNITED STATES SECURITIES AND EXCHANGE COMMISSION
WASHINGTON, D.C. 20549
FORM 10-K/A
Amendment No. 1
ANNUAL REPORT PURSUANT TO SECTION 13 OR 15(d) OF THE SECURITIES EXCHANGE ACT OF 1934
For the fiscal year ended December 31, 2014
Commission file number 001-33961
HILL INTERNATIONAL, INC.
(Exact name of registrant as specified in its charter)
|
Delaware |
|
20-0953973 |
|
State or other jurisdiction of |
|
(I.R.S. Employer |
|
incorporation or organization |
|
Identification No.) |
|
|
|
|
|
One Commerce Square |
|
|
|
2005 Market Street, 17th Floor |
|
|
|
Philadelphia, PA |
|
19103 |
|
(Address of principal executive offices) |
|
(Zip Code) |
Registrant’s telephone number, including area code: (215) 309-7700
Securities registered pursuant to Section 12(b) of the Act:
|
Title of each class |
|
Name of each exchange on which registered |
|
Common Stock, $.0001 par value |
|
New York Stock Exchange |
Securities registered pursuant to Section 12(g) of the Exchange Act: None
Indicate by a check mark if the registrant is a well-known seasoned issuer, as defined in Rule 405 of the Securities Act. Yes o No x
Indicate by check mark if the registrant is not required to file reports pursuant to Section 13 or Section 15(d) of the Act. Yes o No x
Indicate by check mark whether the Registrant (1) has filed all reports required to be filed by Section 13 or 15(d) of the Securities Exchange Act of 1934 during the preceding 12 months, and (2) has been subject to such filing requirements for the past 90 days. Yes x No o
Indicate by a check mark whether the registrant has submitted electronically and posted on its corporate website, if any, every Interactive Data File required to be submitted and posted pursuant to Rule 405 of Regulation S-T (§229.405 of this chapter) during the preceding 12 months (or for such shorter period that the registrant was required to submit and post such files). Yes x No o
Indicate by a check mark if disclosure of delinquent filers pursuant to Item 405 of Regulation S-K is not contained herein, and will not be contained, to the best of registrant’s knowledge in definitive proxy or information statements incorporated by reference in Part III of this Form 10-K or any amendment to this Form 10-K. o
Indicate by check mark whether the registrant is a large accelerated filer, an accelerated filer, a non-accelerated filer or a smaller reporting company. See definitions of “accelerated filer,” “large accelerated filer” and “smaller reporting company” in Rule 12b-2 of the Exchange Act (Check one):
|
Large Accelerated Filer o |
Accelerated Filer x |
|
|
|
|
Non-Accelerated Filer o |
Smaller reporting company o |
Indicate by check mark whether the registrant is a shell company (as defined in Rule 12b-2 of the Exchange Act). Yes o No x
The aggregate market value of shares of common stock held by non-affiliates on June 30, 2014 was approximately $170,206,000. As of March 6, 2015, there were 50,373,757 shares of the Registrant’s Common Stock outstanding.
Documents Incorporated by Reference
Portions of the proxy statement for the 2015 Annual Meeting of Shareholders of Hill International, Inc. are incorporated by reference into Part III of this Form 10-K.
HILL INTERNATIONAL, INC. AND SUBSIDIARIES
EXPLANATORY NOTE
Hill International, Inc. (“Hill” or the “Company”) is filing this Amendment No. 1 (this “Amendment”) to its Annual Report on Form 10-K for the year ended December 31, 2014 (the “Original Form 10-K”) filed with the Securities and Exchange Commission (the “SEC”) on March 13, 2015 (the “Original Filing Date”) to restate and amend the Company’s previously issued consolidated financial statements and related financial information for each of the years ended December 31, 2014, 2013 and 2012 included in its previously filed Annual Reports on Form 10-K related to each such period to reflect a change related to its accounting treatment for accounts receivable from the Libyan Organization for Development of Administrative Centres (“ODAC”) (the “Libya Receivable”) and certain related liabilities. The Company has included significant disclosures regarding the status of the Libya Receivable in its prior periodic reports filed with the SEC. In addition, concurrently with the filing of this Amendment, the Company is filing an amendment to each of its Quarterly Reports on Form 10-Q for the three months ended March 31, 2015 and the six months ended June 30, 2015 to restate its previously issued consolidated financial statements for the first two quarters of 2015 and 2014.
Except as described in this Explanatory Note, the financial statements, financial statement footnote disclosures and related financial information in the Original Form 10-K are unchanged. In particular, except for the events described under “Background” below, this Amendment has not been updated to reflect any events that have occurred after the Original Form 10-K was filed or to modify or update disclosures affected by other subsequent events. Accordingly, forward-looking statements included in this Amendment represent management’s views as of the Original Filing Date and should not be assumed to be accurate as of any date thereafter.
Background
The Company began work in Libya in 2007. From that time through early 2010, the Company had received payments totaling approximately $104,000,000 related to its services there. In April 2010, the Libyan government halted all payments to firms pending a review of the government procurement process. The Company continued to work during the review period and during that time its Libya Receivable balance grew to approximately $76,000,000. At the completion of its review in November 2010, the Libya agency responsible for auditing contracts, RQABA, acknowledged that our receivables were proper and were owed in full. In December 2010 and January 2011, we received payments totaling $15,900,000 and were advised that an additional $31,600,000 had been scheduled for payment. In February 2011, due to civil and political unrest in Libya, we suspended our operations in and demobilized substantially all of our personnel from Libya. During the second half of 2011, the Company received various communications from ODAC requesting that the Company re-submit all open invoices for processing since much of the original documentation had been lost during the turmoil. The Company complied with ODAC’s request and accordingly re-submitted copies of all open invoices. This pro-active request from ODAC, in the Company’s assessment, provided evidence of ODAC’s intention to fulfill its obligations that existed prior to the political unrest. During late 2012 and early 2013, the Company was advised by ODAC that, due to the political division in the country, payments had been temporarily restricted to local payroll. During late 2013 and early 2014, the Company received payments of approximately $9,500,000 from ODAC who also posted a letter of credit of approximately $14,000,000 in the Company’s favor which expired on June 30, 2014. Management believed that this progress was a positive indication that ODAC intended to fulfill its obligations to the Company.
In connection with a review by the staff (the “Staff”) of the SEC of the Company’s Annual Report on Form 10-K for the year ended December 31, 2014, Form 10-Q for the quarter ended March 31, 2015 and Definitive Proxy Statement filed April 30, 2015 (the “Staff Review”), the Staff made inquiries with respect to the accounting treatment of the Libya Receivable. After subsequent communications between the Staff and the Company relating to the Staff Review, the Company, under the direction of its Audit Committee, re-evaluated its historical and then current practices with respect to analyzing the collectability of accounts receivable in accordance with accounting principles generally accepted in the United States. In connection with this re-evaluation, the Company determined that its previous accounting treatment for the Libya Receivable was no longer appropriate as of and for the year ended December 31, 2012. Therefore, the Company reserved the entire Libya Receivable of $59,937,000 and eliminated $11,388,000 of certain assets and liabilities related to that receivable, consisting of sub-consultants and other contingent expenses in 2012, which are contractually owed only upon receipt of payment. These adjustments resulted in a net charge to selling, general and administrative expenses of $48,549,000 for the year ended December 31, 2012. Additionally, the Company has reflected subsequent receipts against the Libya Receivable, net of payments for the related agency fees and certain taxes, as reductions of
selling, general and administrative expenses. Accordingly, the Company reflected 2013 receipts of approximately $2,880,000 and payments of approximately $640,000 as a net reduction of selling, general and administrative expenses amounting to approximately $2,240,000 plus a related income tax expense adjustment of $307,000 for the year ended December 31, 2013 and 2014 receipts of approximately $6,631,000 and payments of approximately $1,683,000 as a net reduction of selling, general and administrative expenses amounting to approximately $4,948,000 plus a related income tax adjustment of $307,000 for the year ended December 31, 2014. In addition, the Company recorded certain unrelated adjustments to consulting fee revenues, cost of services, selling, general and administrative expenses and taxes for the year ended December 31, 2014. These unrelated adjustments were the direct result of the restatement because previous immaterial variances in certain accounts that were not recorded during the December 31, 2014 year end closing process became material when aggregated and assessed against the restated 2014 financial statements. In the aggregate, these unrelated adjustments increase net loss by approximately $307,000 for the year ended December 31, 2014.
The adjustments to reflect the change in estimate as to the collectability of the Libya Receivable and related adjustments resulted in a decrease in basic and diluted loss per share of $0.11 for the year ended December 31, 2014, an increase in basic and diluted earnings per share of $0.05 for the year ended December 31, 2013 and an increase in basic and diluted net loss per share of $1.26 for the year ended December 31, 2012. Net loss attributable to Hill decreased approximately $4,731,000 for the year ended December 31, 2014, earnings attributable to Hill increased approximately $1,933,000 for the year ended December 31, 2013 and net loss attributable to Hill increased approximately $48,549,000 for the year ended December 31, 2012.
Effects of Restatement
This Amendment amends and restates the Original Form 10-K to change the Company’s estimate of loss on its Libya Receivable at December 31, 2012, subsequent recoveries of the Libya Receivable in 2013 and 2014 and certain unrelated adjustments as more fully described in Note 1 to the Consolidated Financial Statements and to reflect certain adjustments to accruals related to the Libya Receivable (see Note 9). Revisions to the Original Form 10-K have been made to the Company’s Consolidated Financial Statements and related disclosures in Item 8 - Financial Statements and Supplementary Data for the years ended December 31, 2014, 2013 and 2012, and, where necessary, to the following other items to reflect the restatements:
|
· |
Item 1 - Business |
|
|
|
|
· |
Item 1A - Risk Factors |
|
|
|
|
· |
Item 6 - Selected Financial Data |
|
|
|
|
· |
Item 7 - Management’s Discussion and Analysis of Financial Condition and Results of Operations |
|
|
|
|
· |
Item 9A - Controls and Procedures |
Also, Item 15 of this Amendment has been amended to include the restated financial statements, the restated Schedule II and to file or furnish, as the case may be, as exhibits currently dated certifications from the Company’s principal executive officer and principal financial officer, as required by Sections 302 and 906 of the Sarbanes-Oxley Act of 2002.
CAUTIONARY NOTE REGARDING FORWARD-LOOKING STATEMENTS
Certain statements contained in this Annual Report on Form 10-K may constitute forward-looking statements within the meaning of the Private Securities Litigation Reform Act of 1995 (the “Reform Act”). We may also make forward-looking statements in other reports filed with the United States Securities and Exchange Commission (the “SEC”), in materials delivered to stockholders and in press releases. Forward-looking statements provide current expectations of future events based on certain assumptions and include any statement that does not directly relate to any historical or current fact. Although we believe that the expectations, estimates and assumptions reflected in our forward-looking statements are reasonable, actual results could differ materially from those projected or assumed in any of our forward-looking statements. You can identify forward-looking statements by the use of terminology such as “may,” “will,” “anticipate,” “believe,” “estimate,” “expect,” “future,” “intend,” “plan,” “could,” “should,” “potential” or “continue” or the negative or other variations thereof, as well as other statements regarding matters that are not historical fact.
Those forward-looking statements may concern, among other things:
· The markets for our services;
· Projections of revenues and earnings, anticipated contractual obligations, capital expenditures, funding requirements or other financial items;
· Statements concerning our plans, strategies and objectives for future operations; and
· Statements regarding future economic conditions or performance.
Important factors that could cause our actual results, performance and achievements, or industry results to differ materially from estimates or projections contained in our forward-looking statements include:
· Modifications and termination of client contracts;
· Control and operational issues pertaining to business activities that we conduct pursuant to joint ventures with other parties;
· Difficulties we may incur in implementing our acquisition strategy;
· The need to retain and recruit key technical and management personnel; and
· Unexpected adjustments and cancellations related to our backlog.
Other factors that may affect our businesses, financial position or results of operations include:
· Special risks of our ability to obtain debt financing or otherwise raise capital to meet required working capital needs and to support potential future acquisition activities;
· Special risks of international operations, including uncertain political and economic environments, acts of terrorism or war, potential incompatibilities with foreign joint venture partners, foreign currency fluctuations, civil disturbances and labor issues; and
· Special risks of contracts with governmental entities, including the failure of applicable governing authorities to take necessary actions to secure or maintain funding for particular projects with us, the unilateral termination of contracts by the government and reimbursement obligations to the government for funds previously received.
We assume no obligation to update or revise any forward-looking statements. In accordance with the Reform Act, Item 1A of this Report entitled “Risk Factors” contains cautionary statements that accompany those forward-looking statements. You should carefully review such cautionary statements as they identify certain important factors that could cause actual results to differ materially from those in the forward-looking statements and from historical trends. Those cautionary statements are not exclusive and are in addition to other factors discussed elsewhere in this Form 10-K, in our other filings with the Securities and Exchange Commission or in materials incorporated therein by reference.
General
Hill International, Inc., with 4,600 professionals in 100 offices worldwide, provides program management, project management, construction management, construction claims and other consulting services primarily to the buildings, transportation, environmental, energy and industrial markets. According to the June 16, 2014 edition of Engineering News-Record magazine, Hill is the ninth largest construction management firm and eleventh largest program management firm headquartered in the United States. The terms “Hill”, the “Company”, “we”, “us” and “our” refer to Hill International, Inc.
We compete for business based on a variety of factors such as technical capability, global resources, price, reputation and past experience, including client requirements for substantial experience in similar projects and claims work. We have developed significant long-standing relationships, which bring us repeat business and would be very difficult to replicate. We believe we have an excellent reputation for attracting and retaining professionals. In addition, we believe there are high barriers to entry for new competitors especially in the project management market.
Our Growth Strategy
Our growth strategy emphasizes the following key elements:
· Increase Revenues from Our Existing Clients. We have long-standing relationships with a number of public and private sector entities. Meeting our clients’ diverse needs in managing construction risk and generating repeat business from our clients to expand our project base is one of our key growth strategies. We accomplish this objective by providing a broad range of project management and construction claims consulting services in a wide range of geographic areas that support our clients during every phase of a project, from concept through completion. We believe that nurturing our existing client relationships expands our project base through repeat business.
· Capitalize Upon the Substantial Expected Spend in Our Markets. We believe that the demand for project management services will grow with increasing construction and infrastructure spending in the markets we serve. We believe that our reputation and experience combined with our broad platform of service offerings will enable us to capitalize on increases in demand for our services. In addition, we strategically open new offices to expand into new geographic areas and we aggressively hire individuals with significant contacts to accelerate growth of these new offices and to strengthen our presence in existing markets.
· Continue to Pursue Acquisitions. We operate in a highly fragmented industry with many smaller, regional competitors. Our acquisition strategy allows us to manage risk by diversifying our markets, which enables us to compete better by integrating capabilities and obtaining new relationships. We pursue acquisitions primarily for three reasons: to expand into new geographic markets; add to professional resources and improve critical mass in existing markets to compete more effectively; and to enhance our specialization and capability in certain strategic areas. We intend to continue to pursue both U.S. acquisitions to round out our domestic presence and enhance capabilities in specific areas and foreign acquisitions that bring new relationships as well as widen our geographic base to offer our global capabilities.
· Strengthen Professional Resources. Our biggest asset is the people that work for Hill. We intend to continue spending significant time recruiting and retaining the best and the brightest to improve our competitive position. Our independent status has attracted top project management talent with varied industry experience. Additionally, our construction claims business provides us with a strong base of expertise that allows knowledge transfer across our businesses. We believe maintaining and bolstering our team will enable us to continue to grow our business.
Reporting Segments
We operate through two reporting segments: the Project Management Group and the Construction Claims Group. Our total revenue consists of two components: consulting fee revenue (“CFR”) and reimbursable expenses. Reimbursable expenses are reflected in equal amounts in both total revenue and total direct expenses. Because these revenue/costs are subject to significant fluctuation from year to year, we measure the performance of many of our key operating metrics as a percentage of CFR, as we believe that this is a better and more consistent measure of operating performance than total revenue. Throughout this report we have used CFR as the denominator in many of our ratios. The following table sets forth the amount and percentage of CFR from our operations in each reporting segment for each of the past three fiscal years (dollars in thousands):
Consulting Fee Revenue (“CFR”)
|
|
|
2014 |
|
2013 |
|
2012 |
| |||||||||
|
|
|
(Restated) |
|
|
|
|
|
|
|
|
| |||||
|
Project Management |
|
$ |
428,827 |
|
74.3 |
% |
$ |
392,602 |
|
76.7 |
% |
$ |
312,232 |
|
74.8 |
% |
|
Construction Claims |
|
148,290 |
|
25.7 |
|
119,483 |
|
23.3 |
|
105,366 |
|
25.2 |
| |||
|
Total |
|
$ |
577,117 |
|
100.0 |
% |
$ |
512,085 |
|
100.0 |
% |
$ |
417,598 |
|
100.0 |
% |
Project Management
Our Project Management Group provides fee-based or “agency” construction management services to our clients, leveraging our construction expertise to identify potential trouble, difficulties and sources of delay on a construction project before they develop into costly problems. Our experienced professionals are capable of managing all phases of the construction process from concept through completion, including cost and budget controls, scheduling, estimating, expediting, inspection, contract administration and management of contractors, subcontractors and suppliers.
Our clients are typically billed a negotiated multiple of the actual direct cost of each professional assigned to a project and we are reimbursed for our out-of-pocket expenses. We believe our fee-based consulting has significant advantages over traditional general contractors. Specifically, because we do not assume project completion risk, our fee-based model eliminates many of the risks typically associated with providing “at risk” construction services.
Construction Claims
Our Construction Claims Group advises clients in order to assist them in preventing or resolving claims and disputes based upon schedule delays, cost overruns and other problems on major construction projects worldwide.
We may be retained as a claims consultant at the onset of a project, during the course of a project or upon the completion of a project. We assist owners or contractors in adversarial situations as well as in situations where an amicable resolution is sought. Specific activities that we undertake as part of these services include claims preparation, analysis and review, litigation support, cost/damages assessment, delay/disruption analysis, adjudication, risk assessment, lender advisory, expert witness testimony and other services.
Clients are typically billed based on an hourly rate for each consultant assigned to the project, and we are reimbursed for our out-of-pocket expenses. Our claims consulting clients include participants on all sides of a construction project, including owners, contractors, subcontractors, architects, engineers, attorneys, lenders and insurance companies.
Global Business
We operate worldwide and currently have over 100 offices in over 40 countries. The following table sets forth the amount and percentage of our CFR by geographic region for each of the past three fiscal years (dollars in thousands):
Consulting Fee Revenue by Geographic Region
|
|
|
2014 |
|
2013 |
|
2012 |
| |||||||||
|
|
|
(Restated) |
|
|
|
|
|
|
|
|
| |||||
|
U.S./Canada |
|
$ |
125,691 |
|
21.8 |
% |
$ |
121,291 |
|
23.7 |
% |
$ |
117,593 |
|
28.2 |
% |
|
Latin America |
|
40,844 |
|
7.1 |
|
49,188 |
|
9.6 |
|
51,820 |
|
12.4 |
| |||
|
Europe |
|
79,009 |
|
13.7 |
|
75,398 |
|
14.7 |
|
84,267 |
|
20.2 |
| |||
|
Middle East |
|
272,236 |
|
47.2 |
|
219,315 |
|
42.8 |
|
134,037 |
|
32.1 |
| |||
|
Africa |
|
23,849 |
|
4.1 |
|
22,744 |
|
4.4 |
|
13,591 |
|
3.3 |
| |||
|
Asia/Pacific |
|
35,488 |
|
6.1 |
|
24,149 |
|
4.8 |
|
16,290 |
|
3.8 |
| |||
|
Total |
|
$ |
577,117 |
|
100.0 |
% |
$ |
512,085 |
|
100.0 |
% |
$ |
417,598 |
|
100.0 |
% |
|
|
|
|
|
|
|
|
|
|
|
|
|
|
| |||
|
U.S. |
|
$ |
122,096 |
|
21.2 |
% |
$ |
117,740 |
|
23.0 |
% |
$ |
114,368 |
|
27.4 |
% |
|
Non-U.S. |
|
455,021 |
|
78.8 |
|
394,345 |
|
77.0 |
|
303,230 |
|
72.6 |
| |||
|
Total |
|
$ |
577,117 |
|
100.0 |
% |
$ |
512,085 |
|
100.0 |
% |
$ |
417,598 |
|
100.0 |
% |
Growth Organically and Through Acquisitions
Over the years, our business has expanded through organic growth and the acquisition of a number of project management and claims consulting businesses. Over the past 17 years, we have completed 23 acquisitions of project management and claims consulting businesses.
We believe that our industry includes a number of small regional companies in a highly fragmented market. We believe that we have significant experience and expertise in identifying, negotiating, completing and integrating acquisitions and view the acquisition of these smaller competitors as a key part of our growth strategy. Through our acquisitions, we gained entry into the United Kingdom, Spain, Mexico, Poland, Australia, Brazil and South Africa and expanded our presence in the United States. These transactions have enabled us to accelerate our growth, strengthen our geographic diversity and compete more effectively.
Clients
Our clients consist primarily of the United States and other national governments, state and local governments, and the private sector. The following table sets forth our breakdown of CFR attributable to these categories of clients for each of the past three fiscal years (dollars in thousands):
Consulting Fee Revenue By Client Type
|
|
|
2014 |
|
2013 |
|
2012 |
| |||||||||
|
|
|
(Restated) |
|
|
|
|
|
|
|
|
| |||||
|
U.S. federal government |
|
$ |
13,250 |
|
2.3 |
% |
$ |
14,958 |
|
2.9 |
% |
$ |
12,877 |
|
3.1 |
% |
|
U.S. state, regional and local governments |
|
74,921 |
|
13.0 |
|
69,477 |
|
13.6 |
|
61,790 |
|
14.8 |
| |||
|
Foreign governments |
|
220,917 |
|
38.3 |
|
181,066 |
|
35.3 |
|
96,242 |
|
23.0 |
| |||
|
Private sector |
|
268,029 |
|
46.4 |
|
246,584 |
|
48.2 |
|
246,689 |
|
59.1 |
| |||
|
Total |
|
$ |
577,117 |
|
100.0 |
% |
$ |
512,085 |
|
100.0 |
% |
$ |
417,598 |
|
100.0 |
% |
The following table sets forth the percentage of our consulting fee revenue contributed by each of our five largest clients for the years ended December 31, 2014, 2013 and 2012:
|
|
|
For the Years Ended December 31, |
| ||||
|
|
|
2014 |
|
2013 |
|
2012 |
|
|
Largest Client |
|
11.0 |
% |
10.0 |
% |
3.6 |
% |
|
2nd largest client |
|
3.4 |
% |
3.4 |
% |
2.6 |
% |
|
3rd largest client |
|
2.6 |
% |
2.3 |
% |
2.2 |
% |
|
4th largest client |
|
2.6 |
% |
1.6 |
% |
2.1 |
% |
|
5th largest client |
|
2.5 |
% |
1.6 |
% |
2.0 |
% |
|
Top 5 largest clients |
|
22.1 |
% |
18.9 |
% |
12.5 |
% |
Business Development
The process for acquiring business from each of our categories of clients is principally the same, by participating in a competitive request-for-proposal (“RFP”) process, with the primary difference among clients being that the process for public sector clients is significantly more formal and complex than for private sector clients as a result of government procurement rules and regulations that govern the public-sector process.
Although a significant factor in our business development consists of our standing in our industry, including existing relationships and reputation based on performance on completed projects, our marketing department undertakes a variety of activities in order to expand our exposure to potential new clients. These activities include media relations, advertising, promotions, market sector initiatives and maintaining our website and related web marketing. Media relations include placing articles that feature us and our personnel in trade publications and other media outlets. Our promotions include arranging speaking engagements for our personnel, participation in trade shows and other promotional activities. Market sector initiatives are designed to broaden our exposure to specific sectors of the construction industry, such as, for example, participating in or organizing industry seminars.
For the year ended December 31, 2014, CFR from U.S. and foreign government contracts represented approximately 53.6% of our total CFR. Doing business with governments is complex and requires the ability to comply with intricate regulations and satisfy periodic audits. We believe that the ability to understand these requirements and to successfully conduct business with government agencies is a barrier to entry for smaller, less experienced competitors. Most government contracts, including those with foreign governments, are subject to termination by the government, to government audits and to continued appropriations.
We are required from time to time to obtain various permits, licenses and approvals in order to conduct our business in many of the jurisdictions where we operate. Our businesses of providing project management and construction claims services are not subject to significant regulation by state, federal or foreign governments.
Contracts
The price provisions of our contracts can be grouped into three broad categories: cost-plus, time and materials, and fixed-price. Cost-plus contracts provide for reimbursement of our costs and overhead plus a predetermined fee. Under some cost-plus contracts, our fee may be based partially on quality, schedule and other performance factors. We also enter into contracts whereby we bill our clients monthly at hourly billing rates. The hourly billing rates are determined by contract terms. For governmental clients, the hourly rates are generally calculated as salary costs plus overhead costs plus a negotiated profit percentage. For commercial clients, the hourly rate can be taken from a standard fee schedule by staff classification or it can be at a discount from this schedule. In some cases, primarily for foreign work, a monthly rate is negotiated rather than an hourly rate. This monthly rate is a build-up of staffing costs plus overhead and profit. We account for these contracts on a time-and-materials method, recognizing revenue as costs are incurred. Fixed-price contracts are accounted for using the “percentage-of-completion” method, wherein revenue is recognized as costs are incurred.
Backlog
We believe a strong indicator of our future performance is our backlog of uncompleted projects under contract or awarded. Our backlog represents management’s estimate of the amount of contracts and awards in hand that we expect to result in future consulting fees. Project Management backlog is evaluated by management on a project-by-project basis and is reported for each period shown based upon the binding nature of the underlying contract, commitment or letter of intent, and other factors, including the economic, financial and regulatory viability of the project and the likelihood of the contract being extended, renewed or cancelled. Construction Claims backlog is based largely on management’s estimates of future revenue based on known construction claims assignments. Because a significant number of construction claims may be awarded and completed within the same period, our actual construction claims revenue has historically exceeded backlog by a significant amount.
Our backlog is important to us in anticipating and planning for our operational needs. Backlog is not a measure defined in U.S. generally accepted accounting principles, and our methodology for determining backlog may not be comparable to the methodology used by other companies in determining their backlog.
At December 31, 2014, our backlog was a record $1,036,000,000, compared to approximately $983,000,000 at December 31, 2013. At December 31, 2014, September 30, 2014 and December 31, 2013, backlog attributable to uncompleted work in Libya amounting to approximately $44,000,000 was excluded from our backlog in each period due to the uncertainty surrounding the Libya Receivable and the political instability in Libya, we have excluded that amount from our total backlog. We estimate that approximately $467,000,000, or 45.1% of the backlog at December 31, 2014, will be recognized during our 2015 fiscal year.
Although backlog reflects business that we consider to be firm, cancellations or scope adjustments may occur. Further, substantially all of our contracts with our clients may be terminated at will, in which case the client would only be obligated to us for services provided through the termination date. Historically, the impact of terminations and modifications on our realization of revenue from our backlog has not been significant, however, there can be no assurance that such changes will not be significant in the future. Furthermore, reductions of our backlog as a result of contract terminations and modifications may be offset by additions to the backlog.
We adjust backlog to reflect project cancellations, deferrals and revisions in scope and cost (both upward and downward) known at the reporting date. Future contract modifications or cancellations, however, may increase or reduce backlog and future revenue.
|
|
|
Total Backlog |
|
12-Month Backlog |
| ||||||
|
|
|
(dollars in thousands) |
| ||||||||
|
|
|
(Restated) |
|
(Restated) |
| ||||||
|
As of December 31, 2014: |
|
|
|
|
|
|
|
|
| ||
|
Project Management |
|
$ |
990,000 |
|
95.6 |
% |
$ |
421,000 |
|
90.2 |
% |
|
Construction Claims |
|
46,000 |
|
4.4 |
|
46,000 |
|
9.8 |
| ||
|
Total |
|
$ |
1,036,000 |
|
100.0 |
% |
$ |
467,000 |
|
100.0 |
% |
|
|
|
|
|
|
|
|
|
|
| ||
|
As of September 30, 2014: |
|
|
|
|
|
|
|
|
| ||
|
Project Management |
|
$ |
982,000 |
|
95.4 |
% |
$ |
410,000 |
|
89.7 |
% |
|
Construction Claims |
|
47,000 |
|
4.6 |
|
47,000 |
|
10.3 |
| ||
|
Total |
|
$ |
1,029,000 |
|
100.0 |
% |
$ |
457,000 |
|
100.0 |
% |
|
|
|
|
|
|
|
|
|
|
| ||
|
As of December 31, 2013: |
|
|
|
|
|
|
|
|
| ||
|
Project Management |
|
$ |
940,000 |
|
95.6 |
% |
$ |
347,000 |
|
89.0 |
% |
|
Construction Claims |
|
43,000 |
|
4.4 |
|
43,000 |
|
11.0 |
| ||
|
Total |
|
$ |
983,000 |
|
100.0 |
% |
$ |
390,000 |
|
100.0 |
% |
Competition
The project management and claims consulting industries are highly competitive. We compete for contracts, primarily on the basis of technical capability, with numerous entities, including design or engineering firms, general contractors, other “pure” construction management companies, other claims consulting firms, the “Big Four” and other accounting firms, management consulting firms and other entities. Compared to us, many of these competitors are larger, well-established companies that have broader geographic scope and greater financial and other resources. During 2014, some of our largest project management competitors included: AECOM Technology Corp., ARCADIS N.V., Jacobs Engineering Group, Inc., Parsons Brinckerhoff, Inc., Parsons Corp. and Turner Construction Co. Some of our largest claims consulting competitors last year included: Driver Group, Ltd., Exponent, Inc., Navigant Consulting, Inc. and Systech Group, Ltd.
Insurance
We maintain insurance covering professional liability, as well as for claims involving bodily injury and property damage. We have historically enjoyed a favorable loss ratio in all lines of insurance and our management considers our present limits of liability, deductibles and reserves to be adequate. We endeavor to reduce or eliminate risk through the use of quality assurance/control, risk management, workplace safety and similar methods to eliminate or reduce the risk of losses on a project. Although our actual rates have decreased, we have experienced and expect to continue to experience increases in the dollar amount of our insurance premiums because of the increase in our revenue.
Management
We are led by an experienced management team with significant experience in the construction industry. Additional information about our executive officers follows.
Executive Officers
|
Name |
|
Age |
|
Position |
|
David L. Richter |
|
48 |
|
President and Chief Executive Officer |
|
Raouf S. Ghali |
|
53 |
|
Chief Operating Officer |
|
Thomas J. Spearing III |
|
48 |
|
Regional President (Americas), Project Management Group |
|
Mohammed Al Rais |
|
61 |
|
Regional President (Middle East), Project Management Group |
|
Frederic Z. Samelian |
|
67 |
|
President, Construction Claims Group |
|
John Fanelli III |
|
60 |
|
Senior Vice President and Chief Financial Officer |
|
Ronald F. Emma |
|
63 |
|
Senior Vice President and Chief Accounting Officer |
|
William H. Dengler, Jr. |
|
48 |
|
Senior Vice President and General Counsel |
|
Catherine H. Emma |
|
55 |
|
Senior Vice President and Chief Administrative Officer |
|
Michael J. Petrisko |
|
50 |
|
Senior Vice President and Chief Information Officer |
On January 27, 2014, the Board of Directors approved a leadership succession plan that provided for the transition of the Chief Executive Officer position as of December 31, 2014 from Irvin E. Richter to David L. Richter. Irvin E. Richter has remained with the Company as Chairman.
DAVID L. RICHTER has been our President and Chief Executive Officer since December 2014. Prior to his current position, he was our President and Chief Operating Officer from March 2004 to December 2014, and he has been a member of our Board of Directors since 1998. Before that, Mr. Richter was President of our Project Management Group from 2001 to 2004, Senior Vice President and General Counsel from 1999 to 2001 and Vice President and General Counsel from 1995 to 1999. Prior to joining us, he was an attorney with the New York City law firm of Weil, Gotshal & Manges LLP from 1992 to 1995. Mr. Richter is a Fellow of the Construction Management Association of America (CMAA) and a member of the World Presidents’ Organization, the Construction Industry Round Table and the American Society of Civil Engineers. He is a former member of the Board of Trustees of the Southern New Jersey Development Council and the Board of Directors of the CMAA. Mr. Richter earned his B.S. in management, his B.S.E. in civil
engineering and his J.D. from the University of Pennsylvania, and he is currently pursuing his M.Sc. in major program management from the University of Oxford. Mr. Richter is a son of Irvin E. Richter.
RAOUF S. GHALI has been our Chief Operating Officer since January 2015. Prior to that, he was President of our Project Management Group (International) from January 2005 to January 2015, Senior Vice President in charge of project management operations in Europe, North Africa and the Middle East from 2001 to 2004, and Vice President from 1993 to 2001. Prior to joining us, he worked for Walt Disney Imagineering from 1988 to 1993. Mr. Ghali earned both a B.S. in business administration and economics and an M.S. in business organizational management from the University of LaVerne.
THOMAS J. SPEARING III has been Regional President (Americas) of our Project Management Group since January 2015. Prior to that, he was President of our Project Management Group (Americas) from April 2009 to January 2015 and Senior Vice President and Chief Strategy Officer from September 2007 to March 2009. Prior to joining Hill, Mr. Spearing worked for more than ten years with STV Group, Inc., most recently as Principal-in-Charge of its western region. Before that, Mr. Spearing was a Vice President of business development with Hill. Mr. Spearing earned his B.B.A. in computer and information science from Temple University, his B.S. in construction management and his B.S. in civil engineering from Spring Garden College, and his M.S. in management from Rosemont College. He is founding co-chair of Pennsylvanians for Transportation Solutions (Pen Trans), is a Women’s Transportation Seminar member, a member of the Legacy Foundation and Co-Chair of the Transit Builders’ Trust. In addition, he has served in various leadership roles with the American Public Transit Association, including serving as chair, vice chair and secretary of its Capital Projects Subcommittee. Mr. Spearing also is active in the Southern New Jersey Development Council, the AEC Business Builders Forum, and the CMAA, among others.
MOHAMMED AL RAIS has been Regional President (Middle East) with Hill’s Project Management Group since January 2015. Prior to that, he was Senior Vice President and Managing Director (Middle East) of our Project Management Group from April 2010 to January 2015 and Vice President from 2006 to 2010. Mr. Al Rais has over 38 years of experience in the management of construction projects throughout the Middle East, North Africa, the United Kingdom and Canada. He earned his B.Sc. in city and regional planning from the University of Engineering and Technology in Pakistan and his M.Sc. in project management from the University of Reading in the United Kingdom. Mr. Al Rais is a member of the Association for Project Management in the U.K., the Canadian Business Council, the Society of Engineers in the U.A.E., the Chartered Management Institute and the Chartered Institute of Building.
FREDERIC Z. SAMELIAN has been President of our Construction Claims Group since January 2005. He was a Senior Vice President with us from 2003 to 2004. Before that, Mr. Samelian was President of Conex International, Inc., a construction dispute resolution firm, from 2002 to 2003 and from 2000 to 2001, an Executive Director with Greyhawk North America, Inc., a construction management and consulting firm, from 2001 to 2002, and a Director with PricewaterhouseCoopers LLP from 1998 to 2000. Before that, he had worked with Hill from 1983 to August 1998. He served as Hill’s President and Chief Operating Officer from 1996 to 1998. Mr. Samelian has a B.A. in international affairs from George Washington University and an M.B.A. from Southern Illinois University at Edwardsville. He is a Project Management Professional certified by the Project Management Institute and he is a licensed General Building Contractor in California and Nevada. Mr. Samelian is also a Member of the Chartered Institute of Arbitrators (CIArb) and is a CIArb Accredited Mediator. Mr. Samelian is also a licensed real estate salesperson in Nevada.
JOHN FANELLI III has been our Senior Vice President and Chief Financial Officer since September 2006. Before that, Mr. Fanelli was Vice President and Chief Accounting Officer of CDI Corp. from 2005 to 2006, and he was Vice President and Corporate Controller of CDI Corporation (a subsidiary of CDI Corp.) from 2003 to 2006. CDI Corp. is a New York Stock Exchange-traded professional services and outsourcing firm based in Philadelphia with expertise in engineering, technical services and information technology. During 2003, Mr. Fanelli was a financial consultant to Berwind Corporation, an investment management company based in Philadelphia which owns a diversified portfolio of manufacturing and service businesses and real estate. Before that, Mr. Fanelli was employed for 18 years by Hunt Corporation, then a New York Stock Exchange-traded manufacturer and marketer of office products. At Hunt, he served as Vice President and Chief Accounting Officer from 1995 until 2003, and before that as Director of Budgeting, Financial Analysis and Control, from 1985 to 1995. Before that, Mr. Fanelli was employed with Coopers & Lybrand for eight years
in various accounting and auditing positions. Mr. Fanelli earned his B.S. in accounting from LaSalle University and he is a Certified Public Accountant in Pennsylvania.
RONALD F. EMMA has been our Senior Vice President and Chief Accounting Officer since January 2007. Mr. Emma had been Senior Vice President of Finance from 1999 to 2007. Before that, he was Vice President of Finance. Mr. Emma has been with Hill since 1980. Before joining Hill, he was Assistant Controller of General Energy Resources, Inc., a mechanical contracting firm, and prior to that was a Staff Accountant with the accounting firm of Haskins & Sells. Mr. Emma has a B.S. in accounting from St. Joseph’s University and he is a Certified Public Accountant in New Jersey.
WILLIAM H. DENGLER, JR. has been our Senior Vice President and General Counsel since March 2007. Mr. Dengler was previously Vice President and General Counsel from 2002 to 2007, and Corporate Counsel from 2001 to 2002. Mr. Dengler also serves as corporate secretary to Hill and its subsidiaries. Prior to joining Hill, Mr. Dengler served as Assistant Counsel to former New Jersey Governors Donald DiFrancesco and Christine Todd Whitman from 1999 to 2001. Mr. Dengler earned his B.A. in political science from Western Maryland College and his J.D. from Rutgers University School of Law at Camden. He is licensed to practice law in New Jersey, as well as before the U.S. Court of Appeals for the Third Circuit and the U.S. Supreme Court.
CATHERINE H. EMMA has been our Senior Vice President and Chief Administrative Officer since January 2007. Ms. Emma had been Vice President and Chief Administrative Officer from 2005 to 2007. Before that, she served as Vice President of Human Resources and Administration. Ms. Emma has been with Hill since 1982. She is certified by the Society for Human Resource Management as a Professional in Human Resources (PHR) and holds professional memberships with Tri-State Human Resources and the Society for Human Resource Management. Ms. Emma previously participated in BNA’s Human Resources Personnel Policies Forum. Ms. Emma is the wife of Ronald F. Emma.
MICHAEL J. PETRISKO has been our Senior Vice President and Chief Information Officer since June 2014. Prior to that, Mr. Petrisko was Vice President and Chief Information Officer for STV Group, an architecture, engineering and construction management firm, from June 2012 through June 2014. Before that, Mr. Petrisko was Hill’s Senior Vice President and Chief Information Officer from January 2009 through June 2012, and Vice President and Chief Information Officer from 2007 to 2008. Before that, Mr. Petrisko was Director of Global IT Operations for AECOM Technology Corp. from 2005 to 2007 and Vice President and Chief Information Officer for DMJM Harris, Inc., a subsidiary of AECOM Technology Corp., a global architecture, engineering and construction management firm, from 2002 to 2005. From 1999 to 2002, he was Director of Technical Services for Foster Wheeler Corp., an engineering and construction services firm. Mr. Petrisko studied management information technology at Thomas Edison State College and he is a member of the New Jersey Society of Information Management and a member of the CMAA.
Employees
At February 28, 2015, we had 4,558 personnel. Of these individuals 3,656 worked in our Project Management Group, 793 worked in our Construction Claims Group and 109 worked in our Corporate Group. Our personnel included 3,784 full-time employees, 248 part-time employees and 526 independent contractors. We are not a party to any collective bargaining agreements and we have not experienced any strikes or work stoppages. We consider our relationship with our employees to be satisfactory.
Access to Company Information
We electronically file our Annual Reports on Form 10-K, Quarterly Reports on Form 10-Q, Current Reports on Form 8-K and all amendments to those reports with the United States Securities and Exchange Commission (the “SEC”). The public may read and copy any of the reports that are filed with the SEC at the SEC’s Public Reference Room at 100 F Street, N.E., Washington, DC 20549. The public may obtain information on the operation of the Public Reference Room by calling the SEC at (800) SEC-0330. The SEC maintains an Internet site at www.sec.gov that contains periodic reports, proxy statements, information statements and other information regarding issuers that file electronically.
We make available, free of charge, through our website or by responding to requests addressed to our Legal Department, our Annual Reports on Form 10-K, Quarterly Reports on Form 10-Q, Current Reports on Form 8-K and all amendments to those reports filed by us with the SEC pursuant to Sections 13(a) and 15(d) of the Securities Exchange Act, as amended. These reports are available as soon as practicable after such material is filed with or furnished to the SEC. Our
primary website is www.hillintl.com. We post the charters for our audit, compensation and governance and nominating committees, corporate governance principles and code of ethics in the “Investor Relations” section of our website. The information contained on our website, or on other websites linked to our website, is not part of this document.
This Item 1A has been amended and restated to give effect to the restatement of the Company’s audited consolidated financial statements for the years ended December 31, 2014, 2013 and 2012 due to a change in the accounting treatment for the Libya Receivable and certain related liabilities as discussed in the Explanatory Note to this Amendment. See Note 1 to the consolidated financial statements in Item 8 of Part II of this report for additional information.
Our business involves a number of risks, some of which are beyond our control. The risks and uncertainties described below could individually or collectively have a material adverse effect on our business, assets, profitability or prospects. While these are not the only risks and uncertainties we face, we believe that the more significant risks and uncertainties are as follows:
Risks Affecting the Business
Acts of terrorism, political, governmental and social upheaval and threats of armed conflicts in or around various areas in which we operate could limit or disrupt markets and our operations, including disruptions resulting from the evacuation of personnel, cancellation of contracts or the loss of personnel.
Acts of terrorism, political, governmental and social upheaval and threats of armed conflicts in or around various areas in which we operate could limit or disrupt markets and our operations, including disruptions resulting from the evacuation of personnel, cancellation of contracts or the loss of personnel, and may affect timing and collectibility of our accounts receivable. Such events may cause further disruption to financial and commercial markets and may generate greater political and economic instability in some of the geographic areas in which we operate. In addition, any possible reprisals as a consequence of the wars and ongoing military action in the Middle East and Africa, such as acts of terrorism in the United States or elsewhere, could have a material adverse effect on our business, results of operations and financial position.
If our clients delay in paying or fail to pay amounts owed to us, it could have a material adverse effect on our liquidity, results of operations and financial condition.
Accounts receivable represent the largest asset on our balance sheet. While we take steps to evaluate and manage the credit risks relating to our clients, economic downturns or other events can adversely affect the markets we serve and our clients ability to pay, which could reduce our ability to collect all amounts due from clients. In addition, the political unrest in countries in which we operate has impacted and may in the future impact our collections on accounts receivable. If our clients delay in paying or fail to pay us a significant amount of our outstanding receivables, it could have a material adverse effect on our liquidity, results of operations, and financial condition.
Unfavorable global economic conditions could adversely affect our business, liquidity and financial results.
The markets that we serve are cyclical and subject to fluctuation based on general global economic conditions and other factors. Unfavorable global economic conditions, including disruption of financial markets in the United States, Europe and elsewhere, could adversely affect our business and results of operations, primarily by limiting our access to credit and disrupting our clients’ businesses. The reduction in financial institutions’ willingness or ability to lend has increased the cost of capital and reduced the availability of credit. Although we currently believe that the financial institutions with which we do business will be able to fulfill their commitments to us, there is no assurance that those institutions will be able or willing to continue to do so, which could have a material adverse impact on our business. The current European debt crisis and related European restructuring efforts may cause the value of European currencies, including the Euro and British pound sterling, to deteriorate, thus reducing the purchasing power of European clients and reducing the translated amounts of U.S. dollar revenues. For the year ended December 31, 2014, 13.7% of our consulting fee revenue was attributable to European clients. In addition, any negative change in general market conditions in the United States,
Europe or other national economies important to our businesses may adversely affect our clients’ level of spending, ability to obtain financing, and ability to make timely payments to us for our services, which could require us to increase our allowance for doubtful accounts, negatively impact our days sales outstanding and adversely affect our results of operations.
We may be unable to win new contract awards if we cannot provide clients with letters of credit, bonds or other forms of guarantees.
In certain international regions, primarily the Middle East, it is industry practice for clients to require letters of credit, bonds, bank guarantees or other forms of guarantees. These letters of credit, bonds or guarantees indemnify our clients if we fail to perform our obligations under our contracts. We currently have relationships with various domestic and international banking institutions to assist us in providing clients with letters of credit or guarantees. In the event there are limitations in worldwide banking capacity, we may find it difficult to find sufficient bonding capacity to meet our future bonding needs. Failure to provide credit enhancements on terms required by a client may result in our inability to compete or win a project.
International operations and doing business with foreign governments expose us to legal, political, operational and economic risks in different countries and currency exchange rate fluctuations could adversely affect our financial results.
Our international operations contributed 78.8%, 77.0% and 72.6% of our consulting fee revenue for the years ended December 31, 2014, 2013 and 2012, respectively. There are risks inherent in doing business internationally, including:
· Lack of developed legal systems to enforce contractual rights;
· Foreign governments may assert sovereign or other immunity if we seek to assert our contractual rights thus depriving us of any ability to seek redress against them;
· Greater difficulties in managing and staffing foreign operations;
· Differences in employment laws and practices which could expose us to liabilities for payroll taxes, pensions and other expenses;
· Inadequate or failed internal controls, processes, people, and systems associated with foreign operations;
· Increased logistical complexity;
· Increased selling, general and administrative expenses associated with managing a larger and more global business;
· Greater risk of uncollectible accounts and longer collection cycles;
· Currency exchange rate fluctuations;
· Restrictions on the transfer of cash from certain foreign countries;
· Imposition of governmental controls;
· Political and economic instability;
· Changes in U.S. and other national government policies affecting the markets for our services and our ability to do business with certain foreign governments or their political leaders;
· Conflict between U.S. and non-U.S. law;
· Changes in regulatory practices, tariffs and taxes;
· Less well established bankruptcy and insolvency procedures;
· Potential non-compliance with a wide variety of non-U.S. laws and regulations; and
· General economic, political and civil conditions in these foreign markets.
Any of these factors could have a material adverse effect on our business, results of operations, financial condition or cash flows.
We operate in many different jurisdictions and we could be adversely affected by any violations of the U.S. Foreign Corrupt Practices Act or similar worldwide and local anti-corruption laws.
The U.S. Foreign Corrupt Practices Act, the U.K. Bribery Act of 2010 and similar worldwide and local anti-corruption laws in other jurisdictions, generally prohibit companies and their intermediaries from making improper payments to
officials for the purpose of obtaining or retaining business. Our internal policies mandate compliance with these anti-corruption laws. The policies also are applicable to agents through which we do business in certain non-U.S. jurisdictions. We operate in many parts of the world that have experienced governmental corruption to some degree, and in certain circumstances, strict compliance with anti-corruption laws may conflict with local customs and practices. Despite our training and compliance programs, we cannot assure you that our internal control policies and procedures always will protect us from improper or criminal acts committed by our employees or agents. Our continued expansion outside the U.S., including in developing countries, could increase the risk of such violations in the future. Violations of these laws, or allegations of such violations, could disrupt our business, subject us to fines, penalties and restrictions and otherwise result in a material adverse effect on our results of operations or financial condition. All of our recently acquired businesses are subject to our internal policies. However, because our internal policies are more restrictive than some local laws or customs where we operate, we may be at an increased risk for violations while we train our new employees to comply with our internal policies and procedures.
Our business sometimes requires our employees to travel to and work in high security risk countries, which may result in employee injury, repatriation costs or other unforeseen costs.
Many of our employees often travel to and work in high security risk countries around the world that are undergoing or that may undergo political, social and economic upheavals resulting in war, civil unrest, criminal activity or acts of terrorism. For example, we have had and expect to have significant projects in the Middle East and Africa, including in Afghanistan, Iraq, Libya, Egypt, Saudi Arabia, Qatar and Oman. As a result, we may be subject to costs related to employee injury, repatriation or other unforeseen circumstances. Further, circumstances in these countries could make it difficult or impossible to attract and retain qualified employees. Our inability to attract and retain qualified employees to work in these counties could have a material adverse effect on our operations.
Our business is sensitive to oil and gas prices, and fluctuations in oil and gas prices may negatively affect our business.
Historically, oil and natural gas prices have been volatile and are subject to fluctuations in response to changes in supply and demand, market uncertainty and a variety of additional factors that are beyond our control. In 2014, approximately 51.3% of our consulting fee revenue was derived from our operations in major oil and gas producing countries in the Middle East and Africa. A significant drop in oil or gas prices could lead to a slowdown in construction in these regions, which could have a material adverse effect on our business, results of operations, financial condition and cash flows.
We depend on government contracts for a significant portion of our consulting fee revenue. Our inability to win profitable government contracts could harm our operations and adversely affect our net earnings.
In 2014, U.S. federal government contracts and U.S. state, regional and local government contracts contributed approximately 2.3% and 13.0%, respectively, of our consulting fee revenue, and foreign government contracts contributed approximately 38.3% of our consulting fee revenue. Our inability to win profitable government contracts could harm our operations and adversely affect our net earnings. Government contracts are typically awarded through a heavily regulated procurement process. Some government contracts are awarded to multiple competitors, causing increases in overall competition and pricing pressure. In turn, the competition and pricing pressure may require us to make sustained post-award efforts to reduce costs under these contracts. If we are not successful in reducing the amount of costs, our profitability on these contracts may be negatively impacted. Also, some of our federal government contracts require U.S. government security clearances. If we or certain of our personnel were to lose these security clearances, our ability to continue performance of these contracts or to win new contracts requiring such clearances may be negatively impacted.
We depend on long-term government contracts, many of which are funded on an annual basis. If appropriations are not made in subsequent years of a multiple-year contract, we will not realize all of our potential revenue and profit from that project.
A significant portion of our consulting fee revenue is derived from contracts with federal, state, regional, local and foreign governments. During the years ended December 31, 2014, 2013 and 2012, approximately 53.6%, 51.8% and 40.9%, respectively, of our consulting fee revenue were derived from such contracts.
Most government contracts are subject to the continuing availability of legislative appropriation. Legislatures typically appropriate funds for a given program on a year-by-year basis, even though contract performance may take more than one year. As a result, at the beginning of a program, the related contract is only partially funded, and additional funding is normally committed only as appropriations are made in each subsequent fiscal year. These appropriations and the timing of payment of appropriated amounts may be influenced by, among other things, the state of the economy, budgetary and other political issues affecting the particular government and its appropriations process, competing priorities for appropriation, the timing and amount of tax receipts and the overall level of government expenditures. If appropriations are not made in subsequent years on government contracts, then we will not realize all of our potential revenue and profit from those contracts.
We depend on contracts that may be terminated by our clients on short notice, which may adversely impact our ability to recognize all of our potential revenue and profit from the projects.
Substantially all of our contracts are subject to termination by the client either at its convenience or upon our default. If one of our clients terminates a contract at its convenience, then we typically are able to recover only costs incurred or committed, settlement expenses and profit on work completed prior to termination, which could prevent us from recognizing all of our potential revenue and profit from that contract. If one of our clients terminates the contract due to our default, we could be liable for excess costs incurred by the client in re-procuring services from another source, as well as other costs.
Our contracts with governmental agencies are subject to audit, which could result in adjustments to reimbursable contract costs or, if we are charged with wrongdoing, possible temporary or permanent suspension from participating in government programs.
Our books and records are subject to audit by the various governmental agencies we serve and by their representatives. These audits can result in adjustments to reimbursable contract costs and allocated overhead. In addition, if as a result of an audit, we or one of our subsidiaries is charged with wrongdoing or the government agency determines that we or one of our subsidiaries is otherwise no longer eligible for federal contracts, then we or, as applicable, that subsidiary, could be temporarily suspended or, in the event of convictions or civil judgments, could be prohibited from bidding on and receiving future government contracts for a period of time. Furthermore, as a U.S. government contractor, we are subject to an increased risk of investigations, criminal prosecution, civil fraud, whistleblower lawsuits and other legal actions and liabilities, the results of which could have a material adverse effect on our operations.
We submit change orders to our clients for work we perform beyond the scope of some of our contracts. If our clients do not approve these change orders, our net earnings could be adversely impacted.
We typically submit change orders under some of our contracts for payment for work performed beyond the initial contractual requirements. The clients may not approve or may contest these change orders and we cannot assure you that these claims will be approved in whole, in part or at all. If these claims are not approved, our net earnings could be adversely impacted.
Because our backlog of uncompleted projects under contract or awarded is subject to unexpected adjustments and cancellations, including the amount, if any, of future appropriations by the applicable contracting governmental agency, it may not be indicative of our future revenue and profits.
At December 31, 2014, our backlog of uncompleted projects under contract or awarded was approximately $1.036 billion. The inability to obtain financing or governmental approvals, changes in economic or market conditions or other unforeseen events, such as terrorist acts or natural disasters, could lead to us not realizing any revenue under some or all of these contracts. We cannot assure you that the backlog attributed to any of our uncompleted projects under contract will be realized as revenue or, if realized, will result in profits.
Many projects may remain in our backlog for an extended period of time because of the size or long-term nature of the contract. In addition, from time to time projects are scaled back or cancelled. These types of backlog reductions adversely affect the revenue and profit that we ultimately receive. Included in our backlog is the maximum amount of all indefinite
delivery/indefinite quantity (“ID/IQ”), or task order, contracts, or a lesser amount if we do not reasonably expect to be issued task orders for the maximum amount of such contracts. A significant amount of our backlog is derived from ID/IQ contracts and we cannot provide any assurance that we will in fact be awarded the maximum amount of such contracts.
Our dependence on subcontractors, partners and specialists could adversely affect our business.
We rely on third-party subcontractors as well as third-party strategic partners and specialists to complete our projects. To the extent that we cannot engage such subcontractors, partners or specialists or cannot engage them on a competitive basis, our ability to complete a project in a timely fashion or at a profit may be impaired. If we are unable to engage appropriate strategic partners or specialists in some instances, we could lose the ability to win some contracts. In addition, if a subcontractor or specialist is unable to deliver its services according to the negotiated terms for any reason, including the deterioration of its financial condition or over-commitment of its resources, we may be required to purchase the services from another source at a higher price. This may reduce the profit to be realized or result in a loss on a project for which the services were needed.
If our partners fail to perform their contractual obligations on a project, we could be exposed to legal liability, loss of reputation or reduced profits.
We sometimes enter into joint venture agreements and other contractual arrangements with outside partners to jointly bid on and execute a particular project. The success of these joint projects depends on the satisfactory performance of the contractual obligations of our partners. If any of our partners fails to satisfactorily perform its contractual obligations, we may be required to make additional investments and provide additional services to complete the project. If we are unable to adequately address our partner’s performance issues, then our client could terminate the joint project, exposing us to legal liability, loss of reputation or reduced profits.
The project management and construction claims businesses are highly competitive and if we fail to compete effectively, we may miss new business opportunities or lose existing clients and our revenues may decline.
The project management and construction claims industries are highly competitive. We compete for contracts, primarily on the basis of technical capability, with numerous entities, including design or engineering firms, general contractors, other “pure” construction management companies, other claims consulting firms, the “Big Four” and other accounting firms, management consulting firms and other entities. Compared to us, many of these competitors are larger, well-established companies that have broader geographic scope and greater financial and other resources. If we cannot compete effectively with our competitors, or if the costs of competing, including the costs of retaining and hiring professionals, become too expensive, our revenue growth and financial results may differ materially from our expectations.
We have acquired and may continue to acquire businesses as strategic opportunities arise and may be unable to realize the anticipated benefits of those acquisitions, or if we are unable to take advantage of strategic acquisition situations, our ability to expand our business may be slowed or curtailed.
Over the past 17 years, we have acquired 23 businesses and our strategy is to continue to expand and diversify our operations with additional acquisitions as strategic opportunities arise. If the competition for acquisitions increases, or if the cost of acquiring businesses or assets becomes too expensive, the number of suitable acquisition opportunities may decline, the cost of making an acquisition may increase or we may be forced to agree to less advantageous acquisition terms for the companies that we are able to acquire. Alternatively, at the time an acquisition opportunity presents itself, internal and external pressures (including, but not limited to, borrowing capacity under our credit facilities or the availability of alternative financing), may cause us to be unable to pursue or complete an acquisition. Our ability to grow our business, particularly through acquisitions, may depend on our ability to raise capital by selling equity or debt securities or obtaining additional debt financing. There can be no assurance that we will be able to obtain financing when we need it or on terms acceptable to us.
In addition, managing the growth of our operations will require us to continually increase and improve our operational, financial and human resources management and our internal systems and controls. If we are unable to manage growth
effectively or to successfully integrate acquisitions or if we are unable to grow our business, that could have a material adverse effect on our business.
Our effective tax rate may increase.
We are subject to income taxes in the U.S. and numerous foreign jurisdictions. Significant judgment is required in determining our worldwide provision for income taxes. In the ordinary course of our business, there are many transactions and calculations where the ultimate tax determination is uncertain. We are regularly under audit by tax authorities. Although we believe that our tax estimates and tax positions are reasonable, they could be materially affected by many factors including the final outcome of tax audits and related litigation, the introduction of new tax accounting standards, legislation, regulations, and related interpretations, our global mix of earnings, the realizability of deferred tax assets and changes in uncertain tax positions. A significant increase in our effective tax rate could have a material adverse effect on our financial condition and results of operations.
Systems and information technology interruption and breaches in data security could adversely impact our ability to operate and our operating results.
As a global company, we are heavily reliant on computer, information and communications technology and related systems in order to properly operate. From time to time, we experience system interruptions and delays. In the event we are unable to regularly deploy software and hardware, effectively upgrade our systems and network infrastructure, and take other steps to improve the efficiency and effectiveness of our systems, the operation of such systems could be interrupted or delayed, or our data security could be breached. In addition, our computer and communications systems and operations could be damaged or interrupted by natural disasters, power loss, telecommunications failures, acts of war or terrorism, acts of God, computer viruses, physical or electronic security breaches. Any of these or other events could cause system interruptions, delays, and loss of critical data including private data. While we have taken steps to address these concerns by implementing sophisticated network security and internal control measures, there can be no assurance that a system failure or loss or data security breach will not materially adversely affect our business, financial condition and operating results.
Risks Related to Ownership of Our Common Stock
We have restated our prior consolidated financial statements, which may lead to additional risks and uncertainties.
As described in greater detail in Note 1 to the consolidated financial statements included in Item 8 of this 2014 Annual Report on Form 10-K/A, we restated our consolidated financial statements for the each of the years ended December 31, 2014, 2013, and 2012 and for each of the quarters ended March 31, 2015 and June 30, 2015. In addition, we performed a re-evaluation of our internal controls over financial reporting. Based on the re-evaluation, management concluded that, as a result of the identified of material weaknesses, our internal controls over financial reporting were ineffective for each of the years ended December 31, 2014, 2013, and 2012 and for each of the quarters ended March 31, 2015 and June 30, 2015 (collectively, the “Restated Periods”). The determination to restate the financial statements for the Restated Periods was made by our Audit Committee upon management’s recommendation following the identification of errors related to the Libya Receivable. Due to the errors, our Audit Committee concluded that our previously issued financial statements for the Restated Periods should no longer be relied upon. our Annual Report on Form 10-K for the year ended December 31, 2014 and our Quarterly Reports on Form 10-Q for the quarters ended March 31, 2015 and June 30, 2015 have been amended to, among other things, reflect the restatement of our financial statements for the Restated Periods (the “Restatement”).
As a result of these events, we have become subject to a number of additional costs and risks, including unanticipated costs for accounting and legal fees in connection with or related to the Restatement and the remediation of our ineffective disclosure controls and procedures and material weaknesses in internal control over financial reporting. In addition, the attention of our management team has been diverted by these efforts. We could be subject to additional stockholder, governmental, or other actions in connection with the Restatement or other matters. Any such proceedings will, regardless of the outcome, consume management’s time and attention and may result in additional legal, accounting, insurance and other costs. If we do not prevail in any such proceedings, we could be required to pay substantial damages or settlement costs. In addition, the Restatement and related matters could impair our reputation or could cause our counterparties to lose confidence in us. Each of these occurrences could have a material adverse effect on our business, results of operations, financial condition and stock price which could, among other items, result in a default under the Company’s financing agreements.
We have identified a material weaknesses in our internal control over financial reporting and determined that our disclosure controls and procedures were not effective which could, if not remediated, result in additional material misstatements in our financial statements.
Our management is responsible for establishing and maintaining adequate disclosure controls and procedures and internal control over our financial reporting, as defined in Rules 13a-15(e) and 13a-15(f), respectively, under the Securities Exchange Act of 1934, as amended. As disclosed in Item 9A of this Form 10-K/A, management identified material weaknesses in our internal control over financial reporting and determined our disclosure controls and procedures were not effective based upon our identification of certain errors related to the estimation of potential losses on our accounts receivable. A material weakness is defined as a deficiency, or combination of significant deficiencies, in internal control over financial reporting, such that there is a more than a remote likelihood that a material misstatement of our annual or interim financial statements will not be prevented or detected on a timely basis. As a result of these material weaknesses, our management concluded that the Company did not maintain effective disclosure controls and procedures and internal control over financial reporting as of December 31, 2012. Our Annual Report on Form 10-K for the year ended December 31, 2014 and our Quarterly Reports on Form 10-Q for the quarters ended March 31, 2015 and June 30, 2015 have been amended to, among other things, reflect the change in management’s conclusion regarding the effectiveness of our disclosure controls and procedures and internal control over financial reporting as of December 31, 2012, as discussed in Item 9A of this Form 10-K/A.
We are actively engaged in developing a remediation plan designed to address these material weaknesses in internal control over financial reporting and ineffective disclosure controls and procedures. If our remedial measures are insufficient, or if additional material weaknesses or significant deficiencies in our internal controls are discovered or occur in the future, our consolidated financial statements may contain material misstatements and we could be required to restate our financial results, which could materially and adversely affect our business and results of operations or financial condition, restrict our ability to access the capital markets, require us to expend significant resources to correct the weaknesses or deficiencies, subject us to fines, penalties or judgments, harm our reputation or otherwise cause a decline in investor confidence.
Future sales of our common and preferred stock may depress the price of our common stock.
As of March 6, 2015, there were 50,373,757 shares of our common stock outstanding. An additional 8,327,626 shares of our common stock may be issued upon the exercise of options held by employees, management and directors. We also have the authority to issue up to 1,000,000 shares of preferred stock upon terms that are determined by our Board of Directors and additional options to purchase 1,088,974 shares of our common stock without stockholder approval. In addition, we have a registration statement on file with the SEC for the potential issuance of 20,000,000 common shares which may be used for working capital and general corporate purposes, subject to the restrictions of our Secured Credit Facilities and another registration statement on file with the SEC for the potential issuance of an additional 20,000,000 common shares which may be used in future acquisitions. Sales of a substantial number of these shares in the public market, or factors relating to the terms we may determine for our preferred stock, options or warrants, could decrease the market price of our common stock. In addition, the perception that such sales might occur may cause the market price of our common stock to decline. Future issuances or sales of our common stock could have an adverse effect on the market price of our common stock.
Because we have no current plans to pay cash dividends on our common stock, you may not receive any return on investment unless you sell your common stock for a price greater than that which you paid for it.
We may retain future earnings, if any, for future operations, expansion and debt repayment and have no current plans to pay any cash dividends. Any decision to declare and pay dividends in the future will be made at the discretion of our Board of Directors and will depend on, among other things, our results of operations, financial condition, cash requirements, contractual restrictions and other factors that our Board of Directors may deem relevant. In addition, our ability to pay dividends may be limited by covenants of any existing and future outstanding indebtedness we or our subsidiaries incur, including our Secured Credit Facilities. As a result, you may not receive any return on an investment in our common stock unless you sell our common stock for a price greater than that which you paid for it.
We are able to issue shares of preferred stock with greater rights than our common stock.
Our Board of Directors is authorized to issue one or more series of preferred stock from time to time without any action on the part of our stockholders. Our Board of Directors also has the power, without stockholder approval, to set the terms of any such series of preferred stock that may be issued, including voting rights, dividend rights and preferences over our common stock with respect to dividends and other terms. If we issue preferred stock in the future that has a preference over our common stock with respect to the payment of dividends or other terms, or if we issue preferred stock with voting rights that dilute the voting power of our common stock, the rights of holders of our common stock or the market price of our common stock could be adversely affected.
Provisions in our organizational documents and Delaware law could discourage potential acquisition proposals, could delay or prevent a change in control of the Company that our stockholders may consider favorable and could adversely affect the market value of our common stock.
Provisions in our organizational documents and Delaware law could discourage potential acquisition proposals, could delay or prevent a change in control of the Company that our stockholders may consider favorable and could adversely affect the market value of our common stock. Our amended and restated certificate of incorporation and amended and restated bylaws include provisions that:
· Our Board of Directors is expressly authorized to make, alter or repeal our bylaws;
· Our Board of Directors is divided into three classes of service with staggered three-year terms. This means that only one class of directors will be elected at each annual meeting of stockholders, with the other classes continuing for the remainder of their respective terms;
· Our Board of Directors is authorized to issue preferred stock without stockholder approval;
· Only our Board of Directors, our Chairman of the Board, our Chief Executive Officer or the holders of a majority in amount of our capital stock issued and outstanding and entitled to vote may call a special meeting of stockholders; this means that minority stockholders cannot force stockholder consideration of a proposal, including a proposal to replace our Board of Directors, by calling a special meeting of stockholders prior to such time authorized by our Board of Directors, our Chairman of the Board, our Chief Executive Officer or the holders of a majority in amount of our capital stock issued and outstanding and entitled to vote;
· Our bylaws require advance notice for stockholder proposals and director nominations;
· Our bylaws limit the removal of directors and the filling of director vacancies; and
· We will indemnify officers and directors against losses that may incur in connection with investigations and legal proceedings resulting from their services to us, which may include services in connection with takeover defense measures.
These provisions may make it more difficult for stockholders to take specific corporate actions and could have the effect of delaying or preventing a change in control of the Company.
In addition, Section 203 of the Delaware General Corporation Law imposes certain restrictions on mergers and other business combinations between the Company and any holder of 15% or more of our outstanding common stock. This provision is applicable to Hill and may have an anti-takeover effect that may delay, defer or prevent a tender offer or takeover attempt that a stockholder might consider in the stockholder’s best interest. In general, Section 203 could delay for three years and impose conditions upon “business combinations” between an “interested shareholder” and Hill, unless prior approval by our Board of Directors is given. The term “business combination” is defined broadly to include mergers, asset sales and other transactions resulting in financial benefit to a stockholder. An “interested shareholder,” in general, would be a person who, together with affiliates and associates, owns, or within three years, did own, 15% or more of a corporation’s voting stock.
A small group of stockholders own a large quantity of our common stock, thereby potentially exerting significant influence over the Company.
As of December 31, 2014, Irvin E. Richter, David L. Richter and other members of the Richter family beneficially owned approximately 22% of our common stock. This concentration of ownership could significantly influence matters requiring stockholder approval and could delay, deter or prevent a change in control of the Company or other business combinations that might otherwise be beneficial to our other stockholders. Accordingly, this concentration of ownership may impact the market price of our common stock. In addition, the interest of our significant stockholders may not always coincide with the interest of the Company’s other stockholders. In deciding how to vote on such matters, they may be influenced by interests that conflict with our other stockholders.
|
Unresolved Staff Comments. | |
|
|
|
|
|
None. |
|
|
|
|
Properties. |
Our executive and operating offices are currently located at 303 Lippincott Centre, Marlton, New Jersey 08053, however in the near future, we intend to complete our move of such offices to One Commerce Square, 2005 Market Street, 17th Floor, Philadelphia, Pennsylvania 19103. We lease all of our office space and do not own any real property. The telephone number at our executive office is (856) 810-6200. In addition to our executive offices, we have approximately 100 operating leases for office facilities throughout the world. Due to acquisition and growth we may have more than one operating lease in the cities in which we are located. Additional space may be required as our business expands geographically, but we believe we will be able to obtain suitable space as needed.
As of February 28, 2015, our principal worldwide office locations and the geographic regions in which we reflect their operations are:
|
U.S./Canada |
Europe |
Middle East |
|
Albuquerque, NM |
Amsterdam, Netherlands |
Abu Dhabi, UAE |
|
Atlanta, GA |
Ankara, Turkey |
Aqaba, Jordan |
|
Austin, TX |
Astana City, Kazakhstan |
Baghdad, Iraq |
|
Bensalem, PA |
Athens, Greece |
Doha, Qatar |
|
Boston, MA |
Baku, Azerbaijan |
Dubai, UAE |
|
Broadview Heights, OH |
Barcelona, Spain |
Erbil, Kurdistan |
|
Columbus, OH |
Belgrade, Serbia |
Jeddah, Saudi Arabia |
|
East Hartford, CT |
Birmingham, UK |
Kabul, Afghanistan |
|
Fresno, CA |
Bristol, UK |
Manama, Bahrain |
|
Granite Bay, CA |
Bucharest, Romania |
Muscat, Oman |
|
Houston, TX |
Cumbria, UK |
Riyadh, Saudi Arabia |
|
Irvine, CA |
Daresbury, UK |
Sharq, Kuwait |
|
Irving, TX |
Dundee, UK |
|
|
Jacksonville, FL |
Dusseldorf, Germany |
Africa |
|
Las Vegas, NV |
Edinburgh, Scotland |
Algiers, Algeria |
|
Lemont Furnace, PA |
Geneva, Switzerland |
Cairo, Egypt |
|
Los Angeles, CA |
Glasgow, UK |
Cape Town, South Africa |
|
Marlton, NJ |
Hamburg, Germany |
Casablanca, Morocco |
|
Miami, FL |
Istanbul, Turkey |
Johannesburg, South Africa |
|
Mission Viejo, CA |
London, UK |
Pretoria, South Africa |
|
New Orleans, LA |
Luxembourg |
Tripoli, Libya |
|
New York, NY |
Madrid, Spain |
|
|
Ontario, CA |
Munich, Germany |
Asia/Pacific |
|
Orlando, FL |
Pristina, Kosovo |
Beijing, China |
|
Perrysburg, OH |
Riga, Latvia |
Brisbane, Australia |
|
Philadelphia, PA |
Teesside, UK |
Da Nang City, Vietnam |
|
Phoenix, AZ |
Warsaw, Poland |
Gurgaon, India |
|
Pittsburgh, PA |
|
Hong Kong, China |
|
Providence, RI |
Latin America/ |
Kuala Lumpur, Malaysia |
|
San Diego, CA |
the Carribbean |
Manila, Philippines |
|
San Francisco, CA |
Bogota, Colombia |
Melbourne, Australia |
|
Seattle, WA |
Mexico City, Mexico |
Perth, Australia |
|
Spokane, WA |
Rio de Janeiro, Brazil |
Shanghai, China |
|
Tampa, FL |
Santiago, Chile |
Singapore |
|
Toronto, Canada |
Sao Paulo, Brazil |
Sydney, Australia |
|
Washington, DC |
Trinidad and Tobago |
|
|
Legal Proceedings. |
General Litigation
M.A. Angeliades, Inc. (“Plaintiff”) has filed a complaint with the Supreme Court of New York against the Company and the New York City Department of Design and Construction (“DDC”) regarding payment of approximately $8,771,000 for work performed as a subcontractor to the Company plus interest and other costs. The Company has accrued approximately $2,340,000, including interest of $448,000, based on invoices received from Plaintiff who has not provided certain invoices for the additional work that Plaintiff claims to have performed. Until such time as the Company obtains invoices for the additional work and is able to provide those invoices to DDC for reimbursement or there is a full resolution of the litigation, it has no intention of paying Plaintiff. The Company believes that its position is defensible, however, there can be no assurance that it will receive a favorable verdict should this case proceed to trial.
From time to time, the Company is a defendant or plaintiff in various legal actions which arise in the normal course of business. As such the Company is required to assess the likelihood of any adverse outcomes to these matters as well as potential ranges of probable losses. A determination of the amount of the provision required for these commitments and contingencies, if any, which would be charged to earnings, is made after careful analysis of each matter. The provision may change in the future due to new developments or changes in circumstances. Changes in the provision could increase or decrease the Company’s earnings in the period the changes are made. It is the opinion of management, after consultation with legal counsel, that the ultimate resolution of these matters will not have a material adverse effect on the Company’s financial condition, results of operations or cash flows.
|
Mine Safety Disclosures. | |
|
|
|
|
|
Not applicable. |
Item 5. Market for Registrant’s Common Equity, Related Stockholder Matters and Issuer Purchases of Equity Securities.
Market Information
Our common stock is traded on the New York Stock Exchange (“NYSE”) under the trading symbol “HIL.” The following table includes the range of high and low trading prices for our common stock as reported on the NYSE for the periods presented.
|
|
|
Price Range |
| ||||
|
|
|
High |
|
Low |
| ||
|
2014 |
|
|
|
|
| ||
|
Fourth Quarter |
|
$ |
4.07 |
|
$ |
2.83 |
|
|
Third Quarter |
|
6.39 |
|
3.61 |
| ||
|
Second Quarter |
|
7.57 |
|
4.89 |
| ||
|
First Quarter |
|
5.73 |
|
3.82 |
| ||
|
|
|
|
|
|
| ||
|
2013 |
|
|
|
|
| ||
|
Fourth Quarter |
|
$ |
3.95 |
|
$ |
3.22 |
|
|
Third Quarter |
|
3.30 |
|
2.61 |
| ||
|
Second Quarter |
|
3.32 |
|
2.52 |
| ||
|
First Quarter |
|
4.06 |
|
2.71 |
| ||
Stockholders
As of December 31, 2014, there were 82 holders of record of our common stock. However, a single record stockholder account may represent multiple beneficial owners, including owners of shares in street name accounts. We believe there are approximately 5,000 beneficial owners of our common stock.
Dividends
We have not paid any dividends on our common stock. The payment of dividends in the future will be contingent upon our earnings, if any, capital requirements and general financial condition of our business. Our Secured Credit Facilities currently limit the payment of dividends.
Securities Authorized for Issuance under Equity Compensation Plans
The table setting forth this information is included in Part III – Item 12. Security Ownership of Certain Beneficial Owners and Management and Related Stockholder Matters.
Recent Sales of Unregistered Securities
None.
Performance Graph
The performance graph and table below compare the cumulative total return of our common stock for the period December 31, 2009 to December 31, 2014 with the comparable cumulative total returns of the Russell 2000 Index (of which the Company is a component stock) and a peer group which consists of the following nine companies: AECOM Technology Corp. (ACM), Exponent, Inc. (EXPO), Fluor Corporation (FLR), ICF International, Inc. (ICFI), Jacobs
Engineering Group, Inc. (JEC), KBR, Inc. (KBR), Navigant Consulting, Inc. (NCI), Tutor Perini Corp. (TPC), and Tetra Tech, Inc. (TTEK). Our peer group previously included URS Corp., however, due to their acquisition by AECOM in October 2014, they are no longer trading and have been removed from this list.
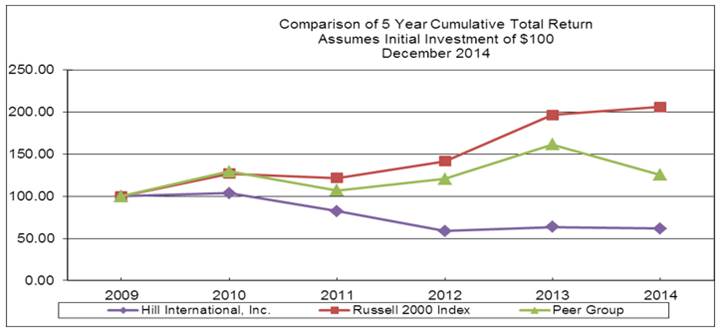
|
|
|
2009 |
|
2010 |
|
2011 |
|
2012 |
|
2013 |
|
2014 |
| ||||||
|
Hill International, Inc. |
|
$ |
100.00 |
|
$ |
103.69 |
|
$ |
82.37 |
|
$ |
58.65 |
|
$ |
63.30 |
|
$ |
61.54 |
|
|
Russell 2000 Index |
|
100.00 |
|
126.81 |
|
121.52 |
|
141.42 |
|
196.32 |
|
205.93 |
| ||||||
|
Peer Group |
|
100.00 |
|
129.46 |
|
107.01 |
|
120.54 |
|
161.34 |
|
125.37 |
| ||||||
Item 6. Selected Financial Data.
The following is selected financial data from the Company’s audited consolidated financial statements for each of the last five years. This data should be read in conjunction with the Company’s consolidated financial statements (and related notes) appearing elsewhere in this report and with Item 7, “Management’s Discussion and Analysis of Financial Condition and Results of Operations.” This Item 6 has been amended and restated to give effect to the restatement of the Company’s audited consolidated financial statements for the years ended December 31, 2014, 2013 and 2012 due to a change in the accounting treatment for the Libya Receivable and certain related liabilities as discussed in the Explanatory Note to this Amendment. See Note 1 to the consolidated financial statements in Item 8 of Part II of this report for additional information. The data presented below is in thousands, except for earnings (loss) per share data.
|
|
|
Years Ended December 31, |
| |||||||||||||
|
|
|
2014 |
|
2013 |
|
2012 |
|
2011 |
|
2010 |
| |||||
|
|
|
(Restated) |
|
(Restated) |
|
(Restated) |
|
|
|
|
| |||||
|
Income Statement Data: |
|
|
|
|
|
|
|
|
|
|
| |||||
|
Consulting fee revenue |
|
$ |
577,117 |
|
$ |
512,085 |
|
$ |
417,598 |
|
$ |
399,254 |
|
$ |
382,099 |
|
|
Reimbursable expenses |
|
64,476 |
|
64,596 |
|
63,183 |
|
102,202 |
|
69,659 |
| |||||
|
Total revenue |
|
641,593 |
|
576,681 |
|
480,781 |
|
501,456 |
|
451,758 |
| |||||
|
|
|
|
|
|
|
|
|
|
|
|
| |||||
|
Cost of services |
|
329,755 |
|
296,055 |
|
239,572 |
|
227,991 |
|
213,349 |
| |||||
|
Reimbursable expenses |
|
64,476 |
|
64,596 |
|
63,183 |
|
102,202 |
|
69,659 |
| |||||
|
Total direct expenses |
|
394,231 |
|
360,651 |
|
302,755 |
|
330,193 |
|
283,008 |
| |||||
|
|
|
|
|
|
|
|
|
|
|
|
| |||||
|
Gross profit |
|
247,362 |
|
216,030 |
|
178,026 |
|
171,263 |
|
168,750 |
| |||||
|
Selling, general and administrative expenses |
|
213,424 |
|
181,332 |
|
221,328 |
|
175,312 |
|
151,634 |
| |||||
|
Equity in earnings of affiliates |
|
— |
|
— |
|
— |
|
(190 |
) |
(1,503 |
) | |||||
|
|
|
|
|
|
|
|
|
|
|
|
| |||||
|
Operating profit (loss) |
|
33,938 |
|
34,698 |
|
(43,302 |
) |
(3,859 |
) |
18,619 |
| |||||
|
Interest and related financing fees, net |
|
30,485 |
|
22,864 |
|
18,150 |
|
7,262 |
|
3,144 |
| |||||
|
|
|
|
|
|
|
|
|
|
|
|
| |||||
|
Earnings (loss) before income taxes |
|
3,453 |
|
11,834 |
|
(61,452 |
) |
(11,121 |
) |
15,475 |
| |||||
|
Income tax expense (benefit) |
|
8,300 |
|
6,350 |
|
13,442 |
|
(6,186 |
) |
481 |
| |||||
|
Net (loss) earnings |
|
(4,847 |
) |
5,484 |
|
(74,894 |
) |
(4,935 |
) |
14,994 |
| |||||
|
|
|
|
|
|
|
|
|
|
|
|
| |||||
|
Less: net earnings - noncontrolling interests |
|
1,301 |
|
1,922 |
|
1,872 |
|
1,082 |
|
778 |
| |||||
|
|
|
|
|
|
|
|
|
|
|
|
| |||||
|
Net (loss) earnings attributable to Hill International, Inc. |
|
$ |
(6,148 |
) |
$ |
3,562 |
|
$ |
(76,766 |
) |
$ |
(6,017 |
) |
$ |
14,216 |
|
|
|
|
|
|
|
|
|
|
|
|
|
| |||||
|
Basic (loss) earnings per common share - Hill International, Inc. |
|
$ |
(0.14 |
) |
$ |
0.09 |
|
$ |
(1.99 |
) |
$ |
(0.16 |
) |
$ |
0.36 |
|
|
Basic weighted average common shares outstanding |
|
44,370 |
|
39,098 |
|
38,500 |
|
38,414 |
|
39,258 |
| |||||
|
Diluted (loss) earnings per common share - Hill International, Inc. |
|
$ |
(0.14 |
) |
$ |
0.09 |
|
$ |
(1.99 |
) |
$ |
(0.16 |
) |
$ |
0.36 |
|
|
Diluted weighted average common shares outstanding |
|
44,370 |
|
39,322 |
|
38,500 |
|
38,414 |
|
39,824 |
| |||||
|
|
|
As of December 31, |
| |||||||||||||
|
|
|
2014 |
|
2013 |
|
2012 |
|
2011 |
|
2010 |
| |||||
|
|
|
(Restated) |
|
(Restated) |
|
(Restated) |
|
|
|
|
| |||||
|
Selected Balance Sheet Data: |
|
|
|
|
|
|
|
|
|
|
| |||||
|
Cash and cash equivalents |
|
$ |
30,124 |
|
$ |
30,381 |
|
$ |
16,716 |
|
$ |
17,924 |
|
$ |
39,406 |
|
|
Accounts receivable, net |
|
195,098 |
|
174,685 |
|
151,239 |
|
197,906 |
|
180,856 |
| |||||
|
Current assets |
|
263,164 |
|
245,638 |
|
202,838 |
|
231,833 |
|
237,466 |
| |||||
|
Total assets |
|
419,609 |
|
393,476 |
|
363,905 |
|
407,512 |
|
370,851 |
| |||||
|
Current liabilities |
|
141,700 |
|
142,072 |
|
140,916 |
|
108,800 |
|
104,465 |
| |||||
|
Total debt |
|
128,236 |
|
133,261 |
|
109,456 |
|
94,759 |
|
74,959 |
| |||||
|
Stockholders’ equity: |
|
|
|
|
|
|
|
|
|
|
| |||||
|
Hill International, Inc. share of equity |
|
$ |
113,288 |
|
$ |
84,969 |
|
$ |
78,997 |
|
$ |
154,136 |
|
$ |
161,091 |
|
|
Noncontrolling interests |
|
8,712 |
|
11,887 |
|
13,557 |
|
18,258 |
|
7,005 |
| |||||
|
Total equity |
|
$ |
122,000 |
|
$ |
96,856 |
|
$ |
92,554 |
|
$ |
172,394 |
|
$ |
168,096 |
|
Item 7. Management’s Discussion and Analysis of Financial Condition and Results of Operations.
This Item 7 has been amended and restated to give effect to the restatement of the Company’s audited consolidated financial statements for the years ended December 31, 2014, 2013 and 2012 due to a change in the accounting treatment for the Libya Receivable and certain related assets and liabilities as discussed in the Explanatory Note to this Amendment. See Note 1 to the consolidated financial statements in Item 8 of Part II of this report for additional information.
Overview
Our revenue consists of two components: consulting fee revenue (“CFR”) and reimbursable expenses. Reimbursable expenses are reflected in equal amounts in both total revenue and total direct expenses. Because these pass-through revenue/costs are subject to significant fluctuation from year to year, we measure the performance of many of our key operating metrics as a percentage of CFR, as we believe that this is a better and more consistent measure of operating performance than total revenue.
CFR increased $65,032,000, or 12.7%, to $577,117,000 in 2014. CFR for the Project Management segment increased $36,225,000, or 9.2%, principally due to increased work in the Middle East, primarily in Oman, Qatar, Iraq and the United Arab Emirates. CFR for the Construction Claims segment increased by $28,807,000, or 24.1%, due primarily to increased work in the United Kingdom, the Middle East and Asia/Pacific.
Cost of services increased $33,700,000, or 11.4%, to $329,755,000 in 2014 primarily as a result of an increase in employees and other direct expenses related to the additional work in the Middle East and Asia/Pacific.
Gross profit increased $31,332,000, or 14.5%, to $247,362,000 in 2014 due to the increases in CFR. Gross profit as a percent of CFR increased to 42.9% in 2014 from 42.2% in 2013.
Selling, general and administrative expenses increased $32,092,000, or 17.7%, principally due to the unapplied portion of salaries for new staff hired to support the increase in CFR and an increase in indirect salaries in support of that growth. Selling, general and administrative expenses were reduced in 2014 by a net credit of $4,948,000 related to the Libya Receivable compared to a net credit of $2,240,000 related to the Libya Receivable and a credit of $3,693,000 resulting from the elimination of a reserve for employment tax liabilities in 2013. Excluding these discrete items, as a percentage of CFR, selling, general and administrative expenses increased to 37.8% in 2014 compared to 36.6% in 2013.
Operating profit was $33,938,000 in 2014 compared to $34,698,000 in 2013. The decrease in operating profit was primarily due to an increase in selling, general and administrative expenses.
Income tax expense was $8,300,000 for 2014 compared to $6,350,000 for 2013. The increase in expense results from increased pretax profits from foreign operations, the mix of tax rates in those jurisdictions and no offsetting tax benefits arising from the Company’s U.S. net operating losses which management believes the Company will not be able to utilize.
Net loss attributable to Hill was ($6,148,000) in 2014 compared to net earnings of $3,562,000 in 2013. Diluted loss per common share was ($0.14) in 2014 based upon 44,370,000 diluted common shares outstanding compared to a net income per diluted common share of $0.09 in 2013 based upon 39,322,000 diluted common shares outstanding.
The Company has open but inactive contracts with the Libyan Organization for the Development and Administrative Centres (“ODAC”). Due to the civil unrest which commenced in Libya in February 2011, the Company suspended its operations in and demobilized substantially all of its personnel from Libya. At December 31, 2012, the Libya Receivable was approximately $59,937,000; however, because the political instability and economic uncertainty within Libya may have a detrimental effect on the collectability of the accounts receivable and because a promised payment of $31,600,000 in 2011 never materialized, we established a reserve against the entire Libya Receivable amounting to $59,937,000 and eliminated $11,388,000 of certain assets and liabilities related to the Libya Receivable in 2012 resulting in a net charge to selling, general and administrative expenses of $48,549,000 in 2012. We received payments on the Libya Receivable of approximately $2,880,000 and $6,631,000 in 2013 and 2014, respectively, and have paid agency fees and certain taxes
amounting to $640,000 and $1,683,000 in 2013 and 2014, respectively. We have accounted for these transactions as a net reduction of selling, general and administrative expenses of $2,240,000 and $4,948,000 in 2013 and 2014, respectively.
In 2014, we received $38,042,000 from a secondary offering of our common stock and $120,000,000 from proceeds of a new term loan, the proceeds of which were used to pay down and terminate our 2009 Credit Agreement of $25,500,000 and 2012 Term Loan of $100,000,000. We also entered into new revolving credit facilities. For further information regarding our new term loan, new revolving credit facilities, 2009 Credit Agreement, 2012 Term Loan, please see Note 10 to our consolidated financial statements.
We remain optimistic about maintaining our current growth strategy to pursue new business development opportunities, continue to take advantage of organic growth opportunities, continue to pursue acquisitions and strengthen our professional resources. Among other things, our optimism stems from the growth of our backlog at December 31, 2014. Our total backlog is a record $1,036,000,000, an increase of $7,000,000 from September 30, 2014 and $53,000,000 from December 31, 2013. Our 12-month backlog is also a record $467,000,000, an increase of $10,000,000 from September 30, 2014 and $77,000,000 from December 31, 2013. These increases are primarily related to significant new work in the Middle East and the United States.
Critical Accounting Policies and Estimates
Our consolidated financial statements were prepared in accordance with U.S. generally accepted accounting principles, which require us to make subjective decisions, assessments and estimates about the effect of matters that are inherently uncertain. As the number of variables and assumptions affecting the judgment increases, such judgments become even more subjective. While we believe our assumptions are reasonable and appropriate, actual results may be materially different than estimated.
Revenue Recognition
We generate revenue primarily from providing professional services to our clients. Revenue is generally recognized upon the performance of services. In providing these services, we may incur reimbursable expenses, which consist of amounts paid to subcontractors and other third parties as well as travel and other job related expenses that are contractually reimbursable from clients. We will include reimbursable expenses in computing and reporting our total contract revenue as long as we remain responsible to the client for the fulfillment of the contract and for the overall acceptability of all services provided.
We earn our revenue from cost-plus, fixed-price and time-and-materials contracts. If estimated total costs on any contract indicate a loss, we charge the entire estimated loss to operations in the period the loss becomes known. The cumulative effect of revisions to revenue, estimated costs to complete contracts, including penalties, incentive awards, change orders, claims, anticipated losses, and other effects are recorded in the accounting period in which the events indicating a loss are known and the loss can be reasonably estimated. Such revisions could occur at any time and the effects may be material.
The majority of our contracts are for work where we bill the client monthly at hourly billing rates. The hourly billing rates are determined by contract terms. For governmental clients, the hourly rates are generally calculated as either (i) a negotiated multiplier of our direct labor costs or (ii) as direct labor costs plus overhead costs plus a negotiated profit percentage. For commercial clients, the hourly rates are generally taken from a standard fee schedule by staff classification or they can be at a negotiated discount from this schedule. In some cases, primarily for foreign work, a fixed monthly staff rate is negotiated rather than an hourly rate. This monthly rate is determined based upon a buildup of direct labor costs plus overhead and profit. We account for these contracts on a time-and-expenses method, recognizing revenue as costs are incurred.
We account for fixed-price contracts on the “percentage-of-completion” method, wherein revenue is recognized as costs are incurred. Under the percentage-of-completion method for revenue recognition, we estimate the progress towards completion to determine the amount of revenue and profit to be recognized. We generally utilize a cost-to-cost approach in applying the percentage-of-completion method, where revenue is earned in proportion to total costs incurred divided by total costs expected to be incurred.
Under the percentage-of-completion method, recognition of profit is dependent upon the accuracy of estimates. We have a history of making reasonably dependable estimates of contract revenue, the extent of progress towards completion and contract completion costs on our long-term construction management contracts. However, due to uncertainties inherent in the estimation process, it is possible that actual completion costs may vary from estimates.
Allowance for Doubtful Accounts
We make ongoing estimates relating to the collectability of our accounts receivable and maintain an allowance for estimated losses resulting from the inability of our clients to make required payments. Estimates used in determining accounts receivable allowances are based on specific client account reviews and historical experience of credit losses. We also apply judgment including assessments about changes in economic conditions, concentration of receivables among clients and industries, recent write-off trends, rates of bankruptcy, and credit quality of specific clients. Unanticipated changes in the financial condition of clients, the resolution of various disputes, or significant changes in the economy could impact the reserves required. At December 31, 2014 and 2013, the allowance for doubtful accounts was $60,801,000 and $66,856,000, respectively.
Goodwill and Other Intangible Assets
Goodwill is tested annually for impairment in our third fiscal quarter or more frequently if events or circumstances indicate that there may be an impairment. We have determined that we have two reporting units, the Project Management unit and the Construction Claims unit. We made that determination based on the similarity of the services provided, the methodologies in delivering our services and the similarity of the client base in each of these units. To determine the fair value of our reporting units, we use the market approach and the income approach, weighting the results of each approach.
Under the market approach, we determine fair value using the public company method and the quoted price method. We utilized a control premium of 30% to arrive at the preliminary fair value for each reporting unit, and we applied a weighting of 20% to the preliminary fair value determined by using the public company method. The quoted price method is based upon the market value of the transactions of minority interests in the publicly-traded shares of the Company. We utilized a control premium of 30% to arrive at the preliminary fair value for each reporting unit, and we applied a weighting of 50% to the preliminary fair value determined using the quoted price method.
Our calculation under the income approach utilizes our internal forecasts. In the income approach (that is, the discounted cash flow method), the projected cash flows reflect the cash flows subsequent to the sale of the reporting unit pursuant to the guidance in ASC 350 and ASC 820. Consistent with applicable literature, we include in projected cash flows any expected improvements in cash flows or other changes that, in our view, a market participant would consider and be willing to pay for (but we exclude any buyer- or entity-specific synergies). The projections are developed by us and are based upon cash flows that maximize reporting unit value by taking into account improvements that controlling-interest holders can make, but minority interest holders cannot make. These improvements include: increasing revenues, reducing operating costs, or reducing non-operating costs such as taxes. The owners of the enterprise may also increase enterprise value by reducing risk; for example, by diversifying the business, improving access to capital, increasing the certainty of cash flows, or optimizing the capital structure.
We considered the factors listed above when developing the cash flows to support the income approach. Recognizing that due to elements of control incorporated into our reporting units’ forecasts, we applied no control premium to our conclusion of value indicated by the discounted cash flows. In determining fair value, we applied a weighting of 30% to the preliminary fair value determined using the income approach.
With regard to weighting the conclusions rendered by the approaches utilized, we believe that the quoted price method provides the most reliable indication of value (that is, a Level 1 input); therefore, we placed the greatest emphasis upon this method assigning a 50% weighting. We also determined that the value using the discounted cash flow method (to which we assigned a 30% weighting) provided a more reliable indication of value than the public company method (to which we assigned a 20% weighting) with the relative levels of reliability contributing to the weighting accorded to each approach.
Application of the goodwill impairment test requires significant judgments including estimation of future cash flows, which is dependent on internal forecasts, estimation of the long-term rate of growth for each reporting unit, the period over which cash flows will occur, and determination of the weighted average cost of capital, among other things. Based on the valuation as of July 1, 2014, the fair values of the Project Management unit and the Construction Claims unit substantially exceeded their carrying values. Changes in these estimates and assumptions could materially affect our determination of fair value and/or goodwill impairment for each reporting unit. Changes in future market conditions, our business strategy, or other factors could impact upon the future values of Hill’s reporting units, which could result in future impairment charges.
We amortize other intangible assets over their estimated useful lives and review the long-lived assets for impairment whenever events or changes in circumstances indicate that the related carrying amounts may not be recoverable. Determining whether impairment has occurred typically requires various estimates and assumptions, including determining which cash flows are directly related to the potentially impaired asset, the useful life over which cash flows will occur, their amount and the asset’s residual value, if any. In turn, measurement of an impairment loss requires a determination of fair value, which is based on the best information available. We use internal discounted cash flow estimates, quoted market prices when available and independent appraisals, as appropriate, to determine fair value. We derive the required cash flow estimates from our historical experience and our internal business plans and apply an appropriate discount rate.
Income Taxes
We make judgments and interpretations based on enacted tax laws, published tax guidance, as well as estimates of future earnings. These judgments and interpretations affect the provision for income taxes, deferred tax assets and liabilities and the valuation allowance. We evaluate the deferred tax assets to determine on the basis of objective factors whether the net assets will be realized through future years’ taxable income. In the event that actual results differ from these estimates and assessments, additional valuation allowances may be required.
We will recognize a tax benefit in the financial statements for an uncertain tax position only if management’s assessment is that the position is “more likely than not” (i.e., a likelihood greater than 50 percent) to be allowed by the tax jurisdiction based solely on the technical merits of the position. The term “tax position” refers to a position in a previously filed tax return or a position expected to be taken in a future tax return that is reflected in measuring current or deferred income tax assets and liabilities for interim or annual periods.
Stock Options
We recognize compensation expense for all stock-based awards. These awards have included stock options and restricted stock grants. While fair value may be readily determinable for awards of stock, market quotes are not available for long-term, nontransferable stock options because these instruments are not traded. We currently use the Black-Scholes option pricing model to estimate the fair value of options. Option valuation models require the input of highly subjective assumptions, including but not limited to stock price volatility, expected life and stock option exercise behavior.
Contingencies
Estimates are inherent in the assessment of our exposure to insurance claims that fall below policy deductibles and to litigation and other legal claims and contingencies, as well as in determining our liabilities for incurred but not reported insurance claims. Significant judgments by us and reliance on third-party experts are utilized in determining probable and/or reasonably estimable amounts to be recorded or disclosed in our financial statements. The results of any changes in accounting estimates are reflected in the financial statements of the period in which the changes are determined. We do not believe that material changes to these estimates are reasonably likely to occur.
Results of Operations
Year Ended December 31, 2014 Compared to
Year Ended December 31, 2013
Consulting Fee Revenue (“CFR”) (dollars in thousands)
|
|
|
2014 |
|
2013 |
|
Change |
| |||||||||
|
|
|
(Restated) |
|
(Restated) |
|
(Restated) |
| |||||||||
|
Project Management |
|
$ |
428,827 |
|
74.3 |
% |
$ |
392,602 |
|
76.7 |
% |
$ |
36,225 |
|
9.2 |
% |
|
Construction Claims |
|
148,290 |
|
25.7 |
|
119,483 |
|
23.3 |
|
28,807 |
|
24.1 |
| |||
|
Total |
|
$ |
577,117 |
|
100.0 |
% |
$ |
512,085 |
|
100.0 |
% |
$ |
65,032 |
|
12.7 |
% |
The increase in CFR included an organic increase of 11.1% primarily in the Middle East and an increase of 1.6% due to the acquisitions of Binnington Copeland & Associates (Pty.) Ltd (“BCA”) in May 2013, Collaborative Partners, Inc. (“CPI”) in December 2013 and Angus Octan Scotland Ltd. d/b/a Cadogans in October 2014.
The increase in Project Management CFR included an organic increase of 7.7% and an increase of 1.5% from the acquisition of CPI. The increase in CFR consisted of a $34,173,000 increase in foreign projects and an increase of $2,052,000 in domestic projects. The increase in foreign Project Management CFR included an increase from new work of $14,049,000 in Oman, $10,788,000 in Qatar and $8,760,000 in Iraq. These increases were partially offset by a decrease of $10,062,000 in Brazil primarily due to an economic slowdown in 2014 and a decrease of $4,079,000 in Azerbaijan. The increase in domestic Project Management CFR was due primarily to an increase of $5,868,000 due to the acquisition of CPI, partially offset by a decrease in our Southern U.S. region.
The increase in Construction Claims CFR was comprised of an organic increase of 21.8% and an increase of 2.3% from the acquisitions of BCA and Cadogans. The organic increase was primarily due to increases in Asia/Pacific, the United Kingdom and the Middle East.
Reimbursable Expenses
|
|
|
2014 |
|
2013 |
|
Change |
| |||||||||
|
|
|
(dollars in thousands) |
| |||||||||||||
|
Project Management |
|
$ |
58,927 |
|
91.4 |
% |
$ |
59,915 |
|
92.8 |
% |
$ |
(988 |
) |
(1.6 |
)% |
|
Construction Claims |
|
5,549 |
|
8.6 |
|
4,681 |
|
7.2 |
|
868 |
|
18.5 |
| |||
|
Total |
|
$ |
64,476 |
|
100.0 |
% |
$ |
64,596 |
|
100.0 |
% |
$ |
(120 |
) |
(0.2 |
)% |
Reimbursable expenses consist of amounts paid to subcontractors and other third parties, and travel and other job-related expenses that are contractually reimbursable from clients. These items are reflected as separate line items in both our total revenue and total direct expenses captions in our consolidated statements of operations. The decrease in Project Management reimbursable expense is primarily due to lower use of subcontractors in our Northeast U.S. region, partially offset by increased subcontractors in Oman and the Western U.S. region. The increase in Construction Claims reimbursable expenses was due primarily to increases in the United Kingdom due to increased use of subcontractors plus increases in other reimbursable expenses associated with the higher work volume.
Cost of Services (dollars in thousands)
|
|
|
2014 |
|
2013 |
|
Change |
| |||||||||||||
|
|
|
(Restated) |
|
|
|
|
|
|
|
(Restated) |
| |||||||||
|
|
|
|
|
|
|
% of |
|
|
|
|
|
% of |
|
|
|
|
| |||
|
|
|
|
|
|
|
CFR |
|
|
|
|
|
CFR |
|
|
|
|
| |||
|
Project Management |
|
$ |
263,806 |
|
80.0 |
% |
61.5 |
% |
$ |
244,003 |
|
82.4 |
% |
62.2 |
% |
$ |
19,803 |
|
8.1 |
% |
|
Construction Claims |
|
65,949 |
|
20.0 |
|
44.5 |
|
52,052 |
|
17.6 |
|
43.6 |
|
13,897 |
|
26.7 |
| |||
|
Total |
|
$ |
329,755 |
|
100.0 |
% |
57.1 |
% |
$ |
296,055 |
|
100.0 |
% |
57.8 |
% |
$ |
33,700 |
|
11.4 |
% |
Cost of services consists of labor expenses for time charged directly to contracts and non-reimbursable job-related travel and out-of-pocket expenses. The increase in Project Management cost of services is primarily due to an increase in the Middle East in support of increased work there and to a lesser degree to the CPI acquisition, partially offset by a decrease in Brazil.
The increase in the cost of services for Construction Claims was due primarily to increases in direct costs in the United Kingdom, the Middle East and Asia/Pacific in support of the increased CFR.
Gross Profit (dollars in thousands)
|
|
|
2014 |
|
2013 |
|
Change |
| |||||||||||||
|
|
|
(Restated) |
|
|
|
|
|
|
|
(Restated) |
| |||||||||
|
|
|
|
|
|
|
% of |
|
|
|
|
|
% of |
|
|
|
|
| |||
|
|
|
|
|
|
|
CFR |
|
|
|
|
|
CFR |
|
|
|
|
| |||
|
Project Management |
|
$ |
165,021 |
|
66.7 |
% |
38.5 |
% |
$ |
148,599 |
|
68.8 |
% |
37.8 |
% |
$ |
16,422 |
|
11.1 |
% |
|
Construction Claims |
|
82,341 |
|
33.3 |
|
55.5 |
|
67,431 |
|
31.2 |
|
56.4 |
|
14,910 |
|
22.1 |
| |||
|
Total |
|
$ |
247,362 |
|
100.0 |
% |
42.9 |
% |
$ |
216,030 |
|
100.0 |
% |
42.2 |
% |
$ |
31,332 |
|
14.5 |
% |
The increase in Project Management gross profit included an increase of $15,815,000 from international operations, primarily due to increases from the Middle East, principally Oman, Qatar and Iraq, partially offset by decreases in Brazil and Azerbaijan.
The increase in Construction Claims gross profit was driven by increases in the United Kingdom, the Middle East, South Africa and Asia/Pacific.
The overall gross profit percentage increased slightly due to higher margins achieved on new work in the Middle East, primarily Oman and Qatar for Project Management.
Selling, General and Administrative (“SG&A”) Expenses (dollars in thousands)
|
|
|
2014 |
|
2013 |
|
Change |
| |||||||||
|
|
|
(Restated) |
|
(Restated) |
|
(Restated) |
| |||||||||
|
|
|
|
|
% of |
|
|
|
% of |
|
|
|
|
| |||
|
|
|
|
|
CFR |
|
|
|
CFR |
|
|
|
|
| |||
|
SG&A Expenses |
|
$ |
213,424 |
|
37.0 |
% |
$ |
181,332 |
|
35.4 |
% |
$ |
32,092 |
|
17.7 |
% |
Discrete items which impacted SG&A expenses are as follows:
· A net credit of $4,948,000 in 2014 as a result of cash recoveries against the Libya Receivable;
· A net credit of $2,240,000 in 2013 as a result of cash recoveries against the Libya Receivable; and
· A credit of $3,693,000 in 2013 resulting from the elimination, net of foreign exchange effects, of a reserve for a foreign subsidiary’s potential employment tax liabilities which were indemnified by the former shareholders of the subsidiary.
Other significant components of the change in SG&A are as follows:
· An increase of $16,648,000 in unapplied labor primarily due to the impact of new hires, salary increases and a decrease in utilization in the early part of 2014. There was an increase of approximately $7,551,000 for new staff required on increased work volume in the Middle East for Project Management and in the United Kingdom and Asia/Pacific for Construction Claims, an increase of approximately $2,910,000 primarily for new staff hired in the Middle East to support expanded Construction Claims work which started later than anticipated in 2014 and an increase of $1,627,000 in the U.S. Project Management Group due to decreased utilization in the first half of the year. Unapplied labor also increased by approximately $1,890,000 due to the acquisitions of BCA, CPI and Cadogans;
· An increase in indirect labor of $6,813,000 primarily due to salary increases, new hires for business development in the Project Management Group and increased staff in support of the growth in the Middle East;
· An increase of $1,770,000 in administrative travel in support of growth in international operations;
· An increase of $1,765,000 in business development related costs including advertising and proposal-related costs;
· An increase of $1,429,000 in information technology related costs to support our global growth; and
· An increase of $1,395,000 in bad debt expense.
Operating Profit (dollars in thousands)
|
|
|
2014 |
|
2013 |
|
Change |
| |||||||||
|
|
|
(Restated) |
|
(Restated) |
|
(Restated) |
| |||||||||
|
|
|
|
|
% of |
|
|
|
% of |
|
|
|
|
| |||
|
|
|
|
|
CFR |
|
|
|
CFR |
|
|
|
|
| |||
|
Project Management |
|
$ |
53,174 |
|
12.4 |
% |
$ |
50,922 |
|
13.0 |
% |
$ |
2,252 |
|
4.4 |
% |
|
Construction Claims |
|
10,996 |
|
7.4 |
|
12,171 |
|
10.2 |
|
(1,175 |
) |
(9.7 |
) | |||
|
Corporate |
|
(30,232 |
) |
|
|
(28,395 |
) |
|
|
(1,837 |
) |
6.5 |
| |||
|
Total |
|
$ |
33,938 |
|
5.9 |
% |
$ |
34,698 |
|
6.8 |
% |
$ |
(760 |
) |
(2.2 |
)% |
The increase in Project Management operating profit is primarily due to a $4,948,000 net credit related to Libya Receivable transactions compared to a net credit of $2,240,000 in 2013. Otherwise, Project Management operating profit included decreases in Brazil and Europe, partially offset by increases in the Middle East, primarily Oman, Qatar and Iraq.
The decrease in Construction Claims operating profit was primarily due to decreases in the Middle East and the United Kingdom, partially offset by an increase in Asia/Pacific.
Corporate expenses increased $1,837,000 which was primarily due to salary increases and information technology costs in support of growing operations overseas. Corporate expenses increased by 6.5% compared to an increase of 12.4% in CFR. Corporate expenses represented 5.3% of CFR in 2014 compared to 5.5% in 2013.
Interest and related financing fees, net
Interest and related financing fees increased $7,621,000 to $30,485,000 in 2014 as compared with $22,864,000 in 2013, primarily due to $9,338,000 of accelerated interest paid upon the early payoff and termination of the 2012 Term Loan and the write off of $1,482,000 of deferred financing fees related to the early payoff and termination of the Company’s 2009 Credit Facility and 2012 Term Loan in September 2014.
Income Taxes
In 2014, the income tax expense was $8,300,000 compared to an income tax expense of $6,350,000 in 2013. The
effective income tax expense rates for 2014 and 2013 were 240.4% and 53.7%, respectively. The increase in expense results from increased pretax profits from foreign operations, the mix of tax rates in those jurisdictions and no offsetting tax benefits arising from the Company’s U.S. net operating losses which management believes the Company will not be able to utilize. The difference in the Company’s 2014 effective tax rate compared to the 2013 rate is primarily related to a significant increase in the U.S. pretax loss in 2014 primarily due to the recognition of an additional $10,820,000 of interest expense related to the refinancing and early termination of the Company’s former senior credit facility and term loan during the third quarter of 2014. In both years, the Company’s effective tax rate is significantly higher than it otherwise would be primarily as a result of not being able to record an income tax benefit related to the U.S. net operating loss plus increases caused by various foreign withholding taxes.
In 2014, several items materially affected the Company’s effective tax rate. The Company realized a net benefit of $2,379,000 primarily from the reversal of prior year’s uncertain tax positions based on management’s assessment that these items were effectively settled with the appropriate foreign tax authorities. An income tax expense of $552,000 resulted from adjustments to agree the 2013 book amount to the actual amounts reported on the tax returns in foreign jurisdictions.
Several items materially affected the Company’s effective tax rate during 2013. The Company realized a net benefit of $2,314,000 primarily from the reversal of prior year’s uncertain tax position based on management’s assessment that these items were effectively settle with the appropriate foreign tax authorities. An income tax expense of $386,000 resulted from adjustments to agree the 2012 book amount to the actual amounts reported on the tax returns, primarily in foreign jurisdictions. In addition, the Company recognized higher foreign withholding taxes in 2013 which were partially offset by the true-up of income tax accounts in foreign jurisdictions.
Net (Loss) Earnings Attributable to Hill
Net loss attributable to Hill International, Inc. for 2014 was ($6,148,000), or ($0.14) per diluted common share based on 44,370,000 diluted common shares outstanding, as compared to net earnings for 2013 of $3,562,000, or $0.09 per diluted common share based upon 39,322,000 diluted common shares outstanding.
Year Ended December 31, 2013 Compared to
Year Ended December 31, 2012
Consulting Fee Revenue (“CFR”) (dollars in thousands)
|
|
|
2013 |
|
2012 |
|
Change |
| |||||||||
|
Project Management |
|
$ |
392,602 |
|
76.7 |
% |
$ |
312,232 |
|
74.8 |
% |
$ |
80,370 |
|
25.7 |
% |
|
Construction Claims |
|
119,483 |
|
23.3 |
|
105,366 |
|
25.2 |
|
14,117 |
|
13.4 |
| |||
|
Total |
|
$ |
512,085 |
|
100.0 |
% |
$ |
417,598 |
|
100.0 |
% |
$ |
94,487 |
|
22.6 |
% |
The increase in CFR for 2013 over 2012 was substantially all organic and was primarily due to increased work in the Middle East.
During 2013, Project Management CFR consisted of a $76,032,000 increase in foreign projects and an increase of $4,338,000 in domestic projects. The increase in foreign Project Management CFR included an increase of $47,826,000 in Oman, $12,321,000 in Qatar, $7,634,000 in Saudi Arabia, $5,478,000 in Iraq and $5,194,000 in Afghanistan. These increases were partially offset by a decrease of $8,930,000 in Spain. The increase in domestic Project Management CFR was due primarily to a higher volume of work in our Northeast and Mid-Atlantic regions.
The increase in Construction Claims CFR was comprised of an organic increase of 11.0% and a 2.4% increase from the acquisition of BCA in May 2013. The organic increase was primarily due to increases in the Middle East and Asia/Pacific, partially offset by a decrease in the United Kingdom.
Reimbursable Expenses (dollars in thousands)
|
|
|
2013 |
|
2012 |
|
Change |
| |||||||||
|
Project Management |
|
$ |
59,915 |
|
92.8 |
% |
$ |
60,049 |
|
95.0 |
% |
$ |
(134 |
) |
(0.2 |
)% |
|
Construction Claims |
|
4,681 |
|
7.2 |
|
3,134 |
|
5.0 |
|
1,547 |
|
49.4 |
| |||
|
Total |
|
$ |
64,596 |
|
100.0 |
% |
$ |
63,183 |
|
100.0 |
% |
$ |
1,413 |
|
2.2 |
% |
Reimbursable expenses consist of amounts paid to subcontractors and other third parties, and travel and other job-related expenses that are contractually reimbursable from clients. These items are reflected as separate line items in both our revenue and cost of services captions in our consolidated statements of operations. The increase in Construction Claims reimbursable expenses was due primarily to increases in the Middle East and Asia/Pacific due to subcontractors and other reimbursable expenses associated with the increased work volume.
Cost of Services (dollars in thousands)
|
|
|
2013 |
|
2012 |
|
Change |
| |||||||||||||
|
|
|
|
|
|
|
% of |
|
|
|
|
|
% of |
|
|
|
|
| |||
|
|
|
|
|
|
|
CFR |
|
|
|
|
|
CFR |
|
|
|
|
| |||
|
Project Management |
|
$ |
244,003 |
|
82.4 |
% |
62.2 |
% |
$ |
192,592 |
|
80.4 |
% |
61.7 |
% |
$ |
51,411 |
|
26.7 |
% |
|
Construction Claims |
|
52,052 |
|
17.6 |
|
43.6 |
|
46,980 |
|
19.6 |
|
44.6 |
|
5,072 |
|
10.8 |
| |||
|
Total |
|
$ |
296,055 |
|
100.0 |
% |
57.8 |
% |
$ |
239,572 |
|
100.0 |
% |
57.4 |
% |
$ |
56,483 |
|
23.6 |
% |
Cost of services consists of labor expenses for time charged directly to contracts and non-reimbursable job-related travel and out-of-pocket expenses.
The increase in Project Management cost of services is primarily due to increases in the Middle East in support of increased work.
The increase in the cost of services for Construction Claims was due primarily to increases in direct costs in the Middle East, South Africa (due to the BCA acquisition) and Asia/Pacific, partially offset by a decrease in the United Kingdom.
Gross Profit (dollars in thousands)
|
|
|
2013 |
|
2012 |
|
Change |
| |||||||||||||
|
|
|
|
|
|
|
% of |
|
|
|
|
|
% of |
|
|
|
|
| |||
|
|
|
|
|
|
|
CFR |
|
|
|
|
|
CFR |
|
|
|
|
| |||
|
Project Management |
|
$ |
148,599 |
|
68.8 |
% |
37.8 |
% |
$ |
119,640 |
|
67.2 |
% |
38.3 |
% |
$ |
28,959 |
|
24.2 |
% |
|
Construction Claims |
|
67,431 |
|
31.2 |
|
56.4 |
|
58,386 |
|
32.8 |
|
55.4 |
|
9,045 |
|
15.5 |
| |||
|
Total |
|
$ |
216,030 |
|
100.0 |
% |
42.2 |
% |
$ |
178,026 |
|
100.0 |
% |
42.6 |
% |
$ |
38,004 |
|
21.3 |
% |
The increase in Project Management gross profit included an increase of $26,421,000 from international operations, primarily due to increases from the Middle East, principally Oman, Qatar, Saudi Arabia, Iraq and Afghanistan.
The increase in Construction Claims gross profit was driven by an increase of $4,245,000 in the Middle East, $1,571,000 in South Africa and $3,430,000 in Asia/Pacific, partially offset by a decrease of $1,357,000 in the United Kingdom.
The overall gross profit percentage declined slightly due to an increase in the mix of work towards the Project Management group which generally has lower gross margin percentages than the Construction Claims group.
Selling, General and Administrative (“SG&A”) Expenses (dollars in thousands)
|
|
|
2013 |
|
2012 |
|
Change |
| |||||||||
|
|
|
(Restated) |
|
(Restated) |
|
(Restated) |
| |||||||||
|
|
|
|
|
% of |
|
|
|
% of |
|
|
|
|
| |||
|
|
|
|
|
CFR |
|
|
|
CFR |
|
|
|
|
| |||
|
SG&A Expenses |
|
$ |
181,332 |
|
35.4 |
% |
$ |
221,328 |
|
52.9 |
% |
$ |
(39,996 |
) |
(17.9 |
)% |
Discrete items which impacted SG&A expenses are as follows:
· A net credit of $2,240,000 in 2013 as a result of cash recoveries against the Libya Receivable;
· A credit of $3,693,000 in 2013 resulting from the elimination , net of foreign exchange effects, of a reserve for a foreign subsidiary’s potential employment tax liabilities which were indemnified by the former shareholders of the subsidiary;
· A net charge of $48,549,000 in 2012 related to establishing a $59,937,000 reserve against the Libya Receivable offset by the elimination of $11,388,000 of related assets and liabilities which will not be paid unless we receive payments against the Libya Receivable;
· A charge of $4,000,000 in 2012 due to establishing a reserve for a foreign subsidiary’s potential employment tax liabilities; and
· A credit of $1,000,000 in 2012 for the reversal of a potential earn-out liability, recorded as part of the consideration for the TRS Consultants acquisition in December 2009, which was not attained by TRS.
Excluding these discrete items, as a percentage of CFR, SG&A expenses decreased to 37.0% in 2013 compared to 40.7% in 2012.
Other significant components of the change in SG&A expenses are as follows:
· An increase of $8,279,000 in unapplied labor primarily in the Middle East due to an increase in staff required for the new work. Unapplied labor, which increased 16.4% over the prior year compared to a 22.6% increase in CFR, represents the labor cost of operating staff for non-billable tasks. This represents improved utilization of billable staff over the prior year;
· An increase of $5,668,000 in indirect labor including $2,500,000 in staff termination costs primarily in Spain and Brazil where staff was reduced as several projects ended;
· A decrease of $1,446,000 in amortization expense due to the full amortization of the shorter-lived intangible assets of companies we acquired over the last several years;
· An increase in administrative travel of $1,391,000 in support of expanded international operations;
· An increase of $1,163,000 in professional fees due to statutory, audit and tax filings due to increased international operations;
· An increase of $792,000 in information technology related costs in support of increased staff and expanded global operations; and
· An increase of $719,000 in bad debt expense for reserves placed primarily in the domestic Project Management Group.
Operating Profit (Loss) (dollars in thousands)
|
|
|
2013 |
|
2012 |
|
Change |
| |||||||||
|
|
|
(Restated) |
|
(Restated) |
|
(Restated) |
| |||||||||
|
|
|
|
|
% of |
|
|
|
% of |
|
|
|
|
| |||
|
|
|
|
|
CFR |
|
|
|
CFR |
|
|
|
|
| |||
|
Project Management |
|
$ |
50,922 |
|
13.0 |
% |
$ |
(25,276 |
) |
(8.0 |
)% |
$ |
76,198 |
|
N.M |
% |
|
Construction Claims |
|
12,171 |
|
10.2 |
|
8,071 |
|
7.7 |
|
4,100 |
|
50.8 |
| |||
|
Corporate |
|
(28,395 |
) |
|
|
(26,097 |
) |
|
|
(2,298 |
) |
8.8 |
| |||
|
Total |
|
$ |
34,698 |
|
6.8 |
% |
$ |
(43,302 |
) |
(10.3 |
)% |
$ |
78,000 |
|
N.M |
% |
The increase in Project Management operating profit included an increase of $24,094,000 in the Middle East, primarily Oman, Qatar, Saudi Arabia, Iraq and Afghanistan and a net credit of $2,240,000 due to Libya Receivable transactions. Project Management operating profit in 2012 was impacted by the $48,549,000 net charge related to the Libya Receivable.
The increase in Construction Claims operating profit was primarily due to increases of $2,023,000 in the Middle East and $3,304,000 in Asia/Pacific, partially offset by a decrease of $1,020,000 in the United Kingdom.
Corporate expenses increased $2,298,000 primarily due to increases in indirect labor, share-based compensation, travel cost, information technology and depreciation in support of expanded operations overseas.
Interest and related financing fees, net
Interest and related financing fees increased $4,714,000 to $22,864,000 in 2013 as compared with $18,150,000 in 2012, primarily due to higher levels of debt outstanding and higher interest rates. Included in interest expense in 2013 is a non-cash charge of $7,955,000 compared to $1,520,000 in 2012 attributable to the accretion of the Term Loan.
Income Taxes
In 2013, the income tax expense was $6,350,000 compared to an income tax expense of $13,442,000 in 2012. The effective income tax expense rates for 2013 and 2012 were 53.7% and (21.9%), respectively. The increase in the Company’s effective tax rate during the year was primarily a result of recording a valuation allowance on the net U.S. deferred tax asset of $17,700,000 in 2012 with a consolidated pre-tax loss. In 2013, the Company required an increase in the valuation allowance related to the increase in the net U.S. deferred tax asset while generating consolidated pre-tax income.
In 2013, several items materially affected the Company’s effective tax rate. The Company realized a net benefit of $2,314,000 primarily from the reversal of prior year’s uncertain tax positions based on management’s assessment that these items were effectively settled with the appropriate foreign tax authorities. An income tax expense of $386,000 resulted from adjustments to agree the 2012 book amount to the actual amounts reported on the tax returns in foreign jurisdictions. In addition, the Company recognized higher foreign withholding taxes in 2013 which were partially offset
by the true up of income tax accounts in foreign jurisdictions.
Several items materially affected the Company’s effective tax rate during 2012. The Company realized a benefit from the reversal of prior year’s uncertain tax position amounting to $350,000 due to the expiration of the statute of limitations upon filing of certain income tax returns in a foreign jurisdiction. An income tax benefit of $666,000 resulted from adjustments to agree the 2011 book amount to the actual amounts reported on the tax returns, primarily in foreign jurisdictions. In addition, the Company recognized an income tax expense related to withholding tax in the amount of $573,000 primarily related to foreign operations and an income tax expense of $804,000 related to potential prior year tax assessments of certain foreign subsidiaries.
Net Earnings (Loss) Attributable to Hill
The net earnings attributable to Hill International, Inc. for 2013 were $3,562,000, or $0.09 per diluted common share, based on 39,322,000 diluted common shares outstanding, as compared to a net loss for 2012 of ($76,766,000), or ($1.99) per diluted common share based upon 38,500,000 diluted common shares outstanding.
Non-GAAP Financial Measures
Item 10(e) of Regulation S-K, “Use of Non-GAAP” Financial Measures in Commission Filings,” and other SEC regulations define and prescribe the conditions for use of certain financial information that is not recognized by generally accepted accounting principles. Generally, a Non-GAAP financial measure is a numerical measure of a company’s performance, financial position or cash flow that either excludes or includes amounts that are not normally excluded or included in the most directly comparable measure calculated and presented in accordance with GAAP. We believe earnings before interest, taxes, depreciation and amortization (“EBITDA”), in addition to operating profit, net earnings and other GAAP measures, is a useful indicator of our financial and operating performance and our ability to generate cash flows from operations that are available for taxes and capital expenditures. This measure, however, should be considered in addition to, and not as a substitute or superior to, operating profit, cash flows, or other measures of financial performance prepared in accordance with GAAP. The following table is a reconciliation of EBITDA to the most directly comparable GAAP measure in accordance with SEC Regulation S-K for the years ended December 31, 2014, 2013 and 2012 (in thousands):
|
|
|
Years Ended December 31, |
| |||||||
|
|
|
2014 |
|
2013 |
|
2012 |
| |||
|
|
|
(Restated) |
|
(Restated) |
|
(Restated) |
| |||
|
Net (loss) earnings attributable to Hill |
|
$ |
(6,148 |
) |
$ |
3,562 |
|
$ |
76,766 |
|
|
Interest |
|
30,485 |
|
22,864 |
|
18,150 |
| |||
|
Income taxes |
|
8,300 |
|
6,350 |
|
13,442 |
| |||
|
Depreciation and amortization |
|
9,823 |
|
10,756 |
|
12,430 |
| |||
|
EBITDA |
|
$ |
42,460 |
|
$ |
43,532 |
|
$ |
32,744 |
|
Liquidity and Capital Resources
As a result of the worldwide financial situation in recent years as well as the political unrest in Libya, we have had to rely more heavily on borrowings under our various credit facilities to provide funding for our operations. See Note 9 to our consolidated financial statements for a description of our recent refinancing, credit facilities and term loan. At December 31, 2014, our primary sources of liquidity consisted of $30,124,000 of cash and cash equivalents, of which $11,000 was on deposit in the U.S. and $30,113,000 was on deposit in foreign locations, and $22,025,000 of available borrowing capacity under our various credit facilities. We estimate that approximately $16,252,000 of the cash on deposit in foreign locations is required for working capital needs in those countries and the currency limitations related to Libyan dinars. We believe that we have sufficient liquidity to support the reasonably anticipated cash needs of our operations over the next twelve months. Also, significant unforeseen events, such as termination or cancellation of major contracts and/or
acts of terrorism or political unrest in or around the various areas in which we operate, could adversely affect our liquidity and results of operations. If market opportunities exist, we may choose to undertake financing actions to further enhance our liquidity, which could include our ability to borrow additional funds under our credit agreements, obtaining new bank debt or raising funds through capital market transactions. See “Sources of Additional Capital” for further information.
Uncertainties With Respect to Operations in Libya
We began work in Libya in 2007 primarily with the Libyan Organization for Development of Administrative Centres (“ODAC”). From that time through early 2010, we had received payments totaling approximately $104.0 million related to our services there. In April 2010, the Libyan government halted all payments to firms pending a review of the government procurement process. We continued to work during the review period and during that time our Libya Receivable balance grew to approximately $76.0 million. At the completion of its review in November 2010, the Libyan agency responsible for auditing contracts, RQABA, acknowledged that our receivables were proper and were owed in full. In December 2010 and January 2011, we received payments totaling $15.9 million and were advised that an additional $31.6 million had been scheduled for payment. In February 2011, due to civil and political unrest in Libya, we suspended our operations in and demobilized substantially all of our personnel from Libya. During the second half of 2011, we received various communications from ODAC requesting that we re-submit all open invoices for processing since much of the original documentation had been lost during the turmoil. We complied with ODAC’s request and accordingly re-submitted copies of all open invoices. During late 2012 and early 2013, we were advised by ODAC that, due to the political division in the country, payments had been temporarily restricted to local payroll. During late 2013 and early 2014, we received payments of approximately $9,900,000 from ODAC who also posted a letter of credit of approximately $14,000,000 in our favor which expired on June 30, 2014. We believed that this progress was a positive indication that ODAC intended to fulfill its obligations to us.
At December 31, 2012, the balance of the Libya Receivable was approximately $59,937,000. Because of the continuing political instability in Libya, we established a reserve for the full amount of the Libya Receivable which was charged to selling, general and administrative (“SG&A”) expenses for the year ended December 31, 2012. During 2013, the Company received approximately $2,880,000 against the Libya Receivable, which included 2,900,000 Libyan Dinars (“LYD”) ($2,276,000) that was paid directly to us and approximately LYD 783,000 ($604,000) that was paid to the Libyan tax authorities on our behalf. These receipts have been reflected as a reduction of SG&A expenses for the year ended December 31, 2013. During 2014, we received approximately $6,631,000 against the Libya Receivable, which included LYD 2,150,000 ($1,706,000), GBP 206,000 ($343,000) and $4,582,000 in U.S. dollars, which has been reflected as a reduction of SG&A expenses for the year ended December 31, 2014. At December 31, 2014, after a decrease of approximately $767,000 due to the effect of foreign exchange translation losses, the Libya Receivable was approximately $49,659,000 which continues to be fully reserved. We intend to continue to pursue collection of monies owed to us by ODAC and if subsequent payments are received, we will reflect such receipts, net of any third party obligations related to the collections, as reductions of SG&A expenses.
Additional Capital Requirements
Our subsidiary, Hill International (Spain), S.A. (“Hill Spain”), owns an indirect 72% interest in Engineering S.A. (“ESA”), a firm located in Brazil. ESA’s shareholders entered into an agreement whereby the minority shareholders have a right to compel (“ESA Put Option”) Hill Spain to purchase any or all of their shares during the period from February 28, 2014 to February 28, 2021. Hill Spain also has the right to compel (“ESA Call Option”) the minority shareholders to sell any or all of their shares during the same time period. The purchase price for such shares shall be seven times the earnings before interest and taxes for ESA’s most recently ended fiscal year, net of any financial debt plus excess cash multiplied by a percentage which the shares to be purchased bear to the total number of shares outstanding at the time of purchase, but in the event the ESA Call Option is exercised by Hill Spain, the purchase price shall be increased by five percent. The ESA Put Option and the ESA Call Option must be made within three months after the audited financial statements of ESA have been completed.
On October 31, 2014, our subsidiary Hill International (UK) Ltd. acquired all of the outstanding common stock of Angus Octan Scotland Ltd., which included its subsidiary companies Cadogan Consultants Ltd., Cadogan Consult Ltd. and Cadogan International Ltd. (collectively, “Cadogans”). Total consideration for the acquisition was £2,719,000
(approximately $4,350,000 at the date of acquisition). Cash payments of £2,000,000 ($3,200,000) were made during 2014. The remaining payouts consist of a cash payment of £519,000 ($830,000) to be paid on October 31, 2015 plus a potential earn out based upon Cadogans’ average earnings before interest, taxes, depreciation and amortization (“EBITDA”) for the two-year period ending on October 31, 2016 (which amount shall not be less than £0 nor more than £200,000).
Sources of Additional Capital
We have an effective registration statement on Form S-3 on file with the SEC to register 20,000,000 shares of our common stock for issuance and sale by us at various times in the future. The proceeds, if any, will be used for working capital and general corporate purposes, subject to the restrictions of our Secured Credit Facilities. We cannot predict the amount of proceeds from those future sales, if any, or whether there will be a market for our common stock at the time of any such offering or offerings to the public.
In addition, we have an effective registration statement on Form S-4 on file with the SEC to register 20,000,000 shares of our common stock, which includes 6,438,923 shares of our common stock registered under a previous Form S-4. During 2013, we issued 1,389,769 shares in connection with our acquisitions of BCA and CPI. During 2014, we issued 171,308 shares in connection with certain additional consideration for CPI. We expect to issue additional shares of our common stock in connection with certain contingent consideration for BCA and CPI. We cannot predict whether, in the future, we will offer these shares to potential sellers of businesses or assets we might consider acquiring or whether these shares will be acceptable as consideration by any potential sellers.
At December 31, 2014, we had $11,939,000 of available borrowing capacity under our domestic credit agreement and $10,086,000 of available borrowing capacity under our various foreign credit agreements.
We also have relationships with other foreign banks for the issuance of letters of credit, letters of guarantee and performance bonds in a variety of foreign currencies. At December 31, 2014, we had approximately $53,644,000 of availability under these relationships.
We cannot provide any assurance that any other sources of financing will be available, or if available, that the financing will be on terms acceptable to us.
Cash Flow Activity During the Year Ended December 31, 2014
For the year ended December 31, 2014, our cash and cash equivalents decreased by $257,000 to $30,124,000. This compares to a net increase in cash and cash equivalents of $13,665,000 during the prior year. Cash provided by operations was $6,305,000, cash used in investing activities was ($11,978,000) and cash provided by financing activities was $9,398,000. We also experienced a decrease in cash of ($3,982,000) from the effect of foreign currency exchange rate fluctuations.
Operating Activities
Our operations generated cash of $6,305,000 in 2014. This compares to cash generated of $21,433,000 in 2013 and cash used of ($6,471,000) in 2012. We had a net loss in 2014 amounting to ($4,847,000), net earnings of $5,484,000 in 2013 and a net loss of ($74,894,000) in 2012. Depreciation and amortization was $9,823,000 in 2014 compared to $10,756,000 in 2013 and $12,430,000 in 2012; the decrease in this category is due to the full amortization of the shorter-lived intangible assets of companies which we acquired over the last several years. We had deferred tax benefit of ($2,970,000) in 2014 primarily due to several minor temporary differences in foreign jurisdictions.
Cash held in restricted accounts as collateral for the issuance of performance and advance payment bonds and letters of credit at December 31, 2014 and 2013 were $16,007,000 and $18,506,000, respectively.
Average days sales outstanding (“DSO”) at December 31, 2014 was 86 days compared to 91 days at December 31, 2013 and 90 days at December 31, 2012. DSO is a measure of our ability to collect our accounts receivable and is calculated by
dividing the total of the period-end billed accounts receivable balance by average daily revenue (i.e., revenue for the quarter divided by 90 days). The decrease in DSO in 2014 was because the increase in our revenue, due to the ramp-up on new work in the Middle East, outpaced the growth in our accounts receivable due to a more favorable collection experience. Also, the age of our receivables is adversely affected by the timing of payments from our clients in Europe, Africa and the Middle East, which have historically been slower than payments from clients in other geographic regions of the Company’s operations.
Although we continually monitor our accounts receivable, we manage our operating cash flows by managing the working capital accounts in total, rather than by individual elements. The primary elements of our working capital are accounts receivable, prepaid and other current assets, accounts payable and deferred revenue. Accounts receivable consist of billing to our clients for our consulting fees and other job-related costs. Prepaid expenses and other current assets consist of prepayments for various selling, general and administrative costs, such as insurance, rent, maintenance, etc. Accounts payable consist of obligations to third parties relating primarily to costs incurred for specific engagements, including pass-through costs such as subcontractor costs. Deferred revenue consists of payments received from clients in advance of work performed.
From year to year, the components of our working capital accounts may reflect significant changes. The changes are due primarily to the timing of cash receipts and payments with our working capital accounts combined with increases in our receivables and payables relative to the increase in our overall business, as well as our acquisition activity.
Investing Activities
Net cash used in investing activities was ($11,978,000). We used ($5,721,000) to purchase computers, office equipment, furniture and fixtures to support the growth in our business. We used ($3,556,000) to acquire an additional 12% interest in ESA. We used ($2,701,000) for the acquisition of Cadogans, net of $499,000 acquired in the transaction.
Financing Activities
Net cash provided by financing activities was $9,398,000. During the year, we made net payments on our revolving credit facilities amounting to $14,133,000. We received $38,042,000 from a follow-on offering of our common stock and $120,000,000 from proceeds of a new term loan, the proceeds of which were used to pay down and terminate our 2009 Credit Agreement in the amount of $25,500,000 and 2012 Term Loan in the amount of $100,000,000. In connection with our new Secured Credit Facilities, we paid ($10,065,000) for financing fees and expenses. For further information regarding our Secured Credit Facilities, including our new term loan and revolving credit agreements, our 2009 Credit Agreement and our 2012 Term Loan, please see Note 10 to our consolidated financial statements. We also received $1,229,000 from the exercise of stock options and purchases under our Employee Stock Purchase Plan.
New Accounting Pronouncement
On May 28, 2014, the Financial Accounting Standards Board (“FASB”) issued Accounting Standards Update (“ASU”) No. 2014-09, Revenue from Contracts with Customers, which will replace most existing revenue recognition guidance in U.S. GAAP, including industry-specific guidance. The core principle of the ASU is that an entity should recognize revenue for the transfer of goods or services equal to the amount that it expects to be entitled to receive for those goods or services. The ASU requires additional disclosure about the nature, amount, timing and uncertainty of revenue and cash flows arising from customer contracts, including significant judgments and changes in judgments. The ASU will be effective for interim and annual periods commencing after December 15, 2016 and allows for both retrospective and prospective methods of adoption. Early adoption is not permitted. The Company is in the process of determining the method of adoptions and assessing the impact of this ASU on its consolidated financial statements.
Quarterly Fluctuations
Our operating results vary from period to period as a result of the timing of projects and assignments. We do not believe that our business is seasonal.
Inflation
Although we are subject to fluctuations in the local currencies of the counties in which we operate, we do not believe that inflation will have a significant effect on our results of operations or our financial position.
Off-Balance Sheet Arrangements
|
(in thousands) |
|
Total (1) |
|
2015 |
|
2016-2017 |
|
2018-2019 |
|
2020 and |
| |||||
|
|
|
|
|
|
|
|
|
|
|
|
| |||||
|
Performance bonds (2) |
|
$ |
34,492 |
|
$ |
13,058 |
|
$ |
13,857 |
|
$ |
1,498 |
|
$ |
6,079 |
|
|
Advance payment bonds (2) |
|
21,895 |
|
6,947 |
|
10,904 |
|
— |
|
4,044 |
| |||||
|
Bid bonds (3) |
|
6,799 |
|
6,251 |
|
— |
|
548 |
|
— |
| |||||
|
Letters of credit (4) |
|
16,836 |
|
16,836 |
|
— |
|
— |
|
— |
| |||||
|
|
|
$ |
80,022 |
|
$ |
43,092 |
|
$ |
24,761 |
|
$ |
2,046 |
|
$ |
10,123 |
|
(1) At December 31, 2014, the Company had provided cash collateral amounting to $16,007,000 for certain of these items. That collateral is reflected in restricted cash on the consolidated balance sheet. See Note 14 to our consolidated financial statements for further information regarding these arrangements.
(2) Represents guarantee of service performance bonds issued through international banks required under certain international contracts.
(3) Represents bid bonds issued through international banks as part of the bidding process for new work to demonstrate our financial strength.
(4) Represents letters of credit issued through a domestic bank in support for certain performance, advance payments and bid bonds.
Contractual Obligations
|
(in thousands) |
|
Total |
|
2015 |
|
2016-2017 |
|
2018-2019 |
|
2020 and |
| |||||
|
|
|
|
|
|
|
|
|
|
|
|
| |||||
|
Long-term debt obligations |
|
$ |
128,236 |
|
6,361 |
|
5,774 |
|
2,401 |
|
113,700 |
| ||||
|
Interest expense on notes payable (1) |
|
55,158 |
|
9,860 |
|
19,200 |
|
18,980 |
|
7,118 |
| |||||
|
Operating lease obligations (2) |
|
55,494 |
|
12,422 |
|
16,808 |
|
10,994 |
|
15,270 |
| |||||
|
|
|
$ |
238,888 |
|
$ |
28,643 |
|
$ |
41,782 |
|
$ |
32,375 |
|
$ |
136,088 |
|
(1) Estimated using the interest rates in effect at December 31, 2014.
(2) Represents future minimum rental commitments under non-cancelable leases. The Company expects to fund these commitments with existing cash and cash flow from operations.
Item 7A. Quantitative and Qualitative Disclosures About Market Risk
We are exposed to certain risks associated with foreign currency fluctuations and changes in interest rates.
Foreign Exchange Rates
We are exposed to foreign currency exchange rate risk resulting from our operations outside of the U.S. which are denominated in British pounds sterling, Euros, U.A.E. dirhams, Qatari riyal, Omani rial, Saudi riyal, Brazilian reais, Libyan dinar, Polish zloty, Australian dollars as well as other currencies. We do not comprehensively hedge our exposure to currency rate changes; however, we limit exposure to foreign currency fluctuations in most of our contracts through provisions that require client payments to be in currencies corresponding to the currency in which costs are incurred. As a
result, we currently do not hedge foreign currency cash flows for contract work performed, although we may do so in the future. The functional currency of our significant foreign operations is the local currency.
Interest Rates
All of our borrowings under our revolving credit facilities bear interest at variable rates. If market interest rates had changed by 100 basis points, interest expense and our cash flows would have changed by $825,000 each.
Item 8. Financial Statements and Supplementary Data.
HILL INTERNATIONAL, INC. AND SUBSIDIARIES
CONSOLIDATED BALANCE SHEETS
(In thousands, except per share data)
|
|
|
December 31, |
| |||||||
|
|
|
2014 |
|
2013 |
|
2012 |
| |||
|
|
|
(Restated) |
|
(Restated) |
|
(Restated) |
| |||
|
Assets |
|
|
|
|
|
|
| |||
|
Cash and cash equivalents |
|
$ |
30,124 |
|
$ |
30,381 |
|
$ |
16,716 |
|
|
Cash - restricted |
|
8,851 |
|
15,766 |
|
12,091 |
| |||
|
Accounts receivable, less allowance for doubtful accounts of $60,801, $66,856 and $70,205 |
|
195,098 |
|
174,685 |
|
151,239 |
| |||
|
Accounts receivable - affiliates |
|
3,993 |
|
492 |
|
1,260 |
| |||
|
Prepaid expenses and other current assets |
|
14,277 |
|
12,514 |
|
9,831 |
| |||
|
Income taxes receivable |
|
4,246 |
|
4,460 |
|
3,445 |
| |||
|
Deferred income tax assets |
|
6,575 |
|
7,340 |
|
8,256 |
| |||
|
Total current assets |
|
263,164 |
|
245,638 |
|
202,838 |
| |||
|
Property and equipment, net |
|
11,643 |
|
10,613 |
|
11,268 |
| |||
|
Cash - restricted, net of current portion |
|
7,156 |
|
2,740 |
|
9,135 |
| |||
|
Retainage receivable |
|
3,300 |
|
1,212 |
|
3,946 |
| |||
|
Acquired intangibles, net |
|
19,282 |
|
24,964 |
|
28,248 |
| |||
|
Goodwill |
|
80,437 |
|
85,853 |
|
84,007 |
| |||
|
Investments |
|
5,083 |
|
5,984 |
|
8,275 |
| |||
|
Deferred income tax assets |
|
13,645 |
|
10,511 |
|
11,090 |
| |||
|
Other assets |
|
15,899 |
|
5,961 |
|
5,098 |
| |||
|
Total assets |
|
$ |
419,609 |
|
$ |
393,476 |
|
$ |
363,905 |
|
|
Liabilities and Stockholders’ Equity |
|
|
|
|
|
|
| |||
|
Due to banks |
|
$ |
— |
|
$ |
2 |
|
$ |
21 |
|
|
Current maturities of notes payable and long-term debt |
|
6,361 |
|
18,974 |
|
21,769 |
| |||
|
Accounts payable and accrued expenses |
|
93,637 |
|
80,894 |
|
79,000 |
| |||
|
Income taxes payable |
|
9,306 |
|
9,442 |
|
6,955 |
| |||
|
Deferred revenue |
|
19,896 |
|
17,557 |
|
16,510 |
| |||
|
Deferred income taxes |
|
2,456 |
|
2,948 |
|
2,834 |
| |||
|
Other current liabilities |
|
10,044 |
|
12,255 |
|
13,827 |
| |||
|
Total current liabilities |
|
141,700 |
|
142,072 |
|
140,916 |
| |||
|
Notes payable and long-term debt, net of current maturities |
|
121,875 |
|
114,285 |
|
87,666 |
| |||
|
Retainage payable |
|
2,448 |
|
1,017 |
|
4,163 |
| |||
|
Deferred income taxes |
|
15,661 |
|
16,724 |
|
17,675 |
| |||
|
Deferred revenue |
|
12,193 |
|
16,261 |
|
9,652 |
| |||
|
Other liabilities |
|
3,732 |
|
6,261 |
|
11,279 |
| |||
|
Total liabilities |
|
297,609 |
|
296,620 |
|
271,351 |
| |||
|
|
|
|
|
|
|
|
| |||
|
Commitments and contingencies |
|
|
|
|
|
|
| |||
|
|
|
|
|
|
|
|
| |||
|
Stockholders’ equity: |
|
|
|
|
|
|
| |||
|
Preferred stock, $0.0001 par value; 1,000 shares authorized, none issued |
|
— |
|
— |
|
|
| |||
|
Common stock, $0.0001 par value; 100,000 shares authorized, 56,920 shares, 46,598 shares and 45,097 shares issued at December 31, 2014, 2013 and 2012, respectively |
|
6 |
|
5 |
|
5 |
| |||
|
Additional paid-in capital |
|
179,912 |
|
136,899 |
|
129,913 |
| |||
|
Retained earnings (deficit) |
|
(5,726 |
) |
422 |
|
(3,140 |
) | |||
|
Accumulated other comprehensive loss |
|
(32,600 |
) |
(24,591 |
) |
(20,015 |
) | |||
|
|
|
141,592 |
|
112,735 |
|
106,763 |
| |||
|
Less treasury stock, at cost |
|
(28,304 |
) |
(27,766 |
) |
(27,766 |
) | |||
|
Hill International, Inc. share of equity |
|
113,288 |
|
84,969 |
|
78,997 |
| |||
|
Noncontrolling interests |
|
8,712 |
|
11,887 |
|
13,557 |
| |||
|
Total equity |
|
122,000 |
|
96,856 |
|
92,554 |
| |||
|
Total liabilities and stockholders’ equity |
|
$ |
419,609 |
|
$ |
393,476 |
|
$ |
363,905 |
|
See accompanying notes to consolidated financial statements.
HILL INTERNATIONAL, INC. AND SUBSIDIARIES
CONSOLIDATED STATEMENTS OF OPERATIONS
(In thousands, except per share data)
|
|
|
Years Ended December 31, |
| |||||||
|
|
|
2014 |
|
2013 |
|
2012 |
| |||
|
|
|
(Restated) |
|
(Restated) |
|
(Restated) |
| |||
|
Consulting fee revenue |
|
$ |
577,117 |
|
$ |
512,085 |
|
$ |
417,598 |
|
|
Reimbursable expenses |
|
64,476 |
|
64,596 |
|
63,183 |
| |||
|
Total revenue |
|
641,593 |
|
576,681 |
|
480,781 |
| |||
|
|
|
|
|
|
|
|
| |||
|
Cost of services |
|
329,755 |
|
296,055 |
|
239,572 |
| |||
|
Reimbursable expenses |
|
64,476 |
|
64,596 |
|
63,183 |
| |||
|
Total direct expenses |
|
394,231 |
|
360,651 |
|
302,755 |
| |||
|
|
|
|
|
|
|
|
| |||
|
Gross profit |
|
247,362 |
|
216,030 |
|
178,026 |
| |||
|
|
|
|
|
|
|
|
| |||
|
Selling, general and administrative expenses |
|
213,424 |
|
181,332 |
|
221,328 |
| |||
|
|
|
|
|
|
|
|
| |||
|
Operating profit (loss) |
|
33,938 |
|
34,698 |
|
(43,302 |
) | |||
|
|
|
|
|
|
|
|
| |||
|
Interest and related financing fees, net |
|
30,485 |
|
22,864 |
|
18,150 |
| |||
|
Earnings (loss) before income taxes |
|
3,453 |
|
11,834 |
|
(61,452 |
) | |||
|
Income tax expense |
|
8,300 |
|
6,350 |
|
13,442 |
| |||
|
|
|
|
|
|
|
|
| |||
|
Net (loss) earnings |
|
(4,847 |
) |
5,484 |
|
(74,894 |
) | |||
|
Less: net earnings - noncontrolling interests |
|
1,301 |
|
1,922 |
|
1,872 |
| |||
|
|
|
|
|
|
|
|
| |||
|
Net (loss) earnings attributable to Hill International, Inc. |
|
$ |
(6,148 |
) |
$ |
3,562 |
|
$ |
(76,766 |
) |
|
|
|
|
|
|
|
|
| |||
|
Basic (loss) earnings per common share - Hill International, Inc. |
|
$ |
(0.14 |
) |
$ |
0.09 |
|
$ |
(1.99 |
) |
|
|
|
|
|
|
|
|
| |||
|
Basic weighted average common shares outstanding |
|
44,370 |
|
39,098 |
|
38,500 |
| |||
|
|
|
|
|
|
|
|
| |||
|
Diluted (loss) earnings per common share - Hill International, Inc. |
|
$ |
(0.14 |
) |
$ |
0.09 |
|
$ |
(1.99 |
) |
|
|
|
|
|
|
|
|
| |||
|
Diluted weighted average common shares outstanding |
|
44,370 |
|
39,322 |
|
38,500 |
| |||
See accompanying notes to consolidated financial statements.
HILL INTERNATIONAL, INC. AND SUBSIDIARIES
CONSOLIDATED STATEMENTS OF COMPREHENSIVE (LOSS) EARNINGS
(in thousands)
|
|
|
Years Ended December 31, |
| |||||||
|
|
|
2014 |
|
2013 |
|
2012 |
| |||
|
|
|
(Restated) |
|
(Restated) |
|
(Restated) |
| |||
|
|
|
|
|
|
|
|
| |||
|
Net (loss) earnings |
|
$ |
(4,847 |
) |
$ |
5,484 |
|
$ |
(74,894 |
) |
|
Foreign currency translation adjustment, net of tax |
|
(9,786 |
) |
(7,292 |
) |
(2,267 |
) | |||
|
Other, net |
|
123 |
|
218 |
|
(392 |
) | |||
|
Comprehensive loss |
|
(14,510 |
) |
(1,590 |
) |
(77,553 |
) | |||
|
Comprehensive (loss) earnings attributable to noncontrolling interests |
|
(353 |
) |
(576 |
) |
332 |
| |||
|
Comprehensive loss attributable to Hill International, Inc. |
|
$ |
(14,157 |
) |
$ |
(1,014 |
) |
$ |
(77,885 |
) |
See accompanying notes to consolidated financial statements.
HILL INTERNATIONAL, INC. AND SUBSIDIARIES
CONSOLIDATED STATEMENTS OF STOCKHOLDERS’ EQUITY
For the Years Ended December 31, 2014, 2013, and 2012
(in thousands)
|
|
|
|
|
|
|
|
|
|
|
Accumulated |
|
|
|
|
|
Hill |
|
|
|
|
| ||||||||
|
|
|
|
|
|
|
Additional |
|
Retained |
|
Other |
|
|
|
|
|
Share of |
|
Non- |
|
Total |
| ||||||||
|
|
|
Common Stock |
|
Paid-in |
|
Earnings |
|
Comprehensive |
|
Treasury Stock |
|
Stockholders’ |
|
controlling |
|
Stockholders’ |
| ||||||||||||
|
|
|
Shares |
|
Amount |
|
Capital |
|
(Deficit) |
|
(Loss) |
|
Shares |
|
Amount |
|
Equity |
|
Interests |
|
Equity |
| ||||||||
|
|
|
|
|
|
|
|
|
(Restated) |
|
(Restated) |
|
|
|
|
|
(Restated) |
|
(Restated) |
|
(Restated) |
| ||||||||
|
Balance - December 31, 2011 |
|
44,937 |
|
$ |
4 |
|
$ |
127,168 |
|
$ |
73,626 |
|
$ |
(18,896 |
) |
6,434 |
|
$ |
(27,766 |
) |
$ |
154,136 |
|
$ |
18,258 |
|
$ |
172,394 |
|
|
Net (loss) earnings |
|
— |
|
— |
|
— |
|
(76,766 |
) |
— |
|
— |
|
— |
|
(76,766 |
) |
1,872 |
|
(74,894 |
) | ||||||||
|
Other comprehensive loss |
|
— |
|
— |
|
— |
|
— |
|
(1,119 |
) |
— |
|
— |
|
(1,119 |
) |
(1,540 |
) |
(2,659 |
) | ||||||||
|
Issuance of restricted stock |
|
61 |
|
1 |
|
179 |
|
— |
|
— |
|
— |
|
— |
|
180 |
|
— |
|
180 |
| ||||||||
|
Stock issued to Board of Directors |
|
52 |
|
— |
|
150 |
|
— |
|
— |
|
— |
|
— |
|
150 |
|
— |
|
150 |
| ||||||||
|
Stock-based compensation expense |
|
— |
|
— |
|
2,126 |
|
— |
|
— |
|
— |
|
— |
|
2,126 |
|
— |
|
2,126 |
| ||||||||
|
Stock issued under employee stock purchase plan |
|
37 |
|
— |
|
105 |
|
— |
|
— |
|
— |
|
— |
|
105 |
|
— |
|
105 |
| ||||||||
|
Exercise of stock options |
|
10 |
|
— |
|
24 |
|
— |
|
— |
|
— |
|
— |
|
24 |
|
— |
|
24 |
| ||||||||
|
Tax effect of restricted stock |
|
— |
|
— |
|
161 |
|
— |
|
— |
|
— |
|
— |
|
161 |
|
— |
|
161 |
| ||||||||
|
Payment of dividends to noncontrolling interests |
|
— |
|
— |
|
— |
|
— |
|
— |
|
— |
|
— |
|
— |
|
(1,439 |
) |
(1,439 |
) | ||||||||
|
Acquisition of additional interest in subsidiary |
|
— |
|
— |
|
— |
|
— |
|
— |
|
— |
|
— |
|
— |
|
(3,594 |
) |
(3,594 |
) | ||||||||
|
Balance - December 31, 2012 |
|
45,097 |
|
5 |
|
129,913 |
|
(3,140 |
) |
(20,015 |
) |
6,434 |
|
(27,766 |
) |
78,997 |
|
13,557 |
|
92,554 |
| ||||||||
|
Net earnings (loss) |
|
— |
|
— |
|
— |
|
3,562 |
|
— |
|
— |
|
— |
|
3,562 |
|
1,922 |
|
5,484 |
| ||||||||
|
Other comprehensive loss |
|
— |
|
— |
|
— |
|
— |
|
(4,576 |
) |
— |
|
— |
|
(4,576 |
) |
(2,498 |
) |
(7,074 |
) | ||||||||
|
Stock issued to Board of Directors |
|
52 |
|
— |
|
150 |
|
— |
|
— |
|
— |
|
— |
|
150 |
|
— |
|
150 |
| ||||||||
|
Stock-based compensation expense |
|
— |
|
— |
|
2,811 |
|
— |
|
— |
|
— |
|
— |
|
2,811 |
|
— |
|
2,811 |
| ||||||||
|
Stock issued under employee stock purchase plan |
|
51 |
|
— |
|
138 |
|
— |
|
— |
|
— |
|
— |
|
138 |
|
— |
|
138 |
| ||||||||
|
Exercise of stock options |
|
8 |
|
— |
|
20 |
|
— |
|
— |
|
— |
|
— |
|
20 |
|
— |
|
20 |
| ||||||||
|
Tax effect of restricted stock |
|
— |
|
— |
|
(583 |
) |
— |
|
— |
|
— |
|
— |
|
(583 |
) |
— |
|
(583 |
) | ||||||||
|
Stock issued for acquisition of businesses |
|
1,390 |
|
— |
|
4,450 |
|
— |
|
— |
|
— |
|
— |
|
4,450 |
|
— |
|
4,450 |
| ||||||||
|
Acquisition of additional interest in subsidiary |
|
— |
|
— |
|
— |
|
— |
|
— |
|
— |
|
— |
|
— |
|
(1,094 |
) |
(1,094 |
) | ||||||||
|
|
|
|
|
|
|
|
|
|
|
|
|
|
|
|
|
|
|
|
|
|
| ||||||||
|
Balance - December 31, 2013 |
|
46,598 |
|
5 |
|
136,899 |
|
422 |
|
(24,591 |
) |
6,434 |
|
(27,766 |
) |
84,969 |
|
11,887 |
|
96,856 |
| ||||||||
|
Net (loss) earnings |
|
— |
|
— |
|
— |
|
(6,148 |
) |
— |
|
— |
|
— |
|
(6,148 |
) |
1,301 |
|
(4,847 |
) | ||||||||
|
Other comprehensive loss |
|
— |
|
— |
|
— |
|
— |
|
(8,009 |
) |
— |
|
— |
|
(8,009 |
) |
(1,654 |
) |
(9,663 |
) | ||||||||
|
Sale of common stock |
|
9,547 |
|
1 |
|
38,041 |
|
— |
|
— |
|
— |
|
— |
|
38,042 |
|
— |
|
38,042 |
| ||||||||
|
Stock issued to Board of Directors |
|
27 |
|
— |
|
175 |
|
— |
|
— |
|
— |
|
— |
|
175 |
|
— |
|
175 |
| ||||||||
|
Stock-based compensation expense |
|
— |
|
— |
|
3,327 |
|
— |
|
— |
|
— |
|
— |
|
3,327 |
|
— |
|
3,327 |
| ||||||||
|
Cancelation of restricted stock |
|
(2 |
) |
— |
|
(8 |
) |
— |
|
— |
|
— |
|
— |
|
(8 |
) |
— |
|
(8 |
) | ||||||||
|
Stock issued under employee stock purchase plan |
|
55 |
|
— |
|
197 |
|
— |
|
— |
|
— |
|
— |
|
197 |
|
— |
|
197 |
| ||||||||
|
Exercise of stock options |
|
324 |
|
— |
|
1,032 |
|
— |
|
— |
|
— |
|
— |
|
1,032 |
|
— |
|
1,032 |
| ||||||||
|
Cashless exercise of stock options |
|
200 |
|
— |
|
538 |
|
— |
|
— |
|
112 |
|
(538 |
) |
— |
|
— |
|
— |
| ||||||||
|
Stock issued for acquisition of CPI |
|
171 |
|
— |
|
618 |
|
— |
|
— |
|
— |
|
— |
|
618 |
|
— |
|
618 |
| ||||||||
|
Dividends paid to noncontrolling interests |
|
— |
|
— |
|
— |
|
— |
|
— |
|
— |
|
— |
|
— |
|
(173 |
) |
(173 |
) | ||||||||
|
Acquisition of additional interest in subsidiary |
|
— |
|
— |
|
(907 |
) |
— |
|
— |
|
— |
|
— |
|
(907 |
) |
(2,649 |
) |
(3,556 |
) | ||||||||
|
Balance - December 31, 2014 |
|
56,920 |
|
$ |
6 |
|
$ |
179,912 |
|
$ |
(5,726 |
) |
$ |
(32,600 |
) |
6,546 |
|
$ |
(28,304 |
) |
$ |
113,288 |
|
$ |
8,712 |
|
$ |
122,000 |
|
See accompanying notes to consolidated financial statements.
HILL INTERNATIONAL, INC. AND SUBSIDIARIES
CONSOLIDATED STATEMENTS OF CASH FLOWS
(In thousands)
|
|
|
Years Ended December 31, |
| |||||||
|
|
|
2014 |
|
2013 |
|
2012 |
| |||
|
|
|
(Restated) |
|
(Restated) |
|
(Restated) |
| |||
|
Cash flows from operating activities: |
|
|
|
|
|
|
| |||
|
Net (loss) earnings |
|
$ |
(4,847 |
) |
$ |
5,484 |
|
$ |
(74,894 |
) |
|
Adjustments to reconcile net (loss) earnings to net cash provided by (used in) operating activities: |
|
|
|
|
|
|
| |||
|
Depreciation and amortization |
|
9,823 |
|
10,756 |
|
12,430 |
| |||
|
Provision for bad debts |
|
(2,344 |
) |
1,317 |
|
63,146 |
| |||
|
Interest accretion on term loan |
|
15,526 |
|
7,955 |
|
1,520 |
| |||
|
Deferred tax (benefit) provision |
|
(2,970 |
) |
(1,864 |
) |
5,256 |
| |||
|
Stock based compensation |
|
3,494 |
|
2,961 |
|
2,276 |
| |||
|
Issuance of restricted stock |
|
— |
|
— |
|
180 |
| |||
|
Changes in operating assets and liabilities (net of acquisitions in 2014 and 2013): |
|
|
|
|
|
|
| |||
|
Restricted cash |
|
286 |
|
3,822 |
|
(10,499 |
) | |||
|
Accounts receivable |
|
(25,720 |
) |
(12,168 |
) |
(11,638 |
) | |||
|
Accounts receivable - affiliate |
|
(3,501 |
) |
768 |
|
570 |
| |||
|
Prepaid expenses and other current assets |
|
(2,819 |
) |
(2,116 |
) |
(951 |
) | |||
|
Income taxes receivable |
|
(197 |
) |
(744 |
) |
(1,665 |
) | |||
|
Retainage receivable |
|
(2,088 |
) |
2,734 |
|
488 |
| |||
|
Other assets |
|
(449 |
) |
109 |
|
5,144 |
| |||
|
Accounts payable and accrued expenses |
|
23,331 |
|
(2,747 |
) |
638 |
| |||
|
Income taxes payable |
|
664 |
|
1,688 |
|
2,596 |
| |||
|
Deferred revenue |
|
2,427 |
|
5,476 |
|
1,095 |
| |||
|
Other current liabilities |
|
(2,873 |
) |
4,923 |
|
(428 |
) | |||
|
Retainage payable |
|
1,440 |
|
(3,151 |
) |
(1,352 |
) | |||
|
Other liabilities |
|
(2,878 |
) |
(3,770 |
) |
(383 |
) | |||
|
Net cash provided by (used in) operating activities |
|
6,305 |
|
21,433 |
|
(6,471 |
) | |||
|
Cash flows from investing activities: |
|
|
|
|
|
|
| |||
|
Purchase of business, net of cash acquired |
|
(2,701 |
) |
— |
|
— |
| |||
|
Purchase of additional interest in Engineering S.A. |
|
(3,556 |
) |
— |
|
— |
| |||
|
Cash received in stock-based acquisitions |
|
— |
|
964 |
|
— |
| |||
|
Payments for additional equity interests in Hill Spain |
|
— |
|
(12,062 |
) |
— |
| |||
|
Payments for purchase of property and equipment |
|
(5,721 |
) |
(3,764 |
) |
(2,377 |
) | |||
|
Distributions from affiliate |
|
— |
|
36 |
|
156 |
| |||
|
Sale of investment |
|
— |
|
— |
|
3,149 |
| |||
|
Net cash (used in) provided by investing activities |
|
(11,978 |
) |
(14,826 |
) |
928 |
| |||
|
Cash flows from financing activities: |
|
|
|
|
|
|
| |||
|
Due to bank |
|
(2 |
) |
(19 |
) |
(1,278 |
) | |||
|
Proceeds from secondary public offering of common stock |
|
38,042 |
|
— |
|
— |
| |||
|
Proceeds from term loan borrowing |
|
120,000 |
|
— |
|
75,000 |
| |||
|
Payoff and termination of term loan |
|
(100,000 |
) |
— |
|
— |
| |||
|
Payoff and termination of revolving credit facility |
|
(25,500 |
) |
— |
|
— |
| |||
|
Payment of financing fees |
|
(10,065 |
) |
— |
|
— |
| |||
|
Payment on Engineering S.A. note payable |
|
— |
|
(5,095 |
) |
— |
| |||
|
Payments on notes payable |
|
— |
|
(167 |
) |
(3,669 |
) | |||
|
Net (payments) borrowings on revolving loans |
|
(14,133 |
) |
21,084 |
|
(56,497 |
) | |||
|
Dividends paid to noncontrolling interest |
|
(173 |
) |
— |
|
(1,439 |
) | |||
|
Payment of deferred loan cost |
|
— |
|
— |
|
(3,329 |
) | |||
|
Proceeds from stock issued under employee stock purchase plan |
|
197 |
|
138 |
|
105 |
| |||
|
Proceeds from exercise of stock options |
|
1,032 |
|
20 |
|
24 |
| |||
|
Net cash provided by financing activities |
|
9,398 |
|
15,961 |
|
8,917 |
| |||
|
Effect of exchange rate changes on cash |
|
(3,982 |
) |
(8,903 |
) |
(4,582 |
) | |||
|
Net (decrease) increase in cash and cash equivalents |
|
(257 |
) |
13,665 |
|
(1,208 |
) | |||
|
Cash and cash equivalents – beginning of year |
|
30,381 |
|
16,716 |
|
17,924 |
| |||
|
Cash and cash equivalents – end of year |
|
$ |
30,124 |
|
$ |
30,381 |
|
$ |
16,716 |
|
See accompanying notes to consolidated financial statements.
HILL INTERNATIONAL, INC. AND SUBSIDIARIES
NOTES TO CONSOLIDATED FINANCIAL STATEMENTS
Note 1 — Restatement and Revision of Previously Reported Consolidated Financial Statements
The Company has restated its consolidated financial statements for the years ended December 31, 2014, 2013 and 2012 due to a change in the Company’s estimation of the collectability of its Libya Receivable. Due to the civil and political unrest which commenced in Libya in February 2011, the Company suspended its operations in and demobilized substantially all of its personnel from Libya. At December 31, 2012, the Libya Receivable was approximately $59,937,000, however, because of the political instability and economic uncertainty within Libya and because a promised payment of $31,600,000 in 2011 never materialized, the Company determined that its previous accounting treatment for the Libya Receivable was no longer appropriate as of and for the year ended December 31, 2012. The Company has established a reserve against the entire Libya Receivable amounting to $59,937,000 and eliminated $11,388,000 of certain assets and net liabilities related to that receivable, consisting of sub-consultants and other contingent expenses in 2012, which are contractually owed only upon receipt of payment. These adjustments resulted in a net charge to selling, general and administrative expenses of $48,549,000 for the year ended December 31, 2012. We received approximately $2,880,000 and $6,631,000 in 2013 and 2014, respectively and have paid agency fees and certain taxes amounting to $640,000 and $1,638,000 in 2013 and 2014, respectively. We have accounted for these transactions as a net reduction of selling, general and administrative expenses of $2,240,000 and $4,948,000 in 2013 and 2014, respectively. In addition the Company recorded certain unrelated adjustments to consulting fee revenues, cost of services, selling, general and administrative expenses and income taxes for the year ended December 31, 2014. These unrelated adjustments were the direct result of the restatement because previous immaterial variances in certain accounts that were not recorded during the December 31, 2014 year end closing process became material when aggregated and assessed against the restated 2014 financial statements. In the aggregate, these unrelated adjustments increased the net loss by approximately $307,000 for the year ended December 31, 2014. The impact of correcting the misstatement on the Company’s consolidated balance sheets and consolidated statements of income, comprehensive income (loss) and cash flows is as follows:
|
|
|
December 31, 2014 |
| |||||||
|
|
|
As Previously |
|
Adjustment |
|
As Restated |
| |||
|
Selected Consolidated Balance Sheet Accounts |
|
|
|
|
|
|
| |||
|
Accounts receivable, less allowance for doubtful accounts |
|
$ |
194,256 |
|
$ |
842 |
|
$ |
195,098 |
|
|
Prepaid expenses and other current assets |
|
$ |
15,854 |
|
$ |
(1,577 |
) |
$ |
14,277 |
|
|
Income taxes receivable |
|
$ |
2,833 |
|
$ |
1,413 |
|
$ |
4,246 |
|
|
Deferred income taxes |
|
$ |
1,188 |
|
$ |
5,387 |
|
$ |
6,575 |
|
|
Total current assets |
|
$ |
257,099 |
|
$ |
6,065 |
|
$ |
263,164 |
|
|
Accounts receivable - Libya |
|
$ |
49,659 |
|
$ |
(49,659 |
) |
$ |
— |
|
|
Deferred income tax assets |
|
$ |
15,426 |
|
$ |
(1,781 |
) |
$ |
13,645 |
|
|
Total assets |
|
$ |
464,984 |
|
$ |
(45,375 |
) |
$ |
419,609 |
|
|
Accounts payable and accrued expenses |
|
$ |
92,068 |
|
$ |
1,569 |
|
$ |
93,637 |
|
|
Income taxes payable |
|
$ |
8,689 |
|
$ |
617 |
|
$ |
9,306 |
|
|
Deferred revenue |
|
$ |
20,542 |
|
$ |
(646 |
) |
$ |
19,896 |
|
|
Deferred income taxes |
|
$ |
279 |
|
$ |
2,177 |
|
$ |
2,456 |
|
|
Other current liabilities |
|
$ |
9,996 |
|
$ |
48 |
|
$ |
10,044 |
|
|
Total current liabilities |
|
$ |
137,935 |
|
$ |
3,765 |
|
$ |
141,700 |
|
|
Deferred income taxes |
|
$ |
14,654 |
|
$ |
1,007 |
|
$ |
15,661 |
|
|
Other liabilities |
|
$ |
13,093 |
|
$ |
(9,361 |
) |
$ |
3,732 |
|
|
Total liabilities |
|
$ |
302,198 |
|
$ |
(4,589 |
) |
$ |
297,609 |
|
|
Retained earnings (deficit) |
|
$ |
36,159 |
|
$ |
(41,885 |
) |
$ |
(5,726 |
) |
|
Accumulated other comprehensive loss |
|
$ |
(33,661 |
) |
$ |
1,061 |
|
$ |
(32,600 |
) |
|
Hill International, Inc. share of equity |
|
$ |
154,112 |
|
$ |
(40,824 |
) |
$ |
113,288 |
|
|
Noncontrolling interests |
|
$ |
8,674 |
|
$ |
38 |
|
$ |
8,712 |
|
|
Total equity |
|
$ |
162,786 |
|
$ |
(40,786 |
) |
$ |
122,000 |
|
|
Total liabilities and equity |
|
$ |
464,984 |
|
$ |
(45,375 |
) |
$ |
419,609 |
|
|
|
|
December 31, 2013 |
| |||||||
|
|
|
As Previously |
|
Adjustment |
|
As Restated |
| |||
|
|
|
|
|
|
|
|
| |||
|
Selected Consolidated Balance Sheet Accounts |
|
|
|
|
|
|
| |||
|
Accounts receivable |
|
$ |
232,011 |
|
$ |
(57,326 |
) |
$ |
174,685 |
|
|
Prepaid expenses and other current assets |
|
$ |
13,078 |
|
$ |
(564 |
) |
$ |
12,514 |
|
|
Deferred income tax assets |
|
$ |
1,705 |
|
$ |
5,635 |
|
$ |
7,340 |
|
|
Total current assets |
|
$ |
297,893 |
|
$ |
(52,255 |
) |
$ |
245,638 |
|
|
Deferred income tax assets |
|
$ |
13,882 |
|
$ |
(3,371 |
) |
$ |
10,511 |
|
|
Total assets |
|
$ |
449,102 |
|
$ |
(55,626 |
) |
$ |
393,476 |
|
|
Accounts payable and accrued expenses |
|
$ |
92,270 |
|
$ |
(11,376 |
) |
$ |
80,894 |
|
|
Deferred revenue |
|
$ |
18,203 |
|
$ |
(646 |
) |
$ |
17,557 |
|
|
Deferred income taxes |
|
$ |
369 |
|
$ |
2,579 |
|
$ |
2,948 |
|
|
Total current liabilities |
|
$ |
151,515 |
|
$ |
(9,443 |
) |
$ |
142,072 |
|
|
Deferred income taxes |
|
$ |
16,732 |
|
$ |
(8 |
) |
$ |
16,724 |
|
|
Total liabilities |
|
$ |
306,071 |
|
$ |
(9,451 |
) |
$ |
296,620 |
|
|
Retained earnings |
|
$ |
47,038 |
|
$ |
(46,616 |
) |
$ |
422 |
|
|
Accumulated other comprehensive loss |
|
$ |
(25,032 |
) |
$ |
441 |
|
$ |
(24,591 |
) |
|
Hill International, Inc. share of equity |
|
$ |
131,144 |
|
$ |
(46,175 |
) |
$ |
84,969 |
|
|
Total equity |
|
$ |
143,031 |
|
$ |
(46,175 |
) |
$ |
96,856 |
|
|
Total liabilities and equity |
|
$ |
449,102 |
|
$ |
(55,626 |
) |
$ |
393,476 |
|
|
|
|
December 31, 2012 |
| |||||||
|
|
|
As Previously |
|
Adjustment |
|
As Restated |
| |||
|
Selected Consolidated Balance Sheet Accounts |
|
|
|
|
|
|
| |||
|
Accounts receivable |
|
$ |
211,176 |
|
$ |
(59,937 |
) |
$ |
151,239 |
|
|
Prepaid expenses and other current assets |
|
$ |
10,395 |
|
$ |
(564 |
) |
$ |
9,831 |
|
|
Deferred income tax assets |
|
$ |
2,187 |
|
$ |
6,069 |
|
$ |
8,256 |
|
|
Total current assets |
|
$ |
257,270 |
|
$ |
(54,432 |
) |
$ |
202,838 |
|
|
Deferred income taxes |
|
$ |
14,426 |
|
$ |
(3,336 |
) |
$ |
11,090 |
|
|
Total assets |
|
$ |
421,673 |
|
$ |
(57,768 |
) |
$ |
363,905 |
|
|
Accounts payable and accrued expenses |
|
$ |
90,306 |
|
$ |
(11,306 |
) |
$ |
79,000 |
|
|
Deferred revenue |
|
$ |
17,156 |
|
$ |
(646 |
) |
$ |
16,510 |
|
|
Deferred income taxes |
|
$ |
101 |
|
$ |
2,733 |
|
$ |
2,834 |
|
|
Total current liabilities |
|
$ |
150,135 |
|
$ |
(9,219 |
) |
$ |
140,916 |
|
|
Total liabilities |
|
$ |
280,570 |
|
$ |
(9,219 |
) |
$ |
271,351 |
|
|
Retained earnings (deficit) |
|
$ |
45,409 |
|
$ |
(48,549 |
) |
$ |
(3,140 |
) |
|
Hill International, Inc. share of equity |
|
$ |
127,546 |
|
$ |
(48,549 |
) |
$ |
78,997 |
|
|
Total equity |
|
$ |
141,103 |
|
$ |
(48,549 |
) |
$ |
92,554 |
|
|
Total liabilities and equity |
|
$ |
421,673 |
|
$ |
(57,768 |
) |
$ |
363,905 |
|
|
|
|
Year ended December 31, 2014 |
| |||||||
|
|
|
As Previously |
|
Adjustment |
|
As Restated |
| |||
|
Consolidated Statement of Operations |
|
|
|
|
|
|
| |||
|
Consulting fee revenue |
|
$ |
575,805 |
|
$ |
1,312 |
|
$ |
577,117 |
|
|
Reimbursable expenses |
|
64,476 |
|
— |
|
64,476 |
| |||
|
Total revenue |
|
640,281 |
|
1,312 |
|
641,593 |
| |||
|
Cost of services |
|
328,795 |
|
960 |
|
329,755 |
| |||
|
Reimbursable expenses |
|
64,476 |
|
— |
|
64,476 |
| |||
|
Total direct expenses |
|
393,271 |
|
960 |
|
394,231 |
| |||
|
Gross profit |
|
247,010 |
|
352 |
|
247,362 |
| |||
|
Selling, general and administrative expenses |
|
217,730 |
|
(4,306 |
) |
213,424 |
| |||
|
Operating profit |
|
29,280 |
|
4,658 |
|
33,938 |
| |||
|
Interest and related financing fees, net |
|
30,485 |
|
— |
|
30,485 |
| |||
|
(Loss) earnings before income taxes |
|
(1,205 |
) |
4,658 |
|
3,453 |
| |||
|
Income tax expense |
|
8,411 |
|
(111 |
) |
8,300 |
| |||
|
Net loss |
|
(9,616 |
) |
4,769 |
|
(4,847 |
) | |||
|
Less: net earnings - noncontrolling interests |
|
1,263 |
|
38 |
|
1,301 |
| |||
|
Net loss attributable to Hill International, Inc. |
|
$ |
(10,879 |
) |
$ |
4,731 |
|
$ |
(6,148 |
) |
|
|
|
|
|
|
|
|
| |||
|
Basic loss per common share - Hill International, Inc. |
|
$ |
(0.25 |
) |
$ |
0.11 |
|
$ |
(0.14 |
) |
|
Diluted loss per common share - Hill International, Inc. |
|
$ |
(0.25 |
) |
$ |
0.11 |
|
$ |
(0.14 |
) |
|
|
|
Year ended December 31, 2013 |
| |||||||
|
|
|
As Previously |
|
Adjustment |
|
As Restated |
| |||
|
Consolidated Statement of Operations |
|
|
|
|
|
|
| |||
|
Consulting fee revenue |
|
$ |
512,085 |
|
$ |
— |
|
$ |
512,085 |
|
|
Reimbursable expenses |
|
64,596 |
|
— |
|
64,596 |
| |||
|
Total revenue |
|
576,681 |
|
— |
|
576,681 |
| |||
|
Cost of services |
|
296,055 |
|
— |
|
296,055 |
| |||
|
Reimbursable expenses |
|
64,596 |
|
— |
|
64,596 |
| |||
|
Total direct expenses |
|
360,651 |
|
— |
|
360,651 |
| |||
|
Gross profit |
|
216,030 |
|
— |
|
216,030 |
| |||
|
Selling, general and administrative expenses |
|
183,572 |
|
(2,240 |
) |
181,332 |
| |||
|
Operating profit |
|
32,458 |
|
2,240 |
|
34,698 |
| |||
|
Interest and related financing fees, net |
|
22,864 |
|
— |
|
22,864 |
| |||
|
(Loss) earnings before income taxes |
|
9,594 |
|
2,240 |
|
11,834 |
| |||
|
Income tax expense |
|
6,043 |
|
307 |
|
6,350 |
| |||
|
Net earnings |
|
3,551 |
|
1,933 |
|
5,484 |
| |||
|
Less: net earnings - noncontrolling interests |
|
1,922 |
|
— |
|
1,922 |
| |||
|
Net earnings attributable to Hill International, Inc. |
|
$ |
1,629 |
|
$ |
1,933 |
|
$ |
3,562 |
|
|
|
|
|
|
|
|
|
| |||
|
Basic earnings per common share - Hill International, Inc. |
|
$ |
0.04 |
|
$ |
0.05 |
|
$ |
0.09 |
|
|
Diluted earnings per common share - Hill International, Inc. |
|
$ |
0.04 |
|
$ |
0.05 |
|
$ |
0.09 |
|
|
|
|
Year ended December 31, 2012 |
| |||||||
|
|
|
As Previously |
|
Adjustment |
|
As Restated |
| |||
|
Consolidated Statement of Operations |
|
|
|
|
|
|
| |||
|
Consulting fee revenue |
|
$ |
417,598 |
|
$ |
— |
|
$ |
417,598 |
|
|
Reimbursable expenses |
|
63,183 |
|
— |
|
63,183 |
| |||
|
Total revenue |
|
480,781 |
|
— |
|
480,781 |
| |||
|
Cost of services |
|
239,572 |
|
— |
|
239,572 |
| |||
|
Reimbursable expenses |
|
63,183 |
|
— |
|
63,183 |
| |||
|
Total direct expenses |
|
302,755 |
|
— |
|
302,755 |
| |||
|
Gross profit |
|
178,026 |
|
— |
|
178,026 |
| |||
|
Selling, general and administrative expenses |
|
172,779 |
|
48,549 |
|
221,328 |
| |||
|
Operating profit |
|
5,247 |
|
(48,549 |
) |
(43,302 |
) | |||
|
Interest and related financing fees, net |
|
18,150 |
|
— |
|
18,150 |
| |||
|
Loss before income taxes |
|
(12,903 |
) |
(48,549 |
) |
(61,452 |
) | |||
|
Income tax expense |
|
13,442 |
|
— |
|
13,442 |
| |||
|
Net loss |
|
(26,345 |
) |
(48,549 |
) |
(74,894 |
) | |||
|
Less: net earnings - noncontrolling interests |
|
1,872 |
|
— |
|
1,872 |
| |||
|
Net loss attributable to Hill International, Inc. |
|
$ |
(28,217 |
) |
$ |
(48,549 |
) |
$ |
(76,766 |
) |
|
|
|
|
|
|
|
|
| |||
|
Basic loss per common share - Hill International, Inc. |
|
$ |
(0.73 |
) |
$ |
(1.26 |
) |
$ |
(1.99 |
) |
|
Diluted loss per common share - Hill International, Inc. |
|
$ |
(0.73 |
) |
$ |
(1.26 |
) |
$ |
(1.99 |
) |
|
|
|
Year ended December 31, 2014 |
| |||||||
|
|
|
As Previously |
|
Adjustment |
|
As Restated |
| |||
|
Consolidated Statement of Comprehensive Loss |
|
|
|
|
|
|
| |||
|
Net loss |
|
$ |
(9,616 |
) |
$ |
4,769 |
|
$ |
(4,847 |
) |
|
Foreign currency translation adjustment, net |
|
(10,406 |
) |
620 |
|
(9,786 |
) | |||
|
Other, net |
|
123 |
|
— |
|
123 |
| |||
|
Comprehensive loss |
|
(19,899 |
) |
5,389 |
|
(14,510 |
) | |||
|
Comprehensive loss attributable to noncontrolling interests |
|
(391 |
) |
38 |
|
(353 |
) | |||
|
Comprehensive loss attributable to Hill International, Inc. |
|
$ |
(19,508 |
) |
$ |
5,351 |
|
$ |
(14,157 |
) |
|
|
|
Year ended December 31, 2013 |
| |||||||
|
|
|
As Previously |
|
Adjustment |
|
As Restated |
| |||
|
Consolidated Statement of Comprehensive Loss |
|
|
|
|
|
|
| |||
|
Net earnings |
|
$ |
3,551 |
|
$ |
1,933 |
|
$ |
5,484 |
|
|
Foreign currency translation adjustment, net |
|
(7,733 |
) |
441 |
|
(7,292 |
) | |||
|
Other, net |
|
218 |
|
— |
|
218 |
| |||
|
Comprehensive loss |
|
(3,964 |
) |
2,374 |
|
(1,590 |
) | |||
|
Comprehensive loss attributable to noncontrolling interests |
|
(576 |
) |
— |
|
(576 |
) | |||
|
Comprehensive loss attributable to Hill International, Inc. |
|
$ |
(3,388 |
) |
$ |
2,374 |
|
$ |
(1,014 |
) |
|
|
|
Year ended December 31, 2012 |
| |||||||
|
|
|
As Previously |
|
Adjustment |
|
As Restated |
| |||
|
Consolidated Statement of Comprehensive Loss |
|
|
|
|
|
|
| |||
|
Net loss |
|
$ |
(26,345 |
) |
$ |
(48,549 |
) |
$ |
(74,894 |
) |
|
Foreign currency translation adjustment, net |
|
(2,267 |
) |
— |
|
(2,267 |
) | |||
|
Other, net |
|
(392 |
) |
— |
|
(392 |
) | |||
|
Comprehensive loss |
|
(29,004 |
) |
(48,549 |
) |
(77,553 |
) | |||
|
Comprehensive earnings attributable to noncontrolling interests |
|
332 |
|
— |
|
332 |
| |||
|
Comprehensive loss attributable to Hill International, Inc. |
|
$ |
(29,336 |
) |
$ |
(48,549 |
) |
$ |
(77,885 |
) |
|
|
|
Year ended December 31, 2014 |
| |||||||
|
|
|
As Previously |
|
Adjustment |
|
As Restated |
| |||
|
Consolidated Statement of Cash Flows |
|
$ |
|
|
|
|
|
| ||
|
Operating activities |
|
|
|
|
|
|
| |||
|
Net loss |
|
(9,616 |
) |
4,769 |
|
(4,847 |
) | |||
|
Provision for bad debts |
|
5,323 |
|
(7,667 |
) |
(2,344 |
) | |||
|
Deferred tax benefit |
|
(2,241 |
) |
(729 |
) |
(2,970 |
) | |||
|
Accounts receivable |
|
(25,498 |
) |
(222 |
) |
(25,720 |
) | |||
|
Prepaid expenses and other current assets |
|
(3,832 |
) |
1,013 |
|
(2,819 |
) | |||
|
Income taxes receivable |
|
1,216 |
|
(1,413 |
) |
(197 |
) | |||
|
Accounts payable and accrued expenses |
|
9,857 |
|
13,474 |
|
23,331 |
| |||
|
Income taxes payable |
|
47 |
|
617 |
|
664 |
| |||
|
Other current liabilities |
|
(2,921 |
) |
48 |
|
(2,873 |
) | |||
|
Other liabilities |
|
7,012 |
|
(9,890 |
) |
(2,878 |
) | |||
|
Other cash flows provided by operating activities |
|
26,958 |
|
— |
|
26,958 |
| |||
|
Net cash provided by operating activities |
|
6,305 |
|
— |
|
6,305 |
| |||
|
|
|
|
|
|
|
|
| |||
|
Investing activities |
|
|
|
|
|
|
| |||
|
Net cash used in investing activities |
|
(11,978 |
) |
— |
|
(11,978 |
) | |||
|
|
|
|
|
|
|
|
| |||
|
Financing activities |
|
|
|
|
|
|
| |||
|
Net cash provided by financing activities |
|
9,398 |
|
— |
|
9,398 |
| |||
|
|
|
|
|
|
|
|
| |||
|
Effect of exchange rate changes on cash |
|
(3,982 |
) |
— |
|
(3,982 |
) | |||
|
|
|
|
|
|
|
|
| |||
|
Net decrease in cash |
|
(257 |
) |
— |
|
(257 |
) | |||
|
Cash and cash equivalents - beginning of year |
|
30,381 |
|
— |
|
30,381 |
| |||
|
Cash and cash equivalents - end of year |
|
$ |
30,124 |
|
$ |
— |
|
$ |
30,124 |
|
|
|
|
Year ended December 31, 2013 |
| |||||||
|
|
|
As Previously |
|
Adjustment |
|
As Restated |
| |||
|
Consolidated Statement of Cash Flows |
|
$ |
|
|
|
|
|
| ||
|
Operating activities |
|
|
|
|
|
|
| |||
|
Net loss |
|
3,551 |
|
1,933 |
|
5,484 |
| |||
|
Provision for bad debts |
|
3,928 |
|
(2,611 |
) |
1,317 |
| |||
|
Deferred tax benefit |
|
(2,171 |
) |
307 |
|
(1,864 |
) | |||
|
Accounts receivable |
|
(11,899 |
) |
(269 |
) |
(12,168 |
) | |||
|
Accounts payable and accrued expenses |
|
(3,387 |
) |
640 |
|
(2,747 |
) | |||
|
Other cash flows provided by operating activities |
|
31,411 |
|
— |
|
31,411 |
| |||
|
Net cash provided by operating activities |
|
21,433 |
|
— |
|
21,433 |
| |||
|
|
|
|
|
|
|
|
| |||
|
Investing activities |
|
|
|
|
|
|
| |||
|
Net cash used in investing activities |
|
(14,826 |
) |
— |
|
(14,826 |
) | |||
|
|
|
|
|
|
|
|
| |||
|
Financing activities |
|
|
|
|
|
|
| |||
|
Net cash provided by financing activities |
|
15,961 |
|
— |
|
15,961 |
| |||
|
|
|
|
|
|
|
|
| |||
|
Effect of exchange rate changes on cash |
|
(8,903 |
) |
— |
|
(8,903 |
) | |||
|
|
|
|
|
|
|
|
| |||
|
Net decrease in cash |
|
13,665 |
|
— |
|
13,665 |
| |||
|
Cash and cash equivalents - beginning of year |
|
16,716 |
|
— |
|
16,716 |
| |||
|
Cash and cash equivalents - end of year |
|
$ |
30,381 |
|
$ |
— |
|
$ |
30,381 |
|
|
|
|
Year ended December 31, 2012 |
| |||||||
|
|
|
As Previously |
|
Adjustment |
|
As Restated |
| |||
|
Consolidated Statement of Cash Flows |
|
$ |
|
|
|
|
|
| ||
|
Operating activities |
|
|
|
|
|
|
| |||
|
Net loss |
|
(26,345 |
) |
(48,549 |
) |
(74,894 |
) | |||
|
Provision for bad debts |
|
3,209 |
|
59,937 |
|
63,146 |
| |||
|
Prepaid expenses and other current assets |
|
(1,515 |
) |
564 |
|
(951 |
) | |||
|
Accounts payable and accrued expenses |
|
11,944 |
|
(11,306 |
) |
638 |
| |||
|
Deferred revenue |
|
1,741 |
|
(646 |
) |
1,095 |
| |||
|
Other cash flows provided by operating activities |
|
4,495 |
|
— |
|
4,495 |
| |||
|
Net cash used in operating activities |
|
(6,471 |
) |
— |
|
(6,471 |
) | |||
|
|
|
|
|
|
|
|
| |||
|
Investing activities |
|
|
|
|
|
|
| |||
|
Net cash provided by investing activities |
|
928 |
|
— |
|
928 |
| |||
|
|
|
|
|
|
|
|
| |||
|
Financing activities |
|
|
|
|
|
|
| |||
|
Net cash provided by financing activities |
|
8,917 |
|
— |
|
8,917 |
| |||
|
|
|
|
|
|
|
|
| |||
|
Effect of exchange rate changes on cash |
|
(4,582 |
) |
— |
|
(4,582 |
) | |||
|
|
|
|
|
|
|
|
| |||
|
Net decrease in cash |
|
(1,208 |
) |
— |
|
(1,208 |
) | |||
|
Cash and cash equivalents - beginning of year |
|
17,924 |
|
— |
|
17,924 |
| |||
|
Cash and cash equivalents - end of year |
|
$ |
16,716 |
|
$ |
— |
|
$ |
16,716 |
|
Note 2 — The Company
Hill International, Inc. (“Hill” or the “Company”) is a professional services firm that provides program management, project management, construction management, construction claims and other consulting services primarily to the buildings, transportation, environmental, energy and industrial markets worldwide. Hill’s clients include the U.S. federal government, U.S. state and local governments, foreign governments and the private sector. The Company is organized into two key operating divisions: the Project Management Group and the Construction Claims Group.
Note 3 — Summary of Significant Accounting Policies
(a) Basis of Presentation
The accompanying consolidated financial statements were prepared in accordance with accounting principles generally accepted in the United States. The consolidated financial statements include the accounts of Hill International, Inc. and its majority owned subsidiaries. All intercompany balances and transactions have been eliminated in consolidation.
(b) Use of Estimates
The preparation of financial statements in conformity with accounting principles generally accepted in the United States requires management to make estimates and assumptions that affect the reported amounts of assets and liabilities and disclosure of contingent assets and liabilities at the date of the financial statements and the reported amounts of revenue and expenses during the reporting period. Actual results could differ from those estimates. The estimates affecting the consolidated financial statements that are particularly significant include revenue recognition, allocation of purchase price to acquired intangibles and goodwill, recoverability of long-lived assets, income taxes, allowance for doubtful accounts and commitments and contingencies.
(c) Foreign Currency Translations and Transactions
Assets and liabilities of all foreign operations are translated at year-end rates of exchange, and the statements of operations are translated at the average rates of exchange for the year. Gains or losses resulting from translating foreign currency financial statements are accumulated in a separate component of stockholders’ equity entitled accumulated other comprehensive loss until the entity is sold or substantially liquidated.
Gains or losses from foreign currency transactions (transactions denominated in a currency other than the entity’s local currency) are reflected in selling, general and administrative expenses in the consolidated statement of operations.
(d) Fair Value of Financial Instruments
The fair value of financial instruments, which primarily consists of cash and cash equivalents, accounts receivable, accounts payable and due to bank, approximates carrying value due to the short-term nature of the instruments. The carrying value of our various credit facilities approximates fair value as the interest rate is variable. The term loan approximates fair value as the Company recently entered into that agreement.
(e) Cash and Cash Equivalents
Cash and cash equivalents include cash on hand and investments in money market funds and investment grade securities held with high quality financial institutions. The Company considers all highly liquid instruments purchased with a remaining maturity of three months or less at the time of purchase to be cash equivalents.
(f) Restricted Cash
Restricted cash represents cash collateral required to be maintained in foreign bank accounts to serve as collateral for letters of credit, bonds or guarantees on several projects. The cash will remain restricted until the respective project has been completed, which typically is greater than one year.
(g) Concentrations of Credit Risk
Financial instruments that potentially subject the Company to concentrations of credit risk consist principally of cash investments and accounts receivable.
The Company maintains its cash accounts with high quality financial institutions. Although the Company currently believes that the financial institutions, with which it does business, will be able to fulfill their commitments to it, there is no assurance that those institutions will be able to continue to do so.
The Company provides professional services, under contractual arrangements, to domestic and foreign governmental units, institutions and the private sector. To reduce credit risk, the Company performs ongoing credit evaluations of its clients and does not require collateral beyond customary retainers.
The Company had no clients that accounted for 10% or more of accounts receivable. The following table shows the number of the Company’s clients which contributed 10% or more of revenue:
|
|
|
Years Ended December 31, |
| ||||
|
|
|
2014 |
|
2013 |
|
2012 |
|
|
Number of 10% clients |
|
1 |
|
— |
|
— |
|
|
Percentage of total revenue |
|
10 |
% |
N/A |
|
N/A |
|
The following provides information with respect to total revenue from contracts with U.S. federal government agencies:
|
|
|
Years Ended December 31, |
| ||||
|
|
|
2014 |
|
2013 |
|
2012 |
|
|
Percentage of total revenue |
|
3 |
% |
3 |
% |
3 |
% |
(h) Allowance for Doubtful Accounts
The allowance for doubtful accounts is an estimate prepared by management based on identification of the collectibility of specific accounts and the overall condition of the receivable portfolios. When evaluating the adequacy of the allowance for doubtful accounts, the Company specifically analyzes trade receivables, including retainage receivable, historical bad debts, client credits, client concentrations, client credit worthiness, current economic trends and changes in client payment terms. If the financial condition of clients were to deteriorate, resulting in an impairment of their ability to make payments, additional allowances may be required. Likewise, should the Company determine that it would be able to realize more of its receivables in the future than previously estimated, an adjustment to the allowance would increase earnings in the period such determination was made. The allowance for doubtful accounts is reviewed on a quarterly basis and adjustments are recorded as deemed necessary.
(i) Property and Equipment
Property and equipment is stated at cost, less accumulated depreciation and amortization. Depreciation and amortization is provided over the estimated useful lives of the assets as follows:
|
|
|
Method |
|
Estimated Useful Life |
|
|
|
|
|
|
|
Furniture and equipment |
|
Straight-line |
|
10 years |
|
Leasehold improvements |
|
Straight-line |
|
Shorter of estimated useful life or lease term |
|
Computer equipment and software |
|
Straight-line |
|
3 to 5 years |
|
Automobiles |
|
Straight-line |
|
5 years |
The Company capitalizes costs associated with internally developed and/or purchased software systems that have reached the application development stage and meet recoverability tests. Capitalized costs include external direct costs of materials and services utilized in developing or obtaining internal-use software, payroll and payroll-related expenses for employees who are directly associated with and devote time to the internal-use software project. Capitalization of such costs begins when the preliminary project stage is complete and ceases no later than the point at which the project is substantially complete and ready for its intended purpose. Costs for general and administrative, overhead, maintenance and training, as well as the cost of software that does not add functionality to existing systems, are expensed as incurred.
Upon retirement or other disposition of these assets, the cost and related depreciation are removed from the accounts and the resulting gain or loss, if any, is reflected in results of operations. Expenditures for maintenance, repairs and renewals of minor items are charged to expense as incurred. Major renewals and improvements are capitalized.
(j) Retainage Receivable
Retainage receivable represents balances billed but not paid by clients pursuant to retainage provisions in the construction management contracts and will be due upon completion of specific tasks or the completion of the contract. The current portion of retainage receivable is included in accounts receivable and the long-term portion of retainage receivable is included in retainage receivable in the consolidated balance sheets.
(k) Long-Lived Assets
Acquired intangible assets consist of contract rights, client related intangibles and trade names arising from the Company’s acquisitions. Contract rights represent the fair value of contracts in progress and backlog of an acquired entity. For intangible assets purchased in a business combination, the estimated fair values of the assets are used to establish the cost bases. Valuation techniques consistent with the market approach, the income approach and the cost approach are used to measure fair value. These assets are amortized over their estimated lives which range from three to fifteen years.
The Company reviews long-lived assets to be held-and-used for impairment whenever events or changes in circumstances indicate that the carrying amount of the assets may not be recoverable. If the sum of the undiscounted expected future cash flows over the remaining useful life of a long-lived asset is less than its carrying amount, the asset is considered to be impaired. Impairment losses are measured as the amount by which the carrying amount of the asset exceeds the fair value of the asset. When fair values are not available, the Company estimates fair value using the expected future cash flow discounted at a rate commensurate with the risks associated with the recovery of the asset. Assets to be disposed of are reported at the lower of carrying amount or fair value less costs to sell.
(l) Goodwill
Goodwill represents the excess of purchase price and other related costs over the value assigned to the net tangible and identifiable intangible assets of businesses acquired. Acquired intangible assets other than goodwill are amortized over their useful lives. For intangible assets purchased in a business combination, the estimated fair values of the assets are
used to establish the cost bases. Valuation techniques consistent with the market approach and the income approach are used to measure fair value.
Goodwill is tested annually for impairment in its fiscal third quarter. The Company has determined that it has two reporting units, the Project Management unit and the Construction Claims unit. The Company made that determination based on the similarity of the services provided, the methodologies in delivering our services and the similarity of the client base in each of these units. Goodwill is assessed for impairment using a two-step approach. In the first step of the impairment test, the Company compares the fair value of the reporting unit in which the goodwill resides to its carrying value. To the extent the carrying amount of a reporting unit exceeds its fair value, an indication exists that the reporting unit’s goodwill may be impaired and the Company must perform a second more detailed assessment. The second step, if necessary, involves allocating the reporting unit’s fair value to all of its recognized and unrecognized assets and liabilities in order to determine the implied fair value of the reporting unit’s goodwill as of the assessment date. The implied fair value of the reporting unit’s goodwill is then compared to the carrying amount of goodwill to quantify an impairment charge as of the assessment date.
Application of the goodwill impairment test requires significant judgments including estimation of future cash flows, which is dependent on internal forecasts, estimation of the long-term rate of growth for the businesses, the useful life over which cash flows will occur, and determination of the Company’s weighted average cost of capital. The Company’s changes in estimates and assumptions could materially affect the determination of fair value and/or conclusions on goodwill impairment for each reporting unit. The Company performed its annual impairment test effective July 1, 2014 and noted no impairment for either of its reporting units. In the future, the Company will continue to perform the annual test during its fiscal third quarter unless events or circumstances indicate an impairment may have occurred before that time.
(m) Investments
Hill International (Spain), S.A.
The Company’s subsidiary, Hill International (Spain), S.A. (“Hill Spain”), has the following cost-basis investments:
· Concessia, Cartera y Gestion de Infrastructuras, S.A. (“Concessia”) —Hill Spain has made payments totaling $4,239,000 towards an initial 5.16% interest in this entity which invests in the equity of companies which finance, construct and operate various public and private infrastructure projects. The payments represented approximately 66% of Hill Spain’s total required capital contribution. Hill Spain had accrued the remaining commitment of approximately $2,120,000 and had included that amount in the cost of the investment and in other liabilities in the accompanying consolidated balance sheet at December 31, 2012. During 2013, the aggregate capitalization of Concessia was reduced from approximately €93,000,000 to approximately €71,000,000. At that time, Hill Spain chose to reduce its total investment to a 4.45% interest and to distribute the excess 0.71% interest to the other shareholders of Concessia. Hill Spain has reduced both the cost of the investment and other liabilities by $2,120,000.
· Nuevo Hospital de Burgos, S.A. – Hill Spain paid $3,761,000 for a 5.18% interest in this entity which, on completion of construction, will operate a new hospital in Burgos, Spain. On January 12, 2012 Hill Spain signed an agreement to sell its entire holding to its affiliate Concessia which is subject to the approval of the local authority, the owner of the facility and the financial institutions involved in the project. Hill Spain received a down payment of $3,149,000 and has accrued a receivable for $612,000. Although the final price is subject to certain conditions, the Company expects the investment to be fully recovered.
Other
The Company will, in the ordinary course, form joint ventures for specific projects. These joint ventures typically require limited or no investment and simply provide a pass-through for the Company’s billings. Any distributions in excess of the Company’s billings are accounted for as income when received.
(n) Due to Bank
Under the Company’s cash-management system, certain cash accounts reflect credit balances to the extent checks were disbursed but not immediately funded at the bank. The Company manages this process daily and ensures all checks are funded when presented.
(o) Deferred Revenue
In certain instances the Company may collect advance payments from clients for future services. Upon receipt, the payments are reflected as deferred revenue in the Company’s consolidated balance sheets. As the services are performed, the Company reduces the balance and recognizes revenue.
(p) Deferred Rent
Rent expenses for operating leases which include scheduled rent increases is determined by expensing the total amount of rent due over the life of the operating lease on a straight-line basis. The difference between the rent paid under the terms of the lease and the rent expensed on a straight-line basis is recorded as a liability. The deferred rent at December 31, 2014 and 2013 was $2,968,000 and $3,043,000, respectively, and is included in other liabilities in the consolidated balance sheet.
(q) Income Taxes
The Company estimates income taxes in each of the jurisdictions in which it operates. This process involves estimating its actual current tax exposure together with assessing temporary differences resulting from differing treatment of items for tax and accounting purposes. These differences result in deferred tax assets and liabilities, which are included within the Company’s consolidated balance sheets. The Company assesses the likelihood that the deferred tax assets will be recovered from future taxable income and to the extent it believes recovery is not likely, the Company establishes a valuation allowance. To the extent the Company establishes a valuation allowance in a period, it must include an expense within the tax provision in the consolidated statements of earnings. The Company has recorded a valuation allowance to reduce the deferred tax asset to an amount that is more likely to be realized in future years. If the Company determines in the future that it is more likely that the deferred tax assets subject to the valuation allowance will be realized, then the previously provided valuation allowance will be adjusted.
The Company recognizes a tax benefit in the financial statements for an uncertain tax position only if management’s assessment is that the position is “more likely than not” (i.e., a likelihood greater than 50 percent) to be allowed by the tax jurisdiction based solely on the technical merits of the position. The term “tax position” refers to a position in a previously filed tax return or a position expected to be taken in a future tax return that is reflected in measuring current or deferred income tax assets and liabilities for interim or annual periods.
(r) Revenue Recognition
The Company generates revenue primarily from providing professional services to its clients. Revenue is generally recognized upon the performance of services. In providing these services, the Company may incur reimbursable expenses, which consist principally of amounts paid to subcontractors and other third parties and travel and other job related expenses that are contractually reimbursable from clients. The Company has determined that it will include reimbursable expenses in computing and reporting its total revenue as long as the Company remains responsible to the client for the fulfillment of the contract and for the overall acceptability of all services provided.
The Company earns its revenue from time-and-materials, cost-plus and fixed-price contracts. If estimated total costs on any contract indicate a loss, the Company charges the entire estimated loss to operations in the period the loss becomes known. The cumulative effect of revisions to revenue, estimated costs to complete contracts, including penalties, incentive awards, change orders, claims, anticipated losses, and others are recorded in the accounting period in which the events indicating a loss are known and the loss can be reasonably estimated. Such revisions could occur at any time and the effects may be material.
Time-and-Materials Contracts
Under its time-and-materials contracts, the Company negotiates hourly billing rates and charges its clients based on the actual time that the Company spends on a project. In addition, clients reimburse the Company for its actual out-of-pocket costs of materials and other direct incidental expenditures that the Company incurs in connection with its performance under the contract. Its profit margins on time-and-materials contracts fluctuate based on actual labor and overhead costs that the Company directly charges or allocates to contracts compared with negotiated billing rates. Revenue on these contracts are recognized based on the actual number of hours the Company spends on the projects plus any actual out-of-pocket costs of materials and other direct incidental expenditures that the Company incurs on the projects. Its time-and-materials contracts generally include annual billing rate adjustment provisions.
Cost-Plus Contracts
The Company has two major types of cost-plus contracts:
Cost-Plus Fixed Fee
Under cost-plus fixed fee contracts, the Company charges its clients for its costs, including both direct and indirect costs, plus a fixed negotiated fee. In negotiating a cost-plus fixed fee contract, the Company estimates all recoverable direct and indirect costs and then adds a fixed profit component. The total estimated cost plus the negotiated fee represents the total contract value. The Company recognizes revenue based on the actual labor costs, based on hours of labor effort, plus non-labor costs the Company incurs, plus the portion of the fixed fee the Company has earned to date. The Company invoices for its services as revenue is recognized or in accordance with agreed-upon billing schedules. Aggregate revenue from cost-plus fixed fee contracts may vary based on the actual number of labor hours worked and other actual contract costs incurred. However, if actual labor hours and other contract costs exceed the original estimate agreed to by its client, the Company generally must obtain a change order, contract modification, or successfully prevail in a claim in order to receive additional revenue relating to the additional costs (see “Change Orders and Claims”).
Cost-Plus Fixed Rate
Under its cost-plus fixed rate contracts, the Company charges clients for its costs plus negotiated rates based on its indirect costs. In negotiating a cost-plus fixed rate contract, the Company estimates all recoverable direct and indirect costs and then adds a profit component, which is a percentage of total recoverable costs to arrive at a total dollar estimate for the project. The Company recognizes revenue based on the actual total number of labor hours and other costs the Company expends at the cost plus the fixed rate the Company negotiated. Similar to cost-plus fixed fee contracts, aggregate revenue from cost-plus fixed rate contracts may vary and the Company generally must obtain a change order, contract modification, or successfully prevail in a claim in order to receive additional revenue relating to any additional costs that exceed the original contract estimate (see “Change Orders and Claims”).
Labor costs and subcontractor services are the principal components of its direct costs on cost-plus contracts, although some include materials and other direct costs. Some of these contracts include a provision that the total actual costs plus the fee will not exceed a guaranteed price negotiated with the client. Others include rate ceilings that limit the reimbursement for general and administrative costs, overhead costs and materials handling costs. The accounting for these contracts appropriately reflects such guaranteed price or rate ceilings.
Firm Fixed-Price (“FFP”) Contracts
The Company’s FFP contracts have historically accounted for most of its fixed-price contracts. Under FFP contracts, the Company’s clients pay an agreed amount negotiated in advance for a specified scope of work. The Company recognizes revenue on FFP contracts using the percentage-of-completion method (recognizing revenue as costs are incurred). Profit margins the Company recognizes in all periods prior to completion of the project on any FFP contract depend on the accuracy of the Company’s estimates of approximate revenue and expenses and will increase to the extent that its current estimates of aggregate actual costs are below amounts previously estimated. Conversely, if the Company’s current
estimated costs exceed prior estimates, its profit margins will decrease and the Company may realize a loss on a project. In order to increase aggregate revenue on the contract, the Company generally must obtain a change order, contract modification, or successfully prevail in a claim in order to receive payment for the additional costs (see “Change Orders and Claims”).
Change Orders and Claims
Change orders are modifications of an original contract that effectively change the provisions of the contract without adding new provisions. Either the Company or its client may initiate change orders. They may include changes in specifications or design, manner of performance, facilities, equipment, materials, sites and period of completion of the work. Claims are amounts in excess of the agreed contract price that the Company seeks to collect from its clients or others for client-caused delays, errors in specifications and designs, contract terminations, change orders that are either in dispute or are unapproved as to both scope and price, or other causes of unanticipated additional contract costs.
Change orders and claims occur when changes are experienced once contract performance is underway. Change orders are sometimes documented and terms of such change orders are agreed with the client before the work is performed. Sometimes circumstances require that work progresses before agreement is reached with the client. Costs related to change orders and claims are recognized when they are incurred. Change orders and claims are included in total estimated contract revenue when it is probable that the change order or claim will result in a bona fide addition to contract value that can be reliably estimated. No profit is recognized on claims until final settlement occurs; unapproved change orders are evaluated as claims. This can lead to a situation where costs are recognized in one period and revenue is recognized when client agreement is obtained or claims resolution occurs, which can be in subsequent periods.
The Company has contracts with the U.S. government that contain provisions requiring compliance with the U.S. Federal Acquisition Regulations (“FAR”). These regulations are generally applicable to all of its federal government contracts and are partially or fully incorporated in many local and state agency contracts. They limit the recovery of certain specified indirect costs on contracts subject to the FAR. Cost-plus contracts covered by the FAR provide for upward or downward adjustments if actual recoverable costs differ from the estimate billed under forward pricing arrangements. Most of its federal government contracts are subject to termination at the convenience of the client. Contracts typically provide for reimbursement of costs incurred and payment of fees earned through the date of such termination.
Federal government contracts which are subject to the FAR and some state and local governmental agencies require audits, which are performed for the most part by the Defense Contract Audit Agency (“DCAA”). The DCAA audits the Company’s overhead rates, cost proposals, incurred government contract costs, and internal control systems. During the course of its audits, the DCAA may question incurred costs if it believes the Company has accounted for such costs in a manner inconsistent with the requirements of the FAR or Cost Accounting Standards and recommend that its U.S. government corporate administrative contracting officer disallow such costs. Historically, the Company has not experienced significant disallowed costs as a result of such audits. However, the Company can provide no assurance that the DCAA audits will not result in material disallowances of incurred costs in the future.
(s) Share-Based Compensation
The Company uses the Black-Scholes option pricing model to measure the estimated fair value of options to purchase the Company’s common stock. The compensation expense, less estimated forfeitures, is being recognized over the service period on a straight-line basis. The Company’s policy is to use newly issued shares to satisfy the exercise of stock options.
(t) Advertising Costs
Advertising costs are expensed as incurred and amounted to the following (in thousands):
|
Years Ended December 31, |
| |||||||
|
2014 |
|
2013 |
|
2012 |
| |||
|
$ |
599 |
|
$ |
396 |
|
$ |
325 |
|
(u) Earnings per Share
Basic earnings per common share has been computed using the weighted-average number of shares of common stock outstanding during the year. Diluted earnings per common share incorporates the incremental shares issuable upon the assumed exercise of stock options using the treasury stock method.
Dilutive stock options increased average common shares outstanding by approximately 225,000 shares for the year ended December 31, 2013.
Options to purchase 3,521,000 shares, 5,364,000 shares and 4,492,000 shares of the Company’s common stock were not included in the calculation of common shares outstanding for the years ended December 31, 2014, 2013 and 2012, respectively, because they were anti-dilutive.
(v) New Accounting Pronouncement
On May 28, 2014, the Financial Accounting Standards Board (“FASB”) issued Accounting Standards Update (“ASU”) No. 2014-09, Revenue from Contracts with Customers, which will replace most existing revenue recognition guidance in U.S. GAAP, including industry-specific guidance. The core principle of the ASU is that an entity should recognize revenue for the transfer of goods or services equal to the amount that it expects to be entitled to receive for those goods or services. The ASU requires additional disclosure about the nature, amount, timing and uncertainty of revenue and cash flows arising from customer contracts, including significant judgments and changes in judgments. The ASU will be effective for interim and annual periods commencing after December 15, 2016 and allows for both retrospective and prospective methods of adoption. Early adoption is not permitted. The Company is in the process of determining the method of adoption and assessing the impact of this ASU on its consolidated financial statements.
Note 4 — Acquisitions
Our recent acquisition activity is detailed below. The Company’s consolidated financial statements include the operating results of these businesses from their respective dates of acquisition. Pro forma results of operations for these acquisitions have not been presented because they are not material to the Company’s consolidated results of operations, either individually or in the aggregate.
The Company expenses all acquisition-related costs plus any anticipated restructuring costs for which it is not obligated at the acquisition date, rather than including such costs as a component of the purchase consideration. During 2014, 2013 and 2012, the Company expensed $263,000, $455,000 and $84,000, respectively, of acquisition-related costs.
Angus Octan Scotland Ltd.
On October 31, 2014, our subsidiary Hill International (UK) Ltd. acquired all of the outstanding common stock of Angus Octan Scotland Ltd., which included its subsidiary companies Cadogan Consultants Ltd., Cadogan Consult Ltd. and Cadogan International Ltd. (collectively, “Cadogans”). Cadogans, with 27 professionals, has offices in Glasgow and Dundee. The acquisition expanded Hill’s construction claims business and provided additional resources in the energy and industrial sectors. Total consideration for the acquisition was £2,719,000 (approximately $4,350,000 at the date of acquisition). The consideration consists of cash payments of £1,000,000 ($1,600,000) at closing, £600,000 ($960,000) on November 25, 2014, £400,000 ($640,000) on December 23, 2014, £519,000 ($830,000) to be paid on October 31, 2015 and an earn-out based upon the average earnings before interest, taxes, depreciation and amortization (“EBITDA”) for the two-year period ending on October 31, 2016 (which amount shall not be less than £0 nor more than £200,000). Two of the selling shareholders may receive an earn-out in five annual installments of up to £100,000 each ($160,000), which will be charged to earnings, provided that Cadogans’ EBITDA for each of the years ending October 31, 2015, 2016, 2017, 2018 and 2019 is equal to or greater than £396,000 ($633,000). The Company accrued the potential additional consideration of £719,000 ($1,150,000), of which £519,000 is included in other current liabilities and £200,000 is included in other liabilities in the consolidated balance sheet at December 31, 2014. The Company acquired intangible assets and goodwill amounting to £1,353,000 (approximately $2,165,000 on the date of acquisition) and £541,000 (approximately $865,000), respectively. The acquired intangible assets have a weighted average life of 8.9 years. The
acquired intangible assets consist of a client relationship intangible of £1,181,000 ($1,890,000) with a ten-year life, a trade name intangible of £82,000 ($131,000) with a two-year life and a contract intangible of £90,000 ($144,000) with a six-month life. Goodwill, which is not deductible for income tax purposes, has been allocated to the Construction Claims operating segment.
Collaborative Partners, Inc.
On December 23, 2013, Hill acquired all of the outstanding common stock of Collaborative Partners, Inc. (“CPI”), a firm that provides project management, strategic planning and regulatory services for healthcare, life sciences, educational, commercial and residential construction projects throughout New England. CPI, which has about 30 professionals, has offices in Boston, Massachusetts and Providence, Rhode Island. The acquisition expands the Company’s project management business in the New England region of the United States. At closing, the sellers received $2,450,000 in the form of 678,670 shares of the Company’s common stock priced at $3.61 per share. On March 7, 2014, the sellers received 171,308 shares of common stock with a value of $618,000 representing CPI’s common equity in excess of $600,000. On December 23, 2014, the sellers were to receive, subject to potential offset, an additional $350,000 (“holdback”) in shares of common stock; the number of shares was determined based on the average closing price of the common stock for the ten trading days ending on December 18, 2014. The Agreement also provided that should the price of the Company’s common stock not increase by 50% to $5.42 on December 23, 2014, the Company will issue additional shares to the sellers representing the difference between $5.42 and the price on December 23, 2014 and (2) the sellers are entitled to receive additional shares of the Company’s common stock for (i) 50% of the operating profit of CPI in excess of $1,000,000 for the first 12-month period after closing, but in no event more than $500,000, and (ii) 5% of the net revenue backlog in excess of $10,000,000 on the date 60 days after closing. The Company estimated and accrued $2,697,000 for the potential additional consideration which was included in other current liabilities in the consolidated balance sheet at December 31, 2013. In April 2014, the portion of the liability attributable to the change in the common stock price was waived by the sellers and the liability was eliminated by a credit of $1,225,000 to selling, general and administrative expenses in the consolidated statement of operations for the year ended December 31, 2014. In addition, a portion of the liability attributable to the holdback in shares was not paid and $215,000 was credited to selling, general and administrative expense in the consolidated statement of operations for the year ended December 31, 2014. In the first quarter of 2015, the Company will settle the amounts due for the holdback, the excess operating profit and backlog by issuing 148,460 shares of its common stock valued at approximately $530,000.
Binnington Copeland & Associates (Pty.) Ltd.
On May 30, 2013, Hill International N.V., the Company’s wholly-owned subsidiary, acquired all of the outstanding common stock of Binnington Copeland & Associates (Pty.) Ltd. and BCA Training (Pty.) Ltd. (together “BCA”). BCA, with 34 professionals, has offices in Johannesburg and Cape Town, South Africa. The acquisition provides the Company’s claims business access to Africa’s large infrastructure and mining projects and allows for expansion into the rest of sub-Saharan Africa. Consideration consisted of $2,000,000 plus a potential earn-out, both payable in shares of the Company’s common stock. The purchase price is payable as follows: $1,072,400 (the “Closing Date Payment”) on the closing date, $927,600 (the “Second Tranche Payment”) on July 31, 2013 and an earn-out (the “Third Tranche Payment”) to be determined in the third quarter of 2014. The Company issued 379,655 shares of its common stock in satisfaction of the Closing Date Payment; the number of shares was determined by dividing the Closing Date Payment by the average closing price of our common stock for the thirty trading days ending on May 17, 2013. On July 31, 2013, the Company issued 331,444 shares of its common stock in satisfaction of the Second Tranche Payment. The number of shares was determined by dividing the Second Tranche Payment by the average closing price of our common stock for the thirty trading days ending on July 19, 2013. The shares issuable in satisfaction of the Third Tranche Payment will be determined by dividing the Third Tranche Payment by the average closing price of our common stock for the thirty trading days ending on July 21, 2014. The actual amount of the Third Tranche Payment will be determined by comparing the average net profit before taxes for the two-year periods ending July 31, 2014 to the net profit before taxes for the year ended July 31, 2012, and multiplying the excess, if any, by 2.205. BCA’s average net profit before taxes for the two years ended July 31, 2014 was not sufficient to earn any of the Third Tranche payment, which had been estimated to be approximately $902,000 at the date of acquisition. Since no amount is due to the selling shareholders, the liability has been eliminated by a credit of $893,000 to selling, general and administrative expenses in the consolidated statements of operations for the year ended December 31, 2014.
Engineering S.A.
On February 28, 2011, the Company’s subsidiary, Hill Spain, indirectly acquired 60% of the outstanding common stock of Engineering S.A., one of the largest project management firms in Brazil with approximately 400 professionals. It has main offices in Rio de Janeiro and Sao Paulo and an additional office in Parauapebas. Engineering S.A. provides project management, construction management and engineering consulting services throughout Brazil. Total consideration will not exceed 42,000,000 Brazilian Reais (“BR”) (approximately $25,336,000 at the date of acquisition) consisting of an initial cash payment of BR22,200,000 (approximately $13,392,000) plus minimum additional payments of BR7,400,000 (approximately $4,464,000) due on each of April 30, 2012 and 2013 and a potential additional payment of BR5,000,000 ($3,016,000). The Company acquired intangible assets and goodwill amounting to BR24,540,000 ($14,783,000) and BR46,339,000 ($27,987,000), respectively. The acquired intangible assets have a weighted average life of 7.7 years. The acquired intangible assets consist of a client relationship intangible of BR13,942,000 ($8,399,000) with a ten-year life, a contract intangible of BR8,385,000 ($5,051,000) with a two-year life and a trade name intangible of BR2,213,000 ($1,333,000) with a fifteen-year life. Goodwill, which is deductible for income tax purposes, has been allocated to the Project Management operating segment. Also, ESA’s shareholders entered into an agreement whereby the minority shareholders have a right to compel (“ESA Put Option”) Hill Spain to purchase any or all of their shares during the period from February 28, 2014 to February 28, 2021. Hill Spain also has the right to compel (“ESA Call Option”) the minority shareholders to sell any or all of their shares during the same time period. The purchase price for such shares shall be seven times the earnings before interest and taxes for ESA’s most recently ended fiscal year, net of any financial debt plus excess cash multiplied by a percentage which the shares to be purchased bear to the total number of shares outstanding at the time of purchase, but in the event the ESA Call Option is exercised by Hill Spain, the purchase price shall be increased by five percent. The ESA Put Option and the ESA Call Option must be made within three months after the audited financial statements of ESA have been completed. In April 2014, two of the minority shareholders exercised their ESA Put Option whereby Hill Spain paid approximately 7,838,000 Brazilian Reais (approximately $3,556,000) in October 2014. After the transaction, Hill Spain owns approximately 72% of ESA. In accordance with the guidance in ASC 810-10-45-23, under Changes in the Parent’s Ownership Interest in a Subsidiary When There Is No Change in Control, the Company has accounted for this transaction as an equity transaction. Accordingly, Hill Spain reduced noncontrolling interests by 5,839,000 Brazilian Reais (approximately $2,649,000), and reduced additional paid in capital by approximately 1,999,000 Brazilian Reais (approximately $907,000) which represents the excess of the fair value over the amount of the adjustment to noncontrolling interests.
The Company estimated the fair value of the potential additional payments to total approximately BR17,200,000 (approximately $10,376,000) and has discounted these amounts using an interest rate of 4.72%, the weighted average interest rate on the outstanding borrowings under the Company’s credit agreement at the acquisition date. The Company paid the first installment amounting to 6,624,000 BRL (approximately $3,508,000 on April 30, 2012 and paid the second installment amounting to 11,372,000 BRL (approximately $5,095,000) on July 23, 2013.
Gerens Management Group, S.A.
On February 15, 2008, the Company’s subsidiary, Hill International N.V. (formerly Hill International S.A.), acquired 60% of the outstanding capital stock of Gerens Management Group, S.A., whose name was subsequently changed to Hill International (Spain), S.A. (“Hill Spain”). In connection with the acquisition, Hill Spain’s shareholders entered into an agreement whereby the minority shareholders have a right to compel (“Gerens Put Option”) Hill International N.V. to purchase any or all of their shares during the period from March 31, 2010 to March 31, 2020. Hill International N.V. also has the right to compel the minority shareholders to sell any or all of their shares during the period from March 31, 2011 to March 31, 2021. The purchase price for such shares shall be the greater of (a) €18,000,000 ($23,808,000 as of December 31, 2012) increased by the General Price Index (capped at 3.5% per annum) or (b) ten times Hill Spain’s earnings before interest and income taxes for the prior fiscal year, multiplied by a percentage which the shares to be purchased bear to the total number of shares outstanding at the time of purchase. Such amount may be adjusted for increases in equity subsequent to the acquisition date, and can be paid in cash or shares of our common stock at the option of the sellers.
During late 2011 through late 2012, ten minority shareholders, who owned approximately 23.9% of the outstanding common stock of Hill Spain, exercised their Gerens Put Options. On January 3, 2013, the Company paid for the additional interest by paying approximately €7,166,000 (approximately $9,477,000) including interest of approximately €115,000 (approximately $152,000) which was charged to interest expense in the consolidated statement of operations for the year ended December 31, 2012. In connection with the transactions, the Company reduced noncontrolling interests by €2,717,000 (approximately $3,594,000), increased goodwill by €1,300,000 (approximately $1,720,000) and increased intangible assets by €4,334,000 (approximately $5,580,000) during 2012.
During 2013, the remaining minority shareholders, who owned approximately 6.8% of the outstanding common stock of Hill Spain, exercised their Gerens Put Options. The Company now owns 100% of Hill Spain. The aggregate consideration plus interest was paid on December 4, 2013 in the amount of €2,031,000 (approximately $2,793,000). The balance included interest of approximately €42,000 (approximately $56,000). In connection with the transactions, the Company reduced noncontrolling interests by €828,000 (approximately $1,094,000), increased goodwill by €348,000 (approximately $460,000) and increased intangible assets by approximately €1,161,000 (approximately $1,534,000).
Note 5 — Accounts Receivable
The components of accounts receivable are as follows (in thousands):
|
|
|
December 31, |
| |||||||
|
|
|
2014 |
|
2013 |
|
2012 |
| |||
|
|
|
(Restated) |
|
(Restated) |
|
(Restated) |
| |||
|
Billed |
|
$ |
210,460 |
|
$ |
206,469 |
|
$ |
181,075 |
|
|
Retainage, current portion |
|
12,700 |
|
10,215 |
|
5,022 |
| |||
|
Unbilled |
|
32,739 |
|
24,857 |
|
35,347 |
| |||
|
|
|
255,899 |
|
241,541 |
|
221,444 |
| |||
|
Allowance for doubtful accounts |
|
(60,801 |
) |
(66,856 |
) |
(70,205 |
) | |||
|
Total |
|
$ |
195,098 |
|
$ |
174,685 |
|
$ |
151,239 |
|
Unbilled receivables primarily represent revenue earned on contracts, which the Company is contractually precluded from billing until predetermined future dates.
Included in billed receivables are $1,562,000 and $2,030,000 of the amounts due from various branches of the U.S. federal government and $100,773,000 and $99,643,000 of receivables from foreign governments at December 31, 2014 and December 31, 2013, respectively.
Bad debt expense of ($2,344,000), $1,317,000 and $63,146,000 is included in selling, general and administrative expenses in the consolidated statements of operations for the years ended December 31, 2014, 2013 and 2012, respectively.
The Company has open but inactive contracts with the Libyan Organization for the Development and Administrative Centres (“ODAC”). Due to the civil unrest which commenced in Libya in February 2011, the Company suspended its operations in and demobilized substantially all of its personnel from Libya. At December 31, 2012, the balance of the Libya Receivable was approximately $59,937,000. Because of the continuing political instability in Libya, we established a reserve for the full amount of the Libya Receivable which was charged to selling, general and administrative (“SG&A”) expenses for the year ended December 31, 2012. During 2013, the Company received approximately $2,880,000 against the Libya Receivable, which included 2,900,000 Libyan Dinars (“LYD”) ($2,276,000) that was paid directly to Hill and approximately LYD 783,000 ($604,000) that was paid to the Libyan tax authorities on Hill’s behalf. These receipts have been reflected as a reduction of SG&A expenses for the year ended December 31, 2013. During 2014, the Company received approximately $6,631,000 against the Libya Receivable, which included LYD 2,150,000 ($1,706,000), GBP 206,000 ($343,000) and $4,582,000 in U.S. dollars, which has been reflected as a reduction of SG&A expenses for the year ended December 31, 2014. At December 31, 2014, after a decrease of approximately $767,000 due to the effect of foreign exchange translation losses, the Libya Receivable was approximately $49,659,000 which continues to be fully reserved. It is management’s intention to continue to pursue collection of monies owed to the Company by ODAC and, if
subsequent payments are received, the Company will reflect such receipts, net of any third party obligations related to the collections, as reductions of SG&A expenses.
Note 6 — Property and Equipment
|
|
|
December 31, |
| |||||||
|
|
|
2014 |
|
2013 |
|
2012 |
| |||
|
|
|
|
|
(in thousands) |
|
|
| |||
|
Furniture and equipment |
|
$ |
12,163 |
|
$ |
11,190 |
|
$ |
10,495 |
|
|
Leasehold improvements |
|
4,196 |
|
3,965 |
|
3,491 |
| |||
|
Automobiles |
|
1,696 |
|
1,576 |
|
1,648 |
| |||
|
Computer equipment and software |
|
24,088 |
|
22,656 |
|
21,791 |
| |||
|
|
|
42,143 |
|
39,387 |
|
37,425 |
| |||
|
Less accumulated depreciation and amortization |
|
(30,500 |
) |
(28,774 |
) |
(26,157 |
) | |||
|
Property and equipment, net |
|
$ |
11,643 |
|
$ |
10,613 |
|
$ |
11,268 |
|
Information with respect to depreciation expense is as follows:
|
|
|
Years Ended December 31, |
| |||||||
|
|
|
2014 |
|
2013 |
|
2012 |
| |||
|
|
|
|
|
(in thousands) |
|
|
| |||
|
|
|
|
|
|
|
|
| |||
|
Total depreciation expense |
|
$ |
3,643 |
|
$ |
4,166 |
|
$ |
4,394 |
|
|
Portion charged to cost of services |
|
$ |
1,293 |
|
$ |
1,227 |
|
$ |
1,350 |
|
|
Portion charged to selling, general and administrative expense |
|
$ |
2,350 |
|
$ |
2,939 |
|
$ |
3,044 |
|
Note 7 — Intangible Assets
The following table summarizes the Company’s acquired intangible assets:
|
|
|
December 31, |
| ||||||||||||||||
|
|
|
2014 |
|
2013 |
|
2012 |
| ||||||||||||
|
|
|
Gross |
|
|
|
Gross |
|
|
|
Gross |
|
|
| ||||||
|
|
|
Carrying |
|
Accumulated |
|
Carrying |
|
Accumulated |
|
Carrying |
|
Accumulated |
| ||||||
|
|
|
Amount |
|
Amortization |
|
Amount |
|
Amortization |
|
Amount |
|
Amortization |
| ||||||
|
|
|
(in thousands) |
| ||||||||||||||||
|
Client relationships |
|
$ |
36,412 |
|
$ |
20,758 |
|
$ |
37,501 |
|
$ |
18,238 |
|
$ |
36,506 |
|
$ |
14,175 |
|
|
Acquired contract rights |
|
11,387 |
|
9,717 |
|
11,874 |
|
8,541 |
|
10,449 |
|
6,931 |
| ||||||
|
Trade names |
|
3,023 |
|
1,065 |
|
3,266 |
|
898 |
|
3,042 |
|
643 |
| ||||||
|
Total |
|
$ |
50,822 |
|
$ |
31,540 |
|
$ |
52,641 |
|
$ |
27,677 |
|
$ |
49,997 |
|
$ |
21,749 |
|
|
|
|
|
|
|
|
|
|
|
|
|
|
|
| ||||||
|
Intangible assets, net |
|
$ |
19,282 |
|
|
|
$ |
24,964 |
|
|
|
$ |
28,248 |
|
|
| |||
Amortization expense related to intangible assets was as follows:
|
Years Ended December 31, |
| |||||||
|
2014 |
|
2013 |
|
2012 |
| |||
|
|
|
(in thousands) |
|
|
| |||
|
$ |
6,180 |
|
$ |
6,590 |
|
$ |
8,036 |
|
The following table presents the estimated amortization expense based on our present intangible assets for the next five years:
|
|
|
Estimated |
| |
|
|
|
Amortization |
| |
|
Years Ending December 31, |
|
Expense |
| |
|
|
|
(in thousands) |
| |
|
2015 |
|
$ |
5,485 |
|
|
2016 |
|
4,014 |
| |
|
2017 |
|
3,005 |
| |
|
2018 |
|
2,041 |
| |
|
2019 |
|
1,760 |
| |
Note 8 — Goodwill
The addition to goodwill in 2012 is due to the impact of deferred income taxes on the intangible assets acquired in the purchase of an additional interest in Gerens Hill.
The addition to goodwill in 2013 is due to the acquisitions of BCA ($1,285,000) and CPI ($3,049,000) and the impact of deferred income taxes on the intangible assets acquired in the purchase of an additional equity interest in Hill Spain ($460,000).
The addition to goodwill in 2014 is due to the acquisition of Cadogans ($865,000).
The following table summarizes the changes in the Company’s carrying value of goodwill during 2014, 2013 and 2012:
|
|
|
Project |
|
Construction |
|
|
| |||
|
|
|
Management |
|
Claims |
|
Total |
| |||
|
|
|
|
|
(in thousands) |
|
|
| |||
|
|
|
|
|
|
|
|
| |||
|
Balance, December 31, 2011 |
|
$ |
56,896 |
|
$ |
26,045 |
|
$ |
82,941 |
|
|
Additions |
|
1,720 |
|
— |
|
1,720 |
| |||
|
Translation adjustments |
|
(1,385 |
) |
731 |
|
(654 |
) | |||
|
Balance, December 31, 2012 |
|
57,231 |
|
26,776 |
|
84,007 |
| |||
|
Additions |
|
3,509 |
|
1,285 |
|
4,794 |
| |||
|
Translation adjustments |
|
(2,292 |
) |
(656 |
) |
(2,948 |
) | |||
|
Balance, December 31, 2013 |
|
58,448 |
|
27,405 |
|
85,853 |
| |||
|
Additions |
|
— |
|
865 |
|
865 |
| |||
|
Translation adjustments |
|
(4,779 |
) |
(1,502 |
) |
(6,281 |
) | |||
|
Balance, December 31, 2014 |
|
$ |
53,669 |
|
$ |
26,768 |
|
$ |
80,437 |
|
Note 9 — Accounts Payable and Accrued Expenses
Below are the components of accounts payable and accrued expenses (in thousands):
|
|
|
December 31, |
| |||||||
|
|
|
2014 |
|
2013 |
|
2012 |
| |||
|
|
|
(Restated) |
|
(Restated) |
|
(Restated) |
| |||
|
Accounts payable |
|
$ |
32,701 |
|
$ |
25,349 |
|
$ |
24,486 |
|
|
Accrued payroll and related expenses |
|
41,205 |
|
35,732 |
|
33,750 |
| |||
|
Accrued subcontractor fees |
|
3,930 |
|
6,212 |
|
8,253 |
| |||
|
Accrued agency fees |
|
6,920 |
|
6,247 |
|
4,933 |
| |||
|
Accrued legal and professional fees |
|
1,099 |
|
1,239 |
|
3,303 |
| |||
|
Other accrued expenses |
|
7,782 |
|
6,115 |
|
4,275 |
| |||
|
|
|
$ |
93,637 |
|
$ |
80,894 |
|
$ |
79,000 |
|
In connection with establishing a reserve against the Libya Receivable (see Note 5), the Company eliminated the related accruals for agency fees and certain taxes by an $11,306,000 reduction of SG&A expenses in the consolidated statement of operations for the year ended December 31, 2012 as these costs pursuant to the related agreements will not be paid unless the Company collects the receivable. As monies are collected, the Company intends to charge the related accruals to SG&A expenses. Accordingly, the Company charged $1,683,000 and $640,000 to SG&A for the years ended December 31, 2014 and 2013, respectively, as the Company received payments related to the Libya Receivable in each of those periods.
Note 10 — Notes Payable and Long-Term Debt
Outstanding debt obligations are as follows (in thousands):
|
|
|
December 31, |
| |||||||
|
|
|
2014 |
|
2013 |
|
2012 |
| |||
|
2014 Term Loan Facility |
|
$ |
119,700 |
|
$ |
— |
|
$ |
— |
|
|
2012 Term Loan Payable |
|
— |
|
84,474 |
|
76,520 |
| |||
|
2009 Revolving credit loan payable under the Credit Agreement (the weighted average interest rate of all borrowings was 5.32% at December 31, 2013 |
|
— |
|
39,000 |
|
22,300 |
| |||
|
2014 Domestic Revolving Credit Facility |
|
200 |
|
|
|
|
| |||
|
2014 International Revolving Credit Facility |
|
2,554 |
|
|
|
|
| |||
|
Borrowings under revolving credit facilities with a consortium of banks in Spain |
|
5,037 |
|
7,670 |
|
5,021 |
| |||
|
Payments due for the Engineering S.A. acquisition |
|
— |
|
— |
|
5,327 |
| |||
|
Borrowings under unsecured credit facility with Ibercaja Bank in Spain |
|
745 |
|
2,047 |
|
— |
| |||
|
Other notes payable |
|
— |
|
68 |
|
267 |
| |||
|
|
|
128,236 |
|
133,259 |
|
109,435 |
| |||
|
Less current maturities |
|
6,361 |
|
18,974 |
|
21,769 |
| |||
|
Notes payable and long-term debt, net of current maturities |
|
$ |
121,875 |
|
$ |
114,285 |
|
$ |
87,666 |
|
Refinancing
On June 12, 2014, the Company and its subsidiary Hill International N.V. (the “Subsidiary”) entered into a Commitment Letter with Société Générale (the “Agent”) and SG Americas Securities, LLC, (the “Arranger”) pursuant to which the Arranger and the Agent committed to provide secured debt facilities to the Company in an aggregate principal amount of $165,000,000 which would be used to payoff and terminate the Company’s then-existing senior credit facility with a bank group led by Bank of America, N.A. and its then-existing second lien term loan with funds managed by Tennenbaum Capital Partners, LLC.
Effective as of September 26, 2014 (the “Closing Date”), the Company, entered into a credit agreement with the Agent as administrative agent and collateral agent, TD Bank, N.A., as syndication agent and HSBC Bank USA, N.A., as documentation agent, (collectively, the “U.S. Lenders”) consisting of a term loan facility of $120,000,000 (the “Term Loan Facility”) and a $30,000,000 U.S. dollar-denominated facility available to the Company (the “U.S. Revolver,” together with the Term Loan Facility, the “U.S. Credit Facilities”) and a credit agreement with the Agent as administrative agent and collateral agent, (the “International Lender”) providing a $15,000,000 Euro-denominated facility available to the Subsidiary (the “International Revolver” and together with the U.S. Revolver, the “Revolving Credit Facilities” and, together with the U.S. Credit Facilities, the “Secured Credit Facilities”). The U.S. Revolver and the International Revolver include sub-limits for letters of credit amounting to $25,000,000 and $10,000,000, respectively.
The Secured Credit Facilities contain customary default provisions, representations and warranties, and affirmative and negative covenants, and require the Company to comply with certain financial and reporting covenants (see Note 19). The financial covenants consist of a Maximum Consolidated Net Leverage Ratio and an Excess Account Concentration requirement commencing on December 31, 2014. The Consolidated Net Leverage Ratio is the ratio of (a) consolidated total debt (minus cash of up to $10,000,000 held in the aggregate) to consolidated earnings before interest, taxes, depreciation, amortization, non-cash items (including adjustments related to the Libya Receivable) and share-based compensation for the trailing twelve months. The Excess Account Concentration covenant permits the U. S. Lenders and the International Lender to increase the interest rates by 2.0% if, as of the last day of any fiscal quarter, either (a) the accounts receivable from any country not listed as a Permitted Country as defined in the Secured Credit Facilities (other than the United Arab Emirates) that are more than 120 days old (relative to the invoice date) constitute more than 10% of the total outstanding accounts receivable or (b) accounts receivable from any individual client located in the United Arab Emirates that are more than 120 days old (relative to the invoice date) constitute more than 14% of the total outstanding accounts receivable; provided that, in each case, the accounts receivable due from clients located in Libya that exist as of the Closing Date shall be excluded for all purposes of this covenant. The interest rate will be reset as soon as the accounts receivable over 120 days decline below the 10% or 14% levels. At December 31, 2014, no client’s accounts receivable exceeded the proscribed limits.
The following tables set forth the Maximum Consolidated Net Leverage Ratio requirements for all reporting periods and the Company’s actual ratio at December 31, 2014:
|
Period ending |
|
Not to exceed |
|
Actual |
|
|
|
|
|
(Restated) |
|
December 31, 2014 |
|
3.50 |
|
2.77 |
|
March 31, 2015 |
|
3.50 |
|
|
|
June 30, 2015 |
|
3.50 |
|
|
|
September 30, 2015 |
|
3.25 |
|
|
|
December 31, 2015 |
|
3.25 |
|
|
|
March 31, 2016 |
|
3.00 |
|
|
|
June 30, 2016 |
|
3.00 |
|
|
|
September 30, 2016 |
|
2.75 |
|
|
|
December 31, 2016 |
|
2.75 |
|
|
|
March 31, 2017 |
|
2.50 |
|
|
|
June 30, 2017 |
|
2.50 |
|
|
|
September 30, 2017 |
|
2.25 |
|
|
|
December 31, 2017 |
|
2.25 |
|
|
|
March 31, 2018 |
|
2.00 |
|
|
|
June 30, 2018 |
|
2.00 |
|
|
|
September 30, 2018 |
|
2.00 |
|
|
|
December 31, 2018 |
|
2.00 |
|
|
|
Thereafter |
|
1.75 |
|
|
The U.S. Credit Facilities are guaranteed by certain U.S. subsidiaries of the Company, and the International Revolver is guaranteed by the Company and certain of the Company’s U.S. and non-U.S. subsidiaries.
In connection with the Refinancing, the Company wrote off deferred financing fees amounting to $1,482,000 by a charge to interest expense and related financing fees, net for the year ended December 31, 2014.
Term Loan Facility
The Company used the proceeds from the Term Loan Facility:
· for consummating the payoff and termination of the Company’s then-existing credit arrangements (the “Refinancing”) which consist of the Credit Agreement, dated as of October 18, 2012, among the Company, certain lenders and Obsidian Agency Services, Inc., as amended (the “2012 Term Loan Agreement”), and the Credit Agreement, dated as of June 30, 2009, among the Company, Bank of America, N.A. and certain other lenders, as amended; and
· to pay fees and expenses incurred in connection with the Secured Credit Facilities.
The interest rate on the Term Loan Facility will be, at the Company’s option, either:
· the London Inter-Bank Offered Rate (“LIBOR”) for the relevant interest period plus 6.75% per annum, provided that such LIBOR shall not be lower than 1.00% per annum; or
· the Base Rate (as described below) plus 5.75% per annum.
The “Base Rate” is a per annum rate equal to the highest of (A) the prime rate, (B) the federal funds effective rate plus 0.50%, or (C) the LIBOR for an interest period of one month plus 1.0% per annum. Upon a default, the applicable rate of interest under the Secured Credit Facilities may increase by 2.0%. The LIBOR on the Term Loan Facilities (including when determining the Base Rate) shall in no event be less than 1.0% per annum.
The Company has the right to prepay the Term Loan Facility in full or in part at any time without premium or penalty; provided, however that upon the occurrence of prepayments relating to certain repricing transactions within the first year following closing, a 1.0% prepayment premium will be payable. The Company is required to make mandatory prepayments of the Term Loan Facility, without premium or penalty, (i) with net proceeds of any issuance or incurrence of indebtedness by the Company after the closing, (ii) with net proceeds from certain asset sales outside the ordinary course of business, and (iii) with 50% of the excess cash flow (as defined in the agreement) for each fiscal year of the Borrowers commencing with the first full fiscal year ending after closing (which percentage would be reduced to 25% if the Consolidated Net Leverage Ratio is equal to or less than 2.25 to 1.00 or reduced to 0% if the Consolidated Net Leverage Ratio is equal to or less than 1.50 to 1.00).
The Term Loan Facility is generally secured by a first-priority security interest in substantially all assets of the Company and certain of the Company’s U.S. subsidiaries other than accounts receivable, cash proceeds thereof and certain bank accounts, as to which the Term Loan Facility is secured by a second-priority security interest.
The Term Loan Facility has a term of six years, requires repayment of 0.25% of the original principal amount on a quarterly basis commencing on December 31, 2014 and ending on September 30, 2020, and was fully funded at closing. Any amounts repaid on the Term Loan Facility will not be available to be re-borrowed.
The Company incurred fees and expenses related to the Term Loan Facility aggregating $7,066,000 which has been deferred and the unamortized balance is included in other assets in the consolidated balance sheet at December 31, 2014. The deferred fees are being amortized to interest and related financing fees, net over a six-year period which commenced on October 1, 2014.
Revolving Credit Facilities
The Company is required to use the proceeds from the Revolving Credit Facilities:
· for the Refinancing;
· to finance the working capital needs and general corporate purposes of the Borrowers and their subsidiaries;
· to pay fees and expenses incurred in connection with the Secured Credit Facilities; and
· for any other purposes not prohibited by the Secured Credit Facilities.
The interest rate on borrowings under the U.S. Revolver will be, at the Company’s option from time to time, either the LIBOR for the relevant interest period plus 3.75% per annum or the Base Rate plus 2.75% per annum.
The interest rate on borrowings under the International Revolver will be the European Inter-Bank Offered Rate, or “EURIBOR,” for the relevant interest period (or at a substitute rate to be determined to the extent EURIBOR is not available) plus 4.00% per annum.
The Company will pay a commitment fee calculated at 0.50% annually on the average daily unused portion of the U.S. Revolver, and the Subsidiary will pay a commitment fee calculated at 0.75% annually on the average daily unused portion of the International Revolver.
The ability to borrow under each of the U.S. Revolver and the International Revolver is subject to a “borrowing base,” calculated using a formula based upon approximately 85% of receivables that meet or satisfy certain criteria (“Eligible Receivables”) and that are subject to a perfected security interest held by either the U.S. Lenders or the International Lender, plus, in the case of the International Revolver only, 10% of Eligible Receivables that are not subject to a perfected security interest held by the International Lender, subject to certain exceptions and restrictions.
The Company or the Subsidiary, as applicable, will be required to make mandatory prepayments under their respective Revolving Credit Facilities to the extent that the aggregate outstanding amount thereunder exceeds the then-applicable borrowing base, which payments will be made without penalty or premium. At December 31, 2014, the domestic borrowing base was $28,975,000 and the international borrowing base was $15,000,000.
Generally, the obligations of the Company under the U.S. Revolver are secured by a first-priority security interest in the above-referenced accounts receivable, cash proceeds and bank accounts of the Company and certain of the Company’s U.S. subsidiaries, and a second-priority security interest in substantially all other assets of the Company and such subsidiaries. The obligations of the Subsidiary under the International Revolver would generally be secured by a first-priority security interest in substantially all accounts receivable, cash proceeds thereof and certain bank accounts of the Subsidiary and certain of the Company’s non-U.S. subsidiaries, and a second-priority security interest in substantially all other assets of the Company and certain of the Company’s U.S. and non-U.S. subsidiaries.
The Revolving Credit Facilities have a term of five years and require payment of interest only during the term. Under the Revolving Credit Facilities, outstanding loans may be repaid in whole or in part at any time, without premium or penalty, subject to certain customary limitations, and will be available to be re-borrowed from time to time.
The Company incurred fees and expenses related to the Revolving Credit Facilities aggregating $2,300,000 which has been deferred and the unamortized balance is included in other assets in the consolidated balance sheet at December 31, 2014. The deferred fees are being amortized to interest expense and related financing fees, net over a five-year period which commenced on October 1, 2014.
At December 31, 2014, the Company had $16,836,000 of outstanding letters of credit and $11,939,000 of available borrowing capacity under the U.S. Revolver.
At December 31, 2014, the Company had $6,722,000 of outstanding letters of credit and $10,086,000 of available borrowing capacity under the International Revolver and its other foreign credit agreements (See “Other Debt Arrangements” below for more information).
2012 Term Loan Agreement
The Company entered into a Term Loan Agreement on October 18, 2012, which was amended from time to time. Borrowings under the 2012 Term Loan Agreement were collateralized by a second lien on substantially all of the Company’s assets, including, without limitation, accounts receivable, equipment, securities, financial assets and the proceeds of the foregoing, as well as by a pledge of 65% of the outstanding capital stock of its wholly-owned foreign subsidiary, Hill International N.V., and of certain of its other foreign subsidiaries. The maturity date of the Term Loan was scheduled for October 18, 2016.
The Company paid interest on amounts outstanding at a rate per annum equal to 7.50%.
Also, contemporaneous with its entry into the 2012 Term Loan Agreement, the Company entered into a Fee Letter. The Fee Letter required the Company to pay to the Lenders an exit fee (the “Exit Fee”), which fee was earned in full on the Closing Date and was due and payable on September 26, 2014, the date the 2012 Term Loan was paid in full (the “Exit Date”). The Exit Fee meant the amount, if any, when paid to the Term Loan Lenders on the Exit Date, that would result in the internal annual rate of return to the Term Loan Lenders on the Exit Date being equal to, but no greater than, 20%; provided that in no event would the Exit Fee amount be less than $0 or greater than $11,790,000. The IRR was to be calculated as the rate of return earned by the Term Loan Lenders on their initial investment in the 2012 Term Loan (calculated as the principal amount of the Term Loan less the Closing Fee of $25,000,000, or $75,000,000) through the Exit Date taking into account the payment by the Company to the Term Loan Lenders of all principal, interest and other payments to the Term Loan Lenders pursuant to the Term Loan Agreement. There was no Exit Fee payable upon the payoff and termination of the Term Loan.
On August 6, 2014, the Company made a mandatory principal prepayment of $9,522,000 from funds received in the equity offering. On September 26, 2014, the Company paid $90,478,000 (including accelerated principal of $9,338,000 which was charged to interest expense and related financing fees, net for the year ended December 31, 2014), plus interest of $1,659,000, to payoff and terminate the Term Loan.
2009 Revolving Credit Agreement
The Company entered into a Credit Agreement, dated June 30, 2009 (the “2009 Revolving Credit Agreement”), with Bank of America, N.A., Capital One, N.A., The PrivateBank and Trust Company, PNC Bank N.A. (the “Lenders”), and Bank of America, N.A., as Administrative Agent which was amended from time to time.
The maturity date of the 2009 Revolving Credit Agreement was scheduled for March 31, 2015. On September 26, 2014, the Company paid $25,500,000 (including $9,522,000 from funds received in the equity offering, plus interest of $420,000, to payoff and terminate the 2009 Revolving Credit Agreement.
Other Debt Arrangements
The Company’s subsidiary, Hill International (Spain) S.A. (“Hill Spain”), maintains a revolving credit facility with six banks (the “Financing Entities”) in Spain which initially provided for total borrowings of up to €5,640,000 with interest at 6.50% on outstanding borrowings. The original available amount was reduced to approximately 75.0% at December 31, 2014 and will be reduced to 50.0% at December 31, 2015. Additionally, the availability is reduced by €15,000 on a quarterly basis. At December 31, 2014, the total facility was approximately €4,170,000 (approximately $5,071,000) and borrowings outstanding were €4,142,000 (approximately $5,037,000). The amount being financed (“Credit Contracts”) by each Financing Entity varies from €284,000 (approximately $346,000) and €1,319,000 (approximately $1,604,000). To
guarantee Hill Spain’s obligations resulting from the Credit Contracts, Hill Spain provided a guarantee in favor of each one of the Financing Entities and, additionally, and solely in the case of unremedied failure to make payment, and at the request of each of the Financing Entities, shall grant a first ranking pledge over a given percentage of corporate shares of Hill International Brasil Participacoes Ltda. for the principal, interest, fees, expenses or any other amount owed by virtue of the Credit Contracts, coinciding with the percentage of credit of each Financing entity with respect to the total outstanding borrowings under this facility. The facility expires on December 17, 2016.
Hill Spain maintains an unsecured credit facility with the Ibercaja Bank in Spain for €700,000 (approximately $851,000) at December 31, 2014. The availability will be reduced by €175,000 on a quarterly basis commencing on March 31, 2015. The interest rate at December 31, 2014 was 6.75%. At December 31, 2014, this facility had total borrowings outstanding of €613,000 (approximately $745,000). The facility expires on December 31, 2015.
The Company maintains a credit facility with the National Bank of Abu Dhabi which provides for total borrowings of up to AED 11,500,000 (approximately $3,131,000 at December 31, 2014) collateralized by certain overseas receivables. The interest rate is the one-month Emirates InterBank Offer Rate plus 3.00% (or 4.48% at December 31, 2014) but no less than 5.50%. At December 31, 2014, there were no borrowings outstanding. This facility also allows for to AED 127,033,000 (approximately $34,589,000 at December 31, 2014) in Letters of Guarantee of which AED 116,506,000 (approximately $31,741,000) were utilized at December 31, 2014. This facility is being renewed on a month-to-month basis. The Company is in the process of negotiating a new credit facility.
Engineering S.A. maintains three unsecured revolving credit facilities with two banks in Brazil aggregating 2,900,000 Brazilian Reais (approximately $1,091,000 at December 31, 2014), with a weighted average interest rate of 3.99% per month at December 31, 2014. There were no borrowings outstanding on any of these facilities which are renewed automatically every three months.
The Company also maintains relationships with other foreign banks for the issuance of letters of credit, letters of guarantee and performance bonds in a variety of foreign currencies. At December 31, 2014, the maximum U.S. dollar equivalent of the commitments was $69,270,000 of which $24,723,000 is outstanding.
Scheduled maturities of long term debt are as follows (in thousands):
|
Years Ending December 31, |
|
|
| |
|
2015 |
|
$ |
6,361 |
|
|
2016 |
|
4,575 |
| |
|
2017 |
|
1,200 |
| |
|
2018 |
|
1,200 |
| |
|
2019 |
|
1,200 |
| |
|
Thereafter |
|
113,700 |
| |
|
Total debt |
|
$ |
128,236 |
|
Note 11 — Supplemental Cash Flow Information
The Company issues shares of its common stock to its non-employee directors as partial compensation for services on the Company’s Board through the next annual stockholders meeting. See Note 12 for further information with respect to this plan.
Other non-cash activity is provided in the following table:
|
|
|
Years Ended December 31, |
| |||||||
|
|
|
2014 |
|
2013 |
|
2012 |
| |||
|
Interest and related financing fees paid |
|
$ |
22,753 |
|
$ |
13,372 |
|
$ |
16,952 |
|
|
Income taxes paid |
|
$ |
11,903 |
|
$ |
8,601 |
|
$ |
4,443 |
|
|
Reduction of noncontrolling interest in connection with acquisitions of an additional interest in Engineering S.A. |
|
(2,649 |
) |
— |
|
— |
| |||
|
Increase in additional paid in capital from issuance of shares of common stock related to purchase of CPI |
|
618 |
|
— |
|
— |
| |||
|
Increase in additional paid in capital from issuance of shares of common stock form cashless exercise of stock options |
|
538 |
|
— |
|
— |
| |||
|
Increase in intangible assets and goodwill in connection with acquisitions of Cadogans in 2014 and BCA and CPI in 2013 |
|
$ |
3,998 |
|
$ |
7,161 |
|
$ |
— |
|
|
Increase in deferred income taxes in connection with the acquisition of noncontrolling interests in Hill Spain |
|
$ |
— |
|
$ |
460 |
|
$ |
1,720 |
|
|
Common stock issued for acquisitions of BCA and CPI |
|
$ |
— |
|
$ |
4,450 |
|
$ |
— |
|
Note 12 — Share-Based Compensation
2009 Non-Employee Director Stock Grant Plan
The 2009 Non-Employee Director Stock Grant Plan covers 400,000 shares of the Company’s common stock. Only the Company’s Non-Employee Directors are eligible to receive grants under the plan. Information with respect to the plan’s activity follows (in thousands):
|
|
|
Years Ended December 31, |
| |||||||
|
|
|
2014 |
|
2013 |
|
2012 |
| |||
|
Shares issued |
|
26 |
|
52 |
|
52 |
| |||
|
Compensation expense |
|
$ |
175 |
|
$ |
150 |
|
$ |
150 |
|
2008 Employee Stock Purchase Plan
The Employee Stock Purchase Plan covers 2,000,000 shares of the Company’s common stock. Eligible employees may purchase shares at 85% of the fair market value on the date of purchase. Information with respect to the plan’s activity follows (in thousands):
|
|
|
Years Ended December 31, |
| |||||||
|
|
|
2014 |
|
2013 |
|
2012 |
| |||
|
Shares purchased |
|
55 |
|
51 |
|
37 |
| |||
|
Aggregate purchase price |
|
$ |
197 |
|
$ |
162 |
|
$ |
105 |
|
|
Compensation expense |
|
$ |
35 |
|
$ |
24 |
|
$ |
19 |
|
2007 Restricted Stock Grant Plan
The 2007 Restricted Stock Grant Plan covered 340,000 shares of the Company’s common stock. Awards aggregating 335,000 shares were approved by the Compensation Committee on February 28, 2007. The shares vested annually over a five-year period commencing on February 28, 2008. Through December 31, 2013, the Company has issued 317,000 shares of its common stock. Under the terms of the plan, no further grants may be made. Information with respect to the plan follows (in thousands):
|
|
|
Years Ended December 31, |
| |||||||
|
|
|
2014 |
|
2013 |
|
2012 |
| |||
|
Shares issued (canceled) |
|
(2 |
) |
— |
|
61 |
| |||
|
Compensation expense |
|
$ |
(8 |
) |
$ |
— |
|
$ |
180 |
|
2006 Employee Stock Option Plan
The 2006 Employee Stock Option Plan, as amended, covers 10,000,000 shares of the Company’s common stock. Under its terms, directors, officers and employees of the Company and its subsidiaries are eligible to receive non-qualified and incentive stock options. Options granted to non-employee directors vest immediately and have a five year contractual term. Options granted to officers and employees vest over five years and have a seven-year contractual term. Generally, each option has an exercise price equal to the closing quoted market price of a share of the Company’s common stock on the date of grant. For grants of incentive stock options, if the grantee owns, or is deemed to own, 10% or more of the total voting power of the Company, then the exercise price shall be 110% of the closing quoted market price on the date of grant and the option will have a five-year contractual term. Options that are forfeited or expire are available for future grants. At December 31, 2014, a total of 2,057,474 shares of common stock were reserved for future issuance under the plan. On January 2, 2015, the Company issued options to purchase 500,000 shares of its common stock to the Company’s President and Chief Executive Officer. The options have an exercise price of $3.91 per share, vest over five years, have a seven-year contractual life and have a fair value of $1,010,000. On January 27, 2015 the Company issued options to purchase 525,000 shares of its common stock to various executives. The options have an exercise price of $4.04 per share, vest over five years, have a seven-year contractual life and have a fair value of $1,087,000.
The Black-Scholes option valuation model is used to estimate the fair value of the options. The following table summarizes the fair value of options granted during 2014, 2013 and 2012 and the assumptions used to estimate the fair value:
|
|
|
December 31, |
| |||||||
|
|
|
2014 |
|
2013 |
|
2012 |
| |||
|
Average expected life (years) |
|
4.59 |
|
4.29 |
|
3.66 |
| |||
|
Forfeiture range |
|
0 - 5.0 |
% |
0 - 5.0 |
% |
— |
% | |||
|
Weighted average forfeiture rate |
|
0.9 |
% |
0.9 |
% |
— |
% | |||
|
Dividends |
|
0 |
% |
0 |
% |
0 |
% | |||
|
Volatility range |
|
61.5 - 65.5 |
% |
67.8 - 73.5 |
% |
70.8 - 78.4 |
% | |||
|
Weighted average volatility |
|
62.9 |
% |
71.7 |
% |
77.5 |
% | |||
|
Range of risk-free interest rates |
|
0.86 - 1.74 |
% |
0.50 - 1.36 |
% |
0.36 - 0.86 |
% | |||
|
Weighted average risk-free interest rate |
|
1.67 |
% |
0.77 |
% |
0.8 |
% | |||
|
Weighted average fair value at grant date |
|
$ |
2.28 |
|
$ |
1.95 |
|
$ |
2.52 |
|
The expected term of the options is estimated based on the “simplified method” as permitted by SAB No. 110. Expected volatility was calculated using the average historical volatility of similar public companies through June 30, 2011 and of the Company thereafter. The risk-free interest rate is based on U.S. Treasury yields for securities in effect at the time of grants with terms approximating the term of the grants. The assumptions used in the Black-Scholes option valuation model are highly subjective, particularly as to stock price volatility of the underlying stock, which can materially affect the resulting valuation.
A summary of the Company’s stock option activity and related information for the years ended December 31, 2014, 2013 and 2012 is as follows:
|
|
|
|
|
|
|
Weighted |
|
|
| ||
|
|
|
|
|
Weighted |
|
Average |
|
|
| ||
|
|
|
|
|
Average |
|
Remaining |
|
Aggregate |
| ||
|
(in thousands, except exercise price |
|
|
|
Exercise |
|
Contractual |
|
Intrinsic |
| ||
|
and remaining life data) |
|
Options |
|
Price |
|
Life |
|
Value |
| ||
|
Outstanding, December 31, 2011 |
|
3,821 |
|
5.29 |
|
|
|
|
| ||
|
Granted |
|
994 |
|
5.17 |
|
|
|
|
| ||
|
Exercised |
|
(10 |
) |
2.45 |
|
|
|
|
| ||
|
Expired |
|
(117 |
) |
7.48 |
|
|
|
|
| ||
|
Forfeited |
|
(44 |
) |
4.94 |
|
|
|
|
| ||
|
Outstanding, December 31, 2012 |
|
4,644 |
|
5.22 |
|
|
|
|
| ||
|
Granted |
|
2,076 |
|
3.80 |
|
|
|
|
| ||
|
Exercised |
|
(8 |
) |
2.45 |
|
|
|
|
| ||
|
Expired |
|
(101 |
) |
12.42 |
|
|
|
|
| ||
|
Forfeited |
|
(37 |
) |
4.02 |
|
|
|
|
| ||
|
Outstanding, December 31, 2013 |
|
6,574 |
|
$ |
4.67 |
|
|
|
|
| |
|
Granted |
|
1,849 |
|
4.57 |
|
|
|
|
| ||
|
Exercised |
|
(524 |
) |
3.00 |
|
|
|
|
| ||
|
Expired |
|
(496 |
) |
7.66 |
|
|
|
|
| ||
|
Forfeited |
|
(44 |
) |
4.37 |
|
|
|
|
| ||
|
Outstanding, December 31, 2014 |
|
7,359 |
|
4.57 |
|
3.19 |
|
$ |
— |
| |
|
Exercisable, December 31, 2014 |
|
3,302 |
|
$ |
5.23 |
|
1.72 |
|
$ |
— |
|
Aggregate intrinsic value represents the difference between the exercise prices and the closing stock price on December 31, 2014. At December 31, 2014, the weighted average exercise price of the outstanding options was $4.57 and the closing stock price was $3.84.
For various price ranges, weighted average characteristics of outstanding stock options at December 31, 2014 are as follows:
|
|
|
Options Outstanding |
|
Options Exercisable |
| |||||||||
|
|
|
|
|
Weighted |
|
|
|
|
|
|
| |||
|
|
|
Number |
|
Average |
|
Weighted |
|
Number |
|
Weighted |
| |||
|
|
|
Outstanding at |
|
Remaining |
|
Average |
|
Exercisable at |
|
Average |
| |||
|
Exercise |
|
December 31, |
|
Contractual |
|
Exercise |
|
December 31, |
|
Exercise |
| |||
|
Prices |
|
2014 |
|
Life |
|
Price |
|
2014 |
|
Price |
| |||
|
$ |
2.45 |
|
559,489 |
|
1.17 |
|
$ |
2.45 |
|
559,489 |
|
$ |
2.45 |
|
|
2.85 |
|
90,908 |
|
2.45 |
|
2.85 |
|
90,908 |
|
2.85 |
| |||
|
2.89 |
|
116,280 |
|
3.43 |
|
2.89 |
|
116,280 |
|
2.89 |
| |||
|
3.12 |
|
10,000 |
|
5.60 |
|
3.12 |
|
2,000 |
|
3.12 |
| |||
|
3.67 |
|
888,000 |
|
5.06 |
|
3.67 |
|
172,000 |
|
3.67 |
| |||
|
3.89 |
|
3,000 |
|
4.39 |
|
3.89 |
|
3,000 |
|
3.89 |
| |||
|
3.95 |
|
500,000 |
|
6.01 |
|
3.95 |
|
— |
|
— |
| |||
|
4.04 |
|
1,000,000 |
|
3.06 |
|
4.04 |
|
250,000 |
|
4.04 |
| |||
|
4.19 |
|
25,000 |
|
1.13 |
|
4.19 |
|
25,000 |
|
4.19 |
| |||
|
4.25 |
|
84,868 |
|
0.42 |
|
4.25 |
|
84,868 |
|
4.25 |
| |||
|
4.35 |
|
500,000 |
|
4.01 |
|
4.35 |
|
— |
|
— |
| |||
|
4.37 |
|
10,000 |
|
1.34 |
|
4.37 |
|
10,000 |
|
4.37 |
| |||
|
4.92 |
|
5,000 |
|
1.59 |
|
4.92 |
|
5,000 |
|
4.92 |
| |||
|
4.95 |
|
775,000 |
|
6.19 |
|
4.95 |
|
— |
|
— |
| |||
|
5.31 |
|
20,000 |
|
2.07 |
|
5.31 |
|
16,000 |
|
5.31 |
| |||
|
5.47 |
|
880,200 |
|
2.18 |
|
5.47 |
|
440,100 |
|
5.47 |
| |||
|
5.73 |
|
8,000 |
|
3.84 |
|
5.73 |
|
4,000 |
|
5.73 |
| |||
|
5.83 |
|
265,000 |
|
2.25 |
|
5.83 |
|
212,000 |
|
5.83 |
| |||
|
6.31 |
|
261,725 |
|
2.95 |
|
6.31 |
|
181,725 |
|
6.31 |
| |||
|
6.32 |
|
10,000 |
|
0.84 |
|
6.32 |
|
10,000 |
|
6.32 |
| |||
|
6.41 |
|
320,000 |
|
0.24 |
|
6.41 |
|
320,000 |
|
6.41 |
| |||
|
6.50 |
|
3,000 |
|
0.12 |
|
6.50 |
|
3,000 |
|
6.50 |
| |||
|
6.61 |
|
63,870 |
|
4.45 |
|
6.61 |
|
63,870 |
|
6.61 |
| |||
|
7.32 |
|
907,336 |
|
1.07 |
|
7.32 |
|
680,502 |
|
7.32 |
| |||
|
11.10 |
|
20,000 |
|
0.08 |
|
11.10 |
|
20,000 |
|
11.10 |
| |||
|
12.82 |
|
22,500 |
|
0.12 |
|
12.82 |
|
22,500 |
|
12.82 |
| |||
|
16.79 |
|
10,000 |
|
0.59 |
|
16.79 |
|
10,000 |
|
16.79 |
| |||
|
|
|
7,359,176 |
|
3.19 |
|
$ |
4.57 |
|
3,302,242 |
|
$ |
5.23 |
| |
In the years ended December 31, 2014, 2013 and 2012, the Company recorded share-based compensation related to stock options of approximately $3,292,000, $2,787,000 and $2,107,000, respectively, which is included in selling, general and administrative expenses.
The following table summarizes the Company’s non-vested stock option activity and related information for the years ended December 31, 2014, 2013 and 2012:
|
|
|
|
|
Average |
| |
|
|
|
|
|
Grant Date |
| |
|
(in thousands, except weighted average |
|
|
|
Fair Value |
| |
|
grant date fair value) |
|
Options |
|
Per Share |
| |
|
Non-vested options at December 31, 2011 |
|
2,414 |
|
2.23 |
| |
|
Granted |
|
994 |
|
2.52 |
| |
|
Vested |
|
(881 |
) |
2.12 |
| |
|
Forfeited |
|
(44 |
) |
2.15 |
| |
|
Non-vested options at December 31, 2012 |
|
2,483 |
|
2.39 |
| |
|
Granted |
|
2,076 |
|
1.95 |
| |
|
Vested |
|
(981 |
) |
2.14 |
| |
|
Forfeited |
|
(37 |
) |
2.17 |
| |
|
Non-vested options at December 31, 2013 |
|
3,541 |
|
2.20 |
| |
|
Granted |
|
1,849 |
|
2.28 |
| |
|
Vested |
|
(1,289 |
) |
2.19 |
| |
|
Forfeited |
|
(44 |
) |
2.33 |
| |
|
Non-vested options at December 31, 2014 |
|
4,057 |
|
$ |
2.24 |
|
At December 31, 2014, total unrecognized compensation cost related to non-vested options was $6,153,000 and will be recognized over the remaining weighted-average service period of 1.96 years.
Note 13 — Stockholders’ Equity
Stock Repurchase Program
Under its stock repurchase program, the Company is authorized to purchase shares of its common stock up to a total purchase price of $60,000,000. To date, the Company has purchased 5,834,369 shares of its common stock for an aggregate purchase price of $24,438,000, or an average of approximately $4.19 per share. Under the terms of its Secured Credit Facilities (see Note 10), the Company may make additional purchases up to an aggregate of $3,000,000 as long as immediately before and after giving effect to the purchase, no event of default shall have occurred and be continuing at the time.
Other
On June 11, 2012, the Company’s stockholders approved an increase in the Company’s authorized common shares from 75,000,000 shares to 100,000,000 shares.
On March 7, 2014, the Company issued 171,308 shares of its common stock aggregating $618,000 to the former shareholders of Collaborative Partners, Inc. as payment for equity in excess of that required under the acquisition agreement.
In March 2014, the Company’s Chairman and Chief Executive Officer exercised 200,000 options with an exercise price of $2.70 through the Company on a cashless basis. The Company withheld 112,788 shares as payment for the options and placed those shares in treasury stock. The Chairman and Chief Executive Officer received 87,212 shares from this transaction.
On August 6, 2014, in connection with the Refinancing (See Note 9), the Company sold 9,546,629 shares of its common stock in an underwritten equity offering and received net proceeds aggregating approximately $38,078,000, of which two
mandatory prepayments of $9,522,402 were used to pay down the 2012 Term Loan Agreement and the 2009 Revolving Credit Agreement.
We have an effective registration statement on Form S-3 on file with the U.S. Securities and Exchange Commission (the “SEC”) which registered 20,000,000 shares of our common stock for issuance and sale by us at various times in the future. The proceeds, if any, will be used for working capital and general corporate purposes, subject to the restrictions of our Secured Credit Facilities.
In addition, we have an effective registration statement on Form S-4 on file with the SEC which registered 20,000,000 shares of our common stock, which includes 6,438,923 shares of our common stock registered under a previous Form S-4, for use in future acquisitions. During 2013, we issued 1,389,769 shares in connection with our acquisitions of BCA and CPI. During 2014, we issued 171,308 shares in connection with certain additional consideration for CPI. We expect to issue shares of our common stock in connection with certain contingent consideration for those two companies.
Note 14 — Income Taxes
The effective tax rates for the years ended December 31, 2014, 2013 and 2012 were 240.4%, 53.7% and (21.9%), respectively. The difference in the Company’s 2014 effective tax rate compared to the 2013 rate is primarily related to a significant increase in the U.S. pretax loss in 2014 primarily due to the recognition of an additional $10,820,000 of interest expense related to the refinancing and early termination of the Company’s former senior credit facility and term loan during the third quarter of 2014. For all the years presented, the Company’s effective tax rate is significantly higher than it otherwise would be primarily as a result of not being able to record an income tax benefit related to the U.S. net operating loss and various foreign withholding taxes. This was partially offset in 2013 and 2014 by approximately $2,500,000 of reversal for uncertain tax positions based on management’s assessment that those items were effectively settled with a foreign jurisdiction.
The difference in the Company’s 2013 effective tax rate over 2012 was primarily the result of not recording an income tax benefit related to the 2013 U.S. net operating loss which management believes the Company will not be able to utilize. In addition, the Company recognized higher income tax expense related to withholding taxes on certain foreign operations. These items were partially offset by the $2,473,000 reversal for uncertain tax positions based on management’s assessment that those items were effectively settled with a foreign jurisdiction.
The components of earnings (loss) before income taxes by United States and foreign jurisdictions were as follows (in thousands):
|
|
|
Years Ended December 31, |
| |||||||
|
|
|
2014 |
|
2013 |
|
2012 |
| |||
|
|
|
(Restated) |
|
(Restated) |
|
(Restated) |
| |||
|
United States |
|
$ |
(39,729 |
) |
$ |
(26,460 |
) |
$ |
(19,172 |
) |
|
Foreign jurisdictions |
|
43,182 |
|
38,294 |
|
(42,280 |
) | |||
|
|
|
$ |
3,453 |
|
$ |
11,834 |
|
$ |
(61,452 |
) |
Income tax expense (benefit) consists of the following:
The increase in expense in 2014 compared to 2013 results from increased pretax profits from foreign operations, the mix of tax rates in those jurisdictions and no offsetting tax benefits arising from the Company’s U.S. net operating losses which management believes the Company will not be able to utilize. The decrease in expense in 2013 compared to 2012 is due to the establishment of a $17,707,000 valuation allowance against the Company’s net U.S. deferred tax assets.
The differences between income taxes based on the statutory U.S. federal income tax rate and the Company’s effective income tax rate are provided in the following reconciliation (in thousands).
|
|
|
Years Ended December 31, |
| |||||||
|
|
|
2014 |
|
2013 |
|
2012 |
| |||
|
|
|
(Restated) |
|
(Restated) |
|
(Restated) |
| |||
|
Statutory federal income tax |
|
$ |
1,174 |
|
$ |
4,024 |
|
$ |
(20,894 |
) |
|
Foreign tax benefit for earnings taxed at lower rates |
|
(4,801 |
) |
(3,957 |
) |
6,655 |
| |||
|
Change in the valuation allowance |
|
16,230 |
|
10,378 |
|
29,947 |
| |||
|
Net liability (reductions) additions for uncertain tax positions |
|
(2,379 |
) |
(2,314 |
) |
(350 |
) | |||
|
Excess compensation |
|
646 |
|
204 |
|
170 |
| |||
|
State and local income taxes, net of federal income tax benefit |
|
(2,076 |
) |
(1,476 |
) |
(1,065 |
) | |||
|
Stock options |
|
224 |
|
230 |
|
(356 |
) | |||
|
Deferred tax adjustment |
|
— |
|
— |
|
(497 |
) | |||
|
Purchase accounting reversal |
|
(490 |
) |
— |
|
— |
| |||
|
Reversal of interest allocations to foreign entities |
|
— |
|
(1,014 |
) |
— |
| |||
|
Other |
|
(228 |
) |
275 |
|
(168 |
) | |||
|
Total |
|
$ |
8,300 |
|
$ |
6,350 |
|
$ |
13,442 |
|
The tax effect of temporary differences that give rise to deferred tax assets and deferred tax liabilities are as follows (in thousands):
|
|
|
December 31, |
| |||||||
|
|
|
2014 |
|
2013 |
|
2012 |
| |||
|
|
|
(Restated) |
|
(Restated) |
|
(Restated) |
| |||
|
Deferred tax assets: |
|
|
|
|
|
|
| |||
|
Net operating loss carry forward - U.S. operations |
|
$ |
40,065 |
|
$ |
25,185 |
|
$ |
15,340 |
|
|
Amortization of intangibles |
|
7,329 |
|
6,657 |
|
7,626 |
| |||
|
Net operating loss carry forward - foreign operations |
|
8,634 |
|
6,470 |
|
5,628 |
| |||
|
Compensated absences |
|
2,458 |
|
2,574 |
|
2,358 |
| |||
|
Foreign income taxes on currency translation |
|
1,013 |
|
— |
|
— |
| |||
|
Share based compensation |
|
3,026 |
|
2,087 |
|
1,984 |
| |||
|
Allowance for uncollectible accounts |
|
13,106 |
|
14,626 |
|
15,745 |
| |||
|
Bonus accrual |
|
1,087 |
|
1,373 |
|
998 |
| |||
|
Deferred income |
|
485 |
|
19 |
|
714 |
| |||
|
Foreign tax credit |
|
982 |
|
956 |
|
668 |
| |||
|
Other |
|
836 |
|
672 |
|
2,396 |
| |||
|
Total gross deferred tax assets |
|
79,021 |
|
60,619 |
|
53,457 |
| |||
|
Valuation allowances |
|
(58,801 |
) |
(42,767 |
) |
(34,111 |
) | |||
|
Net deferred tax assets |
|
20,220 |
|
17,852 |
|
19,346 |
| |||
|
|
|
|
|
|
|
|
| |||
|
Deferred tax liabilities: |
|
|
|
|
|
|
| |||
|
Intangible assets |
|
(13,205 |
) |
(14,013 |
) |
(15,468 |
) | |||
|
Depreciation |
|
(1,297 |
) |
(1,512 |
) |
(1,471 |
) | |||
|
Prepaid expenses |
|
(1,159 |
) |
(632 |
) |
(689 |
) | |||
|
Change in tax method |
|
(279 |
) |
(369 |
) |
(101 |
) | |||
|
Accrued expenses |
|
(2,177 |
) |
(2,580 |
) |
(2,733 |
) | |||
|
Foreign income taxes on currency translations |
|
— |
|
(567 |
) |
(47 |
) | |||
|
Total gross deferred tax liabilities |
|
(18,117 |
) |
(19,673 |
) |
(20,509 |
) | |||
|
Net deferred tax assets (liabilities) |
|
$ |
2,103 |
|
$ |
(1,821 |
) |
$ |
(1,163 |
) |
|
|
|
|
|
|
|
|
| |||
|
Amounts included in the consolidated balance sheets: |
|
|
|
|
|
|
| |||
|
Current deferred tax assets |
|
$ |
6,575 |
|
$ |
7,340 |
|
$ |
8,256 |
|
|
Non-current deferred tax assets |
|
13,645 |
|
10,511 |
|
11,090 |
| |||
|
Current deferred tax liabilities |
|
(2,456 |
) |
(2,948 |
) |
(2,834 |
) | |||
|
Non-current deferred tax liabilities |
|
(15,661 |
) |
(16,724 |
) |
(17,675 |
) | |||
|
|
|
$ |
2,103 |
|
$ |
(1,821 |
) |
$ |
(1,163 |
) |
In assessing the realizability of deferred tax assets, management considers whether it is more likely than not that some portion or all of the deferred tax assets will not be realized. The ultimate realization of deferred tax assets is dependent upon the generation of future taxable income during the periods in which those temporary differences become deductible. Management considers the scheduled reversal of deferred tax liabilities and projected future taxable income in making this assessment. Management evaluates the need for valuation allowances on the deferred tax assets according to the provisions of ASC 740, Income Taxes. They consider both positive and negative evidence. In making this determination,
management assesses all of the evidence available at the time including recent earnings, internally-prepared income projections, and historical financial performance.
At December 31, 2012, due to recurring net operating losses in the United States, management determined that it was more likely than not that the Company would not be able to utilize its U.S.-related deferred tax assets. The Company continues to generate U.S. net operating losses and has recorded additional valuation allowances of $15,319,000 and $9,062,000 at December 31, 2014 and 2013, respectively. U.S. valuation allowances of $42,087,000 and $26,768,000 were recorded at December 31, 2014 and 2013, respectively, primarily related to the U.S. net operating loss carryforwards. As a result, the U.S. deferred tax assets, net of U.S.-based deferred tax liabilities, are fully reserved at December 31, 2014. Cumulative U.S. federal and state net operating losses at December 31, 2014 are $101,071,000 and $104,076,000, respectively.
At December 31, 2014 and 2013, there were approximately $33,933,000 and $24,013,000, respectively, of gross foreign net operating loss carry forwards. The majority of these net operating loss carry forwards have an unlimited carry forward period. It is anticipated that these losses will not be utilized due to continuing losses in these jurisdictions. Foreign valuation allowances of $16,713,000 and $16,000,000 were recorded at December 31, 2014 and 2013, respectively, primarily related to the foreign allowance for doubtful accounts in connection with the Libya Receivable reserve in 2012 and the foreign net operating loss carryforwards.
The Company has made no provision for U.S. taxes on $106,637,000 of cumulative earnings of foreign subsidiaries as those earnings are intended to be reinvested for an indefinite period of time and are not intended to be distributed to the U.S. Upon distribution of these earnings in the form of dividends or otherwise, the Company may be subject to U.S. income taxes and foreign withholding taxes. It is not practical, however, to estimate the amount of taxes that may be payable on the eventual repatriation of these earnings.
In 2013, deferred tax assets and additional paid in capital were reduced by $583,000 to record the differential between book expense and tax expense related to the vesting of restricted stock.
The Company will recognize a tax benefit in the financial statements for an uncertain tax position only if management’s assessment is that the position is “more likely than not” (i.e., a likelihood greater than 50 percent) to be allowed by the tax jurisdiction based solely on the technical merits of the position. The term “tax position” refers to a position in a previously filed tax return or a position expected to be taken in a future tax return that is reflected in measuring current or deferred income tax assets and liabilities for financial reporting purposes.
The following table indicates the changes to the Company’s uncertain tax positions for the years ended December 31, 2014 and 2013 including interest and penalties:
|
|
|
Years Ended December 31, |
| |||||||
|
|
|
2014 |
|
2013 |
|
2012 |
| |||
|
|
|
|
|
(in thousands) |
|
|
| |||
|
Balance, beginning of year |
|
$ |
2,933 |
|
$ |
5,033 |
|
$ |
5,383 |
|
|
Reductions due to laps of statute of limitations |
|
— |
|
— |
|
(378 |
) | |||
|
Reductions based on tax positions related to prior years |
|
(2,683 |
) |
(2,473 |
) |
— |
| |||
|
Additions based on tax positions related to prior years |
|
725 |
|
373 |
|
28 |
| |||
|
Balance, end of year |
|
$ |
975 |
|
$ |
2,933 |
|
$ |
5,033 |
|
The Company files income tax returns in the U.S. federal jurisdiction and in various state and foreign jurisdictions. The Company generally is no longer subject to U.S. or state examinations by tax authorities for taxable years prior to 2011. However, net operating losses utilized for prior years in subsequent year’s tax returns are subject to examination until three years after the filing of subsequent year’s tax return. The statute of limitations expiration in foreign jurisdictions for corporate tax returns generally ranges between two and five years depending on the jurisdiction.
The Company’s policy is to record income tax related interest and penalties in income tax expense. At December 31, 2014, 2013 and 2012, the Company has accrued $520,000, $172,000 and $100,000, respectively, related to potential interest and penalties.
The Company’s income tax returns are based on calculations and assumptions that are subject to examinations by the Internal Revenue Service and other tax authorities. While the Company believes it has appropriate support for the positions taken on its tax returns, the Company regularly assesses the potential outcomes of these examinations and any future examinations for the current or prior years in determining the adequacy of its provision for income taxes. As part of its assessment of potential adjustments to its tax returns, the Company increases its current tax liability to the extent an adjustment would result in a cash tax payment or decreases its deferred tax assets to the extent an adjustment would not result in a cash tax payment. The Company continually assesses the likelihood and amount of potential adjustments and adjusts the income tax provision, the current tax liability and deferred taxes in the period in which the facts that give rise to a revision become known.
Note 15 — Commitments and Contingencies
General Litigation
M.A. Angeliades, Inc. (“Plaintiff”) has filed a complaint with the Supreme Court of New York against the Company and the New York City Department of Design and Construction (“DDC”) regarding payment of approximately $8,771,000 for work performed as a subcontractor to the Company plus interest and other costs. The Company has accrued approximately $2,340,000, including interest of $448,000, based on invoices received from Plaintiff who has refused to provide invoices for the additional work that Plaintiff claims to have performed. Until such time as the Company obtains invoices for the additional work and is able to provide those invoices to DDC for reimbursement or there is a full resolution of the litigation, it has no intention of paying Plaintiff. The Company believes that its position is defensible, however, there can be no assurance that it will receive a favorable verdict should this case proceed to trial.
From time to time, the Company is a defendant or plaintiff in various legal actions which arise in the normal course of business. As such the Company is required to assess the likelihood of any adverse outcomes to these matters as well as potential ranges of probable losses. A determination of the amount of the provision required for these commitments and contingencies, if any, which would be charged to earnings, is made after careful analysis of each matter. The provision may change in the future due to new developments or changes in circumstances. Changes in the provision could increase or decrease the Company’s earnings in the period the changes are made. It is the opinion of management, after consultation with legal counsel, that the ultimate resolution of these matters will not have a material adverse effect on the Company’s financial condition, results of operations or cash flows.
Off-Balance Sheet Arrangements
The Company enters into agreements with banks for the banks to issue bonds to clients or potential clients for three separate purposes as follows:
(1) Certain of the Company’s subsidiaries (Hill International N.V., Hill International (UK) Ltd. and Hill International (Middle East) Ltd.) have entered into contracts for the performance of construction management services which provide that the Company receive advance payment of some of the management fee from the client prior to commencement of the construction project. However, the clients require a guarantee of service performance in the form of an advance payment bond. These bonds are evidenced by Letters of Guarantee issued by the subsidiaries’ banks in favor of the clients. In some cases these clients also require a parent company guarantee.
(2) The Company may also enter into certain contracts which require a performance bond to be issued by a bank in favor of the client for a portion of the value of the contract. These bonds may be exercised by the client in instances where the Company fails to provide the contracted services.
(3) Certain clients may require bonds as part of the bidding process for new work. The bid bonds are provided to demonstrate the financial strength of the companies seeking the work and are usually outstanding for short
periods. If the bid is rejected the bond is cancelled and if the bid is accepted the Company may be required to provide a performance bond.
The maximum potential future payment under these arrangements at December 31, 2014 was $80,022,000.
Cash held in restricted accounts as collateral for the issuance of performance and advance payment bonds and letters of credit at December 31, 2014 and 2013 were $16,007,000 and $18,506,000, respectively.
Acquisition-related
On February 28, 2011, the Company’s wholly-owned subsidiary Hill Spain acquired an indirect 60% interest in Engineering S.A. (“ESA”), a firm located in Brazil, for cash amounting to 22,200,000 Brazilian Reais (“BR”) (approximately $11,757,000). Minimum additional payments were made on April 30, 2012 in the amount of BR 6,624,000 (approximately $3,508,000 on that date) and on July 23, 2013 in the amount of BR 11,372,000 (approximately $5,095,000). Under certain circumstances, the Company may be required to pay BR 5,000,000 (approximately $2,468,000 at December 31, 2012) in addition to the minimum payments. Also, ESA’s shareholders entered into an agreement whereby the minority shareholders have a right to compel (“ESA Put Option”) Hill Spain to purchase any or all of their shares during the period from February 28, 2014 to February 28, 2021. Hill Spain also has the right to compel (“ESA Call Option”) the minority shareholders to sell any or all of their shares during the same time period. The purchase price for such shares shall be seven times the earnings before interest and taxes for ESA’s most recently ended fiscal year, net of any financial debt plus excess cash multiplied by a percentage which the shares to be purchased bear to the total number of shares outstanding at the time of purchase, but in the event the ESA Call Option is exercised by Hill Spain, the purchase price shall be increased by five percent. The ESA Put Option and the ESA Call Option must be made within three months after the audited financial statements of ESA have been completed. See Note 3.
The Company is committed to issue shares of its common stock to the former shareholders of CPI for certain contingent consideration. The number of shares will be determined at various times during 2014. See Note 4.
The Company is committed to pay additional consideration for the purchase of Cadogans in the amount of £519,000 to be paid in cash on October 31, 2015 and an earn out based upon the average earnings before interest, taxes, depreciation and amortization for the two-year period ending on October 31, 2016 (which amount shall not be less than £0 nor more than £200,000). See Note 4.
Other
On December 31, 2012, the Company identified a potential employment tax liability related to certain foreign subsidiaries’ treatment of certain individuals as independent contractors rather than as employees. On June 24, 2013, the Company received an indemnification from the selling shareholders for periods prior to 2013. Accordingly, the Company has reversed the accrual established in 2012 and has reflected approximately $3,600,000 as a credit to selling, general and administrative expenses in the consolidated statement of operations for the year ended December 31, 2013. In consideration for the indemnification, the Company reversed the 2013 first quarter write-down of the liabilities for the second installment obligation of approximately 1,950,000 BRL (approximately $873,000). In addition, the Company believes, based upon certain professional advice that it is remote that a future liability will be established for the potential employment taxes relating to certain foreign independent contractors and, therefore, has made no accrual for such potential liability.
Note 16 — Operating Leases
The Company has numerous operating leases which have various expiration dates through April 30, 2027. Rent expense was approximately $13,902,000, $12,408,000 and $12,538,000 for the years ended December 31, 2014, 2013 and 2012, respectively, which is included in selling, general and administrative expenses in the consolidated statements of earnings. The Company is required to pay property taxes, utilities and other costs related to several of its leased office facilities.
At December 31, 2014, approximate future minimum payments under these leases that have remaining non-cancelable lease terms in excess of one year are as follows (in thousands):
|
Years Ending December 31, |
|
|
| |
|
2015 |
|
12,422 |
| |
|
2016 |
|
9,143 |
| |
|
2017 |
|
7,665 |
| |
|
2018 |
|
6,097 |
| |
|
2019 |
|
4,897 |
| |
|
Thereafter |
|
15,270 |
| |
|
Total |
|
$ |
55,494 |
|
Note 17 - Benefit Plans
The Company maintains a 401(k) Retirement Savings Plan (the “401(k) Plan”) for qualified employees. The terms of the 401(k) Plan define qualified employees as those over 21 years of age. Through April 30, 2012, the Company matched 50% of the employee contributions up to 6% of employee compensation. Effective May 1, 2012, the Company suspended its matching contribution. Effective January 1, 2013, the Company matches 50% of employee contributions up to 2% of employee compensation up to a maximum $2,550. For the years ended December 31, 2014, 2013 and 2012, the Company recognized expense amounting to $801,000, $734,000 and $666,000, respectively, which is included in selling, general and administrative expenses in the consolidated statements of earnings.
Note 18 — Business Segment Information
The Company’s business segments reflect how executive management makes resource decisions and assesses its performance. The Company bases these decisions on the type of services provided (Project Management and Construction Claims) and secondarily by their geography (U.S./Canada, Latin America, Europe, the Middle East, Africa and Asia/Pacific).
The Project Management business segment provides extensive construction and project management services to construction owners worldwide. Such services include program management, project management, construction management, project management oversight, troubled project turnaround, staff augmentation, project labor agreement consulting, commissioning, estimating and cost management, and labor compliance services.
The Construction Claims business segment provides such services as claims consulting, management consulting, litigation support, expert witness testimony, cost/damages assessment, delay/disruption analysis, adjudication, lender advisory, risk management, forensic accounting, fraud investigation and Project Neutral services to clients worldwide.
The Company evaluates the performance of its segments primarily on operating profit before corporate overhead allocations and income taxes.
The following tables reflect the required disclosures for the Company’s reportable segments (in thousands):
Consulting Fee Revenue (“CFR”)
|
|
|
2014 |
|
2013 |
|
2012 |
| |||||||||
|
|
|
(Restated) |
|
|
|
|
|
|
|
|
| |||||
|
Project Management |
|
$ |
428,827 |
|
74.3 |
% |
$ |
392,602 |
|
76.7 |
% |
$ |
312,232 |
|
74.8 |
% |
|
Construction Claims |
|
148,290 |
|
25.7 |
|
119,483 |
|
23.3 |
|
105,366 |
|
25.2 |
| |||
|
Total |
|
$ |
577,117 |
|
100.0 |
% |
$ |
512,085 |
|
100.0 |
% |
$ |
417,598 |
|
100.0 |
% |
Total Revenue
|
|
|
2014 |
|
2013 |
|
2012 |
| |||||||||
|
|
|
(Restated) |
|
|
|
|
|
|
|
|
| |||||
|
Project Management |
|
$ |
487,754 |
|
76.0 |
% |
$ |
452,517 |
|
78.5 |
% |
$ |
372,281 |
|
77.4 |
% |
|
Construction Claims |
|
153,839 |
|
24.0 |
|
124,164 |
|
21.5 |
|
108,500 |
|
22.6 |
| |||
|
Total |
|
$ |
641,593 |
|
100.0 |
% |
$ |
576,681 |
|
100.0 |
% |
$ |
480,781 |
|
100.0 |
% |
Operating Profit (Loss)
|
|
|
2014 |
|
2013 |
|
2012 |
| |||
|
|
|
(Restated) |
|
(Restated) |
|
(Restated) |
| |||
|
Project Management |
|
$ |
53,174 |
|
$ |
50,922 |
|
$ |
(25,276 |
) |
|
Construction Claims |
|
10,996 |
|
12,171 |
|
8,071 |
| |||
|
Corporate |
|
(30,232 |
) |
(28,395 |
) |
(26,097 |
) | |||
|
Total |
|
$ |
33,938 |
|
$ |
34,698 |
|
$ |
(43,302 |
) |
Depreciation and Amortization Expense
|
|
|
2014 |
|
2013 |
|
2012 |
| |||
|
Project Management |
|
$ |
6,888 |
|
$ |
7,677 |
|
$ |
9,172 |
|
|
Construction Claims |
|
2,719 |
|
2,852 |
|
2,998 |
| |||
|
Subtotal segments |
|
9,607 |
|
10,529 |
|
12,170 |
| |||
|
Corporate |
|
216 |
|
227 |
|
260 |
| |||
|
Total |
|
$ |
9,823 |
|
$ |
10,756 |
|
$ |
12,430 |
|
Consulting Fee Revenue by Geographic Region
|
|
|
2014 |
|
2013 |
|
2012 |
| |||||||||
|
|
|
(Restated) |
|
|
|
|
|
|
|
|
| |||||
|
U.S./Canada |
|
$ |
125,691 |
|
21.8 |
% |
$ |
121,291 |
|
23.7 |
% |
$ |
117,593 |
|
28.2 |
% |
|
Latin America |
|
40,844 |
|
7.1 |
|
49,188 |
|
9.6 |
|
51,820 |
|
12.4 |
| |||
|
Europe |
|
79,009 |
|
13.7 |
|
75,398 |
|
14.7 |
|
84,267 |
|
20.2 |
| |||
|
Middle East |
|
272,236 |
|
47.2 |
|
219,315 |
|
42.8 |
|
134,037 |
|
32.1 |
| |||
|
Africa |
|
23,849 |
|
4.1 |
|
22,744 |
|
4.4 |
|
13,591 |
|
3.3 |
| |||
|
Asia/Pacific |
|
35,488 |
|
6.1 |
|
24,149 |
|
4.8 |
|
16,290 |
|
3.8 |
| |||
|
Total |
|
$ |
577,117 |
|
100.0 |
% |
$ |
512,085 |
|
100.0 |
% |
$ |
417,598 |
|
100.0 |
% |
|
|
|
|
|
|
|
|
|
|
|
|
|
|
| |||
|
U.S. |
|
$ |
122,096 |
|
21.2 |
% |
$ |
117,740 |
|
23.0 |
% |
$ |
114,368 |
|
27.4 |
% |
|
Non-U.S. |
|
455,021 |
|
78.8 |
|
394,345 |
|
77.0 |
|
303,230 |
|
72.6 |
| |||
|
Total |
|
$ |
577,117 |
|
100.0 |
% |
$ |
512,085 |
|
100.0 |
% |
$ |
417,598 |
|
100.0 |
% |
For the year ended December 31, 2014, consulting fee revenue for the United Arab Emirates amounted to $73,329,000 representing 12.7% of the total and Oman’s consulting fee revenue amounted to $66,896,000 representing 11.6% of the total. No other country except for the United States accounted for over 10% of consolidated consulting fee revenue.
For the year ended December 31, 2013, consulting fee revenue for the United Arab Emirates amounted to $66,918,000 representing 13.1% of the total and Oman’s consulting fee revenue amounted to $51,053,000 representing 10.0% of the total. No other country except for the United States accounted for over 10% of consolidated consulting fee revenue.
For the year ended December 31, 2012, consulting fee revenue for the United Arab Emirates amounted to $61,729,000 representing 14.8% of the total and Brazil’s consulting fee revenue amounted to $45,663,000 representing 10.9% of the total. No other country except for the United States accounted for over 10% of consolidated consulting fee revenue.
Total Revenue by Geographic Region
|
|
|
2014 |
|
2013 |
|
2012 |
| |||||||||
|
|
|
(Restated) |
|
|
|
|
|
|
|
|
| |||||
|
U.S./Canada |
|
$ |
170,550 |
|
26.6 |
% |
$ |
171,012 |
|
29.7 |
% |
$ |
167,682 |
|
34.9 |
% |
|
Latin America |
|
41,106 |
|
6.4 |
|
49,546 |
|
8.6 |
|
52,046 |
|
10.8 |
| |||
|
Europe |
|
84,335 |
|
13.1 |
|
80,062 |
|
13.9 |
|
90,624 |
|
18.8 |
| |||
|
Middle East |
|
281,814 |
|
43.9 |
|
224,716 |
|
39.0 |
|
138,731 |
|
28.9 |
| |||
|
Africa |
|
27,474 |
|
4.3 |
|
26,186 |
|
4.5 |
|
15,303 |
|
3.2 |
| |||
|
Asia/Pacific |
|
36,314 |
|
5.7 |
|
25,159 |
|
4.3 |
|
16,395 |
|
3.4 |
| |||
|
Total |
|
$ |
641,593 |
|
100.0 |
% |
$ |
576,681 |
|
100.0 |
% |
$ |
480,781 |
|
100.0 |
% |
|
|
|
|
|
|
|
|
|
|
|
|
|
|
| |||
|
U.S. |
|
$ |
166,893 |
|
26.0 |
% |
$ |
167,314 |
|
29.0 |
% |
$ |
164,347 |
|
34.2 |
% |
|
Non-U.S. |
|
474,700 |
|
74.0 |
|
409,367 |
|
71.0 |
|
316,434 |
|
65.8 |
| |||
|
Total |
|
$ |
641,593 |
|
100.0 |
% |
$ |
576,681 |
|
100.0 |
% |
$ |
480,781 |
|
100.0 |
% |
For the year ended December 31, 2014, total revenue for the United Arab Emirates amounted to $74,708,000 representing 11.6% of the total and Oman’s total revenue amounted to $70,798,000 representing 11.0% of the total. No other country except for the United States accounted for over 10% of consolidated total revenue.
For the year ended December 31, 2013, total revenue for the United Arab Emirates amounted to $68,158,000 representing 11.8% of the total. No other country except for the United States accounted for over 10% of consolidated total revenue.
For the year ended December 31, 2012, total revenue for the United Arab Emirates amounted to $63,072,000 representing 13.1% of total revenue. No other country except for the United States accounted for over 10% of consolidated total revenue.
Consulting Fee Revenue By Client Type
|
|
|
2014 |
|
2013 |
|
2012 |
| |||||||||
|
|
|
(Restated) |
|
|
|
|
|
|
|
|
| |||||
|
U.S. federal government |
|
$ |
13,250 |
|
2.3 |
% |
$ |
14,958 |
|
2.9 |
% |
$ |
12,877 |
|
3.1 |
% |
|
U.S. state, regional and local governments |
|
74,921 |
|
13.0 |
|
69,477 |
|
13.6 |
|
61,790 |
|
14.8 |
| |||
|
Foreign governments |
|
220,917 |
|
38.3 |
|
181,066 |
|
35.3 |
|
96,242 |
|
23.0 |
| |||
|
Private sector |
|
268,029 |
|
46.4 |
|
246,584 |
|
48.2 |
|
246,689 |
|
59.1 |
| |||
|
Total |
|
$ |
577,117 |
|
100.0 |
% |
$ |
512,085 |
|
100.0 |
% |
$ |
417,598 |
|
100.0 |
% |
Total Revenue By Client Type
|
|
|
2014 |
|
2013 |
|
2012 |
| |||||||||
|
|
|
(Restated) |
|
|
|
|
|
|
|
|
| |||||
|
U.S. federal government |
|
$ |
16,459 |
|
2.6 |
% |
$ |
17,499 |
|
3.0 |
% |
$ |
15,429 |
|
3.2 |
% |
|
U.S. state, regional and local governments |
|
104,866 |
|
16.3 |
|
100,157 |
|
17.4 |
|
82,898 |
|
17.2 |
| |||
|
Foreign governments |
|
234,027 |
|
36.5 |
|
188,981 |
|
32.8 |
|
102,136 |
|
21.2 |
| |||
|
Private sector |
|
286,241 |
|
44.6 |
|
270,044 |
|
46.8 |
|
280,318 |
|
58.4 |
| |||
|
Total |
|
$ |
641,593 |
|
100.0 |
% |
$ |
576,681 |
|
100.0 |
% |
$ |
480,781 |
|
100.0 |
% |
Total Assets by Geographic Region
|
|
|
December 31, |
| |||||||
|
|
|
2014 |
|
2013 |
|
2012 |
| |||
|
|
|
(Restated) |
|
(Restated) |
|
(Restated) |
| |||
|
U.S./Canada |
|
$ |
113,903 |
|
$ |
104,729 |
|
$ |
115,621 |
|
|
Latin America |
|
33,757 |
|
37,506 |
|
42,088 |
| |||
|
Europe |
|
98,106 |
|
102,871 |
|
110,013 |
| |||
|
Middle East |
|
132,211 |
|
108,654 |
|
81,185 |
| |||
|
Africa |
|
21,795 |
|
23,417 |
|
9,004 |
| |||
|
Asia/Pacific |
|
19,837 |
|
16,299 |
|
5,994 |
| |||
|
Total |
|
$ |
419,609 |
|
$ |
393,476 |
|
$ |
363,905 |
|
|
|
|
|
|
|
|
|
| |||
|
U.S. |
|
$ |
112,010 |
|
$ |
103,017 |
|
$ |
114,035 |
|
|
Non-U.S. |
|
307,599 |
|
290,459 |
|
249,870 |
| |||
|
|
|
$ |
419,609 |
|
$ |
393,476 |
|
$ |
363,905 |
|
Property, Plant and Equipment, Net by Geographic Location
|
|
|
December 31, |
| |||||||
|
|
|
2014 |
|
2013 |
|
2012 |
| |||
|
U.S./Canada |
|
$ |
3,358 |
|
$ |
3,837 |
|
$ |
4,700 |
|
|
Latin America |
|
1,101 |
|
1,351 |
|
1,278 |
| |||
|
Europe |
|
2,191 |
|
2,575 |
|
2,334 |
| |||
|
Middle East |
|
3,428 |
|
2,167 |
|
2,344 |
| |||
|
Africa |
|
901 |
|
182 |
|
191 |
| |||
|
Asia/Pacific |
|
664 |
|
501 |
|
421 |
| |||
|
Total |
|
$ |
11,643 |
|
$ |
10,613 |
|
$ |
11,268 |
|
|
|
|
|
|
|
|
|
| |||
|
U.S. |
|
$ |
3,358 |
|
$ |
3,837 |
|
$ |
4,697 |
|
|
Non-U.S. |
|
8,285 |
|
6,776 |
|
6,571 |
| |||
|
Total |
|
$ |
11,643 |
|
$ |
10,613 |
|
$ |
11,268 |
|
Note 19 — Subsequent Event
In connection with the restatement of it consolidated financial statements as of and for the year ended December 31, 2014, the Company became in technical default of its Secured Credit Facilities due to certain misrepresentations, reporting and affirmative covenant breaches. On November 3, 2015, the Company received a waiver of the default. The Company will pay fees of $81,900 and other out-of-pocket expenses incurred by the Administrative Agent.
Note 20 — Quarterly Results (Unaudited)(As Restated)
The following is a summary of certain quarterly financial information for fiscal years 2014, 2013 and 2012 (in thousands except per share data).
|
|
|
First |
|
Second |
|
Third |
|
Fourth |
|
|
| |||||
|
2014 (As reported) |
|
Quarter |
|
Quarter |
|
Quarter |
|
Quarter |
|
Total |
| |||||
|
Consulting fee revenue (1) |
|
$ |
137,249 |
|
$ |
144,515 |
|
$ |
145,324 |
|
$ |
148,717 |
|
$ |
575,805 |
|
|
Total revenue (1) |
|
150,013 |
|
159,639 |
|
161,491 |
|
169,138 |
|
640,281 |
| |||||
|
Gross profit (1) |
|
58,659 |
|
61,269 |
|
62,649 |
|
64,433 |
|
247,010 |
| |||||
|
Operating profit (1) |
|
6,000 |
|
8,655 |
|
11,297 |
|
3,328 |
|
29,280 |
| |||||
|
Net earnings (loss) (1) |
|
293 |
|
2,016 |
|
(8,615 |
) |
(3,310 |
) |
(9,616 |
) | |||||
|
Net earnings (loss) attributable to Hill (1) |
|
53 |
|
1,518 |
|
(8,966 |
) |
(3,484 |
) |
(10,879 |
) | |||||
|
Basic earnings (loss) per common share (1) |
|
$ |
0.00 |
|
$ |
0.04 |
|
$ |
(0.19 |
) |
$ |
(0.07 |
) |
$ |
(0.25 |
) |
|
Diluted earnings (loss) per common share (1) |
|
$ |
0.00 |
|
$ |
0.04 |
|
$ |
0.19 |
|
$ |
(0.07 |
) |
$ |
(0.25 |
) |
|
2014 (Restated) |
|
(Restated) |
|
|
|
|
|
(Restated) |
|
(Restated) |
| |||||
|
Consulting fee revenue (1) |
|
$ |
137,249 |
|
$ |
144,515 |
|
$ |
145,324 |
|
$ |
150,029 |
|
$ |
577,117 |
|
|
Total revenue (1) |
|
150,013 |
|
159,639 |
|
161,491 |
|
170,450 |
|
641,593 |
| |||||
|
Gross profit (1) |
|
58,659 |
|
61,269 |
|
62,649 |
|
64,785 |
|
247,362 |
| |||||
|
Operating profit (1) |
|
10,948 |
|
8,655 |
|
11,297 |
|
3,038 |
|
33,938 |
| |||||
|
Net earnings (loss) (1) |
|
5,548 |
|
2,016 |
|
(8,615 |
) |
(3,796 |
) |
(4,847 |
) | |||||
|
Net earnings (loss) attributable to Hill (1) |
|
5,308 |
|
1,518 |
|
(8,966 |
) |
(4,008 |
) |
(6,148 |
) | |||||
|
Basic earnings (loss) per common share (1)(2) |
|
$ |
0.13 |
|
$ |
0.04 |
|
$ |
(0.19 |
) |
$ |
(0.08 |
) |
$ |
(0.14 |
) |
|
Diluted earnings (loss) per common share (1)(2) |
|
$ |
0.13 |
|
$ |
0.04 |
|
$ |
(0.19 |
) |
$ |
(0.08 |
) |
$ |
(0.14 |
) |
|
2013 (As Reported) |
|
|
|
|
|
|
|
|
|
|
| |||||
|
Consulting fee revenue |
|
$ |
122,556 |
|
$ |
128,427 |
|
$ |
130,181 |
|
$ |
130,921 |
|
$ |
512,085 |
|
|
Total revenue |
|
136,073 |
|
148,464 |
|
147,194 |
|
144,950 |
|
576,681 |
| |||||
|
Gross profit |
|
49,858 |
|
53,070 |
|
54,447 |
|
58,655 |
|
216,030 |
| |||||
|
Operating profit (3) |
|
7,399 |
|
9,840 |
|
8,252 |
|
6,967 |
|
32,458 |
| |||||
|
Net earnings (loss) (3) |
|
38 |
|
1,271 |
|
2,942 |
|
(700 |
) |
3,551 |
| |||||
|
Net (loss) earnings attributable to Hill (3) |
|
(380 |
) |
719 |
|
2,556 |
|
(1,266 |
) |
1,629 |
| |||||
|
Basic (loss) earnings per common share (3) |
|
$ |
(0.01 |
) |
$ |
0.02 |
|
$ |
0.06 |
|
$ |
(0.03 |
) |
$ |
0.04 |
|
|
Diluted (loss) earnings per common share (3) |
|
$ |
(0.01 |
) |
$ |
0.02 |
|
$ |
0.06 |
|
$ |
(0.03 |
) |
$ |
0.04 |
|
|
2013 (Restated) |
|
|
|
(Restated) |
|
(Restated) |
|
|
|
(Restated) |
| |||||
|
Consulting fee revenue |
|
$ |
122,556 |
|
$ |
128,427 |
|
$ |
130,181 |
|
$ |
130,921 |
|
$ |
512,085 |
|
|
Total revenue |
|
136,073 |
|
148,464 |
|
147,194 |
|
144,950 |
|
576,681 |
| |||||
|
Gross profit |
|
49,858 |
|
53,070 |
|
54,447 |
|
58,655 |
|
216,030 |
| |||||
|
Operating profit (3) |
|
7,399 |
|
10,214 |
|
10,118 |
|
6,967 |
|
34,698 |
| |||||
|
Net earnings (loss) (3) |
|
38 |
|
1,594 |
|
4,552 |
|
(700 |
) |
5,484 |
| |||||
|
Net (loss) earnings attributable to Hill (3) |
|
(380 |
) |
1,042 |
|
4,166 |
|
(1,266 |
) |
3,562 |
| |||||
|
Basic (loss) earnings per common share (3) |
|
$ |
(0.01 |
) |
$ |
0.03 |
|
$ |
0.11 |
|
$ |
(0.03 |
) |
$ |
0.09 |
|
|
Diluted (loss) earnings per common share (3) |
|
$ |
(0.01 |
) |
$ |
0.03 |
|
$ |
0.11 |
|
$ |
(0.03 |
) |
$ |
0.09 |
|
|
2012 (As Reported) |
|
|
|
|
|
|
|
|
|
|
| |||||
|
Consulting fee revenue |
|
$ |
99,197 |
|
$ |
104,069 |
|
$ |
103,565 |
|
$ |
110,767 |
|
$ |
417,598 |
|
|
Total revenue |
|
115,813 |
|
119,428 |
|
119,887 |
|
125,653 |
|
480,781 |
| |||||
|
Gross profit |
|
40,735 |
|
44,268 |
|
45,106 |
|
47,917 |
|
178,026 |
| |||||
|
Operating profit (loss) (4) |
|
(2,737 |
) |
3,197 |
|
5,090 |
|
(303 |
) |
5,247 |
| |||||
|
Net (loss) earnings (4) |
|
(6,537 |
) |
518 |
|
1,442 |
|
(21,768 |
) |
(26,345 |
) | |||||
|
Net (loss) earnings attributable to Hill (4) |
|
(6,736 |
) |
(324 |
) |
1,304 |
|
(22,461 |
) |
(28,217 |
) | |||||
|
Basic (loss) earnings per common share (4) |
|
$ |
(0.17 |
) |
$ |
(0.01 |
) |
$ |
0.03 |
|
$ |
(0.58 |
) |
$ |
(0.73 |
) |
|
Diluted (loss) earnings per common share (4) |
|
$ |
(0.17 |
) |
$ |
(0.01 |
) |
$ |
0.03 |
|
$ |
(0.58 |
) |
$ |
(0.73 |
) |
|
2012 (Restated) |
|
|
|
|
|
|
|
(Restated) |
|
(Restated) |
| |||||
|
Consulting fee revenue |
|
$ |
99,197 |
|
$ |
104,069 |
|
$ |
103,565 |
|
$ |
110,767 |
|
$ |
417,598 |
|
|
Total revenue |
|
115,813 |
|
119,428 |
|
119,887 |
|
$ |
125,653 |
|
480,781 |
| ||||
|
Gross profit |
|
40,735 |
|
44,268 |
|
45,106 |
|
$ |
47,917 |
|
178,026 |
| ||||
|
Operating profit (loss) (4) |
|
(2,737 |
) |
3,197 |
|
5,090 |
|
$ |
(48,852 |
) |
(43,302 |
) | ||||
|
Net (loss) earnings (4) |
|
(6,537 |
) |
518 |
|
1,442 |
|
$ |
(70,317 |
) |
(74,894 |
) | ||||
|
Net (loss) earnings attributable to Hill (4) |
|
(6,736 |
) |
(324 |
) |
1,304 |
|
$ |
(71,010 |
) |
(76,766 |
) | ||||
|
Basic (loss) earnings per common share (4) |
|
$ |
(0.17 |
) |
$ |
(0.01 |
) |
$ |
0.03 |
|
$ |
(1.84 |
) |
$ |
(1.99 |
) |
|
Diluted (loss) earnings per common share (4) |
|
$ |
(0.17 |
) |
$ |
(0.01 |
) |
$ |
0.03 |
|
$ |
(1.84 |
) |
$ |
(1.99 |
) |
(1) Quarterly results for 2014 have been restated to reflect (1) the receipt of $6,631,000 against the Libya Receivable, payment of $1,683,000 of agency fees and certain taxes related to the Libya Receivable, and an income tax benefit of $307,000 which increased operating profit by $4,948,000 and net earnings and net earnings attributable to Hill by $5,255,000, or $0.13 per diluted common share, in the first quarter and (2) an increase in consulting fee revenue and total revenue of $1,312,000 from a joint venture; an increase in cost of services of $960,000 arising from under accrued end of service benefits of approximately $1,360,000, an impairment loss relating to an abandoned job site of approximately $1,013,000, offset by a refundable tax payment of $1,413,000; an increase in SG&A expenses of $642,000 related to legal, bad debt and other related expense; and an increase of $196,000 in income tax expense which increased gross profit by $352,000, decreased operating profit by $290,000, decreased net earnings by $486,000 and decreased net earnings attributable to Hill by $524,000, or $0.01 per diluted common share in the fourth quarter.
(2) Basic and diluted earnings (loss) per common share for each quarter is computed using the weighted average number of shares outstanding during the quarter, while basic and diluted earnings (loss) per common share for the year is computed using the weighted average number of shares outstanding for the year. Thus, the sum of earnings (loss) per common share for the quarters may not equal the amount for the year.
(3) Quarterly results for 2013 have been restated to reflect (1) the receipt of $604,000 against the Libya Receivable, payment of $230,000 of agency fees and certain taxes related to the Libya Receivable, and an income tax expense of $51,000 which increased operating profit by $374,000 and net earnings and net earnings attributable to Hill by $374,000 and $323,000. respectively, or $0.01 per diluted common share in the first quarter and (2) the receipt of $2,276,000 against the Libya Receivable, payment of $410,000 of agency fees and certain taxes related to the Libya Receivable, and an income tax expense of $256,000 which increased operating profit by $1,866,000 and net earnings and net earnings attributable to Hill by $1,610,000, or $0.05 per diluted common share.
(4) Quarterly results for 2012 have been restated to reflect the establishment of a $59,937,000 reserve against the Libya Receivable and the elimination of $11,388,000 of certain assets and liabilities related to the Libya Receivable resulting in a net increase in SG&A expenses, an increase in operating loss, an increase in net loss and net loss attributable to Hill of $48,549,000, or $1.26 per diluted common share in the fourth quarter of 2012.
REPORT OF INDEPENDENT REGISTERED PUBLIC ACCOUNTING FIRM
To the Board of Directors and Stockholders
Hill International, Inc. and Subsidiaries
We have audited the accompanying consolidated balance sheets of Hill International, Inc. and Subsidiaries (the “Company”) as of December 31, 2014, 2013 and 2012, and the related consolidated statements of operations, comprehensive (loss) earnings, stockholders’ equity, and cash flows for each of the years in the three-year period ended December 31, 2014. The financial statements are the responsibility of the Company’s management. Our responsibility is to express an opinion on these financial statements based on our audits.
We conducted our audits in accordance with the standards of the Public Company Accounting Oversight Board (United States). Those standards require that we plan and perform the audit to obtain reasonable assurance about whether the financial statements are free of material misstatement. An audit includes examining, on a test basis, evidence supporting the amounts and disclosures in the financial statements. An audit also includes assessing the accounting principles used and significant estimates made by management, as well as evaluating the overall financial statement presentation. We believe that our audits provide a reasonable basis for our opinion.
In our opinion, the financial statements referred to above present fairly, in all material respects, the consolidated financial position of Hill International, Inc. and Subsidiaries as of December 31, 2014, 2013 and 2012 the consolidated results of their operations and their cash flows for each of the years in the three-year period ended December 31, 2014 in conformity with accounting principles generally accepted in the United States of America.
As discussed in Note 1 to the consolidated financial statements, the consolidated financial statements for each of the years in the three-year period ended December 31, 2014 have been restated to correct for errors in accounting relating to the estimation of the collectability of its accounts receivable and for the impact of unrelated adjustments for the year ended December 31, 2014.
We also have audited, in accordance with the standards of the Public Company Accounting Oversight Board (United States), Hill International, Inc. and Subsidiaries’ internal control over financial reporting as of December 31, 2014, based on criteria established in the 2013 Internal Control - Integrated Framework and internal control over financial reporting as of December 31, 2013 and 2012, based on criteria established in the 1992 Internal Control — Integrated Framework issued by the Committee of Sponsoring Organizations of the Treadway Commission (“COSO”). Our report dated March 13, 2015, except for the restatement of the effectiveness of internal control over financial reporting for the material weaknesses related to the estimation of the collectability of the Company’s accounts receivable and for the accounting closing process and non-routine transactions, which is as of November 10, 2015, expressed an adverse opinion on the effectiveness of the Company’s internal control over financial reporting as of December 31, 2014. Our reports dated March 14, 2014 and March 18, 2013, except for the restatement of the effectiveness of internal control over financial reporting for the material weakness related to the estimation of the collectability of the Company’s accounts receivable, which is dated November 10, 2015, expressed an adverse opinion on the effectiveness of the Company’s internal control over financial reporting as of December 31, 2013 and 2012, respectively.
In connection with our audits of the consolidated financial statements referred to above, we also audited Schedule II - Valuation and Qualifying Accounts for each of the years in the three-year period ended December 31, 2014. In our opinion, this financial schedule, when considered in relation to the consolidated financial statements taken as a whole, presents fairly, in all material respects, the information stated therein.
/s/ EisnerAmper LLP
Iselin, New Jersey
March 13, 2015, except as to Notes 1, 5, 9, 14, 18, and 19 which is as of November 10, 2015
REPORT OF INDEPENDENT REGISTERED PUBLIC ACCOUNTING FIRM
To the Board of Directors and Stockholders
Hill International, Inc. and Subsidiaries
We have audited Hill International, Inc. and Subsidiaries’ (the “Company”) internal control over financial reporting as of December 31, 2014, based on criteria established in the 2013 Internal Control - Integrated Framework issued by the Committee of Sponsoring Organizations of the Treadway Commission (“COSO”). The Company’s management is responsible for maintaining effective internal control over financial reporting and for its assessment of the effectiveness of internal control over financial reporting, included in the accompanying Management’s Annual Report on Internal Control over Financial Reporting. Our responsibility is to express an opinion on the Company’s internal control over financial reporting based on our audit.
We conducted our audit in accordance with the standards of the Public Company Accounting Oversight Board (United States). Those standards require that we plan and perform the audit to obtain reasonable assurance about whether effective internal control over financial reporting was maintained in all material respects. Our audit included obtaining an understanding of internal control over financial reporting, assessing the risk that a material weakness exists, and testing and evaluating the design and operating effectiveness of internal control based on the assessed risk. Our audit also included performing such other procedures as we considered necessary in the circumstances. We believe that our audit provides a reasonable basis for our opinion.
A company’s internal control over financial reporting is a process designed to provide reasonable assurance regarding the reliability of financial reporting and the preparation of financial statements for external purposes in accordance with generally accepted accounting principles. A company’s internal control over financial reporting includes those policies and procedures that (i) pertain to the maintenance of records that, in reasonable detail, accurately and fairly reflect the transactions and dispositions of the assets of the company; (ii) provide reasonable assurance that transactions are recorded as necessary to permit preparation of financial statements in accordance with generally accepted accounting principles, and that receipts and expenditures of the company are being made only in accordance with authorizations of management and directors of the company; and (iii) provide reasonable assurance regarding prevention or timely detection of unauthorized acquisition, use, or disposition of the company’s assets that could have a material effect on the financial statements.
Because of its inherent limitations, internal control over financial reporting may not prevent or detect misstatements. Also, projections of any evaluation of effectiveness to future periods are subject to the risk that controls may become inadequate because of changes in conditions, or that the degree of compliance with the policies or procedures may deteriorate.
A material weakness is a deficiency, or a combination of deficiencies, in internal control over financial reporting, such that there is a reasonable possibility that a material misstatement of the company’s annual or interim financial statements will not be prevented or detected on a timely basis. Subsequent to the filing of the 2014 Annual Report on Form 10-K dated March 13, 2015, the Company’s management identified, in its revised management assessment, the following material weaknesses as of December 31, 2014: a material weakness exists related to the estimation of the potential loss on the Company’s accounts receivable as of December 31, 2014 and an additional material weakness exists relating to the accounting closing process and non-routine transactions as of December 31, 2014.
These material weaknesses were considered in determining the nature, timing, and extent of audit tests applied in our audit of the consolidated financial statements as of and for the year ended December 31, 2014, and this report does not affect our report on the consolidated financial statements and financial statement schedule. The assessment of the effectiveness of internal control over financial reporting included in the accompanying Management’s Annual Report on Internal Control Over Financial Reporting has been restated by Hill International, Inc.’s management to reflect the aforementioned material weaknesses and that, as a result, Hill International, Inc.’s internal control over financial reporting was not effective as of December 31, 2014.
In our opinion, because of the effect of the aforementioned material weaknesses on the achievement of the objectives of the control criteria, Hill International, Inc. has not maintained effective internal control over financial reporting as of December 31, 2014, based on criteria established in the 2013 Internal Control - Integrated Framework issued by the Committee of Sponsoring Organizations of the Treadway Commission (“COSO”).
We also have audited, in accordance with the standards of the Public Company Accounting Oversight Board (United States), the consolidated financial statements and financial statement schedule of Hill International, Inc. and our report dated March 13, 2015 (except as to Notes 1, 5, 9, 14, 18 and 19 which is as of November 10, 2015), expressed an unqualified opinion on those consolidated financial statements and financial statement schedule and included an explanatory paragraph regarding the restatement.
/s/ EisnerAmper LLP
Iselin, New Jersey
March 13, 2015, except for the restatement of the effectiveness of internal control over financial reporting for the material weaknesses, which is as of November 10, 2015
REPORT OF INDEPENDENT REGISTERED PUBLIC ACCOUNTING FIRM
To the Board of Directors and Stockholders
Hill International, Inc. and Subsidiaries
We have audited Hill International, Inc. and Subsidiaries’ (the “Company”) internal control over financial reporting as of December 31, 2013, based on criteria established in the 1992 Internal Control - Integrated Framework issued by the Committee of Sponsoring Organizations of the Treadway Commission (“COSO”). The Company’s management is responsible for maintaining effective internal control over financial reporting and for its assessment of the effectiveness of internal control over financial reporting, included in the accompanying Management’s Annual Report on Internal Control over Financial Reporting. Our responsibility is to express an opinion on the Company’s internal control over financial reporting based on our audit.
We conducted our audit in accordance with the standards of the Public Company Accounting Oversight Board (United States). Those standards require that we plan and perform the audit to obtain reasonable assurance about whether effective internal control over financial reporting was maintained in all material respects. Our audit included obtaining an understanding of internal control over financial reporting, assessing the risk that a material weakness exists, and testing and evaluating the design and operating effectiveness of internal control based on the assessed risk. Our audit also included performing such other procedures as we considered necessary in the circumstances. We believe that our audit provides a reasonable basis for our opinion.
A company’s internal control over financial reporting is a process designed to provide reasonable assurance regarding the reliability of financial reporting and the preparation of financial statements for external purposes in accordance with generally accepted accounting principles. A company’s internal control over financial reporting includes those policies and procedures that (i) pertain to the maintenance of records that, in reasonable detail, accurately and fairly reflect the transactions and dispositions of the assets of the company; (ii) provide reasonable assurance that transactions are recorded as necessary to permit preparation of financial statements in accordance with generally accepted accounting principles, and that receipts and expenditures of the company are being made only in accordance with authorizations of management and directors of the company; and (iii) provide reasonable assurance regarding prevention or timely detection of unauthorized acquisition, use, or disposition of the company’s assets that could have a material effect on the financial statements.
Because of its inherent limitations, internal control over financial reporting may not prevent or detect misstatements. Also, projections of any evaluation of effectiveness to future periods are subject to the risk that controls may become inadequate because of changes in conditions, or that the degree of compliance with the policies or procedures may deteriorate.
A material weakness is a deficiency, or a combination of deficiencies, in internal control over financial reporting, such that there is a reasonable possibility that a material misstatement of the company’s annual or interim financial statements will not be prevented or detected on a timely basis. Subsequent to the filing of the 2013 Annual Report on Form 10-K dated March 14, 2014, the Company’s management identified, in its revised management assessment, the following material weakness as of December 31, 2013: a material weakness exists related to the estimation of the potential loss on the Company’s accounts receivable as of December 31, 2013.
This material weakness was considered in determining the nature, timing, and extent of audit tests applied in our audit of the consolidated financial statements as of and for the year ended December 31, 2013, and this report does not affect our report on the consolidated financial statements and financial statement schedule.
The assessment of the effectiveness of internal control over financial reporting included in the accompanying Management’s Annual Report on Internal Control Over Financial Reporting has been restated by Hill International, Inc.’s management to reflect the aforementioned material weakness and that, as a result, Hill International, Inc.’s internal control over financial reporting was not effective as of December 31, 2013.
In our opinion, because of the effect of the aforementioned material weakness on the achievement of the objectives of the control criteria, Hill International, Inc. and Subsidiaries has not maintained effective internal control over financial reporting as of December 31, 2013, based on criteria established in the 1992 Internal Control - Integrated Framework issued by COSO.
We also have audited, in accordance with the standards of the Public Company Accounting Oversight Board (United States), the consolidated financial statements and financial statement schedule of Hill International, Inc. and our report dated March 13, 2015 (except as to Notes 1, 5, 9, 14, 18 and 19 which is as of November 10, 2015), expressed an unqualified opinion on those consolidated financial statements and financial statement schedule and included an explanatory paragraph regarding the restatement.
/s/ EisnerAmper LLP
Iselin, New Jersey
March 14, 2014, except for the restatement of the effectiveness of internal control over financial reporting for the material weakness, which is as of November 10, 2015
REPORT OF INDEPENDENT REGISTERED PUBLIC ACCOUNTING FIRM
To the Board of Directors and Stockholders
Hill International, Inc. and Subsidiaries
We have audited Hill International, Inc. and Subsidiaries’ (the “Company”) internal control over financial reporting as of December 31, 2012, based on criteria established in Internal Control - Integrated Framework issued by the Committee of Sponsoring Organizations of the Treadway Commission (“COSO”). The Company’s management is responsible for maintaining effective internal control over financial reporting and for its assessment of the effectiveness of internal control over financial reporting, included in the accompanying Management’s Annual Report on Internal Control over Financial Reporting. Our responsibility is to express an opinion on the Company’s internal control over financial reporting based on our audit.
We conducted our audit in accordance with the standards of the Public Company Accounting Oversight Board (United States). Those standards require that we plan and perform the audit to obtain reasonable assurance about whether effective internal control over financial reporting was maintained in all material respects. Our audit included obtaining an understanding of internal control over financial reporting, assessing the risk that a material weakness exists, and testing and evaluating the design and operating effectiveness of internal control based on the assessed risk. Our audit also included performing such other procedures as we considered necessary in the circumstances. We believe that our audit provides a reasonable basis for our opinion.
A company’s internal control over financial reporting is a process designed to provide reasonable assurance regarding the reliability of financial reporting and the preparation of financial statements for external purposes in accordance with generally accepted accounting principles. A company’s internal control over financial reporting includes those policies and procedures that (i) pertain to the maintenance of records that, in reasonable detail, accurately and fairly reflect the transactions and dispositions of the assets of the company; (ii) provide reasonable assurance that transactions are recorded as necessary to permit preparation of financial statements in accordance with generally accepted accounting principles, and that receipts and expenditures of the company are being made only in accordance with authorizations of management and directors of the company; and (iii) provide reasonable assurance regarding prevention or timely detection of unauthorized acquisition, use, or disposition of the company’s assets that could have a material effect on the financial statements.
Because of its inherent limitations, internal control over financial reporting may not prevent or detect misstatements. Also, projections of any evaluation of effectiveness to future periods are subject to the risk that controls may become inadequate because of changes in conditions, or that the degree of compliance with the policies or procedures may deteriorate.
A material weakness is a deficiency, or a combination of deficiencies, in internal control over financial reporting, such that there is a reasonable possibility that a material misstatement of the company’s annual or interim financial statements will not be prevented or detected on a timely basis. Subsequent to the filing of the 2012 Annual Report on Form 10-K dated March 18, 2013, the Company’s management identified, in its revised management assessment, the following material weakness as of December 31, 2012: a material weakness exists related to the estimation of the potential loss on the Company’s accounts receivable as of December 31, 2012.
This material weakness was considered in determining the nature, timing, and extent of audit tests applied in our audit of the consolidated financial statements as of and for the year ended December 31, 2012, and this report does not affect our report on the consolidated financial statements and financial statement schedule.
The assessment of the effectiveness of internal control over financial reporting included in the accompanying Management’s Annual Report on Internal Control Over Financial Reporting has been restated by Hill International, Inc.’s management to reflect the aforementioned material weakness and that, as a result, Hill International, Inc.’s internal control over financial reporting was not effective as of December 31, 2012.
In our opinion, because of the effect of the aforementioned material weakness on the achievement of the objectives of the control criteria, Hill International, Inc. and Subsidiaries has not maintained, effective internal control over financial reporting as of December 31, 2012, based on criteria established in 1992 Internal Control - Integrated Framework issued by COSO.
We also have audited, in accordance with the standards of the Public Company Accounting Oversight Board (United States), the consolidated financial statements and financial statement schedule of Hill International, Inc. and our report dated March 13, 2015 (except as to Notes 1, 5, 9, 14, 18 and 19 which is as of November 10, 2015), expressed an unqualified opinion on those consolidated financial statements and financial statement schedule and included an explanatory paragraph regarding the restatement.
/s/ EisnerAmper LLP
Edison, New Jersey
March 18, 2013, except for the restatement of the effectiveness of internal control over financial reporting for the material weakness, which is as of November 10, 2015
Item 9. Changes in and Disagreements with Accountants on Accounting and Financial Disclosure.
None.
Item 9A. Controls and Procedures.
Conclusion Regarding the Effectiveness of Disclosure Controls and Procedures
In connection with filing the Original Form 10-K, our Chairman and Chief Executive Officer (principal executive officer) and our Senior Vice President and Chief Financial Officer (principal financial officer) evaluated our disclosure controls and procedures (as defined in Exchange Act Rules 13a-15(e) and 15d-15(e)) as of the end of the period covered by this Form 10-K. Based on this evaluation, our Chairman and Chief Executive Officer and our Senior Vice President and Chief Financial Officer concluded that our disclosure controls and procedures were effective as of such date.
Subsequent to that evaluation, in connection with the restatement discussed in Note 1 to the consolidated financial statements included in Item 8 of this Form 10-K/A, management re-evaluated the effectiveness of the design and operation of our disclosure controls and procedures as of each of the years ended December 31, 2014, 2013 and 2012. In conducting the re-evaluation, management considered the material weaknesses in our internal control over financials reporting and the status of their remediation as discussed below. Following the re-evaluation, management concluded that our disclosure controls and procedures were not effective as of each of the years ended December 31, 2014, 2013 and 2012.
Notwithstanding the existence of the material weaknesses described below, we have performed additional analyses and other procedures to enable us to conclude that the consolidated financial statements included in this Form 10-K/A present fairly, in all material respects, our financial position, results of operations and cash flows for the periods presented in conformity with U.S. generally accepted accounting principles.
There are inherent limitations to the effectiveness of any system of disclosure controls and procedures, including the possibility of human error and the circumvention or overriding of the controls and procedures. Accordingly, even effective disclosure controls and procedures can only provide reasonable assurance of achieving their control objectives.
Management’s Annual Report on Internal Control Over Financial Reporting (Restated)
Our management is responsible for establishing and maintaining effective internal control over financial reporting, as such term is defined in Exchange Act Rule 13a-15(f). Our internal control system was designed under the supervision of our Chairman and Chief Executive Officer and our Senior Vice President and Chief Financial Officer and with the participation of management in order to provide reasonable assurance regarding the reliability of our financial reporting and our preparation of financial statements for external purposes in accordance with U.S. generally accepted accounting principles.
All internal control systems, no matter how well designed and tested, have inherent limitations, including, among other things, the possibility of human error, circumvention or disregard. Therefore, even those systems of internal control that have been determined to be effective can provide only reasonable assurance that the objectives of the control system are met and may not prevent or detect misstatements. Also, projections of any evaluation of effectiveness to future periods are subject to the risk that controls may become inadequate because of changes in conditions, or that the degree of compliance with the policies or procedures may deteriorate.
Under the supervision of our Chairman and Chief Executive Officer and our Senior Vice President and Chief Financial Officer and with the participation of management, we conducted an assessment of the effectiveness of our internal control over financial reporting as of December 31, 2014 based on the criteria set forth in the 2013 “Internal Control-Integrated Framework” and internal control over financial reporting as of December 31, 2013 and 2012, based on criteria established in the 1992 “internal Control-Integrated Framework” issued by the Committee of Sponsoring Organizations of the Treadway Commission (the “COSO”). Based on an assessment of such criteria as of each such date, management concluded that we had maintained effective internal controls over financial reporting as of such date.
Subsequent to that evaluation, in connection with the restatement discussed in Note 1 to the consolidated financial statements included in Item 8 of this Amendment, management, under the supervision of our President and Chief Executive Officer and our Senior Vice President and Chief Financial Officer, re-evaluated the effectiveness of our internal control over financial reporting and, based on the criteria established in the applicable “Internal Control-Integrated Framework” issued by the COSO, determined that that our internal control over financial reporting was not effective as of each of December 31, 2014, 2013 and 2012, due to the material weaknesses described below. A material weakness is a deficiency, or a combination of deficiencies, in internal control over financial reporting, such that there is a reasonable possibility that a material misstatement of the annual or interim financial statements will not be prevented or detected on a timely basis. As a result of the material weaknesses described below, management has restated this Annual Report on Internal Control over Financial Reporting contained in the Original Form 10-K.
Based on its re-evaluation, management identified the following material weakness as of December 31, 2014, 2013 and 2012: management misapplied U.S. generally accepted accounting principles as it relates to the estimation of the potential loss on the Company’s accounts receivable. Specifically, the Company did not have sufficient procedures and controls in place to enable the proper application of U.S. generally accepted accounting principles to significant, non-routine transactions, such as the events which occurred in Libya, which give rise to the restatement requiring the filing of this Form 10-K/A.
In connection with the preparation and filing of this Form 10-K/A, management has re-evaluated the effectiveness of our internal control over financial reporting as of December 31, 2014. Based on this re-evaluation, management identified an additional material weakness as of December 31, 2014. As a result of the restatement, previous immaterial variances in certain accounts that were not recorded during the December 31, 2014 year end closing process became material when aggregated and assessed against the restated 2014 financial statements. Specifically, management has identified the following deficiencies that constituted the material weakness as of December 31, 2014: management did not maintain effective procedures in the areas of the accounting closing process, accounting estimates and non-routine transactions.
A re-assessment of the effectiveness of our internal control over financial reporting as of each of the years ended December 31, 2014, 2013 and 2012 has been performed by EisnerAmper LLP, an independent registered public accounting firm. The attestation report of EisnerAmper LLP is included in Part II, Item 8 of this Form 10-K/A.
Management’s Remediation Initiatives
Management is committed to the implementation of a plan to address the above-described material weaknesses and to ensure the development of sufficient procedures and controls to remediate these material weaknesses. These remediation efforts, summarized below, portions of which are either implemented or in process, are intended to both address the identified material weaknesses and to enhance our overall financial control environment.
The Company has corrected its accounting treatment for the Libya Receivable through the process of restating the financial statements included herein, and is in the process of further enhancing its existing procedures and controls over accounts receivable to more thoroughly assess unusual significant items of a similar nature and magnitude. This includes, but is not limited to, a more thorough evaluation of information and data provided by a third party and additional discussions and conclusions at reporting dates, with internal management and the Company’s internal controls advisors and legal advisors. Management believes these control enhancements, once enacted, will remediate the material weaknesses in internal control over financial reporting described above. In addition, the Company is in the process of enhancing its close the books processes at the corporate and local levels to ensure effective management reviews and communication with accounting personnel over the accounting for estimates and non-routine transactions. The Company will test the ongoing operating effectiveness of the new controls in future periods. The material weaknesses cannot be considered remediated until the applicable remedial controls operate for a sufficient period of time and management has concluded, through testing, that these controls are operating effectively.
When fully implemented and operational, management believes the measures described above will remediate the material weaknesses identified and strengthen internal control over financial reporting. The Company is committed to continuing to improve its internal control processes and will continue to diligently and vigorously review its financial reporting controls and procedures. As we continue to evaluate and work to improve our internal control over financial reporting, our management may determine to take additional measures to address the material weakness or determine to modify, or in appropriate circumstances not to complete certain items of the remediation measures described above.
Changes in Internal Control Over Financial Reporting
Other than as described above, there were no changes in our internal control over financial reporting identified in connection with the evaluation required by paragraph (d) of the Exchange Act Rules 13a-15(e) and 15d-15(e) that occurred during each of the years ended December 31, 2014, 2013 and 2012 that has materially affected, or are reasonably likely to materially affect, our internal control over financial reporting.
Not applicable.
Item 10. Directors, Executive Officers and Corporate Governance.
The information in our 2015 Proxy Statement, which will be filed with the U. S. Securities and Exchange Commission within 120 days after the close of our fiscal year, regarding directors and executive officers appearing under the headings “Proposal 1: Election of Directors” and “Other Matters—Section 16(a) Beneficial Ownership Reporting Compliance” is incorporated by reference in this section. The information under the heading “Executive Officers” in Part I, Item 1 of this Form 10-K is also incorporated by reference in this section. In addition, the information under the heading “Corporate Governance” in our 2015 Proxy Statement is incorporated by reference in this section.
We have adopted a code of ethics that applies to all of our employees, including our principal executive officer, principal financial officer, principal accounting officer or controller, or persons performing similar functions. This code of ethics is available on our website at www.hillintl.com, or may be obtained free of charge by making a written request addressed to our Legal Department. We will disclose on our website amendments to, and, if any are granted, waivers of, our code of ethics for our principal executive officer, principal financial officer, principal accounting officer or controller.
Item 11. Executive Compensation.
The information appearing in our 2015 Proxy Statement under the headings “Director Compensation,” “Compensation Discussion and Analysis,” “Report of the Compensation Committee”, and “Executive Compensation” is incorporated by reference in this section.
Item 12. Security Ownership of Certain Beneficial Owners and Management and Related Stockholder Matters.
The information appearing in our 2015 Proxy Statement under the heading “Security Ownership of Certain Beneficial Owners and Management” is incorporated by reference in this section.
Equity Compensation Plan Information
The following table provides information as of December 31, 2014 for common shares of the Company that may be issued under our 2006 Employee Stock Option Plan, our 2008 Employee Stock Purchase Plan and our 2009 Non-Employee Director Stock Grant Plan. See Note 11 to the consolidated financial statements for further information related to these plans.
|
|
|
Number of securities |
|
Weighted-average |
|
Number of securities |
| |
|
|
|
A |
|
B |
|
C |
| |
|
|
|
|
|
|
|
|
| |
|
Equity compensation plans approved by security holders |
|
7,359,176 |
|
$ |
4.67 |
|
3,576,852 |
(1) |
|
|
|
|
|
|
|
|
| |
|
Equity compensation plans not approved by security holders |
|
— |
|
— |
|
— |
| |
|
|
|
|
|
|
|
|
| |
|
Total |
|
7,359,176 |
|
$ |
4.67 |
|
3,576,852 |
|
(1) As of December 31, 2014, the Company had 2,057,474 shares remaining available for future issuance under our 2006 Employee Stock Option Plan, 1,375,863 shares remaining available for future issuance under our 2008 Employee Stock Purchase Plan and 143,515 shares remaining available for future issuance under our 2009 Non-Employee Director Stock Grant Plan.
(2) In January 2015, the Company granted 1,025,000 options to purchase shares of its common stock, decreasing the number of shares remaining available for future issuance under our 2006 Employee Stock Option Plan to 1,032,074 as of January 27, 2015.
Item 13. Certain Relationships and Related Transactions, and Director Independence.
The information appearing in our 2015 Proxy Statement under the headings “Corporate Governance” and “Certain Relationships and Related Transactions” is incorporated by reference in this section
Item 14. Principal Accounting Fees and Services.
The information appearing in our 2015 Proxy Statement under the headings “Independent Auditors” and “Audit Committee Report” is incorporated by reference in this section.
Item 15. Exhibits and Financial Statement Schedules.
(a) Documents filed as part of this report:
Financial statements:
The consolidated balance sheets of the Registrant as of December 31, 2014 and December 31, 2013, the related consolidated statements of operations, comprehensive (loss) earnings, stockholders’ equity and cash flows for each of the years in the three-year period ended December 31, 2014, the footnotes thereto, and the report of EisnerAmper LLP, independent auditors, are filed herewith.
Financial statement schedule:
Schedule II—Valuation and Qualifying Accounts for the years ended December 31, 2014, 2013 and 2012 (Restated).
(b) Exhibits
Exhibit Index
|
Exhibit No. |
|
Description |
|
2.1 |
|
Agreement and Plan of Merger dated December 5, 2005, by and among Arpeggio Acquisition Corporation, Hill International, Inc. and certain stockholders of Hill International, Inc., as amended.(1) |
|
3.1 |
|
Amended and Restated Certificate of Incorporation of Arpeggio Acquisition Corporation.(2) |
|
3.2 |
|
Amended and Restated By-laws of Hill International, Inc.(3) |
|
3.3 |
|
Certificate of First Amendment of Amended and Restated Certificate of Incorporation of Hill International, Inc.(4) |
|
4.1 |
|
Specimen Common Stock Certificate.(5) |
|
10.1* |
|
Hill International, Inc. 2006 Employee Stock Option Plan (as amended through June 11, 2012).(6) |
|
10.2* |
|
Employment Agreement between the Company and Irvin E. Richter.(7) |
|
10.3* |
|
Employment Agreement between the Company and David L. Richter.(8) |
|
10.4* |
|
Employment Agreement between the Company and Irvin E. Richter, dated as of December 31, 2014.(9) |
|
10.5* |
|
Employment Agreement between the Company and David L. Richter, dated as of December 31, 2014.(10) |
|
10.6 |
|
Contract for Construction Management/Build Services dated February 11, 2004 between Hill International, Inc. and City of New York, Department of Design and Construction.(11) |
|
10.7 |
|
U.S. Credit Agreement, dated as of September 26, 2014, among Hill International, Inc., as borrower, Société Générale, as administrative agent, collateral agent and lender, the other lenders party thereto, and certain subsidiaries of the Company. (12) |
|
10.8 |
|
U.S. Guaranty and Security Agreement, dated as of September 26, 2014, among Hill International, Inc., Société Générale, as administrative agent and collateral agent and certain subsidiaries of the Company.(13) |
|
10.9 |
|
International Credit Agreement, dated as of September 26, 2014, among Hill International N.V., as borrower, Hill International, Inc., certain of its subsidiaries party thereto, and Société Générale, as administrative agent, collateral agent and letter of credit issuer, and the lenders party thereto.(14) |
|
10.10 |
|
International Guaranty and Security Agreement, dated as of September 26, 2014, among Hill International N.V., as borrower, Hill International, Inc., and the lenders party thereto in favor of Société Générale, as administrative agent.(15) |
|
10.11 |
|
Intercreditor Agreement, dated as of September 26, 2014, by and among Société Générale, as collateral agent, and the loan parties thereto.(16) |
|
10.12 |
|
Credit Agreement dated as of June 30, 2009 among Hill International, Inc., as the borrower, Bank of America, N.A., Capital One, N.A., The Private Bank and Trust Company and PNC Bank N.A.(17) |
|
10.13 |
|
Forbearance Agreement, dated as of June 30, 2011, by and among Hill International, Inc., a Delaware corporation, as Borrower, Bank of America, N.A., Capital One, N.A., The PrivateBank and Trust Company, PNC Bank N.A., as Lenders, and Bank of America, N.A., as Administrative Agent for the Secured Parties (as defined in the Credit Agreement).(18) |
|
10.14 |
|
First Amendment to Forbearance Agreement, dated as of August 16, 2011, by and among Hill International, Inc., a Delaware corporation, as Borrower, Bank of America, N.A., Capital One, N.A., The PrivateBank and Trust Company, PNC Bank National Association, as Lenders, and Bank of America, N.A., as Administrative Agent (as defined in the Forbearance Agreement).(19) |
|
10.15 |
|
Second Amendment to Forbearance Agreement, dated as of September 30, 2011, by and among Hill International, Inc., a Delaware corporation, as Borrower, Bank of America, N.A., Capital One, N.A., The PrivateBank and Trust Company, PNC Bank National Association, as Lenders, and Bank of America, N.A., as Administrative Agent (as defined in the Forbearance Agreement).(20) |
|
10.16 |
|
Forbearance and First Amendment to Credit Agreement, dated as of October 17, 2011, by and among Hill International, Inc., a Delaware corporation, as Borrower, Bank of America, N.A., Capital One, N.A., The PrivateBank and Trust Company, PNC Bank National Association, as Lenders, and Bank of America, N.A., as Administrative Agent (as defined in the Forbearance Agreement).(21) |
|
10.17 |
|
Limited Waiver and Second Amendment to Credit Agreement dated March 6, 2012 between Hill International, Inc., as borrower, Bank of America, N.A., Capital One, N.A., The Private Bank and Trust Company, PNC Bank N.A., as Lenders, and Bank of America, N.A., as Administrative Agent (as defined in the Credit Agreement).(22) |
|
10.18 |
|
Third Amendment to Credit Agreement, dated as of October 18, 2012, by and among Hill International, Inc., as Borrower, Bank of America, N.A., Capital One, N.A., The PrivateBank and Trust Company, PNC Bank National Association, as Lenders, and Bank of America, N.A., as administrative agent. (23) |
|
10.19 |
|
Second Amendment to Guarantee and Collateral Agreement, dated as of October 18, 2012, made by Hill International |
|
|
|
Inc. and certain of its subsidiaries party thereto in favor of Bank of America, N.A., as administrative agent.(24) |
|
10.20 |
|
Fourth Amendment to Credit Agreement, dated as of May 23, 2013, by and among Hill International, Inc., as Borrower, Bank of America, N.A., Capital One, N.A., The PrivateBank and Trust Company, PNC Bank National Association, as Lenders, and Bank of America, N.A., as administrative agent.(25) |
|
10.21 |
|
Credit Agreement, dated as of October 18, 2012, by and among Hill International, Inc., as Borrower, each lender from time to time party thereto, as Lenders, and Obsidian Agency Services, Inc., as administrative agent.(26) |
|
10.22 |
|
Guarantee and Collateral Agreement, dated as of October 18, 2012, made by Hill International, Inc. and certain of its subsidiaries party thereto in favor of Obsidian Agency Services, Inc. as administrative agent.(27) |
|
10.23 |
|
Note, dated as of October 18, 2012, issued by Hill International, Inc. in favor of Tennenbaum Opportunities Fund VI, LLC for $28,000,000.(28) |
|
10.24 |
|
Note, dated as of October 18, 2012, issued by Hill International, Inc. in favor of Tennenbaum Opportunities Partners V, LLC for $46,666,667.(29) |
|
10.25 |
|
Note, dated as of October 18, 2012, issued by Hill International, Inc. in favor of Special Value Expansion Fund, LLC for $8,000,000.(30) |
|
10.26 |
|
Note, dated as of October 18, 2012, issued by Hill International, Inc. in favor of Special Value Opportunities Fund, LLC for $17,333,333.(31) |
|
10.27 |
|
Trademark Security Agreement, dated as of October 18, 2012, made by Hill International, Inc. in favor of Obsidian Agency Services, Inc.(32) |
|
10.28 |
|
Intercreditor Agreement, dated as of October 18, 2012, by and between Bank of America, N.A. and Obsidian Agency Services, Inc. (33) |
|
10.29 |
|
Letter, dated as of October 18, 2012, from Hill International, Inc. to Obsidian Agency Services, Inc., as Administrative Agent regarding Fee Letter.(34) |
|
10.30 |
|
First Amendment to Credit Agreement, dated as of May 23, 2013, by and among Hill International, Inc., as Borrower, Special Opportunities Fund, LLC, Special Value Expansion Fund, LLC, Tennenbaum Opportunities Partners V, LP and Tennenbaum Opportunities Fund VI, LLC, as Lenders, and Obsidian Agency Services, Inc., as administrative agent.(35) |
|
10.31* |
|
Hill International, Inc. 2009 Non-Employee Director Stock Grant Plan, as amended.(36) |
|
10.32* |
|
Hill International, Inc. 2007 Restricted Stock Grant Plan.(37) |
|
10.33* |
|
Hill International, Inc. 2008 Employee Stock Purchase Plan.(38) |
|
14 |
|
Code of Ethics. (39) |
|
21 |
|
Subsidiaries of the Registrant. |
|
23.1 |
|
Consent of EisnerAmper LLP, Independent Registered Public Accounting Firm |
|
31.1 |
|
Certification of Chief Executive Officer pursuant to Section 302 of the Sarbanes-Oxley Act of 2002. |
|
31.2 |
|
Certification of Chief Financial Officer pursuant to Section 302 of the Sarbanes-Oxley Act of 2002. |
|
32.1 |
|
Certification of Chief Executive Officer pursuant to Section 906 of the Sarbanes-Oxley Act of 2002. |
|
32.2 |
|
Certification of Chief Financial Officer pursuant to Section 906 of the Sarbanes-Oxley Act of 2002. |
|
101.INS |
|
XBRL Instance Document. |
|
101.SCH |
|
XBRL Taxonomy Extension Schema Document. |
|
101.PRE |
|
XBRL Taxonomy Presentation Linkbase Document. |
|
101.CAL |
|
XBRL Taxonomy Calculation Linkbase Document. |
|
101.LAB |
|
XBRL Taxonomy Label Linkbase Document. |
|
101.DEF |
|
XBRL Taxonomy Extension Definition Linkbase Document. |
|
(1) |
|
Included as Annex A of the Definitive Proxy Statement (No. 000-50781) filed on June 6, 2006 and incorporated herein by reference. |
|
(2) |
|
Included as Annex B of the Definitive Proxy Statement (No. 000-50781) filed on June 6, 2006 and incorporated herein by reference. |
|
(3) |
|
Included as Exhibit 3.2 to the Registrant’s Quarterly Report on Form 10-Q for the quarter ended September 30, 2007 filed on November 13, 2007 and incorporated herein by reference. |
|
(4) |
|
Included as Exhibit 3.3 to the Registrant’s Annual Report on Form 10-K for the year ended December 31, 2012 filed on March 18, 2013 and incorporated herein by reference. |
|
(5) |
|
Included as Exhibit 4.2 to the Registrant’s Registration Statement on Form S-1 (No. 333-114816) filed on April 23, 2004 and incorporated herein by reference. |
|
(6) |
|
Included as Exhibit 10.1 to the Registrant’s Current Report on Form 8-K filed on June 14, 2012 and incorporated herein by reference. |
|
(7) |
|
Included as Exhibit 10.1 to the Registrant’s Current Report on Form 8-K filed on March 5, 2010 and incorporated herein by reference. |
|
(8) |
|
Included as Exhibit 10.2 to the Registrant’s Current Report on Form 8-K filed on March 5, 2010 and incorporated herein by reference. |
|
(9) |
|
Included as Exhibit 10.1 to the Registrant’s Current Report on Form 8-K filed on January 31, 2014 and incorporated herein by reference. |
|
(10) |
|
Included as Exhibit 10.2 to the Registrant’s Current Report on Form 8-K filed on January 31, 2014 and incorporated herein by reference. |
|
(11) |
|
Included as Exhibit 10.10 to the Registrant’s Current Report on Form 8-K filed on July 5, 2006 and incorporated herein by reference. |
|
(12) |
|
Included as Exhibit 10.1 to the Registrant’s Current Report on Form 8-K filed on October 2, 2014 and incorporated herein by reference. |
|
(13) |
|
Included as Exhibit 10.2 to the Registrant’s Current Report on Form 8-K filed on October 2, 2014 and incorporated herein by reference. |
|
(14) |
|
Included as Exhibit 10.3 to the Registrant’s Current Report on Form 8-K filed on October 2, 2014 and incorporated herein by reference. |
|
(15) |
|
Included as Exhibit 10.4 to the Registrant’s Current Report on Form 8-K filed on October 2, 2014 and incorporated herein by reference. |
|
(16) |
|
Included as Exhibit 10.5 to the Registrant’s Current Report on Form 8-K filed on October 2, 2014 and incorporated herein by reference. |
|
(17) |
|
Included as Exhibit 10.15 to the Registrant’s Current Report on Form 8-K filed on July 7, 2009 and incorporated herein by reference. |
|
(18) |
|
Included as Exhibit 10.1 to the Registrant’s Current Report on Form 8-K filed on July 7, 2011 and incorporated herein by reference. |
|
(19) |
|
Included as Exhibit 10.1 to the Registrant’s Current Report on Form 8-K filed on October 7, 2011 and incorporated herein by reference. |
|
(20) |
|
Included as Exhibit 10.2 to the Registrant’s Current Report on Form 8-K filed on October 7, 2011 and incorporated herein by reference. |
|
(21) |
|
Included as Exhibit 10.1 to the Registrant’s Current Report on Form 8-K filed on October 21, 2011 and incorporated herein by reference. |
|
(22) |
|
Included as Exhibit 10.1 to the Registrant’s Current Report on Form 8-K filed on March 9, 2012 and incorporated herein by reference. |
|
(23) |
|
Included as Exhibit 10.1 to the Registrant’s Current Report on Form 8-K filed on October 24, 2012 and incorporated herein by reference. |
|
(24) |
|
Included as Exhibit 10.2 to the Registrant’s Current Report on Form 8-K filed on October 24, 2012 and incorporated herein by reference. |
|
(25) |
|
Included as Exhibit 10.1 to the Registrant’s Current Report on Form 8-K filed on May 30, 2013 and incorporated herein by reference. |
|
(26) |
|
Included as Exhibit 10.3 to the Registrant’s Current Report on Form 8-K filed on October 24, 2012 and incorporated herein by reference. |
|
(27) |
|
Included as Exhibit 10.4 to the Registrant’s Current Report on Form 8-K filed on October 24, 2012 and incorporated herein by reference. |
|
(28) |
|
Included as Exhibit 10.5 to the Registrant’s Current Report on Form 8-K filed on October 24, 2012 and incorporated herein by reference. |
|
(29) |
|
Included as Exhibit 10.6 to the Registrant’s Current Report on Form 8-K filed on October 24, 2012 and incorporated herein by reference. |
|
(30) |
|
Included as Exhibit 10.7 to the Registrant’s Current Report on Form 8-K filed on October 24, 2012 and incorporated herein by reference. |
|
(31) |
|
Included as Exhibit 10.8 to the Registrant’s Current Report on Form 8-K filed on October 24, 2012 and incorporated herein by reference. |
|
(32) |
|
Included as Exhibit 10.9 to the Registrant’s Current Report on Form 8-K filed on October 24, 2012 and incorporated herein by reference. |
|
(33) |
|
Included as Exhibit 10.10 to the Registrant’s Current Report on Form 8-K filed on October 24, 2012 and incorporated herein by reference. |
|
(34) |
|
Included as Exhibit 10.11 to the Registrant’s Current Report on Form 8-K filed on October 24, 2012 and incorporated herein by reference. |
|
(35) |
|
Included as Exhibit 10.2 to the Registrant’s Current Report on Form 8-K filed on May 23, 2013 and incorporated herein by reference. |
|
(36)* |
|
Included as Exhibit 10.1 to the Registrant’s Current Report on Form 8-K filed on June 6, 2013 and incorporated herein by reference. |
|
(37)* |
|
Included as Exhibit 4.4 to the Registrant’s Registration Statement on Form S-8 (No. 333-141814), filed on April 2, 2007 and incorporated herein by reference. |
|
(38)* |
|
Included as Exhibit 4.4 to the Registrant’s Registration Statement on Form S-8 (No. 333-152145), filed on July 3, 2008 and incorporated herein by reference. |
|
(39) |
|
Included as Exhibit 14 to the Registrant’s Quarterly Report on Form 10-QSB for the quarter ended June 30, 2004 filed on August 11, 2004 and incorporated herein by reference. |
* Constitutes a management contract or compensatory plan.
SIGNATURES
Pursuant to the requirements of Section 13 or 15(d) of the Securities Exchange Act of 1934, the Registrant has duly caused this report to be signed on its behalf by the undersigned, thereunto duly authorized.
|
|
|
|
Hill International, Inc. |
|
|
|
|
|
|
|
|
By: |
/s/ David L. Richter |
|
|
|
|
David L. Richter |
|
|
|
|
President and Chief Executive Officer |
|
|
|
|
Date: November 10, 2015 |
Pursuant to the requirements of the Securities and Exchange Act of 1934, this report has been signed by the following persons on behalf of the Registrant and in the capacities and on the dated indicated.
|
By: |
/s/ Irvin E. Richter |
|
By: |
/s/ Gary F. Mazzucco |
|
Irvin E. Richter |
|
Gary F. Mazzucco | ||
|
Chairman and Director |
|
Director | ||
|
Date: November 10, 2015 |
|
Date: November 10, 2015 | ||
|
|
|
| ||
|
|
|
| ||
|
By: |
/s/ David L. Richter |
|
By: |
/s/ Brian W. Clymer |
|
David L. Richter |
|
Brian W. Clymer | ||
|
President, Chief Executive Officer |
|
Director | ||
|
and Director |
|
Date: November 10, 2015 | ||
|
(Principal Executive Officer) |
|
| ||
|
Date: November 10, 2015 |
|
| ||
|
|
|
| ||
|
By: |
/s/ John Fanelli III |
|
By: |
/s/ Alan S. Fellheimer |
|
John Fanelli III |
|
Alan S. Fellheimer | ||
|
Senior Vice President and |
|
Director | ||
|
Chief Financial Officer |
|
Date: November 10, 2015 | ||
|
(Principal Financial Officer) |
|
| ||
|
Date: November 10, 2015 |
|
| ||
|
|
|
| ||
|
By: |
/s/ Camille S. Andrews |
|
By: |
/s/ Steven M. Kramer |
|
Camille S. Andrews |
|
Steven M. Kramer | ||
|
Director |
|
Director | ||
|
Date: November 10, 2015 |
|
Date: November 10, 2015 | ||
|
|
|
| ||
|
By: |
/s/ Ronald F. Emma |
|
By: |
/s/ Steven R. Curts |
|
Ronald F. Emma |
|
Steven R. Curts | ||
|
Senior Vice President and |
|
Director | ||
|
Chief Accounting Officer |
|
Date: November 10, 2015 | ||
|
(Principal Accounting Officer) |
|
| ||
|
Date: November 10, 2015 |
|
| ||
Schedule II
Hill International, Inc. and Subsidiaries
Valuation and Qualifying Accounts
(Allowance for Uncollectible Receivables – in thousands)
|
|
|
|
|
|
|
Other - |
|
Uncollectible |
|
|
| |||||
|
|
|
|
|
|
|
Allowance |
|
Receivables |
|
|
| |||||
|
|
|
Balance at |
|
Additions |
|
Acquired in |
|
Written off, |
|
Balance at |
| |||||
|
|
|
Beginning of |
|
Charged to |
|
Business |
|
Net of |
|
End of |
| |||||
|
|
|
Fiscal Year |
|
Earnings |
|
Combinations |
|
Recoveries |
|
Fiscal Year |
| |||||
|
|
|
(Restated) |
|
(Restated) |
|
|
|
|
|
(Restated) |
| |||||
|
Fiscal year ended December 31, 2014 |
|
$ |
66,856 |
|
$ |
(2,344 |
) |
$ |
161 |
|
$ |
(3,872 |
) |
$ |
60,801 |
|
|
|
|
|
|
|
|
|
|
|
|
|
| |||||
|
Fiscal year ended December 31, 2013 |
|
$ |
70,205 |
|
$ |
1,317 |
|
$ |
90 |
|
$ |
(4,756 |
) |
$ |
66,856 |
|
|
|
|
|
|
|
|
|
|
|
|
|
| |||||
|
Fiscal year ended December 31, 2012 |
|
$ |
9,181 |
|
$ |
63,146 |
|
$ |
— |
|
$ |
(2,122 |
) |
$ |
70,205 |
|