Attached files
Table of Contents
UNITED STATES
SECURITIES AND EXCHANGE COMMISSION
WASHINGTON, D.C. 20549
FORM 10-K
ANNUAL REPORT PURSUANT TO SECTION 13 OR 15(d) OF
THE SECURITIES EXCHANGE ACT OF 1934
For the fiscal year ended December 31, 2009
Commission file number 001-33961
HILL INTERNATIONAL, INC.
(Exact name of registrant as specified in its charter)
| Delaware | 20-0953973 | |
| State or other jurisdiction of incorporation or organization |
(I.R.S. Employer Identification No.) |
| 303 Lippincott Centre, Marlton, NJ | 08053 | |
| (Address of principal executive offices) | (Zip Code) | |
Registrant’s telephone number, including area code: (856) 810-6200
Securities registered pursuant to Section 12(b) of the Act:
| Title of each class |
Name of each exchange on which registered | |
| Common Stock, $.0001 par value | New York Stock Exchange |
Securities registered pursuant to Section 12(g) of the Exchange Act: None
Indicate by a check mark if the registrant is a well-known seasoned issuer, as defined in Rule 405 of the Securities Act. Yes ¨ No x
Indicate by check mark if the registrant is not required to file reports pursuant to Section 13 or Section 15(d) of the Act. Yes ¨ No x
Indicate by check mark whether the Registrant (1) has filed all reports required to be filed by Section 13 or 15(d) of the Securities Exchange Act of 1934 during the preceding 12 months, and (2) has been subject to such filing requirements for the past 90 days. Yes x No ¨
Indicate by a check mark whether the registrant has submitted electronically and posted on its corporate website, if any, every Interactive Data File required to be submitted and posted pursuant to Rule 405 of Regulation S-T (§229.405 of this chapter) during the preceding 12 months (or for such shorter period that the registrant was required to submit and post such files). Yes ¨ No ¨
Indicate by a check mark if disclosure of delinquent filers pursuant to Item 405 of Regulation S-K is not contained herein, and will not be contained, to the best of registrant’s knowledge in definitive proxy or information statements incorporated by reference in Part III of this Form 10-K or any amendment to this Form 10-K. ¨
Indicate by check mark whether the registrant is a large accelerated filer, an accelerated filer, a non-accelerated filer or a smaller reporting company. See definitions of “accelerated filer,” “large accelerated filer” and “smaller reporting company” in Rule 12b-2 of the Exchange Act (Check one):
Large Accelerated Filer ¨ Accelerated Filer x Non-Accelerated Filer ¨ Smaller reporting company ¨
Indicate by check mark whether the registrant is a shell company (as defined in Rule 12b-2 of the Exchange Act). Yes ¨ No x
The aggregate market value of shares of common stock held by non-affiliates based upon the closing sale price of the stock on the New York Stock Exchange on June 30, 2009 was approximately $93,236,000.
As of March 4, 2010, there were 39,295,529 shares of the Registrant’s Common Stock outstanding.
DOCUMENTS INCORPORATED BY REFERENCE
Portions of the proxy statement for the Annual Meeting of Shareholders of Hill International, Inc. are incorporated by reference into Part III of this Form 10-K.
Table of Contents
HILL INTERNATIONAL, INC. AND SUBSIDIARIES
INDEX TO FORM 10-K
| Item 1. |
4 | |||
| Item 1A. |
12 | |||
| Item 1B. |
17 | |||
| Item 2. |
17 | |||
| Item 3. |
18 | |||
| Item 4. |
19 | |||
| Item 5. |
20 | |||
| Item 6. |
22 | |||
| Item 7. |
Management’s Discussion and Analysis of Financial Condition and Results of Operations |
23 | ||
| Item 7A. |
40 | |||
| Item 8. |
41 | |||
| Item 9. |
Changes in and Disagreements with Accountants on Accounting and Financial Disclosure |
78 | ||
| Item 9A. |
78 | |||
| Item 9B. |
79 | |||
| Item 10. |
80 | |||
| Item 11. |
80 | |||
| Item 12. |
Security Ownership of Certain Beneficial Owners and Management and Related Stockholder Matters |
80 | ||
| Item 13. |
Certain Relationships and Related Transactions, and Director Independence |
81 | ||
| Item 14. |
81 | |||
| Item 15. |
82 | |||
2
Table of Contents
CAUTIONARY NOTE REGARDING FORWARD-LOOKING STATEMENTS
Certain statements contained in this Form 10-K may constitute “forward-looking statements” within the meaning of the Private Securities Litigation Reform Act of 1995 (“Reform Act”). We may also make forward-looking statements in other reports filed with the Securities and Exchange Commission, in materials delivered to stockholders and in press releases. Forward-looking statements provide current expectations of future events based on certain assumptions and include any statement that does not directly relate to any historical or current fact. Although we believe that the expectations, estimates and assumptions reflected in our forward-looking statements are reasonable, actual results could differ materially from those projected or assumed in any of our forward-looking statements. You can identify forward-looking statements by the use of terminology such as “may,” “will,” “anticipate,” “believe,” “estimate,” “expect,” “future,” “intend,” “plan,” “could,” “should,” “potential” or “continue” or the negative or other variations thereof, as well as other statements regarding matters that are not historical fact.
Those forward-looking statements may concern, among other things:
| • | The markets for our services |
| • | Projections of earnings, anticipated contractual obligations, capital expenditures, funding requirements or other financial items; |
| • | Statements concerning our plans, strategies and objectives for future operations; and |
| • | Statements regarding future economic conditions or performance. |
Important factors that could cause our actual results, performance and achievements, or industry results to differ materially from estimates or projections contained in our forward-looking statements include:
| • | Modifications and termination of client contracts; |
| • | Control and operational issues pertaining to business activities that we conduct pursuant to joint ventures with other parties; |
| • | Difficulties we may incur in implementing our acquisition strategy; |
| • | The need to retain and recruit key technical and management personnel; and |
| • | Unexpected adjustments and cancellations related to our backlog. |
Other factors that may affect our businesses, financial position or results of operations include:
| • | Special risks of international operations, including uncertain political and economic environments, acts of terrorism or war, potential incompatibilities with foreign joint venture partners, foreign currency fluctuations, civil disturbances and labor issues; and |
| • | Special risks of contracts with governmental entities, including the failure of applicable governing authorities to take necessary actions to secure or maintain funding for particular projects with us, the unilateral termination of contracts by the government and reimbursement obligations to the government for funds previously received. |
We assume no obligation to update or revise any forward-looking statements. In accordance with the Reform Act, Item 1A of this Report entitled “Risk Factors” contains cautionary statements that accompany those forward-looking statements. You should carefully review such cautionary statements as they identify certain important factors that could cause actual results to differ materially from those in the forward-looking statements and from historical trends. Those cautionary statements are not exclusive and are in addition to other factors discussed elsewhere in this Form 10-K, in our other filings with the Securities and Exchange Commission or in materials incorporated therein by reference.
3
Table of Contents
| Item 1. | Business. |
General
The Company was incorporated in Delaware in 2004 as Arpeggio Acquisition Corporation (“Arpeggio”), a specified purpose acquisition corporation. On June 28, 2006, Arpeggio merged with Hill International, Inc. (“Old Hill”), a Delaware corporation, and was the surviving entity of the merger. Old Hill was founded in 1976 by our current Chairman and Chief Executive Officer, Irvin E. Richter. Immediately following the merger, the stockholders of Old Hill owned approximately 63.6% of the total voting power of Arpeggio. The merger was accounted for as a reverse acquisition under U.S. generally accepted accounting principles pursuant to which Old Hill was considered to be the acquiring entity and Arpeggio was the acquired company for accounting purposes, accompanied by a recapitalization of Old Hill. Accordingly, the historical financial statements relate to the business of Old Hill and its consolidated subsidiaries. Following the merger, Arpeggio changed its name to “Hill International, Inc.” In this report, the terms “Company,” “we,” “us,” “our” or “Hill” refer to Hill International, Inc.
We provide fee-based project management and construction claims services to clients worldwide, but primarily in the United States, Europe, the Middle East, North Africa and Asia/Pacific. Our clients include the United States and other national governments and their agencies, state and local governments and their agencies and the private sector.
We are one of the leading firms in the world in both the project management and construction claims consulting businesses. We are a global company with approximately 2,400 personnel operating out of over 80 offices in more than 30 countries.
We compete for business based on reputation and past experience, including client requirements for substantial experience in similar projects and claims work. We have developed significant long-standing relationships which bring us repeat business and would be very difficult to replicate. We have an excellent reputation for developing and rewarding employees which allows us to attract and retain superior professionals. In addition, we believe there are high barriers to entry for new competitors especially in the project management market.
Reporting Segments
We operate through two segments: the Project Management Group and the Construction Claims Group. Reimbursable expenses are reflected in equal amounts in both total revenue and total direct expenses. Because these revenue/costs are subject to significant fluctuation from year to year, we measure the performance of many of our key operating metrics as a percentage of consulting fee revenue (“CFR”), as we believe that this is a better and more consistent measure of operating performance than total revenue. Throughout this report we have used CFR as the denominator in many of our ratios. The following table sets forth the amount and percentage of our CFR from our operations in each reporting segment for each of the past three fiscal years:
Consulting Fee Revenue by Segment
| 2009 | 2008 | 2007 | ||||||||||||||||
| (in thousands) | ||||||||||||||||||
| Project Management |
$ | 276,811 | 76.0 | % | $ | 247,326 | 74.1 | % | $ | 134,968 | 66.4 | % | ||||||
| Construction Claims |
87,199 | 24.0 | % | 86,556 | 25.9 | % | 68,150 | 33.6 | % | |||||||||
| Total |
$ | 364,010 | 100.0 | % | $ | 333,882 | 100.0 | % | $ | 203,118 | 100.0 | % | ||||||
Project Management
Our Project Management Group provides fee-based or “agency” construction management services to our clients leveraging our construction expertise to identify potential trouble, difficulties and sources of delay on a construction project before they develop into costly problems. Our services include program management,
4
Table of Contents
project management, construction management, project management oversight, troubled project turnaround, staff augmentation, estimating and cost management, project labor agreements and management consulting.
Our clients are typically billed a negotiated multiple of the actual direct cost of each consultant assigned to a project and we are reimbursed for our out-of-pocket expenses. We believe our fee-based consulting has significant advantages over traditional general contractors. Specifically, because we do not assume project completion risk, our fee-based model eliminates many of the risks typically associated with construction projects.
As construction managers, we have managed all phases of the construction process on behalf of project owners and developers, from pre-design through completion. Specific activities that we undertake as part of these services include: planning, scheduling, estimating, budgeting, design review, constructability analyses, value engineering, regulatory compliance, development of project procedures, procurement, project reporting, expediting, inspection, quality assurance/quality control, safety oversight, contract administration, change order processing, claims management, and on-site management of contractors, subcontractors and suppliers.
In its June 9, 2009, issue, Engineering News-Record ranked us as the eighth largest construction management firm and the ninth largest program management firm in the United States.
Construction Claims
Our Construction Claims Group advises clients in order to assist them in preventing or resolving claims and disputes based upon schedule delays, cost overruns and other problems on major construction projects worldwide.
We may be retained as a claims consultant at the onset of a project, during the course of a project or upon the completion of a project. We assist owners or contractors in adversarial situations as well as in situations where an amicable resolution is sought. Specific activities that we undertake as part of these services include claims preparation, analysis and review, litigation support, lender advisory services, cost/damages assessment, delay/disruption analysis, contract review and assessment, risk assessment, adjudication and expert witness testimony. Clients are typically billed based on an hourly rate for each consultant assigned to the project, and we are reimbursed for our out-of-pocket expenses. Our claims consulting clients include participants on all sides of a construction project, including owners, contractors, subcontractors, architects, engineers, attorneys, lenders and insurance companies.
Consulting Fee Revenue by Geographic Region
| 2009 | 2008 | 2007 | ||||||||||||||||
| (in thousands) | ||||||||||||||||||
| Americas |
$ | 75,468 | 20.7 | % | $ | 79,199 | 23.7 | % | $ | 70,264 | 34.6 | % | ||||||
| Europe |
107,193 | 29.4 | % | 110,416 | 33.1 | % | 48,257 | 23.7 | % | |||||||||
| Middle East |
126,749 | 34.8 | % | 116,254 | 34.8 | % | 76,144 | 37.5 | % | |||||||||
| North Africa |
47,482 | 13.1 | % | 20,693 | 6.2 | % | 1,787 | 0.9 | % | |||||||||
| Asia / Pacific |
7,118 | 2.0 | % | 7,320 | 2.2 | % | 6,666 | 3.3 | % | |||||||||
| Total |
$ | 364,010 | 100.0 | % | $ | 333,882 | 100.0 | % | $ | 203,118 | 100.0 | % | ||||||
Growth Organically and Through Acquisition
Our business has expanded through organic growth and the acquisition of a number of project management and claims consulting businesses. Since 1998, we have completed 16 acquisitions.
We believe that our industry includes a number of small regional companies in a highly fragmented market. We believe that we have significant experience and expertise in identifying, negotiating, completing and integrating acquisitions and view the acquisition of these smaller competitors as a key part of our growth strategy.
5
Table of Contents
On December 15, 2009, the Company acquired Boyken International, Inc. (“Boyken”). Boyken is a 40-employee project management, cost estimating and claims firm headquartered in Atlanta with additional offices in Orlando and Houston. Boyken significantly expands our resources and experience in the Southeastern U.S. and the Caribbean, and provides additional capabilities in the healthcare, higher education, hotel and governmental sectors. Total consideration amounted to approximately $2,236,000, consisting of 349,876 shares of the Company’s common stock. The Company acquired intangible assets and goodwill amounting to $1,493,000 and $1,296,000, respectively. The acquired intangible assets have a weighted average life of 7.7 years. The acquired intangible assets consist of a client related intangible of $1,063,000 with a ten-year life and a contract intangible of $430,000 with a two-year life. Goodwill, which is not deductible for income tax purposes, has been allocated to the Project Management segment. The results of operations of Boyken are not material to the consolidated results of the Company.
On December 31, 2009, we acquired TRS Consultants, Inc. (“TRS”). TRS is a 40-employee construction management firm headquartered in San Ramon, California with additional offices throughout Northern California. TRS increases our resources and experience in California and adds additional capabilities in the transportation and infrastructure sectors. Total consideration amounted to approximately $4,000,000, consisting of $2,500,000 in cash, 79,365 shares of the Company’s common stock with a fair value of $500,000 based on the closing price of the Company’s common stock on December 29, 2009, and contingent consideration amounting to $1,000,000. The contingent consideration will be paid in the event that TRS achieves operating profit of $1,000,000 in 2010, 2011 or 2012. The contingent consideration has been accrued and is included in other current liabilities in the consolidated balance sheet. In the event that TRS does not achieve the required level of earnings, the contingent consideration will be written off through a credit to the 2012 consolidated statement of earnings. The Company acquired intangible assets and goodwill amounting to $2,079,000 and $1,512,000, respectively. The acquired intangible assets have a weighted average life of 6.9 years. The acquired intangible assets consist of a client related intangible of $1,269,000 with a ten-year life and a contract intangible of $810,000 with a two-year life. Goodwill, which is expected to be deductible for income tax purposes, has been allocated to the Project Management segment. The results of operations of TRS are not material to the consolidated results of the Company.
During 2008, the Company purchased six companies for aggregate consideration amounting to $46,093,000, consisting of cash of $40,842,000, 82,436 shares of the Company’s common stock amounting to $1,300,000, and contingent consideration amounting to $2,872,000. The contingent consideration was settled in 2009 for cash of $1,138,000 and 132,479 shares of common stock aggregating $1,650,000. In addition, the sellers of one of the acquired companies had the opportunity to receive additional consideration of up to $8,413,000 under an earn-out arrangement payable at the rate of $4,364,000 in 2009 and $4,049,000 in 2010 based on the acquired company’s financial performance in 2008 and 2009. Based on that company’s performance in 2008, an earn-out payment of $1,526,000 was paid in 2009. The company’s financial results in 2009 did not achieve the level necessary to require an earn-out payment.
Clients
Our clients consist primarily of the United States and other national governments, state and local governments, and the private sector. In the fourth quarter of 2009, the Company refined its identification of client type and, accordingly, revised its allocation of revenue in the following table. The amounts for 2008 and 2007 have been changed to conform to the current year’s presentation.
6
Table of Contents
Consulting Fee Revenue by Client Type
| 2009 | 2008 | 2007 | ||||||||||||||||
| (Revised) | (Revised) | |||||||||||||||||
| (in thousands) | ||||||||||||||||||
| U.S. federal government |
$ | 45,493 | 12.5 | % | $ | 45,048 | 13.5 | % | $ | 30,696 | 15.1 | % | ||||||
| U.S. state and local governments |
39,003 | 10.7 | % | 34,876 | 10.4 | % | 31,242 | 15.4 | % | |||||||||
| Foreign governments |
104,764 | 28.8 | % | 61,561 | 18.4 | % | 28,001 | 13.8 | % | |||||||||
| Private sector |
174,750 | 47.9 | % | 192,397 | 57.7 | % | 113,179 | 55.7 | % | |||||||||
| Total |
$ | 364,010 | 100.0 | % | $ | 333,882 | 100.0 | % | $ | 203,118 | 100.0 | % | ||||||
Our five largest clients accounted for 13.1%, 9.4%, 4.0%, 2.9% and 1.7% of our CFR during fiscal year 2009. During fiscal year 2008 our five largest clients accounted for 9.8%, 4.5%, 2.2%, 1.3% and 1.2% of our CFR and during fiscal year 2007 our five largest clients accounted for 7.5%, 7.3%, 2.7%, 2.3% and 1.9% of our CFR.
Business Development
The process for acquiring business from each of these categories of clients is principally the same, by participating in a competitive request-for-proposal (“RFP”) process, with the primary difference among clients being that the process for public sector clients is significantly more formal and complex than for private sector clients as a result of government procurement rules and regulations that govern the public sector process.
Although a significant factor in our business development consists of our standing in our industry, including existing relationships and reputation based on performance on completed projects, our marketing department undertakes a variety of activities in order to expand our exposure to potential new clients. These activities include media relations, advertising, promotions, market sector initiatives and maintaining our website and related web marketing. Media relations include placing articles that feature us and our personnel in trade publications and other media outlets. Our promotions include arranging speaking engagements for our personnel, participation in trade shows and other promotional activities. Market sector initiatives are designed to broaden our exposure to specific sectors of the construction industry, such as, for example, participating in or organizing industry seminars targeted to one sector of an industry.
For the year ended December 31, 2009, CFR from U.S. federal government contracts represented approximately 12.5% of our total CFR. Doing business with governments, including the U.S. federal government, is complex and requires the ability to comply with intricate regulations and satisfy periodic audits. We believe that the ability to understand these requirements and to successfully conduct business with government agencies is a barrier to entry for smaller, less experienced competitors. Most government contracts, including our contracts with the federal government, are subject to termination by the government, to government audits and to continued appropriations.
We are required from time to time to obtain various permits, licenses and approvals in order to conduct our business in some of the jurisdictions where we operate. The inability to obtain any particular permits, licenses or governmental approvals would not have a material effect on our business. Our business of providing construction management and construction claims services are not subject to significant regulation by state, federal or foreign governments.
Contracts
The price provisions of our contracts can be grouped into three broad categories: cost-plus, time and materials, and fixed-price.
7
Table of Contents
Cost-plus contracts provide for reimbursement of our costs and overhead plus a predetermined fee. Under some cost-plus contracts, our fee may be based partially on quality, schedule and other performance factors.
We also enter into contracts whereby we bill our clients monthly at hourly billing rates. The hourly billing rates are determined by contract terms. For governmental clients, the hourly rates are generally calculated as salary costs plus overhead costs plus a negotiated profit percentage. For commercial clients, the hourly rate can be taken from a standard fee schedule by staff classification or it can be a discount from this schedule. In some cases, primarily for foreign work, a fixed monthly staff rate is negotiated rather than an hourly rate. This monthly rate is a build-up of staffing costs plus overhead and a profit. Hill accounts for these contracts on a time-and-materials method, recognizing revenue as costs are incurred.
Fixed price contracts are accounted for using the “percentage-of-completion” method, wherein revenue is recognized as costs are incurred. Due to our recent acquisitions, this type of contract is having an increasing role in our business.
Backlog
We believe a strong indicator of our future performance is our backlog of uncompleted projects under contract or awarded. Our backlog represents management’s estimate of the amount of contracts and awards in hand that we expect to result in future consulting fee revenue. Project management backlog is evaluated by management, on a project-by-project basis, and is reported for each period shown based upon the binding nature of the underlying contract, commitment or letter of intent, and other factors, including the economic, financial and regulatory viability of the project and the likelihood of the contract being extended, renewed or cancelled. Construction claims backlog is based largely on management’s estimates of future revenue based on known construction claims assignments and historical results for new work. Because a significant number of construction claims may be awarded and completed within the same period, our actual construction claims revenue has historically exceeded backlog by a significant amount.
Our backlog is important to us in anticipating and planning for our operational needs. Backlog is not a measure defined in U.S. generally accepted accounting principles, and our methodology for determining backlog may not be comparable to the methodology used by other companies in determining their backlog.
At December 31, 2009, our backlog was approximately $620,000,000 compared to approximately $667,000,000 at December 31, 2008. We estimate that approximately $282,000,000, or 45.5%, of the backlog at December 31, 2009 will be recognized during our 2010 fiscal year.
The schedule below includes backlog under two categories: (1) contracts for which work authorizations have been or are expected to be received and (2) contracts awarded to us where some or all of the work has not yet been authorized. As of December 31, 2009, approximately $468,000,000, or 75.5%, of our backlog was in category (1) and approximately $152,000,000 or 24.5%, of our backlog was in category (2). We do not track whether contracts included in our backlog are fully funded, incrementally funded, or unfunded.
Included in category (2) of our backlog is the maximum amount of all indefinite delivery/indefinite quantity (“ID/IQ”), or task order, contracts, or a lesser amount if we do not reasonably expect to be issued task orders for the maximum amount of such contracts. Also included in category (2) of our backlog is the amount of anticipated revenue in option years beyond the base term of our contracts if we reasonably expect our clients to exercise such option years. Although backlog reflects business that we consider to be firm, cancellations or scope adjustments may occur. Further, substantially all of our contracts with our clients may be terminated at will, in which case the client would only be obligated to us for services provided through the termination date. The impact of terminations and modifications on our realization of revenue from our backlog has not been significant. Furthermore, reductions of our backlog as a result of contract terminations and modifications may be more than offset by additions to the backlog.
8
Table of Contents
We adjust backlog to reflect project cancellations, deferrals and revisions in scope and cost (both upward and downward) known at the reporting date; however, future contract modifications or cancellations may increase or reduce backlog and future revenue.
| Total Backlog | 12 Month Backlog | |||||||||||
| (in thousands) | ||||||||||||
| As of December 31, 2009: |
||||||||||||
| Project Management |
$ | 583,000 | 94.0 | % | $ | 249,000 | 88.3 | % | ||||
| Construction Claims |
37,000 | 6.0 | 33,000 | 11.7 | ||||||||
| Total |
$ | 620,000 | 100.0 | % | $ | 282,000 | 100.0 | % | ||||
| As of September 30, 2009: |
||||||||||||
| Project Management |
$ | 563,000 | 94.3 | % | $ | 245,000 | 88.8 | % | ||||
| Construction Claims |
34,000 | 5.7 | 31,000 | 11.2 | ||||||||
| Total |
$ | 597,000 | 100.0 | % | $ | 276,000 | 100.0 | % | ||||
| As of December 31,2008: |
||||||||||||
| Project Management |
$ | 623,000 | 93.4 | % | $ | 236,000 | 87.7 | % | ||||
| Construction Claims |
44,000 | 6.6 | 33,000 | 12.3 | ||||||||
| Total |
$ | 667,000 | 100.0 | % | $ | 269,000 | 100.0 | % | ||||
Competition
The project management and claims consulting industries are highly competitive. We compete for contracts, primarily on the basis of technical capability, with numerous entities, including design or engineering firms, general contractors, other “pure” construction management companies, other claims consulting firms, the “Big Four” and other accounting firms, management consulting firms and other entities. Compared to us, many of these competitors are larger, well-established companies that have broader geographic scope and greater financial and other resources. During 2009, some of our largest project management competitors included: AECOM Technology Corp.; Bovis Lend Lease, Inc.; Jacobs Engineering Group, Inc.; Parsons Brinckerhoff, Inc.; Tishman Construction Corp.; Turner Construction Corp.; and URS Corp. Some of our largest claims consulting competitors last year included: Exponent, Inc.; FTI Consulting, Inc.; and Navigant Consulting, Inc.
Insurance
We maintain insurance covering professional liability, as well as for claims involving bodily injury and property damage. We have historically enjoyed a favorable loss ratio in all lines of insurance and our management considers our present limits of liability, deductibles and reserves to be adequate. We endeavor to reduce or eliminate risk through the use of quality assurance/control, risk management, workplace safety and similar methods to eliminate or reduce the risk of losses on a project. Although our actual rates have decreased, we have experienced and expect to continue to experience increases in the dollar amount of our insurance premiums because of the increase in our revenue.
9
Table of Contents
Management
We are led by an experienced management team with significant experience in the construction industry. Additional information about our executive officers is set forth below.
Executive Officers
| Name |
Age | Position | ||
| Irvin E. Richter |
65 | Chairman of the Board of Directors and Chief Executive Officer | ||
| David L. Richter |
43 | President and Chief Operating Officer, Director | ||
| Raouf S. Ghali |
48 | President, Project Management Group (International) | ||
| Thomas J. Spearing III |
43 | President, Project Management Group (Americas) | ||
| Frederic Z. Samelian |
62 | President, Construction Claims Group | ||
| John Fanelli III |
55 | Senior Vice President and Chief Financial Officer | ||
| Ronald F. Emma |
58 | Senior Vice President and Chief Accounting Officer | ||
| William H. Dengler, Jr. |
43 | Senior Vice President and General Counsel | ||
| Catherine H. Emma |
50 | Senior Vice President and Chief Administrative Officer | ||
| Michael J. Petrisko |
44 | Senior Vice President and Chief Information Officer |
IRVIN E. RICHTER has been Chairman of our Board of Directors since 1985 and he has been Chief Executive Officer and a member of our Board of Directors since he founded the company in 1976. In 2002, Mr. Richter was selected as a Fellow by the Construction Management Association of America (“CMAA”) for his contributions to the construction management industry. He is a member of the World Presidents’ Organization and the Construction Industry Round Table. He is the author of several books including Handbook of Construction Law & Claims and International Construction Claims: Avoiding and Resolving Disputes. He has served or does serve on a number of Boards of Directors, including Rutgers University, Temple University Hospital, CMAA, incNETWORKS, Inc., Energy Storage & Power and Proton Therapy, Inc. Mr. Richter holds a B.A. in government from Wesleyan University and a J.D. from Rutgers University School of Law at Camden, and he has been named a Distinguished Alumnus at both schools.
DAVID L. RICHTER has been President and Chief Operating Officer since April 2004, and he has been a member of our Board of Directors since February 1998. Prior to his current position, he was President of our Project Management Group from April 2001 to March 2004. Before that, Mr. Richter was Senior Vice President, General Counsel and Secretary from August 1999 to March 2001 and Vice President, General Counsel and Secretary from April 1995 to August 1999. Prior to joining us, he was an attorney with the New York City law firm of Weil, Gotshal & Manges LLP from 1992 to 1995. Mr. Richter is a member of the Young Presidents’ Organization, a member of the Board of Trustees of the Southern New Jersey Development Council and served on the Board of Directors of the CMAA from 2001 to 2007. He earned a B.S. in management, a B.S.E. in civil engineering and a J.D. from the University of Pennsylvania. Mr. Richter is a son of Irvin E. Richter.
THOMAS J. SPEARING III has been President of our Project Management Group (Americas) since April 2009. Before that, he was Hill’s Senior Vice President and Chief Strategy Officer, from September 2007 to March 2009. Prior to joining Hill, Mr. Spearing worked for more than ten years with STV Group, Inc., most recently as Principal-in-Charge of its western region. Before that, Mr. Spearing was a Vice President of business development with Hill. Mr. Spearing earned his B.B.A. in computer and information science from Temple University, his B.S. in construction management and his B.S. in civil engineering from Spring Garden College, and his M.S. in management from Rosemont College. He is an active member of the American Public Transportation Association, the Women’s Transportation Seminar, the New Jersey Business & Industry Association, the Southern New Jersey Development Council, and the New Jersey Alliance for Action, among others.
RAOUF S. GHALI has been President of our Project Management Group (International) since January 2005. Before that, he was Senior Vice President in charge of project management operations in Europe and the Middle East from June 2001 to December 2004. Before that, Mr. Ghali was a Vice President with us from September 1993 to May 2001. Prior to joining us, he worked for Walt Disney Imagineering from 1988 to 1993.
10
Table of Contents
Mr. Ghali has a B.S. degree in business administration and economics and an M.S. in business organizational management from the University of LaVerne.
FREDERIC Z. SAMELIAN has been President of our Construction Claims Group since January 2005. Before that, he was a Senior Vice President with us from March 2003 until December 2004. Before that, Mr. Samelian was President of Conex International, Inc., a construction dispute resolution firm, from March 2002 to March 2003 and from April 2000 to February 2001, an Executive Director with Greyhawk North America, Inc., a construction management and consulting firm, from March 2001 to February 2002, and a Director with PricewaterhouseCoopers LLP from September 1998 to March 2000. Before that, he had worked with Hill from 1983 to August 1998. He served as Hill’s President and Chief Operating Officer from September 1996 to August 1998. Mr. Samelian has a B.A. in international affairs from George Washington University and an M.B.A. from Southern Illinois University. He is a Project Management Professional certified by the Project Management Institute and he is a licensed General Building Contractor in California.
JOHN FANELLI III has been Senior Vice President and Chief Financial Officer since September 2006. Before that, Mr. Fanelli was Vice President and Chief Accounting Officer of CDI Corp. from June 2005 until June 2006, and he was Vice President and Corporate Controller of CDI Corporation (a subsidiary of CDI Corp.) from October 2003 until June 2006. CDI Corp. is a New York Stock Exchange-traded professional services and outsourcing firm based in Philadelphia with expertise in engineering, technical services and information technology. From February 2003 until October 2003, Mr. Fanelli was a financial consultant to Berwind Corporation, an investment management company based in Philadelphia which owns a diversified portfolio of manufacturing and service businesses and real estate. Before that, Mr. Fanelli was employed for 18 years by Hunt Corporation, then a New York Stock Exchange-traded manufacturer and marketer of office products. At Hunt, he served as Vice President and Chief Accounting Officer from 1995 until February 2003, and before that as Director of Budgeting, Financial Analysis and Control, from 1985 to 1995. Before that, for eight years Mr. Fanelli was employed with Coopers & Lybrand in various accounting and auditing positions. Mr. Fanelli earned his B.S. in accounting from LaSalle University, and he is a Certified Public Accountant in Pennsylvania.
RONALD F. EMMA has been Senior Vice President and Chief Accounting Officer since January 2007. Mr. Emma had been Hill’s Senior Vice President of Finance from August 1999 to January 2007. Before that, he was Hill’s Vice President of Finance since 1979. Before joining Hill, he was Assistant Controller of General Energy Resources, Inc., a mechanical contracting firm, and prior to that was a Staff Accountant with the accounting firm of Haskins & Sells. Mr. Emma has a B.S. in accounting from St. Joseph’s University and is a Certified Public Accountant in New Jersey.
WILLIAM H. DENGLER, JR. has been Senior Vice President and General Counsel since March 2007. Mr. Dengler was previously Vice President and General Counsel from January 2002 to March 2007, and Corporate Counsel from April 2001 to December 2001. Mr. Dengler also serves as corporate secretary to Hill and its subsidiaries. Prior to joining Hill, Mr. Dengler served as Assistant Counsel to former New Jersey Governors Donald DiFrancesco and Christine Todd Whitman from September 1999 to April 2001. Mr. Dengler earned his B.A. in political science from Western Maryland College and his J.D. from Rutgers University School of Law at Camden. He is licensed to practice law in New Jersey, as well as before the U.S. Court of Appeals for the Third Circuit and the U.S. Supreme Court.
CATHERINE H. EMMA has been Senior Vice President and Chief Administrative Officer since January 2007. Ms. Emma had been Vice President and Chief Administrative Officer from August 2005 to January 2007. Before that, she served as Hill’s Vice President of Human Resources and Administration. Ms. Emma has been with Hill since 1982. She is certified by the Society for Human Resource Management as a Professional in Human Resources (PHR) and has held professional memberships with Tri-State Human Resources, the Society for Human Resource Management and the BNA Human Resources Personnel Policies Forum. Ms. Emma is the wife of Ronald F. Emma.
MICHAEL J. PETRISKO has been Senior Vice President and Chief Information Officer since January 2009. Before that, he was our Vice President and Chief Information Officer from May 2007 to December 2008.
11
Table of Contents
Before that, Mr. Petrisko was Director of Global IT Operations for AECOM Technology Corp. from September 2005 to May 2007 and Vice President and Chief Information Officer for DMJM Harris, Inc., a subsidiary of AECOM Technology Corp., a global architecture, engineering and construction management firm, from January 2002 to September 2005. Before that he was Director of Technical Services for Foster Wheeler Corp., an engineering and construction services firm, from April 1999 to January 2002. Mr. Petrisko studied management information technology at Thomas Edison State College and he is a member of the New Jersey Society of Information Management.
Employees
At February 24, 2010, we had 2,356 personnel. Of these individuals, 1,717 worked in our Project Management Group, 434 worked in our Construction Claims Group and 205 worked in our Corporate Group. Our personnel at February 24, 2010 included 2,001 full-time employees, 151 part-time employees and 204 independent contractors. Our future success will depend significantly on our ability to attract, retain and motivate highly qualified personnel. We are not a party to any collective bargaining agreements and we have not experienced any strikes or work stoppages. We consider our relationship with our employees to be satisfactory.
Access to Company Information
We electronically file our Annual Report on Form 10-K, Quarterly Reports on Form 10-Q, Current Reports on Form 8-K and all amendments to those reports with the Securities and Exchange Commission (the “SEC”). The public may read and copy any of the reports that are filed with the SEC at the SEC’s Public Reference Room at 100 F Street, N.E., Washington, DC 20549. The public may obtain information on the operation of the Public Reference Room by calling the SEC at (800) SEC-0330. The SEC maintains an Internet site (www.sec.gov) that contains periodic reports, proxy statements, information statements and other information regarding issuers that file electronically.
We make available, free of charge, through our website or by responding to requests addressed to our Legal Department, our Annual Report on Form 10-K, Quarterly Reports on Form 10-Q, Current Reports on Form 8-K and all amendments to those reports filed by us with the SEC pursuant to Sections 13(a) and 15(d) of the Securities Exchange Act, as amended. These reports are available as soon as practicable after such material is filed with or furnished to the SEC. Our primary website is www.hillintl.com. We post the charters for our audit, compensation and governance and nominating committees, corporate governance principles and code of ethics on our website. The information contained on our website, or on other websites linked to our website, is not part of this document.
| Item 1A. | Risk Factors |
Our business involves a number of risks, some of which are beyond our control. The risks and uncertainties described below are not the only ones we face. Such factors could have a significant impact on our business, operating results and financial condition. We believe the most significant of these risks and uncertainties are as follows:
Recent global economic trends could adversely affect our business, liquidity and financial results.
Recent global economic conditions, including disruption of financial markets, could adversely affect our business and results of operations, primarily by limiting our access to credit and disrupting our clients’ businesses. The reduction in financial institutions’ willingness or ability to lend has increased the cost of capital and reduced the availability of credit. Although we currently believe that the financial institutions with whom we do business, will be able to fulfill their commitments to us, there is no assurance that those institutions will be able to continue to do so, which could have a material adverse impact on our business. In addition, continuation or worsening of general market conditions in the United States or other national economies important to our businesses may adversely affect our clients’ level of spending, ability to obtain financing, and ability to make
12
Table of Contents
timely payments to us for our services, which could require us to increase our allowance for doubtful accounts, negatively impact our days sales outstanding and adversely affect our results of operations.
We depend on long-term government contracts, many of which are funded on an annual basis. If appropriations are not made in subsequent years of a multiple-year contract, we will not realize all of our potential revenue and profit from that project.
A significant portion of our consulting fee revenue is derived from contracts with federal, state, local and foreign governments. During 2009, 2008 and 2007, approximately 52.0%, 42.4%, and 44.3%, respectively, of our consulting fee revenue were derived from such contracts.
Most government contracts are subject to the continuing availability of legislative appropriation. Legislatures typically appropriate funds for a given program on a year-by-year basis, even though contract performance may take more than one year. As a result, at the beginning of a program, the related contract is only partially funded, and additional funding is normally committed only as appropriations are made in each subsequent fiscal year. These appropriations and the timing of payment of appropriated amounts may be influenced by, among other things, the state of the economy, competing priorities for appropriation, the timing and amount of tax receipts and the overall level of government expenditures. If appropriations are not made in subsequent years on government contracts, then we will not realize all of our potential revenue and profit from those contracts.
Because we depend on government contracts for a significant portion of our consulting fee revenue, our inability to win profitable government contracts could harm our operations and adversely affect our net earnings.
In 2009, U.S. federal government contracts and state and local government contracts contributed approximately 12.5% and 10.7%, respectively, of our total consulting fee revenue, and foreign government contracts contributed approximately 28.8% of our total consulting fee revenue. Our inability to win profitable government contracts could harm our operations and adversely affect our net earnings. Government contracts are typically awarded through a heavily regulated procurement process. Some government contracts are awarded to multiple competitors, causing increases in overall competition and pricing pressure. In turn, the competition and pricing pressure may require us to make sustained post-award efforts to reduce costs under these contracts. If we are not successful in reducing the amount of costs we anticipate, our profitability on these contracts may be negatively impacted. Also, some of our federal government contracts require U.S. government security clearances. If we or certain of our personnel were to lose these security clearances, our ability to continue performance of these contracts or to win new contracts requiring a clearance may be negatively impacted.
We depend on contracts that may be terminated by our clients on short notice, which may affect our ability to recognize all of our potential revenue and profit from the project.
Substantially all of our contracts are subject to termination by the client either at its convenience or upon our default. If one of our clients terminates a contract at its convenience, then we typically are able to recover only costs incurred or committed, settlement expenses and profit on work completed prior to termination, which could prevent us from recognizing all of our potential revenue and profit from that contract. If one of our clients terminates the contract due to our default, we could be liable for excess costs incurred by the client in re-procuring services from another source, as well as other costs.
Our contracts with governmental agencies are subject to audit, which could result in adjustments to reimbursable contract costs or, if we are charged with wrongdoing, possible temporary or permanent suspension from participating in government programs.
Our books and records are subject to audit by the various governmental agencies we serve and by their representatives. These audits can result in adjustments to reimbursable contract costs and allocated overhead. In
13
Table of Contents
addition, if as a result of an audit, we or one of our subsidiaries is charged with wrongdoing or the government agency determines that we or one of our subsidiaries is otherwise no longer eligible for federal contracts, then we or, as applicable, that subsidiary, could be temporarily suspended or, in the event of convictions or civil judgments, could be prohibited from bidding on and receiving future government contracts for a period of time. Furthermore, as a U.S. government contractor, we are subject to an increased risk of investigations, criminal prosecution, civil fraud, whistleblower lawsuits and other legal actions and liabilities, the results of which could have a material adverse effect on our operations.
We submit change orders to our clients for work we perform beyond the scope of some of our contracts. If our clients do not approve these change orders, our net earnings could be adversely impacted.
We typically submit change orders under some of our contracts for payment for work performed beyond the initial contractual requirements. The clients may not approve or may contest these change orders and we cannot assure you that these claims will be approved in whole, in part or at all. If these claims are not approved, our net earnings could be adversely impacted.
Because our backlog of uncompleted projects under contract or awarded is subject to unexpected adjustments and cancellations, including the amount, if any, of future appropriations by the applicable contracting government agency, it is an uncertain indicator of our future revenue and profits.
At December 31, 2009, our backlog of uncompleted projects under contract or awarded was approximately $620,000,000. We cannot assure you that the revenue attributed to uncompleted projects under contract will be realized or, if realized, will result in profits.
Many projects may remain in our backlog for an extended period of time because of the size or long-term nature of the contract. In addition, from time to time projects are scaled back or cancelled. These types of backlog reductions adversely affect the revenue and profit that we ultimately receive. Included in our backlog is the maximum amount of all indefinite delivery/indefinite quantity (“ID/IQ”), or task order, contracts, or a lesser amount if we do not reasonably expect to be issued task orders for the maximum amount of such contracts. We cannot provide any assurance that we will in fact be awarded the maximum amount of such contracts.
We depend on the continued services of certain executive officers. We cannot assure you that we will be able to retain the services of these individuals.
We are dependent upon the efforts and service of certain executive officers, particularly Irvin E. Richter, our Chairman and Chief Executive Officer, and David L. Richter, our President and Chief Operating Officer, because of their knowledge, experience, skills and relationships with major clients and other members of our management team. Irvin E. Richter has served as our Chief Executive Officer since 1976. We have employment agreements with these individuals which contain non-competition covenants which survive their actual term of employment. If we lost the services of one or both of these individuals for any reason, that could have an adverse effect on our operations.
Our ability to grow and compete in our industry will be harmed if we do not retain the continued service of our key management, sales and technical personnel and identify, hire and retain additional qualified personnel.
There is intense competition for qualified management, sales and technical personnel in the industry sectors in which we compete. We may not be able to continue to attract and retain qualified personnel who are necessary for the development of our business or to replace qualified personnel. Any growth we experience is expected to place increased demands on our resources and will likely require the addition of personnel and the development of additional expertise by existing personnel. Also, some of our personnel hold security clearance levels required to obtain government projects and, if we were to lose some or all of these personnel, they may be difficult to replace. Loss of the services of, or failure to recruit, key personnel could limit our ability to complete existing projects successfully and to compete for new projects.
14
Table of Contents
Our dependence on subcontractors, partners and specialists could adversely affect our business.
We rely on third-party subcontractors as well as third-party strategic partners and specialists to complete our projects. To the extent that we cannot engage such subcontractors, partners or specialists or cannot engage them on a competitive basis, our ability to complete a project in a timely fashion or at a profit may be impaired. If we are unable to engage appropriate strategic partners or specialists in some instances, we could lose the ability to win some contracts. In addition, if a subcontractor or specialist is unable to deliver its services according to the negotiated terms for any reason, including the deterioration of its financial condition or over-commitment of its resources, we may be required to purchase the services from another source at a higher price. This may reduce the profit to be realized or result in a loss on a project for which the services were needed.
If our partners fail to perform their contractual obligations on a project, we could be exposed to legal liability, loss of reputation or reduced profits.
We sometimes enter into joint venture agreements and other contractual arrangements with outside partners to jointly bid on and execute a particular project. The success of these joint projects depends on the satisfactory performance of the contractual obligations of our partners. If any of our partners fails to satisfactorily perform its contractual obligations, we may be required to make additional investments and provide additional services to complete the project. If we are unable to adequately address our partner’s performance issues, then our client could terminate the joint project, exposing us to legal liability, loss of reputation or reduced profits.
Our services expose us to significant risks of liability and our insurance policies may not provide adequate coverage.
Our services involve significant risks of professional and other liabilities that may substantially exceed the fees that we derive from our services. In addition, we sometimes contractually assume liability under indemnification agreements. We cannot predict the magnitude of potential liabilities from the operation of our business.
We currently maintain comprehensive general liability, umbrella and professional liability insurance policies. Professional liability policies are “claims made” policies. Thus, only claims made during the term of the policy are covered. Additionally, our insurance policies may not protect us against potential liability due to various exclusions and retentions. Partially or completely uninsured claims, if successful and of significant magnitude, could have a material adverse affect on our business.
International operations expose us to legal, political and economic risks in different countries and currency exchange rate fluctuations could adversely affect our financial results.
Our international operations contributed 80.0%, 77.7% and 67.6% of our consulting fee revenue for 2009, 2008 and 2007, respectively. We expect the percentage of revenue attributable to our international operations to continue to increase. There are risks inherent in doing business internationally, including:
| • | Lack of developed legal systems to enforce contractual rights; |
| • | Greater risk of uncollectible accounts and longer collection cycles; |
| • | Currency exchange rate fluctuations; |
| • | Restrictions on the transfer of cash from foreign countries; |
| • | Imposition of governmental controls; |
| • | Political and economic instability; |
| • | Changes in U.S. and other national government policies affecting the markets for our services; |
| • | Changes in regulatory practices, tariffs and taxes; |
15
Table of Contents
| • | Potential non-compliance with a wide variety of non-U.S. laws and regulations; and |
| • | General economic and political conditions in these foreign markets. |
Any of these factors could have a material adverse effect on our business, results of operations, financial condition or cash flows.
Changes to the laws of the foreign countries in which we operate may adversely affect our international operations.
We have contracts to perform services for projects located in a number of foreign countries, including, among others, Canada, Mexico, the United Kingdom, Spain, Germany, Poland, Latvia, Romania, Serbia, Croatia, Greece, Turkey, Kazakhstan, Azerbaijan, Egypt, Libya, Iraq, Afghanistan, Kuwait, Bahrain, Qatar, Saudi Arabia, the United Arab Emirates, China, Singapore, Malaysia, Vietnam, South Korea and Australia. We expect to have additional similar contracts in the future. In addition, we have offices or operations in over 30 foreign countries. The laws and regulations in the countries in which we are working on projects or in which we have offices might change. Such changes could have a material adverse effect on our business.
Our business sometimes requires our employees to travel to and work in high security risk countries, which may result in employee injury, repatriation costs or other unforeseen costs.
Many of our employees often travel to and work in high security risk countries around the world that are undergoing or that may undergo political, social and economic upheavals resulting in war, civil unrest, criminal activity or acts of terrorism. For example, we have employees working in Iraq, a high security risk country with substantial civil unrest and acts of terrorism. As a result, we may be subject to costs related to employee injury, repatriation or other unforeseen circumstances.
We have acquired and may continue to acquire businesses as strategic opportunities arise and may be unable to realize the anticipated benefits of those acquisitions.
Since 1998, we have acquired 16 businesses and our strategy is to continue to expand and diversify our operations with additional acquisitions as strategic opportunities arise. Some of the risks that may affect our ability to realize any anticipated benefits from businesses that we acquire include:
| • | Unexpected losses of key personnel or clients of the acquired business; |
| • | Difficulties arising from the increasing scope, geographic diversity and complexity of our operations; |
| • | Diversion of management’s attention from other business concerns; and |
| • | Adverse effects on existing business relationships with clients. |
In addition, managing the growth of our operations will require us to continually increase and improve our operational, financial and human resources management and our internal systems and controls. If we are unable to manage growth effectively or to successfully integrate acquisitions, that could have a material adverse effect on our business.
We cannot be certain that we will be able to raise capital or obtain debt financing to execute future acquisitions or to meet required capital needs.
We are currently party to a revolving credit agreement to assist in funding working capital needs and for potential future acquisitions. This agreement contains certain financial covenants with respect to minimum net worth, total funded debt to EBITDA ratio, fixed charge coverage ratio, billed accounts receivable to senior secured indebtedness ratio, as well as other covenants. If our operating results are not as positive as we expect, that could cause us to be in default of these covenants. In addition, our current revolving credit agreement may
16
Table of Contents
not provide us with sufficient credit to meet all of the future financial needs of our business. Although under certain circumstances, we may be able to increase availability by an additional $50,000,000, there is no guarantee that we could increase the availability under our current revolving credit agreement or obtain alternative debt or equity financing on terms that would be acceptable to us, or at all.
The market price for our common stock could be volatile and could decline, resulting in a substantial or complete loss of your investment.
The stock markets, including the New York Stock Exchange on which we list our common stock, have experienced significant price and volume fluctuations. As a result, the market price of our common stock could be similarly volatile, and investors in our common stock may experience a decrease in the value of their shares, including decreases unrelated to our operating performance or prospects. The price of our common stock could be subject to wide fluctuations in response to a number of factors, including:
| • | Our operating performance and the performance of other similar companies; |
| • | Actual or anticipated differences in our operating results; |
| • | Changes in our revenue or earnings estimates or recommendations by securities analysts; |
| • | Publication of research reports about us or our industry by securities analysts; |
| • | Additions and departures of key personnel; |
| • | Speculation in the press or investment community; |
| • | Actions by institutional shareholders; |
| • | Changes in accounting principles; |
| • | Terrorist acts; and |
| • | General market conditions, including factors unrelated to our performance. |
Future sales of our common and preferred stock may depress the price of our common stock.
As of March 4, 2010, there were 39,295,529 shares of our common stock outstanding. An additional 2,039,395 shares of our common stock may be issued upon the exercise of options held by employees, management and directors. In connection with earn-out provisions of the merger agreement with Arpeggio, 1,000,000 shares will be issued in the second quarter of 2010. We also have the authority to issue up to 1,000,000 shares of preferred stock, and additional options and warrants to purchase shares of our common stock without stockholder approval. Sales of a substantial number of these shares in the public market could decrease the market price of our common stock. In addition, the perception that such sales might occur may cause the market price of our common stock to decline. Future issuances or sales of our common stock could have an adverse effect on the market price of our common stock.
| Item 1B. | Unresolved Staff Comments |
None.
| Item 2. | Properties |
Our executive and operating offices are located at 303 Lippincott Centre, Marlton, New Jersey 08053. We lease all of our office space and do not own any real property. The telephone number at our executive office is (856) 810-6200. In addition to our executive offices, we have over 80 operating leases for office facilities throughout the world. Due to acquisition and growth we may have more than one operating lease in the cities in which we are located. Additional space may be required as our business expands geographically, but we believe we will be able to obtain suitable space as needed.
17
Table of Contents
Following are our principal worldwide office locations:
| Americas |
Europe |
Middle East | ||
| Atlanta, GA |
Ankara, Turkey | Abu Dhabi, UAE | ||
| Baltimore, MD |
Athens, Greece | Ajman, UAE | ||
| Bellevue, WA |
Baku, Azerbaijan | Baghdad, Iraq | ||
| Bensalem, PA |
Barcelona, Spain | Doha, Qatar | ||
| Birmingham, AL |
Belgrade, Serbia | Dubai, UAE | ||
| Boston, MA |
Birmingham, UK | Jeddah, Saudi Arabia | ||
| Cancun, Mexico |
Bristol, UK | Manama, Bahrain | ||
| Danbury, CT |
Bucharest, Romania | Riyadh, Saudi Arabia | ||
| Granite Bay, CA |
Cardiff, Wales | Sharq, Kuwait | ||
| Houston, TX |
Daresbury, UK | |||
| Irvine, CA |
Dusseldorf, Germany | North Africa | ||
| Las Vegas, NV |
Edinburgh, Scotland | Cairo, Egypt | ||
| Little Falls, NJ |
Exeter, UK | Tripoli, Libya | ||
| Marlton, NJ |
Glasgow, Scotland | |||
| Miami, FL |
Krakow, Poland | Asia/Pacific | ||
| New Orleans, LA |
Leeds, UK | Beijing, China | ||
| New York, NY |
London, UK | Hong Kong, China | ||
| Orlando, FL |
Luxembourg | Kuala Lumpur, Malaysia | ||
| Philadelphia, PA |
Madrid, Spain | Perth, Australia | ||
| Phoenix, AZ |
Manchester, UK | Singapore | ||
| Portland, OR |
Munich, Germany | Shanghai, China | ||
| San Ramón, CA |
Riga, Latvia | Sydney, Australia | ||
| Spokane, WA |
Rijeka, Croatia | |||
| Tampa, Florida |
Tbilisi, Georgia | |||
| Toronto, Canada |
Teesside, UK | |||
| Trinidad and Tobago |
Warsaw, Poland | |||
| Universal City, CA |
Winchester, UK | |||
| Vancouver, Canada |
Wroclaw, Poland | |||
| Washington, DC |
| Item 3. | Legal Proceedings. |
Litigation
On July 16, 2009, Al Areen Desert Resort Holding Company (“Al Areen”) filed a complaint with the Ministry of Justice & Islamic Affairs in the Kingdom of Bahrain against the Company alleging breach of contract and other causes of action in connection with its performance of a construction project known as Al Areen Desert Spa and Resort (the “Project”), seeking the sum of approximately 10,200,000 Bahraini dinars (approximately $27,052,000 at December 31, 2009) in damages. The Company provided project management services on the Project and Al Areen failed to pay the Company 679,000 Bahraini dinars (approximately $1,801,000 at December 31, 2009) for services rendered on the Project. The Company served notice of termination on April 28, 2009. On September 26, 2009, the Company filed a Request for Arbitration with the International Chamber of Commerce, International Court of Arbitration, seeking the sum of 679,000 Bahraini dinars. The Company has reserved approximately $531,000 against the receivable, however, the Company believes that Al Areen’s claim is without merit and, based on the Company’s current understanding and evaluation of the relevant facts and circumstances, no accrual has been made because the Company considers the chance of loss to be remote.
On September 23, 1996, William Hughes General Contractors, Inc. (“Hughes”) filed a complaint in the Superior Court of New Jersey, Law Division, Gloucester County, against the Monroe Township Board of
18
Table of Contents
Education, the Company and other parties, alleging breach of contract and other causes of action in connection with its performance of a construction project for Monroe Township, seeking in excess of $3,500,000 in damages. Monroe Township, which had terminated Hughes from the construction project prior to the commencement of the litigation on the basis of Hughes’ performance, made a cross claim against the Company and other parties for contribution and indemnification. Monroe Township is seeking approximately $89,000 in damages from the Company, in addition to an indemnification for Hughes’ claims. In relation to the Hughes claims, a claim was made against the Company by Fidelity and Deposit Company of Maryland (“F&D”). F&D is claiming damages in the range of $425,000 to $470,000. The F&D claim is being defended by the New Jersey Professional Liability Insurance Guarantee Association (“NJPLIGA”) and losses are covered up to $300,000. On September 18, 2009, the parties reached a global settlement in which the NJPLIGA agreed to pay $110,000 to Hughes and Hill agreed to pay $30,000. The Company’s payment of $30,000 is reflected in selling, general and administrative expenses for the year ended December 31, 2009.
General Litigation
From time to time, the Company is a defendant or plaintiff in various legal actions which arise in the normal course of business. As such the Company is required to assess the likelihood of any adverse outcomes to these matters as well as potential ranges of probable losses. A determination of the amount of the provision required for these commitments and contingencies, if any, which would be charged to earnings, is made after careful analysis of each matter. The provision may change in the future due to new developments or changes in circumstances. Changes in the provision could increase or decrease the Company’s earnings in the period the changes are made. It is the opinion of management, after consultation with legal counsel, that the ultimate resolution of these matters will not have a material adverse effect on the Company’s financial condition, results of operations or cash flows.
| Item 4. | Reserved. |
19
Table of Contents
| Item 5. | Market for Registrant’s Common Equity and Related Stockholder Matters and Issuer Purchases of Equity Securities. |
Market Information
Since February 22, 2008, our common stock has traded on the New York Stock Exchange under the symbol HIL. From June 29, 2006 through February 21, 2008, our common stock traded on the Nasdaq Global Market under the symbol HINT. The following table sets forth the range of high and low closing sale prices on the Nasdaq Global Market from January 1, 2008 through February 21, 2008 and the range of high and low closing prices on the New York Stock Exchange from February 22, 2008 through December 31, 2009.
| Common Stock | ||||||
| High | Low | |||||
| 2009: |
||||||
| Fourth Quarter |
$ | 7.80 | $ | 6.10 | ||
| Third Quarter |
8.01 | 3.95 | ||||
| Second Quarter |
4.43 | 2.98 | ||||
| First Quarter |
8.23 | 2.35 | ||||
| 2008: |
||||||
| Fourth Quarter |
$ | 13.32 | $ | 3.83 | ||
| Third Quarter |
19.30 | 13.53 | ||||
| Second Quarter |
17.40 | 11.70 | ||||
| First Quarter |
13.62 | 11.03 | ||||
Stockholders
As of March 4, 2010, there were 101 holders of record of our common stock. However, a single record stockholder account may represent multiple beneficial owners, including holders of shares in street name accounts. Including those multiple owners, we believe there are more than 5,000 holders of our common stock.
Dividends
We have not paid any dividends on our common stock. The payment of dividends in the future will be contingent upon our revenue and earnings, if any, capital requirements and general financial condition of our business. The payment of any dividends is within the discretion of our Board of Directors. It is the present intention of our Board to retain all earnings, if any, for use in our business operations and, accordingly, we do not anticipate declaring any dividends in the foreseeable future.
Issuer Purchases of Equity Securities
On November 10, 2008, we announced that our Board of Directors approved the purchase of up to $20,000,000 of our common shares, from time to time over the subsequent 12 months. On August 4, 2009, our Board of Directors amended the stock repurchase program to increase the authorized amount to $40,000,000 and extend the program to December 31, 2010. Under the terms of our Credit Agreement with Bank of America, our ability to repurchase our common shares is limited to $20,000,000. Purchases in excess of that amount require a waiver from the bank.
| Period |
(a) Total Number of Shares Purchased |
(b) Average Price Paid per Share |
(c) Total Number of Shares Purchased as Part of Publicly Announced Plan |
(d) Maximum Dollar Value of Shares that May Yet Be Purchased Under the Plan | ||||||
| November 2009 |
400 | $ | 6.02 | 3,652,572 | $ | 24,889,813 | ||||
20
Table of Contents
Securities Authorized for Issuance under Equity Compensation Plans
The table setting forth this information is included in Part III—Item 12. Security Ownership of Certain Beneficial Owners and Management and Related Stockholder Matters.
Performance Graph
The performance graph and table below compare the cumulative total return of our common stock for the period December 31, 2004 to December 31, 2009 with the comparable cumulative total returns of the Russell 2000 Index and a peer group, which consists of the following ten companies: AECOM Technology Corp. (ACM), Michael Baker Corp. (BKR), Exponent, Inc. (EXPO), Fluor Corporation (FLR), ICF International, Inc. (ICFI), Jacobs Engineering Group, Inc. (JEC), Navigant Consulting, Inc. (NCI), Tutor Perini Corp. (TPC), Tetra Tech, Inc. (TTEK), and URS Corp. (URS).
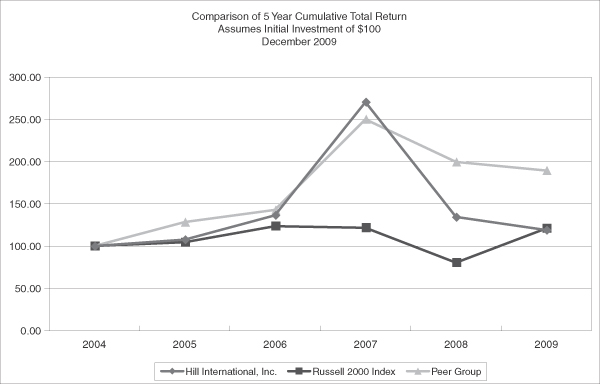
| 2004 | 2005 | 2006 | 2007 | 2008 | 2009 | |||||||||||||
| Hill International, Inc |
$ | 100.00 | $ | 107.76 | $ | 136.53 | $ | 270.57 | $ | 134.42 | $ | 119.14 | ||||||
| Russell 2000 Index |
100.00 | 104.56 | 123.75 | 121.83 | 80.66 | 121.14 | ||||||||||||
| Peer Group |
100.00 | 128.35 | 142.75 | 249.98 | 199.49 | 189.35 | ||||||||||||
21
Table of Contents
| Item 6. | Selected Financial Data. |
The following is selected financial data from Hill’s audited consolidated financial statements for each of the last five years. This data should be read in conjunction with Hill’s consolidated financial statements (and related notes) appearing elsewhere in this report and with Item 7, “Management’s Discussion and Analysis of Financial Condition and Results of Operations”. The data presented below is in thousands, except for per share data.
| 2009 | 2008 | 2007 | 2006 | 2005 | ||||||||||||||||
| (Revised)(1) | (Revised)(1) | (Revised)(1) | (Revised)(1) | |||||||||||||||||
| Income Statement Data: |
||||||||||||||||||||
| Consulting fee revenue |
$ | 364,010 | $ | 333,882 | $ | 203,118 | $ | 129,987 | $ | 80,108 | ||||||||||
| Reimbursable expenses |
57,772 | 46,600 | 87,205 | 67,485 | 32,121 | |||||||||||||||
| Total revenue |
421,782 | 380,482 | 290,323 | 197,472 | 112,229 | |||||||||||||||
| Cost of services |
209,052 | 183,485 | 107,447 | 71,552 | 43,466 | |||||||||||||||
| Reimbursable expenses |
57,772 | 46,600 | 87,205 | 67,485 | 32,121 | |||||||||||||||
| Total direct expenses |
266,824 | 230,085 | 194,652 | 139,037 | 75,587 | |||||||||||||||
| Gross profit |
154,958 | 150,397 | 95,671 | 58,435 | 36,642 | |||||||||||||||
| Selling, general and administrative expenses |
136,683 | 131,857 | 80,280 | 48,142 | 31,671 | |||||||||||||||
| Equity in earnings of affiliates |
(8,222 | ) | (3,658 | ) | (2,221 | ) | (1,080 | ) | (685 | ) | ||||||||||
| Operating profit |
26,497 | 22,198 | 17,612 | 11,373 | 5,656 | |||||||||||||||
| Interest (income) expense, net |
1,737 | (134 | ) | 433 | 312 | 669 | ||||||||||||||
| Earnings before provision for income taxes |
24,760 | 22,332 | 17,179 | 11,061 | 4,987 | |||||||||||||||
| Provision for income taxes |
4,577 | 3,654 | 2,788 | 2,534 | 1,845 | |||||||||||||||
| Consolidated net earnings |
20,183 | 18,678 | 14,391 | 8,527 | 3,142 | |||||||||||||||
| Less: net earnings—non controlling interests |
713 | 1,027 | 247 | (53 | ) | — | ||||||||||||||
| Net earnings attributable to Hill International, Inc. |
$ | 19,470 | $ | 17,651 | $ | 14,144 | $ | 8,580 | $ | 3,142 | ||||||||||
| Basic earnings per common share |
$ | 0.49 | $ | 0.43 | $ | 0.53 | $ | 0.50 | $ | 0.27 | ||||||||||
| Basic weighted average common shares outstanding |
39,659 | 40,809 | 26,720 | 17,240 | 11,644 | |||||||||||||||
| Diluted earnings per common share |
$ | 0.49 | $ | 0.43 | $ | 0.45 | $ | 0.46 | $ | 0.23 | ||||||||||
| Diluted weighted average common shares outstanding |
40,124 | 41,148 | 31,387 | 18,489 | 13,894 | |||||||||||||||
|
(1) In the fourth quarter of 2009, the Company began charging a portion of depreciation and amortization expense to cost of services. The income statement data for 2008, 2007, 2006 and 2005 have been revised to conform to the current year’s presentation. |
| |||||||||||||||||||
| 12/31/2009 | 12/31/2008 | 12/31/2007 | 12/30/2006 | 12/31/2005 | ||||||||||||||||
| Selected Balance Sheet Data: |
||||||||||||||||||||
| Cash and cash equivalents |
$ | 30,923 | $ | 20,430 | $ | 66,128 | $ | 11,219 | $ | 2,716 | ||||||||||
| Accounts receivable, net |
130,900 | 118,124 | 83,151 | 61,159 | 27,623 | |||||||||||||||
| Current assets |
183,602 | 161,492 | 162,428 | 83,344 | 33,351 | |||||||||||||||
| Total assets |
291,539 | 254,041 | 207,199 | 118,993 | 40,723 | |||||||||||||||
| Current liabilities |
82,657 | 80,563 | 59,648 | 50,835 | 31,707 | |||||||||||||||
| Total debt |
28,244 | 18,887 | 3,312 | 11,287 | 10,374 | |||||||||||||||
| Equity: |
||||||||||||||||||||
| Hill International, Inc. |
155,635 | 135,506 | 128,371 | 46,036 | 6,159 | |||||||||||||||
| Noncontrolling interests |
4,005 | 3,510 | 259 | 286 | — | |||||||||||||||
| Total equity |
$ | 159,640 | $ | 139,016 | $ | 128,630 | $ | 46,322 | $ | 6,159 | ||||||||||
22
Table of Contents
| Item 7. | Management’s Discussion and Analysis of Financial Condition and Results of Operations. |
Arpeggio Acquisition Corporation (“Arpeggio”) was incorporated in Delaware in 2004 as a specified purpose acquisition corporation. On June 28, 2006, Arpeggio merged with Hill International, Inc. (“Old Hill”), a Delaware corporation, and Arpeggio was the surviving entity of the merger. Old Hill was founded in 1976 by our current Chairman and Chief Executive Officer, Irvin E. Richter. Immediately following the merger, the stockholders of Old Hill owned approximately 63.6% of the total voting power of Arpeggio. The merger was accounted for as a reverse acquisition under U.S. generally accepted accounting principles pursuant to which Old Hill was considered to be the acquiring entity and Arpeggio was the acquired company for accounting purposes, accompanied by a recapitalization of Old Hill. Accordingly, the historical financial statements relate to the business of Old Hill and its consolidated subsidiaries. Following the merger, Arpeggio changed its name to Hill International, Inc. In this report, the terms “Company,” “we,” “us,” “our” or “Hill” refer to Hill International, Inc.
Reimbursable expenses are reflected in equal amounts in both total revenue and total direct expenses. Because these revenue/costs are subject to significant fluctuation from year to year, we measure the performance of many of our key operating metrics as a percentage of consulting fee revenue (“CFR”), as we believe that this is a better and more consistent measure of operating performance than total revenue.
Overview
CFR increased $30,128,000, or 9.0%, from $333,882,000 in 2008 to $364,010,000 in 2009. CFR for the project management segment increased $29,485,000 principally due to strong organic growth in the Middle East and North Africa. CFR for the construction claims segment increased $643,000 due primarily to strong organic growth in the Middle East.
Reimbursable expenses increased $11,172,000 or 24.0%, from $46,600,000 in 2008 to $57,772,000 in 2009 principally due to the higher use of subcontractors in the Middle East, New York and Philadelphia.
Cost of services increased $25,567,000, or 13.9%, from $183,485,000 in 2008 to $209,052,000 in 2009 as a result of an increase in employees and other direct expenses needed to support the increase in CFR.
Gross profit increased $4,561,000, or 3.0%, from $150,397,000 in 2008 to $154,958,000 in 2009 due to the increases in CFR. Gross profit as a percent of CFR decreased from 45.0% in 2008 to 42.6% in 2009 principally because of increased labor costs in the Middle East and the use of outside experts on a large project was billed at margins significantly lower than internal staff in the United Kingdom.
Selling, general and administrative expenses increased $4,826,000, or 3.7%, principally due to an increase of $5,600,000 in staff costs, an increase in bad debts of $1,795,000, offset by a $1,000,000 reduction in legal fees.
Equity in earnings of affiliates increased $4,564,000 from $3,658,000 in 2008 to $8,222,000 in 2009 due to a significant increase in the scope of Iran Reconstruction Program work for our affiliate, Stanley Baker Hill, and from Hill TMG, a joint venture formed in May 2008.
Income taxes increased $923,000, or 25.3%, from $3,654,000 in 2008 to $4,577,000 in 2009 as our pre-tax income increased $2,428,000, or 10.9%, from $22,332,000 in 2008 to $24,760,000 in 2009. The effective tax rate was 18.5% in 2009 compared with 16.4% in 2008.
Net earnings increased $1,819,000, or 10.3%, from $17,651,000 in 2008 to $19,470,000 in 2009. Diluted earnings per common share were $0.49 in 2009 based upon 40,124,000 diluted common shares outstanding compared to $0.43 in 2008 based upon 41,148,000 diluted common shares outstanding.
23
Table of Contents
Critical Accounting Policies
Our consolidated financial statements were prepared in accordance with U.S. generally accepted accounting principles, which require management to make subjective decisions, assessments and estimates about the effect of matters that are inherently uncertain. As the number of variables and assumptions affecting the judgment increases, such judgments become even more subjective. While management believes its assumptions are reasonable and appropriate, actual results may be materially different than estimated.
Revenue Recognition
We generate revenue primarily from providing professional services to our clients. Revenue is generally recognized upon the performance of services. In providing these services, we may incur reimbursable expenses, which consist of amounts paid to subcontractors and other third parties as well as travel and other job related expenses that are contractually reimbursable from clients. We will include reimbursable expenses in computing and reporting our total contract revenue as long as we remain responsible to the client for the fulfillment of the contract and for the overall acceptability of all services provided.
We earn our revenue from cost-plus, fixed-price and time-and-materials contracts. If estimated total costs on any contract indicate a loss, we charge the entire estimated loss to operations in the period the loss becomes known. The cumulative effect of revisions to revenue, estimated costs to complete contracts, including penalties, incentive awards, change orders, claims, anticipated losses, and other effects are recorded in the accounting period in which the events indicating a loss are known and the loss can be reasonably estimated. Such revisions could occur at any time and the effects may be material.
The majority of our contracts are for work where we bill the client monthly at hourly billing rates. The hourly billing rates are determined by contract terms. For governmental clients, the hourly rates are generally calculated as either (i) a negotiated multiplier of our direct labor costs or (ii) as direct labor costs plus overhead costs plus a negotiated profit percentage. For commercial clients, the hourly rates are generally taken from a standard fee schedule by staff classification or they can be at a negotiated discount from this schedule. In some cases, primarily for foreign work, a fixed monthly staff rate is negotiated rather than an hourly rate. This monthly rate is determined based upon a buildup of direct labor costs plus overhead and profit. We account for these contracts on a time-and-expenses method, recognizing revenue as costs are incurred.
We account for fixed-price contracts on the “percentage-of-completion” method, wherein revenue is recognized as costs are incurred. Under the percentage-of-completion method for revenue recognition, we estimate the progress towards completion to determine the amount of revenue and profit to be recognized. We generally utilize a cost-to-cost approach in applying the percentage-of-completion method, where revenue is earned in proportion to total costs incurred divided by total costs expected to be incurred.
Under the percentage-of-completion method, recognition of profit is dependent upon the accuracy of estimates. We have a history of making reasonably dependable estimates of contract revenue, the extent of progress towards completion and contract completion costs on our long-term construction management contracts. However, due to uncertainties inherent in the estimation process, it is possible that actual completion costs may vary from estimates.
Allowance for Doubtful Accounts
We make ongoing estimates relating to the collectibility of our accounts receivable and maintain an allowance for estimated losses resulting from the inability of our clients to make required payments. Estimates used in determining accounts receivable allowances are based on specific client account reviews and historical experience of credit losses. We also apply judgment including assessments about changes in economic conditions, concentration of receivables among clients and industries, recent write-off trends, rates of
24
Table of Contents
bankruptcy, and credit quality of specific clients. Unanticipated changes in the financial condition of clients, the resolution of various disputes, or significant changes in the economy could impact the reserves required. At December 31, 2009 and 2008, the allowance for doubtful accounts was $9,780,000 and $5,999,000, respectively.
Goodwill and Other Intangible Assets
Goodwill is tested for impairment at the reporting unit level at least annually. We have determined that we have two reporting units, the Project Management unit and the Construction Claims unit. We made that determination based on the similarity of the services provided, the methodologies in delivering our services and the similarity of the client base in each of these units. Generally, we perform an impairment assessment during our third fiscal quarter. Application of the goodwill impairment test requires significant judgments including estimation of future cash flows, which is dependent on internal forecasts, estimation of the long-term rate of growth for Hill, the period over which cash flows will occur, and determination of the weighted average cost of capital. Changes in these estimates and assumptions could materially affect the determination of fair value and/or goodwill impairment for each reporting unit. Changes in future market conditions, our business strategy, or other factors could impact upon the future values of Hill’s reporting units, which could result in future impairment charges. Based on the valuation as of July 1, 2009, the fair values of the Project Management unit and Construction Claims unit substantially exceeded their carrying values.
We amortize other intangible assets over their estimated useful lives and review the long-lived assets for impairment whenever events or changes in circumstances indicate that the related carrying amounts may not be recoverable. Determining whether impairment has occurred typically requires various estimates and assumptions, including determining which cash flows are directly related to the potentially impaired asset, the useful life over which cash flows will occur, their amount and the asset’s residual value, if any. In turn, measurement of an impairment loss requires a determination of fair value, which is based on the best information available. We use internal discounted cash flow estimates, quoted market prices when available and independent appraisals, as appropriate, to determine fair value. We derive the required cash flow estimates from our historical experience and our internal business plans and apply an appropriate discount rate.
Income Taxes
We make judgments and interpretations based on enacted tax laws, published tax guidance, as well as estimates of future earnings. These judgments and interpretations affect the provision for income taxes, deferred tax assets and liabilities and the valuation allowance. We evaluated the deferred tax assets and determined on the basis of objective factors that the net assets will be realized through future years’ taxable income. In the event that actual results differ from these estimates and assessments, additional valuation allowances may be required.
We will recognize a tax benefit in the financial statements for an uncertain tax position only if management’s assessment is that the position is “more likely than not” (i.e., a likelihood greater than 50 percent) to be allowed by the tax jurisdiction based solely on the technical merits of the position. The term “tax position” refers to a position in a previously filed tax return or a position expected to be taken in a future tax return that is reflected in measuring current or deferred income tax assets and liabilities for interim or annual periods.
Stock Options
We recognize compensation expense for all stock-based awards made to directors, employees and consultants. The awards include stock options and restricted stock grants.
While fair value may be readily determinable for awards of stock, market quotes are not available for long-term, nontransferable stock options because these instruments are not traded. We currently use the Black-Scholes option pricing model to estimate the fair value of options. Option valuation models require the input of highly subjective assumptions, including but not limited to stock price volatility, expected life and stock option exercise behavior.
25
Table of Contents
Contingencies
Management estimates are inherent in the assessment of our exposure to insurance claims that fall below policy deductibles and to litigation and other legal claims and contingencies, as well as in determining our liabilities for incurred but not reported insurance claims. Significant judgments by us and reliance on third-party experts are utilized in determining probable and/or reasonably estimable amounts to be recorded or disclosed in our financial statements. The results of any changes in accounting estimates are reflected in the financial statements of the period in which the changes are determined. We do not believe that material changes to these estimates are reasonably likely to occur.
Results of Operations
Year Ended December 31, 2009 Compared to
Year Ended December 31, 2008
Consulting Fee Revenue (“CFR”)
| 2009 | 2008 | Change | ||||||||||||||||
| (in thousands) | ||||||||||||||||||
| Project Management |
$ | 276,811 | 76.0 | % | $ | 247,326 | 74.1 | % | $ | 29,485 | 11.9 | % | ||||||
| Construction Claims |
87,199 | 24.0 | % | 86,556 | 25.9 | % | 643 | 0.7 | % | |||||||||
| Total |
$ | 364,010 | 100.0 | % | $ | 333,882 | 100.0 | % | $ | 30,128 | 9.0 | % | ||||||
The increase in Hill’s CFR in 2009 compared to 2008 was comprised of 6.1% organic growth primarily from the Middle East and North Africa and 2.9% growth from acquisitions. CFR was negatively impacted by changes in exchange rates which decreased the reported amount by approximately $13,000,000.
During 2009, Hill’s project management CFR growth was comprised of 9.0% organic growth and 2.9% growth from acquisitions. The dollar increase in project management CFR consisted of a $33,306,000 increase in foreign projects and a decrease of $3,821,000 in domestic projects. The increase in foreign project management CFR was primarily due to a $26,789,000 increase generated in North Africa and $8,153,000 in the Middle East. Growth in North Africa was primarily due to two large contracts in Libya. Growth in our CFR in the Middle East has been strong primarily due to our involvement with the Iraq reconstruction efforts funded by the United States government and significant new work in Qatar. The decrease in domestic project management CFR revenue was primarily due to decreased work in the Texas and New Jersey regions, partially offset by increased work in the Southwest region.
During 2009, Hill’s construction claims CFR increase of 0.7% was comprised of an organic 2.3% decrease offset by 3.0% growth from the acquisitions of PCI and Chitester. The dollar increase in construction claims CFR is primarily attributable to an increase in foreign construction claims CFR of $553,000 driven primarily by increased work in the Middle East and a decrease in CFR for the UK and Europe. The increase in domestic construction claims CFR of $90,000 was due primarily to PCI and Chitester which were acquired during the third and fourth quarters of 2008, respectively.
Reimbursable Expenses
| 2009 | 2008 | Change | |||||||||||||||||
| (in thousands) | |||||||||||||||||||
| Project Management |
$ | 55,176 | 95.5 | % | $ | 42,607 | 91.4 | % | $ | 12,569 | 29.5 | % | |||||||
| Construction Claims |
2,596 | 4.5 | % | 3,993 | 8.6 | % | (1,397 | ) | -35.0 | % | |||||||||
| Total |
$ | 57,772 | 100.0 | % | $ | 46,600 | 100.0 | % | $ | 11,172 | 24.0 | % | |||||||
26
Table of Contents
Reimbursable expenses consist of amounts paid to subcontractors and other third parties and travel and other job related expenses that are contractually reimbursable from clients. These items are reflected as separate line items in both our revenue and cost of services captions in our consolidated statements of earnings. The increase in project management reimbursable expenses was partially due to a $ 12,790,000 increase in reimbursable subcontractors’ fees primarily in New York, Philadelphia and the Middle East. The decrease in construction claims reimbursable expenses is due to the decreased use of subcontractors overseas primarily in the UK and the Middle East.
Cost of Services
| 2009 | % of CFR |
2008 | % of CFR |
Change | ||||||||||||||||||||
| (in thousands) | ||||||||||||||||||||||||
| Project Management |
$ | 168,449 | 80.6 | % | 60.9 | % | $ | 146,199 | 79.7 | % | 59.1 | % | $ | 22,250 | 15.2 | % | ||||||||
| Construction Claims |
40,603 | 19.4 | % | 46.6 | % | 37,286 | 20.3 | % | 43.1 | % | 3,317 | 8.9 | % | |||||||||||
| Total |
$ | 209,052 | 100.0 | % | 57.4 | % | $ | 183,485 | 100.0 | % | 55.0 | % | $ | 25,567 | 13.9 | % | ||||||||
Cost of services consists of labor expenses for time charged directly to contracts and non-reimbursable job related travel and out-of-pocket expenses. The increase in project management cost of services is primarily due to an increase in direct labor of $10,686,000 required to produce the higher volume of CFR and an increase in other direct costs of $7,919,000 in North Africa due to increased work.
The increase in the cost of services for construction claims was due primarily to an increase in direct labor of $1,397,000 in the Middle East due to increased CFR and an increase in other direct costs of $1,762,000 in the UK.
Gross Profit
| 2009 | % of CFR |
2008 | % of CFR |
Change | |||||||||||||||||||||
| (in thousands) | |||||||||||||||||||||||||
| Project Management |
$ | 108,362 | 69.9 | % | 39.1 | % | $ | 101,127 | 67.2 | % | 40.9 | % | $ | 7,235 | 7.2 | % | |||||||||
| Construction Claims |
46,596 | 30.1 | % | 53.4 | % | 49,270 | 32.8 | % | 56.9 | % | (2,674 | ) | -5.4 | % | |||||||||||
| Total |
$ | 154,958 | 100.0 | % | 42.6 | % | $ | 150,397 | 100.0 | % | 45.0 | % | $ | 4,561 | 3.0 | % | |||||||||
The increase in project management gross profit included $10,324,000 from foreign project management primarily attributable to increases in the Middle East, Europe and North Africa due to the increased CFR discussed above which was partially offset by decreased domestic gross profit of $3,100,000 primarily in New Jersey and Texas.
The decrease in construction claims gross profit of $2,674,000 included a decrease of $2,270,000 in the United Kingdom primarily due to the impact of a decrease of approximately 15% in the average British pound to U.S. dollar exchange rate from 2008 to 2009.
The decrease in the construction claims gross profit as a percentage of CFR is due primarily to decreases in the Middle East and in the United Kingdom. In the Middle East, average salary costs for new hires in the latter part of 2008 were higher than the existing staff resulting in lower margins. In the United Kingdom, the use of outside experts on one large project was billed at margins significantly lower than internal staff.
27
Table of Contents
Selling, General and Administrative (“SG&A”) Expenses
| 2009 | 2008 | Change | ||||||||||||||||
| % of CFR |
% of CFR |
|||||||||||||||||
| (in thousands) | ||||||||||||||||||
| SG&A Expenses |
$ | 136,683 | 37.5 | % | $ | 131,857 | 39.5 | % | $ | 4,826 | 3.7 | % | ||||||
The increase in SG&A expenses is partially attributable to an increase of $2,199,000 from the 2008 acquisitions of Gerens, Euromost, Chitester and PCI. The significant components of the change are as follows:
| • | An increase in unapplied labor of $1,411,000 including $1,104,000 for Gerens, Euromost, Chitester and PCI. Unapplied labor represents the labor cost of operating staff for time charged to business development, administration, vacation, holiday and other non-billable tasks. |
| • | An increase in indirect labor expense of $4,206,000 supporting the increase in revenue of the operating segments. |
| • | An increase of $1,796,000 for bad debt expense including increases in the Middle East and North Africa of $1,283,000. |
| • | A decrease of $1,296,000 in business development travel and related expenses due to cost reduction efforts. |
| • | A decrease in legal fees of $1,079,000 including a decrease of $533,000 for one domestic matter, and a decrease of $367,000 related to various international legal and tax matters. |
Equity in Earnings of Affiliates
Our share of the earnings of affiliates, increased $4,564,000, from $3,658,000 in 2008 to $8,222,000 in 2009, primarily due to increased work in Iraq and the full year effect of Hill TMG which was formed in mid-2008.
Our share of the earnings of Stanley Baker Hill, LLC (“SBH”), increased $4,136,000, from $3,065,000 in 2008 to $7,201,000 in 2009. SBH is a joint venture between Stanley Consultants, Inc. (“Stanley”), Michael Baker, Jr., Inc. (“Baker”) and us. Stanley, Baker and we each own an equal one-third interest in SBH. SBH has a contract for an indefinite delivery and indefinite quantity for construction management and general architect-engineer services for facilities in Iraq with the U.S. Army Corps of Engineers. At December 31, 2009, the existing task orders under the contract extend until late 2010, but those task orders have a lower run rate than was experienced in 2009.
Our share of the earnings of Hill TMG increased $424,000, from $593,000 in 2008 to $1,017,000 in 2009. Hill TMG is a joint venture formed in May 2008 between Talaat Moustafa Group Holding Co. (“TMG”), and Hill. Hill TMG is managing the construction of several of TMG’s largest developments in Egypt and elsewhere in the Middle East.
28
Table of Contents
Operating Profit:
| 2009 | 2008 | Change | |||||||||||||||||||
| % of CFR |
% of CFR |
||||||||||||||||||||
| (in thousands) | |||||||||||||||||||||
| Project Management before equity in earnings of affiliates |
$ | 35,095 | 12.7 | % | $ | 34,419 | 13.9 | % | $ | 676 | 2.0 | % | |||||||||
| Equity in earnings of affiliates |
8,222 | 3.0 | % | 3,658 | 1.5 | % | 4,564 | 124.8 | % | ||||||||||||
| Total Projects |
43,317 | 15.6 | % | 38,077 | 15.4 | % | 5,240 | 13.8 | % | ||||||||||||
| Construction Claims |
8,277 | 9.5 | % | 9,480 | 11.0 | % | (1,203 | ) | -12.7 | % | |||||||||||
| Corporate |
(25,097 | ) | (25,359 | ) | 262 | -1.0 | % | ||||||||||||||
| Total |
$ | 26,497 | 7.3 | % | $ | 22,198 | 6.6 | % | $ | 4,299 | 19.4 | % | |||||||||
Total operating profit increased principally due to higher CFR, gross profit and equity in earnings of affiliates, partially offset by higher SG&A expenses in the project management group.
Operating profit for the Project Management Group increased primarily due to an increase of $9,850,000 in foreign project management partially offset by a decrease of $4,610,000 for domestic operations. The increase in foreign project management included an increase of $7,572,000 in North Africa including an increase of $425,000 in equity from earnings of affiliates and an increase in Iraq of $5,294,000 including an increase in equity from earnings of affiliates of $4,136,000. The decrease in domestic project management included decreases of $4,288,000 in New Jersey and Texas where CFR decreased by $6,230,000.
Operating profit for the Construction Claims Group decreased due to a decrease of $658,000 from foreign operations and a decrease of $545,000 from domestic operations. The decrease in foreign claims management operating profit included a decrease of $1,043,000 in the United Kingdom caused primarily by the impact of a decrease of approximately 15% in the average British pound to U.S. dollar exchange rate from 2008 to 2009. The decrease in domestic claims operating profit included decreases of $1,053,000 in New Jersey, Washington D.C. and Las Vegas, partially offset by increases of $764,000 from Chitester and PCI which were acquired in 2008.
Corporate expenses decreased due to the following:
| • | A net increase of $2,071,000 in indirect labor due to the full-year impact of the 2008 new hires, partially offset by staff reductions in 2009. |
| • | A decrease of $734,000 in legal fees including a decrease of $533,000 for one domestic matter and a decrease of $367,000 for related to various international legal and tax matters. |
| • | A decrease of $462,000 in administrative travel expenses due to cost cutting measures including planned reductions on non-billable travel. |
| • | A decrease of $456,000 for computer software, maintenance and consulting support as a result of cost efficiencies. |
| • | A decrease of $377,000 in advertising costs as a result of cost cutting measures. |
| • | A decrease of $232,000 in accounting fees due to a reduction in audit fees and Sarbanes-Oxley related consulting. |
Interest (Income) Expense, net
Net interest expense increased $1,871,000 to $1,737,000 in 2009 as compared with a net interest income of $134,000 in 2008, primarily due to increased borrowing under the Company’s senior credit facility to support our working capital needs and to provide funds for acquisitions in 2008.
29
Table of Contents
Income Taxes
In 2009, income tax expense increased by $923,000 to $4,577,000 compared to $3,654,000 in 2008.
The effective income tax expense rates for 2009 and 2008 were 18.5% and 16.4%, respectively. Our effective tax rate continues to remain low since a substantial portion of our profit comes from foreign operations which are taxed at lower rates, if at all.
In addition, three items materially affected the Company’s effective tax rate during 2009. The Company realized substantial benefits from the reversal of a prior year’s uncertain tax position amounting to $1,741,000 due to the expiration of the statute of limitations upon the filing of certain income tax returns. An income tax benefit of $1,650,000, net of an income tax payment of $495,000 for a prior year audit, resulted from adjustments to agree the 2008 book amount to the actual amounts reported on the tax returns, primarily related to foreign operations. These benefits were partially offset by the recognition of an $887,000 tax effect on unrealized foreign exchange gains generated in the United Kingdom which are included as income on the local tax returns and an increase in the reserves for uncertain tax positions of $900,000, related primarily to uncertain tax positions of foreign operations. Excluding these items our effective tax rate would have been 25.0% in 2009.
In 2008, the Company realized substantial benefits from the reversal of a prior year’s uncertain tax position amounting to $2,506,000 and unrealized foreign exchange losses of $1,700,000 generated in the United Kingdom. These benefits were partially offset by a modification of $1,638,000 to the cash to accrual adjustment which was required when the Company became a publicly-held entity in 2006. Excluding these items our effective tax rate would have been 27.2% in 2008.
In March 2010, the Company may realize a tax benefit of $715,000 due to the expiration of the statute of limitations upon the filing of certain income tax returns. If realized, this amount will reduce income tax expense in the first quarter of 2010.
Net Earnings
Our net earnings for 2009 were $19,470,000, or $0.49 per diluted common share based upon 40,124,000 diluted common shares outstanding, as compared to net earnings for 2008 of $17,651,000, or $0.43 per diluted common share based upon 41,148,000 diluted common shares outstanding. The diluted earnings per share for 2009 were impacted by a change in diluted shares outstanding as a result of (i) the issuance of 1,000,000 shares in connection with the earn-out provisions of the merger agreement with Arpeggio and (ii) the repurchase of 2,487,743 common shares under our stock repurchase program. Net earnings improved by $1,819,000 or 10.3%, which was principally due to an increase in CFR, and an increase in gross profit, partially offset by higher SG&A expenses as a result of our overall growth and a higher effective income tax rate.
Year Ended December 31, 2008 Compared to
Year Ended December 31, 2007
Consulting Fee Revenue (“CFR”)
| 2008 | 2007 | Change | ||||||||||||||||
| (in thousands) | ||||||||||||||||||
| Project Management |
$ | 247,326 | 74.1 | % | $ | 134,968 | 66.4 | % | $ | 112,358 | 83.2 | % | ||||||
| Construction Claims |
86,556 | 25.9 | % | 68,150 | 33.6 | % | 18,406 | 27.0 | % | |||||||||
| Total |
$ | 333,882 | 100.0 | % | $ | 203,118 | 100.0 | % | $ | 130,764 | 64.4 | % | ||||||
Hill’s CFR grew 64.4% to $333,882,000 in 2008 from $203,118,000 in 2007. This was comprised of 39.9% organic growth primarily from the Middle East, Europe, North Africa and the United Kingdom and 24.5% growth from acquisitions.
30
Table of Contents
During 2008, Hill’s project management CFR growth of 83.2% was comprised of 47.6% organic growth and 35.6% growth from acquisitions. The dollar increase in project management CFR consisted of a $105,283,000 increase in foreign projects and a $7,074,000 increase in domestic projects. The increase in foreign project management CFR was primarily due to a $30,285,000 increase generated in the Middle East, $18,906,000 in North Africa and $56,092,000 in Europe. Growth in our CFR in the Middle East was strong because there was a significant increase in construction activity in a number of the countries in the Middle East region (including the United Arab Emirates, Qatar and Saudi Arabia) where we do business. In addition, our involvement with the Iraq reconstruction efforts funded by the United States government continued to provide additional work for us. In 2008, the Company obtained several new projects in North Africa, primarily in Libya. Growth in Europe was mainly due to the acquisitions of Gerens, Shreeves and Euromost generating CFR of $43,582,000. The increase in domestic project management CFR revenue was primarily due to an increase of $3,554,000 for KJM (acquired May 2007) combined with increases of $1,453,000 in New York and $1,873,000 in New Jersey where several new projects began.
During 2008, Hill’s construction claims CFR growth of 27.0% was comprised of 24.8% organic growth and 2.2% growth from the acquisitions of PCI and Chitester. The dollar increase in construction claims CFR was primarily attributable to an increase in foreign construction claims CFR of $16,509,000. The increase mainly consists of a $9,796,000 increase in the Middle East and a $5,311,000 increase in the United Kingdom, primarily due to new work and expansion of existing work.
Reimbursable Expenses
| 2008 | 2007 | Change | |||||||||||||||||
| (in thousands) | |||||||||||||||||||
| Project Management |
$ | 42,607 | 91.4 | % | $ | 73,595 | 84.4 | % | $ | (30,988 | ) | (42.1 | )% | ||||||
| Construction Claims |
3,993 | 8.6 | % | 13,610 | 15.6 | % | (9,617 | ) | (70.7 | )% | |||||||||
| Total |
$ | 46,600 | 100.0 | % | $ | 87,205 | 100.0 | % | $ | (40,605 | ) | (46.6 | )% | ||||||
Reimbursable expenses consist of amounts paid to subcontractors and other third parties and travel and other job related expenses that are contractually reimbursable from clients. These items are reflected as separate line items in both our revenue and cost of services captions in our consolidated statements of earnings. The decrease in project management reimbursable expenses was partially due to a $ 15,840,000 decrease in reimbursable subcontractors’ fees in New York combined with lower use of subcontractors overseas in Europe and the Middle East amounting to a decrease of $10,159,000. We use subcontractors for a variety of reasons, such as providing at-risk construction services on contracts where such work is required by a client (generally known as “CM/Build” contracts) since we do not provide such services. The New York projects were principally CM/Build contracts which require more subcontracting work. The decrease in construction claims reimbursable expenses is due to the decreased use of subcontractors overseas primarily in Europe.
Cost of Services
| 2008 | % of CFR |
2007 | % of CFR |
Change | ||||||||||||||||||||
| (in thousands) | ||||||||||||||||||||||||
| Project Management |
$ | 146,199 | 79.7 | % | 59.1 | % | $ | 77,151 | 71.8 | % | 57.2 | % | $ | 69,048 | 89.5 | % | ||||||||
| Construction Claims |
37,286 | 20.3 | % | 43.1 | % | 30,296 | 28.2 | % | 44.5 | % | 6,990 | 23.1 | % | |||||||||||
| Total |
$ | 183,485 | 100.0 | % | 55.0 | % | $ | 107,447 | 100.0 | % | 52.9 | % | $ | 76,038 | 70.8 | % | ||||||||
Cost of services consists of labor expenses for time charged directly to contracts and non-reimbursable job related travel and out-of-pocket expenses. The increase in project management cost of services was primarily due
31
Table of Contents
to an increase in direct labor of $43,255,000 required to produce the higher volume of CFR. Of this amount, $20,962,000 was attributable to the acquisitions of Gerens, Shreeves and Euromost. In addition, direct (non-labor) expenses amounting to $5,353,000 were incurred by Gerens, Shreeves, and Euromost, $6,714,000 was incurred for new work in North Africa and $5,734,000 was incurred for new work in the Middle East.
The increase in the cost of services for construction claims was due primarily to an increase of $6,898,000 in the United Kingdom, Europe and the Middle East in line with an increase of $15,826,000 in CFR.
Gross Profit
| 2008 | % of CFR |
2007 | % of CFR |
Change | ||||||||||||||||||||
| (in thousands) | ||||||||||||||||||||||||
| Project Management |
$ | 101,127 | 67.2 | % | 40.9 | % | $ | 57,817 | 60.4 | % | 42.8 | % | $ | 43,310 | 74.9 | % | ||||||||
| Construction Claims |
49,270 | 32.8 | % | 56.9 | % | 37,854 | 39.6 | % | 55.5 | % | 11,416 | 30.2 | % | |||||||||||
| Total |
$ | 150,397 | 100.0 | % | 45.0 | % | $ | 95,671 | 100.0 | % | 47.1 | % | $ | 54,726 | 57.2 | % | ||||||||
The increase in project management gross profit included $40,051,000 from foreign project management of which $17,267,000 was attributable to the acquisitions of Gerens, Shreeves and Euromost. In addition, increases in the Middle East, Iraq and North Africa amounted to $19,282,000 due to the increased CFR discussed above. The decrease in project management gross profit as a percentage of CFR was due principally to Gerens which has a gross profit percentage of 35% and lower average margins on Middle East and Europe work where some higher margin projects came to an end in early 2008.
The increase in construction claims gross profit of $11,416,000 included $8,317,000 in the Middle East and United Kingdom primarily due to increased work and expansion of existing work. The increase in construction claims gross profit as a percentage of CFR was due to billing rate increases in the Middle East and Europe.
SG&A Expenses
| 2008 | 2007 | Change | ||||||||||||||||
| % of CFR |
% of CFR |
|||||||||||||||||
| (in thousands) | ||||||||||||||||||
| SG&A Expenses |
$ | 131,857 | 39.5 | % | $ | 80,280 | 39.5 | % | $ | 51,577 | 64.2 | % | ||||||
The increase in SG&A expenses was partially attributable to an increase of $15,207,000 from the 2008 Gerens, Shreeves, Euromost and PCI acquisitions. The significant components of the change were as follows:
| • | An increase in unapplied labor of $16,072,000 including $2,096,000 for Gerens, Shreeves and Euromost. Unapplied labor represents the labor cost of operating staff for time charged to business development, administration, vacation, holiday and other non-billable tasks. This increase was primarily due to the increased staff required to support the increase in revenue. In addition, as a percentage of consulting fees, unapplied labor increased from 11.5% in 2007 to 12.1% in 2008 as a result of a slight decrease in labor utilization. |
| • | An increase in indirect labor expense of $11,964,000 to support the increase in revenue as well as the build-up of corporate staffing in connection with Hill’s growth. This increase included $4,499,000 for Gerens, Shreeves, Euromost and PCI. |
| • | An increase of $3,359,000 in rent expense primarily due to increases of $1,188,000 from the inclusion of Gerens, Shreeves, Euromost and PCI (all acquired in 2008), $359,000 for KJM (acquired May 2007) and $372,000 for expanded offices in the Middle East. |
32
Table of Contents
| • | An increase of $2,583,000 in administrative travel expense related to corporate executive and business development travel in support of the Company’s growth. |
| • | An increase in non-cash stock-based compensation expense of $2,478,000 due primarily to the expense of approximately $1,553,000 booked upon stockholder approval of the 2007 Restricted Stock Grant Plan in the second quarter of 2008. |
| • | An increase in computer equipment, software and support of $1,834,000 due to maintenance and license agreements. |
| • | An increase of $1,819,000 in amortization expense related to acquired intangible assets. The major components of the increase in expense were: $419,000 due to the Gerens acquisition, $184,000 due to the Shreeves acquisition and $962,000 due to the Euromost acquisition. |
| • | An increase in legal fees of $1,722,000 including $294,000 for Gerens, Shreeves and Euromost, an increase of $485,000 for one domestic matter, an increase of $414,000 for international legal and tax matters and an increase of $529,000 for general corporate legal fees. |
| • | An increase of $1,090,000 for bad debt expense including $830,000 from Gerens, Shreeves, Euromost and PCI. |
| • | An increase of $520,000 for accounting and consulting fees due to statutory, Sarbanes-Oxley and internal audit work for our expanded and growing operations. |
| • | Charges totaling $446,000 for due diligence costs related to discontinued acquisitions and acquisitions not closed as of December 31, 2008. |
Equity in Earnings of Affiliates
Our share of the earnings of affiliates, increased $1,437,000, from $2,221,000 in 2007 to $3,658,000 in 2008, primarily due to increased work in Iraq and the formation of Hill TMG.
Our share of the earnings of SBH increased $844,000, from $2,221,000 in 2007 to $3,065,000 in 2008.
Our share of the earnings of Hill TMG was $593,000 in 2008.
Operating Profit
Operating Profit:
| 2008 | 2007 | Change | |||||||||||||||||||
| % of CFR |
% of CFR |
||||||||||||||||||||
| (in thousands) | |||||||||||||||||||||
| Project Management before equity in earnings of affiliates |
$ | 34,419 | 13.9 | % | $ | 22,404 | 16.6 | % | $ | 12,015 | 53.6 | % | |||||||||
| Equity in earnings of affiliates |
3,658 | 1.5 | % | 2,221 | 1.6 | % | 1,437 | 64.7 | % | ||||||||||||
| Total Projects |
38,077 | 15.4 | % | 24,625 | 18.2 | % | 13,452 | 54.6 | % | ||||||||||||
| Construction Claims |
9,480 | 11.0 | % | 8,229 | 12.1 | % | 1,251 | 15.2 | % | ||||||||||||
| Corporate |
(25,359 | ) | (15,242 | ) | (10,117 | ) | 66.4 | % | |||||||||||||
| Total |
$ | 22,198 | 6.6 | % | $ | 17,612 | 8.7 | % | $ | 4,586 | 26.0 | % | |||||||||
Operating profit increased $4,586,000, or 26.0%, to $22,198,000 in 2008, from a profit of $17,612,000 in 2007, principally due to higher CFR and gross profit, partially offset by higher SG&A expenses.
33
Table of Contents
Operating profit from our Project Management business increased $13,452,000, or 54.6%, to $38,077,000 from a profit of $24,625,000 in 2007, which included an increase of $15,721,000 in foreign project management, partially offset by a decrease in domestic project management of $2,269,000. The foreign project management increase included increases of $6,541,000 in Iraq and $6,274,000 in North Africa as a result of the increased fees discussed previously. The increases in Iraq and North Africa included increases in equity from earnings in affiliates of $1,437,000 which is discussed above. In addition, Gerens and Euromost, which were acquired in 2008, generated $3,657,000 in operating profit during 2008. The domestic project management decrease were due primarily to decreases of $1,050,000 in the Western Region and $678,000 in Philadelphia where significant increases in unapplied labor occurred due to a slowdown in work.
Operating profit for the Construction Claims business increased $1,251,000, or 15.2%, to $9,480,000 from a profit of $8,229,000 in 2007 including an increase of $4,257,000 from foreign claims partially offset by a decrease of $3,006,000 for domestic claims. The increase in foreign claims was primarily due to an increase of $4,838,000 in the Middle East where CFR increased by $9,796,000. The decrease in domestic claims was due primarily to decreases of $1,996,000 in New Jersey and $685,000 in the West where CFR decreased by $2,562,000.
Corporate expenses increased by $10,117,000, or 66.4%, to $25,359,000 from $15,242,000 in 2007. This increase was primarily due to:
| • | An increase of $3,976,000 in indirect labor due primarily to staff increases in Finance, Human Resources and Information Technology in support of the Company’s growth including new hires made during 2007 and early 2008 supporting the requirements of becoming a publicly held company. |
| • | An increase of business development and administrative travel of $896,000 in support of the Company’s business growth. |
| • | An increase in computer equipment, software and support of $977,000 due to maintenance and licensing agreements. |
| • | An increase of $664,000 for accounting and consulting fees due to statutory, Sarbanes Oxley, and internal audit work for our expanding and growing organization. |
| • | An increase of $1,333,000 in legal fees, including an increase of $485,000 for one domestic matter and $529,000 in general corporate legal matters. |
| • | An increase of $1,020,000 in non-cash stock based compensation booked in 2008 upon stockholder approval of the 2007 Restricted Stock Grant Plan. |
Interest (Income) Expense, net
Net interest income was $134,000 in 2008 as compared with a net interest expense of $433,000 in 2007, primarily due to interest income generated from cash available from the exercise of our warrants in late 2007 and minimal borrowing on the Company’s senior credit facility for most of 2008.
Income Taxes
In 2008, we recognized an income tax expense of $3,654,000 compared to an expense of $2,788,000 for 2007.
The effective income tax expense rates for 2008 and 2007 were 16.4% and 16.2%, respectively. Our effective tax rate continues to remain low since a substantial portion of our profit comes from foreign operations which are taxed at lower rates, if at all.
In addition, three items materially affected the Company’s effective tax rate during 2008. The Company realized substantial benefits from the reversal of a prior year’s uncertain tax position amounting to $2,506,000 as
34
Table of Contents
required by FIN 48 and unrealized foreign exchange losses of $1,700,000 generated in the United Kingdom which were deductible on the local tax returns. These tax benefits were partially offset by a modification of $1,638,000 to the cash to accrual adjustment which was required when the Company became a publicly-held entity in 2006. Excluding these items our effective tax rate would have been approximately 27% in 2008.
We also realized a significant tax credit in 2007 resulting from the reversal of a prior year’s uncertain tax position amounting to $648,000 as required by FIN 48. Excluding this reversal, our effective tax rate would have been 20% in 2007.
Net Earnings
Our net earnings for 2008 were $17,651,000, or $0.43 per diluted common share based upon 41,148,000 diluted common shares outstanding, as compared to net earnings for 2007 of $14,144,000, or $0.45 per diluted common share based upon 31,387,000 diluted common shares outstanding. The diluted earnings per share for 2008 were unfavorably impacted by a significant increase in diluted shares outstanding as a result of (i) the exercise of substantially all of the Company’s warrants in late 2007, and (ii) the issuance of 2,300,000 shares in connection with the earn-out provisions of the merger agreement with Arpeggio. Net earnings improved by $3,507,000 or 24.8%, which was principally due to an increase in CFR, and an increase in gross profit, partially offset by higher SG&A expenses as a result of our overall growth, an increase in stock-based compensation expense and the income tax charge related to the 2006 cash-to-accrual adjustment.
Liquidity and Capital Resources
The Company has historically funded its business activities with cash flow from operations and borrowings under various credit facilities.
Credit Facilities
On June 30, 2009, the Company replaced the $60,000,000 credit facility that it entered into in 2008 with Bank of America, N.A. with a new credit facility providing the ability to borrow up to $100,000,000. The new credit facility has been made pursuant to the terms of a new credit agreement (the “Credit Agreement”) dated as of June 30, 2009 among the Company, Bank of America, N.A., Capital One, N.A., The PrivateBank and Trust Company and PNC Bank N.A. The Credit Agreement also provides for a letter of credit sub-facility of up to $30,000,000. Obligations under the Credit Agreement are collateralized by all of the Company’s assets, including, without limitation, accounts receivable, equipment, securities, financial assets and the proceeds of the foregoing, as well as by a pledge of 65% of the outstanding capital stock of its wholly owned subsidiary, Hill International S.A. The Credit Agreement expires on June 30, 2012. The Company incurred costs of approximately $1,741,000 in connection with establishing the new credit facility. Such costs have been deferred and are being amortized to interest expense over the life of the loan.
The Credit Agreement provides for Base Rate loans and Eurodollar Rate loans. Base Rate loans bear interest at a fluctuating rate per annum equal to the sum of (a) the highest of (i) the Federal Funds Rate plus 0.5%, (ii) the rate of interest in effect for such day as publicly announced from time to time by Bank of America as its “prime rate” and (iii) the Eurodollar Rate plus 1.00%, plus (b) an Applicable Rate which may vary between 1.75% and 2.50% depending on the Company’s consolidated leverage ratio at the time of the borrowing. Eurodollar Rate loans bear interest at a rate per annum equal to the British Bankers Association LIBOR Rate plus an Applicable Rate which may vary between 2.75% and 3.50% depending on the Company’s consolidated leverage ratio at the time of the borrowing.
The Credit Agreement contains financial covenants regarding the Company’s consolidated net worth, consolidated leverage ratio, consolidated fixed charge coverage ratio and the ratio of consolidated billed and
35
Table of Contents
unbilled accounts receivable to consolidated senior indebtedness, as well as other covenants and certain restrictions on the incurrence of debt, on the making of investments, on the payment of dividends, on transactions with affiliates and other affirmative and negative covenants and events of default customary for facilities of its type. At December 31, 2009, the Company was in compliance with all of the loan covenants.
As of December 31, 2009, the Company had $7,150,000 in outstanding letters of credit which reduced availability under the credit facility. Due to the limitations of the ratio of the Company’s consolidated billed and unbilled accounts receivable to consolidated senior indebtedness, total remaining availability at December 31, 2009 was $38,407,000.
We currently have five additional credit facilities with international financial institutions as follows:
| • | A credit facility with a bank in the Middle East for 11,500,000 AED (approximately $3,131,000 at December 31, 2009) collateralized by certain overseas receivables. The interest rate on that facility is the three-month Emirates InterBank Offer Rate (“EIBOR”), which at December 31, 2009 was 1.49%, plus 3.0%, (or 4.49%) but no less than 5.50%. At December 31, 2009, there were no outstanding borrowings under this facility. The facility also allows for up to 150,000,000 AED (approximately $40,839,000 at December 31, 2009) in Letters of Guarantee of which 55,811,000 AED (approximately $15,195,000 at December 31, 2009) was utilized at December 31, 2009. This facility expires on August 27, 2010. |
| • | The Company also maintains a revolving credit loan payable with a European bank up to €1,000,000 (approximately $1,434,000 at December 31, 2009), with interest rates at 2.50% plus Egnatia Bank’s prime rate of 6.25% (or 8.75%) at December 31, 2009 and interest rates at 2.50% plus Egnatia Bank’s prime rate of 8.00% (or 10.50%) at December 31, 2008, collateralized by certain assets of the Company. The facility also allows for letters of guarantee up to €4,500,000 (approximately $6,454,000) of which nothing had been utilized at December 31, 2009. The loan has an expiration date of April 30, 2010. The Company intends to renew this facility prior to the expiration date. |
| • | The Company also maintains another credit facility with another European bank that allows for €2,000,000 (approximately $2,868,000 at December 31, 2009) of bank guarantees of which €373,000 (approximately $535,000 at December 31, 2009) was utilized at December 31, 2009. The facility has an expiration date of March 31, 2010. The Company does not intend to renew this facility. |
| • | The Company also maintains an unsecured credit facility with a bank in Spain for €750,000 (approximately $1,076,000 at December 31, 2009). The interest rate on that facility is the three-month EURIBOR rate which at December 31, 2009 was 0.7 %, plus 1.8%, or 2.5%. At December 31, 2009 there were no outstanding borrowings under this facility which expires on December 24, 2011. |
| • | Revolving credit loan payable to Barclays Bank PLC up to £500,000 (approximately $804,000 at December 31, 2009) with interest at 2.0% plus the Bank of England rate of 0.5% (or 2.5%) at December 31, 2009 collateralized by cross guarantees of all United Kingdom companies. The loan has an expiration date of March 6, 2010. We intend to renew this facility. |
Additional Capital Requirements
We experience lags between receipt of fees from our clients and payment of our costs. In order to continue our growth, and in light of the cash obligations described above, we have entered into an amended credit agreement that allows for borrowings up to $100,000,000 with a consortium of banks led by Bank of America. However, we may seek additional debt financing beyond this amount.
Sources of Additional Capital
At December 31, 2009, our cash and cash equivalents amounted to approximately $30,923,000. Under certain circumstances, we may be able to increase availability under our Credit Agreement by up to $50,000,000. We cannot provide any assurance that this or any other sources of financing will be available, or if available, that the financing will be on terms acceptable to us.
36
Table of Contents
Cash Flow Activity During the Year Ended December 31, 2009
For the year ended 2009, our cash increased by $10,493,000 to $30,923,000. Cash provided by operations was $14,183,000, cash provided by investing activities was $490,000 and cash used in financing activities was $3,045,000. We also experienced a decrease in cash of $1,135,000 from the effect of foreign currency exchange rate fluctuations.
Operating Activities
Net cash provided by operating activities for the year ended December 31, 2009 was $14,183,000. Cash provided by operations is attributable to consolidated net earnings of $20,183,000 for the period adjusted by non-cash items and working capital changes such as:
| • | depreciation and amortization of $7,343,000; |
| • | equity in earnings of affiliates of $8,222,000; |
| • | bad debt expense of $5,156,000; |
| • | a deferred tax benefit of $319,000; |
| • | stock-based compensation expense of $1,098,000; and |
| • | issuance of restricted stock of $1,013,000. |
Working capital changes which increased cash provided from operations included the following:
| • | a decrease in accounts receivable—affiliates of $1,973,000 due to the timing of collections from SBH and Hill TMG; |
| • | an increase in accounts payable and accrued expenses of $2,071,000, principally due to the growth of the business; |
| • | an increase in retainage payable of $1,059,000 principally related to the timing of retainage payments in New York; and |
| • | an increase in income taxes payable of $1,822,000. |
Working capital changes which decreased cash provided from operations included the following:
| • | an increase in accounts receivable of $13,925,000 due to increased revenue as a result of organic growth and acquisitions; |
| • | an increase in prepaid and other current assets of $1,229,000 primarily due to the timing of payments for various selling, general and administrative expenses; |
| • | a decrease in other current liabilities of $1,301,000; and |
| • | a decrease in deferred revenue of $2,435,000, principally due to the timing of advance payments on projects overseas. |
Investing Activities
Net cash provided by investing activities was $490,000. We spent $2,779,000 to purchase computers, office equipment, furniture and fixtures and used $3,806,000, net of cash acquired, on the Boyken and TRS acquisitions and the acquisition of an additional interest in Gerens. We also received $7,359,000 as distributions from affiliates principally SBH.
Financing Activities
Net cash used in financing activities was $3,045,000. We received $10,186,000 in net borrowings under our credit facilities and we also received $372,000 from the exercise of stock options and purchases under our
37
Table of Contents
Employee Stock Purchase Plan. We made payments on notes payable amounting to $1,219,000. We also spent $9,172,000 to repurchase 2,488,000 shares of our common stock under our repurchase program. Due to bank decreased $1,471,000 due to the timing of certain payments which were disbursed but not immediately funded by the bank.
Arpeggio and Hill Merger
The Merger Agreement provides for Old Hill’s stockholders to receive up to an additional 6,600,000 shares of the combined company’s common stock, contingent upon the combined company attaining the earnings targets shown in the table below.
| Fiscal Year |
Earnings Before Interest and Taxes |
Contingent Shares | |||
| 2006 |
$ | 9,900,000 | 2,300,000 | ||
| 2007 |
13,500,000 | 2,300,000 | |||
| 2008 |
18,400,000 | 1,000,000 | |||
| 2009 |
24,900,000 | 1,000,000 | |||
The Company met the earnings targets for each fiscal year and therefore the Company issued the contingent shares for the 2006, 2007 and 2008 fiscal years to the former stockholders of Old Hill. The final distribution of 1,000,000 shares is expected to occur in the second quarter of 2010.
Recent Accounting Pronouncements
On January 1, 2009, the Company adopted a new accounting standard issued by the FASB related to accounting for business combinations using the acquisition method of accounting (previously referred to as the purchase method). Among the significant changes, this standard requires a redefining of the measurement date of a business combination, expensing direct transaction costs as incurred, and recording a liability for contingent consideration at the measurement date with subsequent re-measurements recorded in the results of operations. This standard also requires costs for business restructuring and exit activities related to the acquired company to be included in the post-combination financial results of operations and also provides new guidance for the recognition and measurement of contingent assets and liabilities in a business combination. In addition, this standard requires several new disclosures, including the reasons for the business combination, the factors that contribute to the recognition of goodwill, the amount of acquisition related third-party expenses incurred, the nature and amount of contingent consideration, and a discussion of pre-existing relationships between the parties. The application of this standard is likely to have a significant impact on how the Company allocates the purchase price of prospective business combinations, including the recognition and measurement of assets acquired and liabilities assumed and the expensing of direct transaction costs and costs to integrate the acquired business.
On January 1, 2009, the Company adopted a new accounting standard issued by the FASB that establishes accounting and reporting standards for noncontrolling interests in a subsidiary in consolidated financial statements. In accordance with this new standard, the Company has provided a new presentation on the face of the consolidated financial statements to separately classify noncontrolling interests within the equity section of the consolidated balance sheets and to separately report the amounts attributable to controlling and noncontrolling interests in the consolidated statements of earnings for all periods presented. The adoption of this standard did not impact earnings per share attributable to the Company’s common stockholders.
In June 2009, the Financial Accounting Standards Board (“FASB”) issued the FASB Accounting Standards Codification (the “ASC”). The ASC has become the single source of non-governmental generally accepted accounting principles (“GAAP”) recognized by the FASB in the preparation of financial statements. The ASC does not supersede the rules or regulation of the Securities and Exchange Commission (“SEC”), therefore, the rules and interpretive releases of the SEC continue to be additional sources of GAAP for the Company. The Company adopted the ASC as of July 1, 2009. The ASC does not change GAAP and did not have an effect on the Company’s financial position, results of operations or cash flows.
38
Table of Contents
On June 30, 2009, the Company adopted a new accounting standard which established general standards of accounting for and disclosure of events that occur after the balance sheet date but before the financial statements are issued or are available to be issued. This guidance was subsequently amended on February 24, 2010 to no longer require disclosure of the date through which an entity has evaluated subsequent events. The effect of the adoption was not material.
In June 2009, the FASB issued a new accounting standard that is to be applied to financial asset transfers on or after the effective date, which is January 1, 2010 for the Company’s financial statements. The standard limits the circumstances in which a financial asset may be de-recognized when the transferor has not transferred the entire financial asset or has continuing involvement with the transferred asset. The concept of a qualifying special-purpose entity, which had previously facilitated sale accounting for certain asset transfers, has been eliminated. The Company expects that adoption of this accounting standard will not have a material effect on its financial position or results of operations.
In June 2009, FASB amended an accounting standard which deals with accounting for variable interest entities. The amendment is effective for reporting periods beginning after November 15, 2009. The amendment changes the process for how an enterprise determines which party consolidates a variable interest entity (“VIE”) to a primarily qualitative analysis. The amendment defines the party that consolidates the VIE (the primary beneficiary) as the party with (1) the power to direct activities of the VIE that most significantly affect the VIE’s economic performance and (2) the obligation to absorb losses of the VIE or the right to receive benefits from the VIE. Upon adoption of the amendment, reporting enterprises must reconsider their conclusions on whether an entity should be consolidated and should a change result, the effect on net assets will be recorded as a cumulative effect adjustment to retained earnings. The Company expects that adoption of this amendment will not have a material effect on its financial position or results of operations.
Quarterly Fluctuations
Our operating results vary from period to period as a result of the timing of projects and the growth of our business. We do not believe that our business is seasonal.
Inflation
Although we are subject to fluctuations in the local currencies of the counties in which we operate, we do not believe that inflation will have a significant effect on our results of operations or our financial position.
Off-Balance Sheet Arrangements
| Total | 2010 | 2011 - 2012 | 2013 - 2014 | 2015 and later | |||||||||||
| (in thousands) | |||||||||||||||
| Performance and advance payment bonds (1) |
$ | 13,569 | $ | 10,493 | $ | 2,060 | $ | 894 | $ | 122 | |||||
| Bid bonds (2) |
6,024 | 6,024 | — | — | — | ||||||||||
| Letters of credit (3) |
7,150 | 5,721 | 347 | 706 | 376 | ||||||||||
| $ | 26,743 | $ | 22,238 | $ | 2,407 | $ | 1,600 | $ | 498 | ||||||
| (1) | Represents guarantee of service performance bonds issued through international banks required under certain international contracts. |
| (2) | Represents bid bonds issued through international banks as part of the bidding process for new work to demonstrate the financial strength of the Company. These bonds are usually outstanding for short periods. |
| (3) | Represents letters of credit issued through a domestic bank in connection with securing a judgment against the Company and in support for certain performance, advance payments and bid bonds. |
39
Table of Contents
Contractual Obligations
| Total | 2010 | 2011 - 2012 | 2013 - 2014 | 2015 and later | |||||||||||
| (in thousands) | |||||||||||||||
| Long-term debt obligations |
$ | 26,795 | $ | 1,972 | $ | 24,823 | $ | — | $ | — | |||||
| Interest expense on notes payable (1) |
2,148 | 862 | 1,286 | — | — | ||||||||||
| Operating lease obligations (2) |
24,897 | 8,236 | 11,383 | 4,341 | 937 | ||||||||||
| $ | 53,840 | $ | 11,070 | $ | 37,492 | $ | 4,341 | $ | 937 | ||||||
| (1) | Estimated using the interest rates in effect at December 31, 2009. |
| (2) | Represents future minimum rental commitments under non-cancelable leases which comprise the majority of the operating lease obligations presented above. The Company expects to fund these commitments with existing cash and cash flow from operations. |
| Item 7A. | Quantitative and Qualitative Disclosures About Market Risk. |
The Company is exposed to risks associated with foreign currency fluctuations and changes in interest rates.
Foreign Exchange Rates
We are exposed to foreign currency exchange rate risk resulting from our operations outside of the U.S. which are denominated in British pounds sterling, Euros, U.A. E. dirhams, Libyan dinars, Polish zloty as well as other currencies. We do not comprehensively hedge our exposure to currency rate changes; however, we limit exposure to foreign currency fluctuations in most of our contracts through provisions that require client payments to be in currencies corresponding to the currency in which costs are incurred. As a result, we do not hedge foreign currency cash flows for contract work performed. The functional currency of our significant foreign operations is the local currency.
Interest Rates
All of our borrowings under our revolving credit facilities bear interest at variable rates. If market interest rates had changed by 100 basis points, interest expense and our cash flows would have changed by $265,000 and $157,000, respectively.
40
Table of Contents
| Item 8. | Financial Statements and Supplementary Data. |
HILL INTERNATIONAL, INC. AND SUBSIDIARIES
CONSOLIDATED BALANCE SHEETS
(In thousands, except share and per share data)
| December 31, 2009 |
December 31, 2008 |
|||||||
| Assets | ||||||||
| Cash and cash equivalents |
$ | 30,923 | $ | 20,430 | ||||
| Cash—restricted |
2,690 | 2,613 | ||||||
| Accounts receivable, less allowance for doubtful accounts of $9,780 and $5,999 |
130,900 | 118,124 | ||||||
| Accounts receivable—affiliate |
7,163 | 9,136 | ||||||
| Prepaid expenses and other current assets |
10,146 | 10,043 | ||||||
| Income taxes receivable |
902 | 578 | ||||||
| Deferred tax asset |
878 | 568 | ||||||
| Total current assets |
183,602 | 161,492 | ||||||
| Property and equipment, net |
11,576 | 11,776 | ||||||
| Cash—restricted, net of current portion |
1,711 | 1,933 | ||||||
| Retainage receivable, less allowance for doubtful accounts of $38 and $38 |
1,774 | 915 | ||||||
| Acquired intangibles, net |
21,885 | 19,774 | ||||||
| Goodwill |
46,025 | 41,290 | ||||||
| Investments |
13,196 | 11,854 | ||||||
| Deferred tax asset |
4,162 | — | ||||||
| Other assets |
7,608 | 5,007 | ||||||
| Total assets |
$ | 291,539 | $ | 254,041 | ||||
| Liabilities and Stockholders’ Equity | ||||||||
| Due to bank |
$ | 1,449 | $ | 2,906 | ||||
| Current maturities of notes payable |
1,972 | 1,344 | ||||||
| Accounts payable and accrued expenses |
53,158 | 49,606 | ||||||
| Income taxes payable |
4,722 | 2,607 | ||||||
| Deferred revenue |
15,401 | 16,617 | ||||||
| Deferred income taxes current |
432 | — | ||||||
| Other current liabilities |
5,523 | 7,483 | ||||||
| Total current liabilities |
82,657 | 80,563 | ||||||
| Notes payable, net of current maturities |
24,823 | 14,637 | ||||||
| Retainage payable |
2,684 | 1,359 | ||||||
| Deferred tax liabilities |
8,728 | 4,569 | ||||||
| Deferred revenue |
2,537 | 3,559 | ||||||
| Other liabilities |
10,470 | 10,338 | ||||||
| Total liabilities |
131,899 | 115,025 | ||||||
| Commitments and contingencies |
||||||||
| Stockholders’ equity: |
||||||||
| Preferred stock, $.0001 par value; 1,000,000 shares authorized, none issued |
— | — | ||||||
| Common stock, $.0001 par value; 75,000,000 shares authorized, 43,530,113 shares and 41,715,185 shares issued at December 31, 2009 and 2008, respectively |
4 | 4 | ||||||
| Additional paid-in capital |
121,230 | 114,555 | ||||||
| Retained earnings |
65,427 | 45,957 | ||||||
| Accumulated other comprehensive loss |
(12,588 | ) | (15,744 | ) | ||||
| 174,073 | 144,772 | |||||||
| Less treasury stock of 4,251,854 shares and 1,764,111 shares at December 31, 2009 and 2008, respectively, at cost |
(18,438 | ) | (9,266 | ) | ||||
| Hill International, Inc. share of equity |
155,635 | 135,506 | ||||||
| Noncontrolling interests |
4,005 | 3,510 | ||||||
| Total equity |
159,640 | 139,016 | ||||||
| Total liabilities and stockholders’ equity |
$ | 291,539 | $ | 254,041 | ||||
See accompanying notes to consolidated financial statements.
41
Table of Contents
HILL INTERNATIONAL, INC. AND SUBSIDIARIES
CONSOLIDATED STATEMENTS OF EARNINGS
(In thousands, except per share data)
| Year ended December 31, | ||||||||||||
| 2009 | 2008 | 2007 | ||||||||||
| (Revised - Note 2) | (Revised - Note 2) | |||||||||||
| Consulting fee revenue |
$ | 364,010 | $ | 333,882 | $ | 203,118 | ||||||
| Reimbursable expenses |
57,772 | 46,600 | 87,205 | |||||||||
| Total revenue |
421,782 | 380,482 | 290,323 | |||||||||
| Cost of services |
209,052 | 183,485 | 107,447 | |||||||||
| Reimbursable expenses |
57,772 | 46,600 | 87,205 | |||||||||
| Total direct expenses |
266,824 | 230,085 | 194,652 | |||||||||
| Gross profit |
154,958 | 150,397 | 95,671 | |||||||||
| Selling, general and administrative expenses |
136,683 | 131,857 | 80,280 | |||||||||
| Equity in earnings of affiliates |
(8,222 | ) | (3,658 | ) | (2,221 | ) | ||||||
| Operating profit |
26,497 | 22,198 | 17,612 | |||||||||
| Interest expense (income), net |
1,737 | (134 | ) | 433 | ||||||||
| Earnings before provision for income taxes |
24,760 | 22,332 | 17,179 | |||||||||
| Provision for income taxes |
4,577 | 3,654 | 2,788 | |||||||||
| Consolidated net earnings |
20,183 | 18,678 | 14,391 | |||||||||
| Less: net earnings—non controlling interests |
713 | 1,027 | 247 | |||||||||
| Net earnings attributable to Hill International, Inc. |
$ | 19,470 | $ | 17,651 | $ | 14,144 | ||||||
| Basic earnings per common share |
$ | 0.49 | $ | 0.43 | $ | 0.53 | ||||||
| Basic weighted average common shares outstanding |
39,659 | 40,809 | 26,720 | |||||||||
| Diluted earnings per common share |
$ | 0.49 | $ | 0.43 | $ | 0.45 | ||||||
| Diluted weighted average common shares outstanding |
40,124 | 41,148 | 31,387 | |||||||||
See accompanying notes to consolidated financial statements.
42
Table of Contents
HILL INTERNATIONAL, INC. AND SUBSIDIARIES
CONSOLIDATED STATEMENT OF STOCKHOLDERS’ EQUITY
For the Years Ended December 31, 2009, 2008 and 2007
(in thousands)
| Common Stock | Additional Paid-in Capital |
Retained Earnings |
Accumulated Other Comprehensive Earnings/ (Loss) |
Treasury Stock | Shares Held in Escrow |
Hill Share of Stockholders’ Equity |
Noncontrolling Interests |
Total Stockholders’ Equity |
|||||||||||||||||||||||||||||||||
| Shares Issued |
Amount | Shares | Amount | Shares | Amount | ||||||||||||||||||||||||||||||||||||
| Balance—December 30, 2006 |
22,830 | $ | 2 | $ | 38,058 | $ | 14,162 | $ | 491 | 530 | $ | (2,812 | ) | 1,740 | $ | (3,865 | ) | $ | 46,036 | $ | 286 | $ | 46,322 | ||||||||||||||||||
| Net earnings |
— | — | — | 14,144 | — | — | — | — | — | 14,144 | 247 | 14,391 | |||||||||||||||||||||||||||||
| Dividends paid to minority stockholders |
— | — | — | — | — | — | — | — | — | — | (166 | ) | (166 | ) | |||||||||||||||||||||||||||
| Issuance of common stock for earnout |
2,300 | 1 | (1 | ) | — | — | — | — | — | — | — | — | — | ||||||||||||||||||||||||||||
| Stock-based compensation expense |
— | — | 337 | — | — | — | — | — | — | 337 | — | 337 | |||||||||||||||||||||||||||||
| Stock issued to Board of Directors |
30 | — | 210 | — | — | — | — | — | — | 210 | — | 210 | |||||||||||||||||||||||||||||
| Transfer of shares held in escrow |
— | — | — | — | — | 69 | (515 | ) | (69 | ) | 515 | — | — | — | |||||||||||||||||||||||||||
| Release of shares held in escrow |
— | — | — | — | — | — | — | (916 | ) | — | — | — | — | ||||||||||||||||||||||||||||
| Exercise of warrants |
13,576 | 1 | 67,877 | — | — | — | — | — | — | 67,878 | — | 67,878 | |||||||||||||||||||||||||||||
| Cashless exercise of units |
217 | — | — | — | — | — | — | — | — | — | — | — | |||||||||||||||||||||||||||||
| Other comprehensive loss |
— | — | — | — | (234 | ) | — | — | — | — | (234 | ) | (108 | ) | (342 | ) | |||||||||||||||||||||||||
| Balance—December 31, 2007 |
38,953 | 4 | 106,481 | 28,306 | 257 | 599 | (3,327 | ) | 755 | (3,350 | ) | 128,371 | 259 | 128,630 | |||||||||||||||||||||||||||
| Net earnings |
— | — | — | 17,651 | — | — | — | — | — | 17,651 | 1,027 | 18,678 | |||||||||||||||||||||||||||||
| Noncontrolling interests arising from acquisition of Gerens |
— | — | — | — | — | — | — | — | — | — | 2,582 | 2,582 | |||||||||||||||||||||||||||||
| Issuance of common stock for earnout |
2,300 | — | — | — | — | — | — | — | — | — | — | — | |||||||||||||||||||||||||||||
| Stock-based compensation expense |
— | — | 1,630 | — | — | — | — | — | — | 1,630 | — | 1,630 | |||||||||||||||||||||||||||||
| Issuance of restricted stock |
67 | — | 1,099 | — | — | — | — | — | — | 1,099 | — | 1,099 | |||||||||||||||||||||||||||||
| Stock options exercised |
19 | — | 146 | — | — | — | — | — | — | 146 | — | 146 | |||||||||||||||||||||||||||||
| Shares issued under employee stock purchase plan |
159 | — | 959 | — | — | — | — | — | — | 959 | — | 959 | |||||||||||||||||||||||||||||
| Shares issued in satisfaction of contingent consideration |
134 | — | 1,955 | — | — | — | — | — | — | 1,955 | — | 1,955 | |||||||||||||||||||||||||||||
| Shares issued for acquisition of PCI |
83 | — | 1,300 | — | — | — | — | — | — | 1,300 | — | 1,300 | |||||||||||||||||||||||||||||
| Transfer of shares held in escrow |
— | — | — | — | — | — | — | (452 | ) | 3,350 | 3,350 | — | 3,350 | ||||||||||||||||||||||||||||
| Purchase of treasury stock |
— | — | — | — | — | 1,165 | (5,939 | ) | — | — | (5,939 | ) | — | (5,939 | ) | ||||||||||||||||||||||||||
| Tax effect of imputed interest |
— | — | 985 | — | — | — | — | — | — | 985 | — | 985 | |||||||||||||||||||||||||||||
| Other comprehensive loss |
— | — | — | — | (16,001 | ) | — | — | — | — | (16,001 | ) | (358 | ) | (16,359 | ) | |||||||||||||||||||||||||
| Balance—December 31, 2008 |
41,715 | 4 | 114,555 | 45,957 | (15,744 | ) | 1,764 | (9,266 | ) | 303 | — | 135,506 | 3,510 | 139,016 | |||||||||||||||||||||||||||
| Net earnings |
— | — | — | 19,470 | — | — | — | — | — | 19,470 | 713 | 20,183 | |||||||||||||||||||||||||||||
| Issuance of common stock for earnout |
1,000 | — | — | — | — | — | — | — | — | — | — | — | |||||||||||||||||||||||||||||
| Issuance of restricted stock |
66 | — | 1,013 | — | — | — | — | — | — | 1,013 | — | 1,013 | |||||||||||||||||||||||||||||
| Stock issued to Board of Directors |
66 | — | 274 | — | — | — | — | — | — | 274 | — | 274 | |||||||||||||||||||||||||||||
| Stock-based compensation expense |
— | — | 825 | — | — | — | — | — | — | 825 | — | 825 | |||||||||||||||||||||||||||||
| Shares issued under employee stock purchase plan |
121 | — | 372 | — | — | — | — | — | — | 372 | — | 372 | |||||||||||||||||||||||||||||
| Shares issued in satisfaction of contingent consideration |
133 | — | 1,650 | — | — | — | — | — | — | 1,650 | — | 1,650 | |||||||||||||||||||||||||||||
| Shares issued for acquisitions |
429 | — | 2,736 | — | — | — | — | — | — | 2,736 | — | 2,736 | |||||||||||||||||||||||||||||
| Tax effect of imputed interest |
— | 131 | — | — | — | — | — | — | 131 | — | 131 | ||||||||||||||||||||||||||||||
| Tax effect of restricted stock |
— | (326 | ) | — | — | — | — | — | — | (326 | ) | — | (326 | ) | |||||||||||||||||||||||||||
| Purchase of treasury stock |
— | — | — | — | — | 2,488 | (9,172 | ) | — | — | (9,172 | ) | — | (9,172 | ) | ||||||||||||||||||||||||||
| Other comprehensive income (loss) |
— | — | — | — | 3,156 | — | — | — | — | 3,156 | (218 | ) | 2,938 | ||||||||||||||||||||||||||||
| Balance—December 31, 2009 |
43,530 | $ | 4 | $ | 121,230 | $ | 65,427 | $ | (12,588 | ) | 4,252 | $ | (18,438 | ) | 303 | $ | — | $ | 155,635 | $ | 4,005 | $ | 159,640 | ||||||||||||||||||
See accompanying notes to consolidated financial statements.
43
Table of Contents
HILL INTERNATIONAL, INC. AND SUBSIDIARIES
CONSOLIDATED STATEMENTS OF COMPREHENSIVE EARNINGS
For the Years Ended December 31, 2009, 2008 and 2007
| 2009 | 2008 | 2007 | ||||||||||
| Consolidated net earnings |
$ | 20,183 | $ | 18,678 | $ | 14,391 | ||||||
| Foreign currency translation, net of tax |
2,967 | (16,359 | ) | (342 | ) | |||||||
| Other, net |
(29 | ) | — | — | ||||||||
| Comprehensive earnings |
23,121 | 2,319 | 14,049 | |||||||||
| Comprehensive earnings attributable to noncontrolling interests |
495 | 669 | 139 | |||||||||
| Comprehensive earnings attributable to Hill International, Inc. |
$ | 22,626 | $ | 1,650 | $ | 13,910 | ||||||
See accompanying notes to consolidated financial statements.
44
Table of Contents
HILL INTERNATIONAL, INC. AND SUBSIDIARIES
CONSOLIDATED STATEMENTS OF CASH FLOWS
For the Years ended December 31, 2009, 2008 and 2007
(In thousands)
| 2009 | 2008 | 2007 | ||||||||||
| Cash flows from operating activities: |
||||||||||||
| Consolidated net earnings |
$ | 20,183 | $ | 18,678 | $ | 14,391 | ||||||
| Adjustments to reconcile net earnings to net cash provided by (used in) operating activities: |
||||||||||||
| Depreciation and amortization |
7,343 | 6,385 | 3,740 | |||||||||
| Equity in earnings of affiliates |
(8,222 | ) | (3,658 | ) | (2,221 | ) | ||||||
| Provision for bad debts |
5,156 | 3,361 | 2,271 | |||||||||
| Deferred tax provision |
319 | (4,004 | ) | 338 | ||||||||
| Stock based compensation |
1,098 | 1,630 | 337 | |||||||||
| Issuance of restricted stock |
1,013 | 1,099 | 123 | |||||||||
| Changes in operating assets and liabilities, net of acquisitions: |
||||||||||||
| Accounts receivable |
(13,925 | ) | (23,940 | ) | (20,719 | ) | ||||||
| Accounts receivable—affiliate |
1,973 | (5,742 | ) | (2,703 | ) | |||||||
| Prepaid expenses and other current assets |
(1,229 | ) | (4,278 | ) | (1,233 | ) | ||||||
| Income taxes receivable |
(321 | ) | (29 | ) | (550 | ) | ||||||
| Retainage receivable |
(859 | ) | (95 | ) | 10 | |||||||
| Other assets |
480 | (1,652 | ) | (2,216 | ) | |||||||
| Accounts payable and accrued expenses |
2,071 | 3,078 | 2,836 | |||||||||
| Income taxes payable |
1,822 | (3,531 | ) | 1,173 | ||||||||
| Deferred revenue |
(2,435 | ) | 1,621 | 5,223 | ||||||||
| Other current liabilities |
(1,301 | ) | (1,302 | ) | 2,145 | |||||||
| Retainage payable |
1,059 | 544 | 286 | |||||||||
| Other liabilities |
(42 | ) | 1,029 | (336 | ) | |||||||
| Net cash flow provided by (used in) operating activities |
14,183 | (10,806 | ) | 2,895 | ||||||||
| Cash flows from investing activities: |
||||||||||||
| Purchase of businesses, net of cash acquired |
(3,806 | ) | (36,937 | ) | (8,499 | ) | ||||||
| Distributions from affiliate |
7,359 | 2,844 | 1,528 | |||||||||
| Restricted cash |
— | — | 3,350 | |||||||||
| Purchase in minority interest in Knowles |
— | — | (58 | ) | ||||||||
| Contributions to affiliate |
(284 | ) | — | — | ||||||||
| Payments for purchase of property and equipment |
(2,779 | ) | (6,882 | ) | (3,121 | ) | ||||||
| Net cash flow provided by (used in) investing activities |
490 | (40,975 | ) | (6,800 | ) | |||||||
| Cash flows from financing activities: |
||||||||||||
| Due to bank |
(1,471 | ) | 2,047 | 324 | ||||||||
| Payments on notes payable |
(1,219 | ) | (901 | ) | (711 | ) | ||||||
| Net borrowings on revolving loans |
10,186 | 13,888 | (7,664 | ) | ||||||||
| Deferred loan costs |
(1,741 | ) | — | — | ||||||||
| Dividends paid to minority stockholders |
— | — | (166 | ) | ||||||||
| Proceeds from exercise of stock options and warrants |
— | — | 67,878 | |||||||||
| Proceeds from stock issued under employee stock purchase plan |
372 | 113 | — | |||||||||
| Purchase of treasury stock under stock repurchase program |
(9,172 | ) | (5,939 | ) | — | |||||||
| Net cash flow (used in) provided by financing activities |
(3,045 | ) | 9,208 | 59,661 | ||||||||
| Effect of exchange rate changes on cash |
(1,135 | ) | (3,125 | ) | (847 | ) | ||||||
| Net increase (decrease) in cash and cash equivalents |
10,493 | (45,698 | ) | 54,909 | ||||||||
| Cash and cash equivalents—beginning of year |
20,430 | 66,128 | 11,219 | |||||||||
| Cash and cash equivalents—end of year |
$ | 30,923 | $ | 20,430 | $ | 66,128 | ||||||
See accompanying notes to consolidated financial statements.
45
Table of Contents
HILL INTERNATIONAL, INC.
NOTES TO CONSOLIDATED FINANCIAL STATEMENTS
Note 1—Company
Hill International, Inc. (“Hill” or “the Company”) is a construction consulting firm headquartered in Marlton, New Jersey that provides both fee-based project management and construction claims consulting services to clients worldwide. Hill’s clients include the U.S. federal government, U.S. state and local governments, foreign governments and the private sector. The Company is organized into two key operating divisions: the Project Management Group and the Construction Claims Group.
Note 2—Summary of Significant Accounting Policies
(a) Basis of Presentation
The accompanying consolidated financial statements were prepared in accordance with accounting principles generally accepted in the United States. The consolidated financial statements include the accounts of Hill International, Inc. and its majority owned subsidiaries. All intercompany balances and transactions have been eliminated in consolidation.
During 2009, the Company began charging a portion of depreciation and amortization expense, which had previously been reflected in selling, general and administrative expenses, to cost of services. As a result, the 2008 and 2007 consolidated statements of earnings have been revised to increase cost of services and decrease selling, general and administrative expenses by $757,000 and $623,000, respectively; gross profit also declined by the same amounts in those years. There was no effect on operating profit or consolidated net earnings in those years.
The Company was incorporated in Delaware on April 2, 2004 as Arpeggio Acquisition Corporation (“Arpeggio”), a specified purpose acquisition corporation, the objective of which was to acquire an operating business in the United States or Canada.
Merger and Accounting Treatment
On June 28, 2006, Arpeggio consummated a merger with Hill International, Inc., a Delaware corporation (“Old Hill”), in which Old Hill merged with and into Arpeggio pursuant to an Agreement and Plan of Merger dated December 5, 2005, as amended (the “Merger Agreement”), among Arpeggio, Old Hill and certain stockholders of Old Hill. The stockholders of Old Hill received 14,500,000 shares of Arpeggio’s common stock in exchange for all of the outstanding common shares of Old Hill.
Twelve percent or 1,740,000 of the 14,500,000 shares of Arpeggio common stock issued to the Old Hill stockholders at the time of the merger were placed into escrow to secure the indemnity rights of Arpeggio under the Merger Agreement and are governed by the terms of an escrow agreement. The shares were divided into two tranches: (a) 1,450,000 shares to cover non-tax indemnities (“Basic Indemnity Shares”) and (b) 290,000 shares to cover tax indemnities (“Tax Indemnity Shares”). These shares, minus any shares applied in satisfaction of a claim for indemnification, were to be returned to the stockholders on the following dates: April 30, 2007 for the Basic Indemnity Shares and December 31, 2010 for the Tax Indemnity Shares. As of December 31, 2009, a total of 1,366,965 of the Basic Indemnity Shares have been released to the stockholders and a total of 69,540 shares have been placed in treasury in satisfaction of certain indemnification claims. The remaining 13,495 Basic Indemnity Shares and 290,000 Tax Indemnity Shares have been retained in escrow.
46
Table of Contents
The Merger Agreement also provides for Old Hill’s stockholders to receive up to an additional 6,600,000 shares of the combined company’s common stock, contingent upon the combined company attaining certain earnings targets as follows:
| Fiscal year |
Earnings before interest and taxes | Contingent shares | |||
| 2006 |
$ | 9,900,000 | 2,300,000 | ||
| 2007 |
13,500,000 | 2,300,000 | |||
| 2008 |
18,400,000 | 1,000,000 | |||
| 2009 |
24,900,000 | 1,000,000 | |||
The Company met the earnings targets for the fiscal year ended December 30, 2006 and for the years ended December 31, 2007, 2008 and 2009, and therefore the Company issued 2,300,000 shares of its common stock in each of 2007 and 2008 and issued 1,000,000 shares in 2009. The Company expects to issue the final 1,000,000 shares in the second quarter of 2010.
| (b) | Use of Estimates |
The preparation of financial statements in conformity with accounting principles generally accepted in the United States requires management to make estimates and assumptions that affect the reported amounts of assets and liabilities and disclosure of contingent assets and liabilities at the date of the financial statements and the reported amounts of revenue and expenses during the reporting period. Actual results could differ from those estimates. The estimates affecting the consolidated financial statements that are particularly significant include revenue recognition, allocation of purchase price to acquired intangibles and goodwill, recoverability of long-lived assets, income taxes, allowance for doubtful accounts and commitments and contingencies.
| (c) | Foreign Currency Translations and Transactions |
Assets and liabilities of all foreign operations are translated at year-end rates of exchange, and the statements of operations are translated at the average rates of exchange for the year. Gains or losses resulting from translating foreign currency financial statements are accumulated in a separate component of stockholders’ equity until the entity is sold or substantially liquidated.
Gains or losses from foreign currency transactions (transactions denominated in a currency other than the entity’s local currency) are included in net earnings.
| (d) | Fair Value of Financial Instruments |
The fair value of financial instruments, which primarily consists of cash and cash equivalents, accounts receivable and accounts payable, approximates carrying value due to the short-term nature of the instruments. The carrying value of long-term debt approximates its fair value as the interest rate is variable.
| (e) | Cash and Cash Equivalents |
Cash and cash equivalents include cash on hand and investments in money market funds and investment grade securities held with high quality financial institutions. The Company considers all highly liquid instruments purchased with a remaining maturity of three months or less at the time of purchase to be cash equivalents.
| (f) | Restricted Cash |
Restricted cash primarily represents advance payments from clients required to be maintained in foreign bank accounts to serve as collateral for bonds or guarantees on several projects. The cash will remain restricted until the respective project has been completed, which typically is greater than one year.
47
Table of Contents
| (g) | Concentrations of Credit Risk |
Financial instruments that potentially subject the Company to concentrations of credit risk consist principally of cash investments and accounts receivable.
The Company maintains its cash accounts with high quality financial institutions. Although the Company currently believes that the financial institutions, with which it does business, will be able to fulfill their commitments to it, there is no assurance that those institutions will be able to continue to do so.
The Company provides professional services, under contractual arrangements, to domestic and foreign governmental units, institutions and the private sector. To reduce credit risk, the Company performs ongoing credit evaluations of its clients and does not require collateral beyond customary retainers.
The Company had one client that accounted for 11% of total revenue in 2009, no client that accounted for 10% or more of total revenue in 2008 and one client that accounted for 17% of total revenue in 2007.
The Company had one client that accounted for 17% of accounts receivable at December 31, 2009 and no clients that accounted for 10% or more of accounts receivable at December 31, 2008.
The Company has several contracts with U.S. federal government agencies that accounted for 11%, 12%, and 12% of total revenue during the years ended December 31, 2009, 2008 and 2007, respectively.
| (h) | Allowance for Doubtful Accounts |
The allowance for doubtful accounts is an estimate prepared by management based on identification of the collectibility of specific accounts and the overall condition of the receivable portfolios. When evaluating the adequacy of the allowance for doubtful accounts, the Company specifically analyzes trade receivables, including retainage receivable, historical bad debts, client credits, client concentrations, client credit worthiness, current economic trends and changes in client payment terms. If the financial condition of clients were to deteriorate, resulting in an impairment of their ability to make payments, additional allowances may be required. Likewise, should the Company determine that it would be able to realize more of its receivables in the future than previously estimated, an adjustment to the allowance would increase earnings in the period such determination was made. The allowance for doubtful accounts is reviewed on a quarterly basis and adjustments are recorded as deemed necessary.
| (i) | Property and Equipment |
Property and equipment is stated at cost, less accumulated depreciation and amortization. Depreciation and amortization is provided over the estimated useful lives of the assets as follows:
| Method |
Estimated Useful Life | |||
| Furniture and equipment |
Straight-line | 10 years | ||
| Leasehold improvements |
Straight-line | Shorter of estimated useful life or lease term | ||
| Computer equipment and software |
Straight-line | 3 to 5 years | ||
| Automobiles |
Straight-line | 5 years |
The Company capitalizes costs associated with internally developed and/or purchased software systems that have reached the application development stage and meet recoverability tests. Capitalized costs include external direct costs of materials and services utilized in developing or obtaining internal-use software, payroll and payroll-related expenses for employees who are directly associated with and devote time to the internal-use software project. Capitalization of such costs begins when the preliminary project stage is complete and ceases no later than the point at which the project is substantially complete and ready for its intended purpose. Costs for general and administrative, overhead, maintenance and training, as well as the cost of software that does not add functionality to existing systems, are expensed as incurred.
48
Table of Contents
Upon retirement or other disposition of these assets, the cost and related depreciation are removed from the accounts and the resulting gain or loss, if any, is reflected in results of operations. Expenditures for maintenance, repairs and renewals of minor items are charged to expense as incurred. Major renewals and improvements are capitalized.
| (j) | Retainage Receivable |
Retainage receivable represents balances billed but not paid by clients pursuant to retainage provisions in the construction management contracts and will be due upon completion of specific tasks or the completion of the contract. The current portion of retainage receivable is included in accounts receivable in the consolidated balance sheets. The long-term portion of retainage receivable is included in retainage receivable in the consolidated balance sheets.
| (k) | Long-Lived Assets |
Acquired intangible assets consist of contract rights, client related intangibles and trade names arising from the Company’s acquisitions. Contract rights represent the fair value of contracts in progress and backlog of an acquired entity. These assets are amortized over their estimated lives which range from three to ten years.
The Company reviews long-lived assets to be held-and-used for impairment whenever events or changes in circumstances indicate that the carrying amount of the assets may not be recoverable. If the sum of the undiscounted expected future cash flows over the remaining useful life of a long-lived asset is less than its carrying amount, the asset is considered to be impaired. Impairment losses are measured as the amount by which the carrying amount of the asset exceeds the fair value of the asset. When fair values are not available, the Company estimates fair value using the expected future cash flow discounted at a rate commensurate with the risks associated with the recovery of the asset. Assets to be disposed of are reported at the lower of carrying amount or fair value less costs to sell.
| (l) | Goodwill |
Goodwill consists of the excess of cost over the fair value of net assets acquired in business combinations accounted for as purchases.
The Company performs an annual impairment test for goodwill. The first step of the impairment test requires that the Company determine the fair value of each reporting unit, and compare the fair value to the reporting unit’s carrying amount. To the extent the carrying amount of a reporting unit exceeds its fair value, an indication exists that the reporting unit’s goodwill may be impaired and the Company must perform a second more detailed assessment. The second assessment involves allocating the reporting unit’s fair value to all of its recognized and unrecognized assets and liabilities in order to determine the implied fair value of the reporting unit’s goodwill as of the assessment date. The implied fair value of the reporting unit’s goodwill is then compared to the carrying amount of goodwill to quantify an impairment charge as of the assessment date.
Application of the goodwill impairment test requires significant judgments including estimation of future cash flows, which is dependent on internal forecasts, estimation of the long-term rate of growth for the businesses, the useful life over which cash flows will occur, and determination of the Company’s weighted average cost of capital. Changes in these estimates and assumptions could materially affect the determination of fair value and/or conclusions on goodwill impairment for each reporting unit. The Company performed its annual impairment test effective July 1, 2009 and noted no impairment for either of its reporting units. In the future, the Company will continue to perform the annual test during its fiscal third quarter unless events or circumstances indicate an impairment may have occurred before that time.
49
Table of Contents
| (m) | Investments |
Gerens Management Group, S.A.
In connection with the 2008 acquisition of Gerens Management Group, S.A. (“Gerens”), the Company obtained the following investments:
| • | Concessia, Cartera y Gestion de Infrastructuras, S.A.—Gerens has paid $1,695,000 for a 5.16% interest in this entity. This entity will invest in the equity of companies which finance, construct and operate various public and private infrastructure projects. The payment represents 25% of the total required capital contribution. Gerens has accrued the remaining commitment of approximately $5,084,000 and has included that amount in the cost of the investment and in other liabilities in the accompanying consolidated balance sheet. |
| • | Neuvo Hospital de Burgos, S.A.—Gerens has paid $645,000 for a 5% interest in this entity. Upon completion of construction, this entity will operate the hospital for a period of up to 27 years. The payment represents 25% of the total required capital contribution. Gerens has accrued the remaining commitment of approximately $1,932,000 and has included that amount in the cost of the investment and in other liabilities in the accompanying consolidated balance sheet. |
| • | Nuevo Parque de Bomberos Mallorca, S.A.—Gerens’ investment amounts to approximately $271,000 which represents a 10% fully-paid interest in this entity which will construct and finance certain public works facilities located in Mallorca. Upon completion of the construction phase, the facilities will be sold to the municipality. |
Stanley Baker Hill, LLC
The Company owns a one-third interest in Stanley Baker Hill, LLC (“SBH”), which is accounted for using the equity method. SBH was formed in February 2004 for the purpose of providing various architect-engineer and construction management services in connection with the Iraq Reconstruction Program.
Hill/TMG Joint Venture
The Company owns a 50% interest in the members’ equity of Hill/TMG Joint Venture (“Hill TMG”), which is accounted for using the equity method. Hill TMG was formed in May 2008 between Talaat Moustafa Group Holding Co. (“TMG”) and Hill. Hill TMG is managing the construction of several of TMG’s largest developments in Egypt and elsewhere in the Middle East.
Other
The Company will, in the ordinary course, form joint ventures for specific projects. These joint ventures typically require limited or no investment and provide a pass-through for the Company’s billings. Any distributions in excess of the Company’s billings are accounted for as income when received.
| (n) | Due to Bank |
Under the Company’s cash-management system, certain cash accounts reflect credit balances to the extent checks were disbursed but not immediately funded at the bank. The Company manages this process daily and ensures all checks are funded when presented. The amounts of these credit balances were approximately $1,449,000 and $2,906,000 at December 31, 2009 and 2008, respectively.
| (o) | Deferred Revenue |
In certain instances the Company may collect advance payments from clients for future services. Upon receipt, the payments are reflected as deferred revenue in the Company’s consolidated balance sheets. As the services are performed, the Company reduces the balance and recognizes revenue.
50
Table of Contents
| (p) | Deferred Rent |
Rent expenses for operating leases which include scheduled rent increases is determined by expensing the total amount of rent due over the life of the operating lease on a straight-line basis. The difference between the rent paid under the terms of the lease and the rent expensed on a straight-line basis is recorded as a liability. The non-current portion of deferred rent at December 31, 2009 and 2008 was $1,057,000 and $745,000, respectively, and is included in other liabilities on the consolidated balance sheets. The current portion of deferred rent at December 31, 2009 and 2008 was $262,000 and $268,000, respectively, and is included in other current liabilities on the consolidated balance sheets.
| (q) | Income Taxes |
The Company estimates income taxes in each of the jurisdictions in which it operates. This process involves estimating its actual current tax exposure together with assessing temporary differences resulting from differing treatment of items for tax and accounting purposes. These differences result in deferred tax assets and liabilities, which are included within the Company’s consolidated balance sheets. The Company assesses the likelihood that the deferred tax assets will be recovered from future taxable income and to the extent it believes recovery is not likely, the Company establishes a valuation allowance. To the extent the Company establishes a valuation allowance in a period, it must include an expense within the tax provision in the consolidated statements of earnings. The Company has recorded a valuation allowance to reduce the deferred tax asset to an amount that is more likely to be realized in future years. If the Company determines in the future that it is more likely that the deferred tax assets subject to the valuation allowance will be realized, then the previously provided valuation allowance will be adjusted.
The company recognizes a tax benefit in the financial statements for an uncertain tax position only if management’s assessment is that the position is “more likely than not” (i.e., a likelihood greater than 50 percent) to be allowed by the tax jurisdiction based solely on the technical merits of the position. The term “tax position” refers to a position in a previously filed tax return or a position expected to be taken in a future tax return that is reflected in measuring current or deferred income tax assets and liabilities for interim or annual periods.
| (r) | Revenue Recognition |
The Company generates revenue primarily from providing professional services to its clients. Revenue is generally recognized upon the performance of services. In providing these services, the Company may incur reimbursable expenses, which consist principally of amounts paid to subcontractors and other third parties and travel and other job related expenses that are contractually reimbursable from clients. The Company has determined that it will include reimbursable expenses in computing and reporting its total revenue as long as the Company remains responsible to the client for the fulfillment of the contract and for the overall acceptability of all services provided.
The Company earns its revenue from time-and-materials, cost-plus and fixed-price contracts. If estimated total costs on any contract indicate a loss, the Company charges the entire estimated loss to operations in the period the loss becomes known. The cumulative effect of revisions to revenue, estimated costs to complete contracts, including penalties, incentive awards, change orders, claims, anticipated losses, and others are recorded in the accounting period in which the events indicating a loss are known and the loss can be reasonably estimated. Such revisions could occur at any time and the effects may be material.
Time-and-Materials Contracts
Under its time-and-materials contracts, the Company negotiates hourly billing rates and charges its clients based on the actual time that the Company spends on a project. In addition, clients reimburse the Company for its actual out-of-pocket costs of materials and other direct incidental expenditures that the Company incurs in connection with its performance under the contract. Its profit margins on time-and-materials contracts fluctuate based on actual labor and overhead costs that the Company directly charges or allocates to contracts compared
51
Table of Contents
with negotiated billing rates. Revenue on these contracts are recognized based on the actual number of hours the Company spends on the projects plus any actual out-of-pocket costs of materials and other direct incidental expenditures that the Company incurs on the projects. Its time-and-materials contracts also generally include annual billing rate adjustment provisions.
Cost-Plus Contracts
The Company has two major types of cost-plus contracts:
Cost-Plus Fixed Fee
Under cost-plus fixed fee contracts, the Company charges its clients for its costs, including both direct and indirect costs, plus a fixed negotiated fee. In negotiating a cost-plus fixed fee contract, the Company estimates all recoverable direct and indirect costs and then adds a fixed profit component. The total estimated cost plus the negotiated fee represents the total contract value. The Company recognizes revenue based on the actual labor costs, based on hours of labor effort, plus non-labor costs the Company incurs, plus the portion of the fixed fee the Company has earned to date. The Company invoices for its services as revenue is recognized or in accordance with agreed-upon billing schedules. Aggregate revenue from cost-plus fixed fee contracts may vary based on the actual number of labor hours worked and other actual contract costs incurred. However, if actual labor hours and other contract costs exceed the original estimate agreed to by its client, the Company generally must obtain a change order, contract modification, or successfully prevail in a claim in order to receive additional revenue relating to the additional costs (see “Change Orders and Claims”).
Cost-Plus Fixed Rate
Under its cost-plus fixed rate contracts, the Company charges clients for its costs plus negotiated rates based on its indirect costs. In negotiating a cost-plus fixed rate contract, the Company estimates all recoverable direct and indirect costs and then adds a profit component, which is a percentage of total recoverable costs to arrive at a total dollar estimate for the project. The Company recognizes revenue based on the actual total number of labor hours and other costs the Company expends at the cost plus the fixed rate the Company negotiated. Similar to cost-plus fixed fee contracts, aggregate revenue from cost-plus fixed rate contracts may vary and the Company generally must obtain a change order, contract modification, or successfully prevail in a claim in order to receive additional revenue relating to any additional costs that exceed the original contract estimate (see “Change Orders and Claims”).
Labor costs and subcontractor services are the principal components of its direct costs on cost-plus contracts, although some include materials and other direct costs. Some of these contracts include a provision that the total actual costs plus the fee will not exceed a guaranteed price negotiated with the client. Others include rate ceilings that limit the reimbursement for general and administrative costs, overhead costs and materials handling costs. The accounting for these contracts appropriately reflects such guaranteed price or rate ceilings.
Firm Fixed-Price (“FFP”) Contracts
The Company’s FFP contracts have historically accounted for most of its fixed-price contracts. Under FFP contracts, the Company’s clients pay it an agreed amount negotiated in advance for a specified scope of work. The Company recognizes revenue on FFP contracts using the percentage-of-completion method (recognizing revenue as costs are incurred). Profit margins the Company recognizes in all periods prior to completion of the project on any FFP contract depend on the accuracy of the Company’s estimates of approximate revenue and expenses and will increase to the extent that its current estimates of aggregate actual costs are below amounts previously estimated. Conversely, if the Company’s current estimated costs exceed prior estimates, its profit margins will decrease and the Company may realize a loss on a project. In order to increase aggregate revenue on the contract, the Company generally must obtain a change order, contract modification, or successfully prevail in a claim in order to receive payment for the additional costs (see “Change Orders and Claims”).
52
Table of Contents
Change Orders and Claims
Change orders are modifications of an original contract that effectively change the provisions of the contract without adding new provisions. Either the Company or its client may initiate change orders. They may include changes in specifications or design, manner of performance, facilities, equipment, materials, sites and period of completion of the work. Claims are amounts in excess of the agreed contract price that the Company seeks to collect from its clients or others for client-caused delays, errors in specifications and designs, contract terminations, change orders that are either in dispute or are unapproved as to both scope and price, or other causes of unanticipated additional contract costs.
Change orders and claims occur when changes are experienced once contract performance is underway. Change orders are sometimes documented and terms of such change orders are agreed with the client before the work is performed. Sometimes circumstances require that work progresses before agreement is reached with the client. Costs related to change orders and claims are recognized when they are incurred. Change orders and claims are included in total estimated contract revenue when it is probable that the change order or claim will result in a bona fide addition to contract value that can be reliably estimated. No profit is recognized on claims until final settlement occurs; unapproved change orders are evaluated as claims. This can lead to a situation where costs are recognized in one period and revenue is recognized when client agreement is obtained or claims resolution occurs, which can be in subsequent periods.
The Company has contracts with the U.S. government that contain provisions requiring compliance with the U.S. Federal Acquisition Regulations (“FAR”). These regulations are generally applicable to all of its federal government contracts and are partially or fully incorporated in many local and state agency contracts. They limit the recovery of certain specified indirect costs on contracts subject to the FAR. Cost-plus contracts covered by the FAR provide for upward or downward adjustments if actual recoverable costs differ from the estimate billed under forward pricing arrangements. Most of its federal government contracts are subject to termination at the convenience of the client. Contracts typically provide for reimbursement of costs incurred and payment of fees earned through the date of such termination.
Federal government contracts which are subject to the FAR and some state and local governmental agencies require audits, which are performed for the most part by the Defense Contract Audit Agency (“DCAA”). The DCAA audits the Company’s overhead rates, cost proposals, incurred government contract costs, and internal control systems. During the course of its audits, the DCAA may question incurred costs if it believes the Company has accounted for such costs in a manner inconsistent with the requirements of the FAR or Cost Accounting Standards (“CAS”) and recommend that its U.S. government corporate administrative contracting officer disallow such costs. Historically, the Company has not experienced significant disallowed costs as a result of such audits. However, the Company can provide no assurance that the DCAA audits will not result in material disallowances of incurred costs in the future.
| (s) | Share-Based Compensation |
The Company uses the Black-Scholes option pricing model to measure the estimated fair value of options to purchase the Company’s common stock. The compensation expense, less forfeitures, is being recognized over the service period on a straight-line basis. The Company’s policy is to use newly issued shares to satisfy the exercise of stock options.
| (t) | Advertising Costs |
Advertising costs are expensed as incurred. Such expenses for the years ended December 31, 2009, 2008 and 2007, are approximately $535,000, $849,000 and $666,000, respectively.
| (u) | Earnings per Share |
Basic earnings per common share has been computed using the weighted-average number of shares of common stock outstanding during the year. Diluted earnings per common share incorporates the incremental shares issuable upon the assumed exercise of stock options and warrants using the treasury stock method.
53
Table of Contents
Dilutive stock options increased average common shares outstanding by approximately 465,000 shares and 339,000 shares for the years ended December 31, 2009 and 2008, respectively, and dilutive stock options and warrants increased average common shares outstanding by approximately 4,667,000 shares for the year ended December 31, 2007.
Options to purchase 788,000 shares, 113,000 shares and 682,000 shares of the Company’s common stock were not included in the calculation of common shares outstanding for the years ended December 31, 2009, 2008 and 2007, respectively, because they were anti-dilutive.
| (v) | Recent Accounting Pronouncements |
On January 1, 2009, the Company adopted a new accounting standard issued by the FASB related to accounting for business combinations using the acquisition method of accounting (previously referred to as the purchase method). Among the significant changes, this standard requires a redefining of the measurement date of a business combination, expensing direct transaction costs as incurred, and recording a liability for contingent consideration at the measurement date with subsequent re-measurements recorded in the results of operations. This standard also requires costs for business restructuring and exit activities related to the acquired company to be included in the post-combination financial results of operations and also provides new guidance for the recognition and measurement of contingent assets and liabilities in a business combination. In addition, this standard requires several new disclosures, including the reasons for the business combination, the factors that contribute to the recognition of goodwill, the amount of acquisition related third-party expenses incurred, the nature and amount of contingent consideration, and a discussion of pre-existing relationships between the parties. The application of this standard is likely to have a significant impact on how the Company allocates the purchase price of prospective business combinations, including the recognition and measurement of assets acquired and liabilities assumed and the expensing of direct transaction costs and costs to integrate the acquired business.
On January 1, 2009, the Company adopted a new accounting standard issued by the FASB that establishes accounting and reporting standards for noncontrolling interests in a subsidiary in consolidated financial statements. In accordance with this new standard, the Company has provided a new presentation on the face of the consolidated financial statements to separately classify noncontrolling interests within the equity section of the consolidated balance sheets and to separately report the amounts attributable to controlling and noncontrolling interests in the consolidated statements of operations for all periods presented. The adoption of this standard did not impact earnings per share attributable to the Company’s common stockholders.
In June 2009, the Financial Accounting Standards Board (“FASB”) issued the FASB Accounting Standards Codification (the “ASC”). The ASC has become the single source of non-governmental generally accepted accounting principles (“GAAP”) recognized by the FASB in the preparation of financial statements. The ASC does not supersede the rules or regulation of the Securities and Exchange Commission (“SEC”), therefore, the rules and interpretive releases of the SEC continue to be additional sources of GAAP for the Company. The Company adopted the ASC as of July 1, 2009. The ASC does not change GAAP and did not have an effect on the Company’s financial position, results of operations or cash flows.
On June 30, 2009, the Company adopted a new accounting standard which established general standards of accounting for and disclosure of events that occur after the balance sheet date but before the financial statements are issued or are available to be issued. This guidance was subsequently amended on February 24, 2010 to no longer require disclosure of the date through which an entity has evaluated subsequent events. The effect of the adoption was not material.
In June 2009, the FASB issued a new accounting standard that is to be applied to financial asset transfers on or after the effective date, which is January 1, 2010 for the Company’s financial statements. The standard limits the circumstances in which a financial asset may be de-recognized when the transferor has not transferred the entire financial asset or has continuing involvement with the transferred asset. The concept of a qualifying
54
Table of Contents
special-purpose entity, which had previously facilitated sale accounting for certain asset transfers, has been eliminated. The adoption of this accounting standard will not have a material effect on its financial position or results of operations.
In June 2009, FASB amended an accounting standard which deals with accounting for variable interest entities. The amendment is effective for reporting periods beginning after November 15, 2009. The amendment changes the process for how an enterprise determines which party consolidates a variable interest entity (“VIE”) to a primarily qualitative analysis. The amendment defines the party that consolidates the VIE (the primary beneficiary) as the party with (1) the power to direct activities of the VIE that most significantly affect the VIE’s economic performance and (2) the obligation to absorb losses of the VIE or the right to receive benefits from the VIE. Upon adoption of the amendment, reporting enterprises must reconsider their conclusions on whether an entity should be consolidated and should a change result, the effect on net assets will be recorded as a cumulative effect adjustment to retained earnings. The Company expects that adoption of this amendment will not have a material effect on its financial position or results of operations.
Note 3—Acquisitions
Effective January 1, 2009, the Company expenses all acquisition-related costs, as well as restructuring costs for which it is not obligated at acquisition date, rather than including such costs as a component of the purchase consideration. During 2009, the Company expensed $65,000 of acquisition-related costs. During 2008, the Company expensed $621,000 of costs related to due diligence efforts for discontinued and potential acquisitions.
On December 15, 2009, the Company acquired Boyken International, Inc. (“Boyken”). Boyken is a 40-employee project management, cost estimating and claims firm headquartered in Atlanta with additional offices in Orlando and Houston. Boyken significantly expands the Company’s resources and experience in the Southeastern U.S. and the Caribbean, and provides additional capabilities in the healthcare, higher education, hotel and governmental sectors. Total consideration amounted to approximately $2,236,000, consisting of 349,876 shares of the Company’s common stock. The Company acquired intangible assets and goodwill amounting to $1,493,000 and $1,296,000, respectively. The acquired intangible assets have a weighted average life of 7.7 years. The acquired intangible assets consist of a client related intangible of $1,063,000 with a ten-year life and a contract intangible of $430,000 with a two-year life. Goodwill, which is not deductible for income tax purposes, has been allocated to the Project Management segment. The results of operations of Boyken are not material to the consolidated results of the Company.
On December 31, 2009, we acquired TRS Consultants, Inc. (“TRS”). TRS is a 40-employee construction management firm headquartered in San Ramon, California with additional offices throughout Northern California. TRS increases the Company’s resources and experience in California and adds additional capabilities in the transportation and infrastructure sectors. Total consideration amounted to approximately $4,000,000, consisting of $2,500,000 in cash, 79,365 shares of the Company’s common stock with a fair value of $500,000 based on the closing price of the Company’s common stock on December 29, 2009, and contingent consideration amounting to $1,000,000. The contingent consideration will be paid in the event that TRS achieves operating profit of $1,000,000 in 2010, 2011 or 2012. The contingent consideration has been accrued and is included in other current liabilities in the consolidated balance sheet. In the event that TRS does not achieve the required level of earnings, the contingent consideration will be written off through a credit to the 2012 consolidated statement of earnings. The Company acquired intangible assets and goodwill amounting to $2,079,000 and $1,512,000, respectively. The acquired intangible assets have a weighted average life of 6.9 years. The acquired intangible assets consist of a client related intangible of $1,269,000 with a ten-year life and a contract intangible of $810,000 with a two-year life. Goodwill, which is expected to be deductible for income tax purposes, has been allocated to the Project Management segment. The results of operations of TRS are not material to the consolidated results of the Company.
During 2008, the Company purchased six companies for aggregate consideration amounting to $46,093,000, consisting of cash of $40,842,000, 82,436 shares of the Company’s common stock amounting to $1,300,000, and contingent consideration amounting to $2,872,000. The contingent consideration was settled in 2009 for cash of $1,138,000 and 132,479 shares of common stock aggregating $1,650,000. In addition, the sellers of one of the
55
Table of Contents
acquired companies had the opportunity to receive additional consideration of up to $8,413,000 under an earn-out arrangement payable at the rate of $4,364,000 in 2009 and $4,049,000 in 2010 based on the acquired company’s financial performance in 2008 and 2009. Based on that company’s performance in 2008, an earn-out payment of $1,526,000 was paid in 2009. The company’s financial results in 2009 did not achieve the level necessary to require an earn-out payment.
The following unaudited pro forma information assumes the above acquisitions had occurred on January 1, 2008. The pro forma information, as presented below, is not necessarily indicative of the results that would have been obtained had the acquisitions occurred on that date, nor is it necessarily indicative of the Company’s future results.
| 2008 | |||
| (in thousands) | |||
| Total revenue |
$ | 396,779 | |
| Net earnings attributable to Hill |
$ | 17,458 | |
| Basic earnings per share |
$ | 0.43 | |
| Diluted earnings per share |
$ | 0.42 | |
The pro forma net earnings reflects adjustments for amortization of intangibles, stock-based compensation expense, interest charges and income taxes.
Note 4—Receivables
| December 31, | ||||||||
| 2009 | 2008 | |||||||
| (in thousands) | ||||||||
| Billed |
$ | 122,657 | $ | 98,558 | ||||
| Retainage, current portion |
2,181 | 4,696 | ||||||
| Unbilled |
15,842 | 20,869 | ||||||
| 140,680 | 124,123 | |||||||
| Allowance for doubtful accounts |
(9,780 | ) | (5,999 | ) | ||||
| Total |
$ | 130,900 | $ | 118,124 | ||||
Unbilled receivables primarily represent revenue earned on contracts, which the Company is contractually precluded from billing until predetermined future dates.
Included in billed receivables are $1,658,000 and $1,699,000 of amounts due from various branches of the U.S. federal government and $10,738,000 and $10,717,000 of receivables from foreign governments at December 31, 2009 and December 31, 2008, respectively.
Note 5—Property and Equipment
| December 31, | ||||||||
| 2009 | 2008 | |||||||
| (in thousands) | ||||||||
| Furniture and equipment |
$ | 7,994 | $ | 6,653 | ||||
| Leasehold improvements |
1,406 | 1,047 | ||||||
| Computer equipment and software |
14,639 | 12,457 | ||||||
| Automobiles |
771 | 708 | ||||||
| 24,810 | 20,865 | |||||||
| Less accumulated depreciation and amortization |
(13,234 | ) | (9,089 | ) | ||||
| Property and equipment, net |
$ | 11,576 | $ | 11,776 | ||||
56
Table of Contents
The Company capitalized approximately $845,000 and $615,000 of internal-use software acquisition and development costs during the years ended December 31, 2009 and 2008, respectively.
Depreciation and amortization expense for the years ended December 31, 2009, 2008 and 2007 amounted to $3,862,000, $3,222,000 and $2,397,000, respectively, of which $886,000, $757,000 and $623,000 was charged to cost of services for the respective periods and the balance is included in selling, general and administrative expenses in the consolidated statements of earnings.
Note 6—Intangible Assets
The following table summarizes the Company’s acquired intangible assets:
| December 31, | ||||||||||||
| 2009 | 2008 | |||||||||||
| Gross Carrying Amount |
Accumulated Amortization |
Gross Carrying Amount |
Accumulated Amortization | |||||||||
| (in thousands) | ||||||||||||
| Client relationships |
$ | 21,002 | $ | 4,610 | $ | 17,210 | $ | 2,401 | ||||
| Acquired contract rights |
9,668 | 4,951 | 7,628 | 3,462 | ||||||||
| Trade names |
1,499 | 725 | 1,200 | 409 | ||||||||
| Covenant not to compete |
18 | 16 | 18 | 10 | ||||||||
| Total |
$ | 32,187 | $ | 10,302 | $ | 26,056 | $ | 6,282 | ||||
| Intangible assets, less accumulated amortization |
$ | 21,885 | $ | 19,774 | ||||||||
Amortization expense related to intangible assets totaled $3,481,000, $3,162,000 and $1,343,000 for the years ended December 31, 2009, 2008 and 2007, respectively. The following table presents the estimated amortization expense based on our present intangible assets for the next five fiscal years:
| Year ending December 31, |
Estimated Amortization Expense | ||
| (in thousands) | |||
| 2010 |
$ | 4,688 | |
| 2011 |
4,619 | ||
| 2012 |
2,472 | ||
| 2013 |
2,348 | ||
| 2014 |
2,378 | ||
Note 7—Goodwill
The Company performs an annual impairment test for goodwill and intangible assets with indefinite lives. In the first step of the impairment test, the Company determines the fair value of each reporting unit and compares the fair value to the reporting unit’s carrying amount. The Company determined that it has two reporting units, the Project Management unit and the Construction Claims unit. The Company made that determination base on the similarity of the services provided, the methodologies in delivering our services and the similarity of the client base in each of these units. If a reporting unit’s carrying amount exceeds its fair value, an indication exists that the reporting unit’s goodwill may be impaired and the Company will perform a second more detailed impairment assessment. The second impairment assessment involves allocating the reporting unit’s fair value to all of its recognized and unrecognized assets and liabilities in order to determine the implied fair value of the reporting unit’s goodwill as of the assessment date. The implied fair value of the reporting unit’s goodwill is then compared to the carrying amount of goodwill to quantify an impairment charge as of the assessment date.
57
Table of Contents
Application of the goodwill impairment test requires significant judgments including estimation of future cash flows, which is based on internal forecasts, estimation of the long-term rate of growth for the businesses, the useful life over which cash flows will occur, and determination of the Company’s weighted average cost of capital. Changes in these estimates and assumptions could materially affect the determination of fair value and/or conclusions on goodwill impairment for each reporting unit. The Company performed its annual impairment test effective July 1, 2009 and noted no impairment for either of its reporting units. Based on the valuation, the fair values of the Project Management unit and Construction Claims unit substantially exceeded their carrying values. In the future, the Company will continue to perform the annual test during its fiscal third quarter unless events or circumstances indicate an impairment may have occurred before that time.
The changes to goodwill in 2008 relate to the acquisitions of Shreeves ($1,802,000), Gerens ($10,540,000), Euromost ($6,753,000), PCI ($4,204,000), Chitester ($492,000), payment of contingent consideration related to a prior acquisition ($1,954,000), an adjustment to the deferred tax asset related to the Knowles acquisition ($359,000) and the accrued earn-out payable to Euromost ($1,526,000). The changes in 2009 relate to the acquisitions of Boyken ($1,297,000) and TRS ($1,512,000) and reductions to the consideration for Euromost ($34,000) and PCI ($50,000) resulting from settlement of the sellers’ indemnification obligations.
The following table summarizes the changes in the Company’s carrying value of goodwill during 2008 and 2009:
| Segment |
Balance at December 31, 2007 |
Changes | Translation Adjustments |
Balance at December 31, 2008 |
Changes | Translation Adjustments |
Balance at December 31, 2009 | ||||||||||||||||
| (in thousands) | |||||||||||||||||||||||
| Project Management |
$ | 2,784 | $ | 22,576 | $ | (2,706 | ) | $ | 22,654 | $ | 2,775 | $ | 400 | $ | 25,829 | ||||||||
| Construction Claims |
18,803 | 5,054 | (5,221 | ) | 18,636 | (50 | ) | 1,610 | 20,196 | ||||||||||||||
| Total |
$ | 21,587 | $ | 27,630 | $ | (7,927 | ) | $ | 41,290 | $ | 2,725 | $ | 2,010 | $ | 46,025 | ||||||||
Note 8—Accounts Payable and Accrued Expenses
Below are the components of accounts payable and accrued expenses:
| December 31, | ||||||
| 2009 | 2008 | |||||
| (in thousands) | ||||||
| Accounts payable |
$ | 16,597 | $ | 17,067 | ||
| Accrued payroll |
20,042 | 18,088 | ||||
| Accrued subcontractor fees |
4,806 | 4,193 | ||||
| Accrued legal and professional cost |
9,035 | 6,552 | ||||
| Accrued earn out related to Euromost acquisition |
— | 1,526 | ||||
| Other accrued expenses |
2,678 | 2,180 | ||||
| Total |
$ | 53,158 | $ | 49,606 | ||
58
Table of Contents
Note 9—Notes Payable
Outstanding debt obligations are as follows:
| December 31, | ||||||
| 2009 | 2008 | |||||
| (in thousands) | ||||||
| Revolving credit loan payable to Bank of America. The weighted average interest rate for all borrowings was 3.45% and 5.00% at December 31, 2009 and 2008, respectively. (For more information see below.) |
$ | 24,800 | $ | 14,500 | ||
| Note payable, paid February 1, 2009, for the Pickavance acquisition with an original issue discount of $231,000 at an imputed interest rate of 8.0% |
— | 407 | ||||
| Revolving credit loan payable to Barclays Bank PLC up to £500,000 (approximately $804,000 and $723,000 at December 31, 2009 and December 31, 2008, respectively), with interest at 2.00% plus the Bank of England rate of 0.50% (or 2.50%) at both December 31, 2009 and December 31, 2008, respectively, collateralized by cross guarantees of all United Kingdom companies. The loan had an expiration date of March 6, 2010. The Company intends to renew this facility. |
— | 106 | ||||
| Revolving credit loan payable acquired in the acquisition of Boyken to Bank of America up to $1,250,000, with interest at 2.25% plus the 1 month Libor rate of 0.23% (or 2.48%) at December 31, 2009. The loan was paid off by the Company on January 5, 2010. |
850 | — | ||||
| Note payable, paid in June 2009, in connection with the Euromost acquisition. |
— | 707 | ||||
| Revolving credit loan payable acquired in the acquisition of TRS to Bay Commercial Bank up to $1,000,000, with interest at 0.75% plus the prime rate of 3.25% (or 4.00%) but no less than 6.00% at December 31, 2009. The loan was paid off by the Company on January 8, 2010. |
870 | — | ||||
| Other notes payable |
275 | 261 | ||||
| 26,795 | 15,981 | |||||
| Less current maturities |
1,972 | 1,344 | ||||
| Notes payable, net of current maturities |
$ | 24,823 | $ | 14,637 | ||
On June 30, 2009, the Company replaced its $60,000,000 credit facility with a new credit facility providing the ability to borrow up to $100,000,000. Under certain circumstances, the Company may increase availability by an additional $50,000,000. The new credit facility has been made pursuant to the terms of a new credit agreement (the “Credit Agreement”) dated as of June 30, 2009 among the Company, Bank of America, N.A., Capital One, N.A., The PrivateBank and Trust Company and PNC Bank N.A. The Credit Agreement also provides for a letter of credit sub-facility of up to $30,000,000. Obligations under the Credit Agreement are collateralized by all of the Company’s assets, including, without limitation, accounts receivable, equipment, securities, financial assets and the proceeds of the foregoing, as well as by a pledge of 65% of the outstanding capital stock of its wholly owned subsidiary, Hill International S.A. The Credit Agreement expires on June 30, 2012. The Company incurred costs of approximately $1,741,000 in connection with establishing the new credit facility. Such costs have been deferred and are being amortized to interest expense over the life of the loan.
The Credit Agreement provides for Base Rate loans and Eurodollar Rate loans. Base Rate loans bear interest at a fluctuating rate per annum equal to the sum of (a) the highest of (i) the Federal Funds Rate plus 0.5%, (ii) the rate of interest in effect for such day as publicly announced from time to time by Bank of America as its “prime rate” or (iii) the Eurodollar Rate plus 1.00%, plus (b) an Applicable Rate which may vary between 1.75% and 2.50% depending on the Company’s consolidated leverage ratio at the time of the borrowing. Eurodollar Rate loans bear interest at a rate per annum equal to the British Bankers Association LIBOR Rate plus an Applicable Rate which may vary between 2.75% and 3.50% depending on the Company’s consolidated leverage ratio at the time of the borrowing.
59
Table of Contents
The Credit Agreement contains covenants and certain restrictions on the incurrence of debt, on the making of investments, on the payment of dividends, on transactions with affiliates and other affirmative and negative covenants and events of default customary for facilities of its type. It also requires the Company to meet certain financial tests at any time that borrowings are outstanding under the facility including minimum consolidated net worth of $100,000,000 plus 50% of consolidated net earnings attributable to Hill International, Inc. for each quarter after June 30, 2009, consolidated leverage ratio not to exceed 2.50 to 1.00, a minimum consolidated fixed charge coverage ratio of 2.00 to 1.00 and a minimum ratio of consolidated billed and unbilled accounts receivable to consolidated senior indebtedness of 2.00 to 1.00. At December 31, 2009, the Company was in compliance with all of the loan covenants.
As of December 31, 2009, the Company had $7,150,000 in outstanding letters of credit which reduced availability under the credit facility. Due to the limitations of the ratio of the Company’s consolidated billed and unbilled accounts receivable to consolidated senior indebtedness, total remaining availability at December 31, 2009 was $38,407,000.
The Company also maintains a credit facility with a bank in the Middle East for 11,500,000 AED (approximately $3,131,000 at December 31, 2009) collateralized by certain overseas receivables. The interest rate on this facility at December 31, 2009 is the one-month Emirates InterBank Offer Rate (“EIBOR”), which at December 31, 2009 was 1.49%, plus 3.00% (or 4.49%) but no less than 5.50%. At December 31, 2008 the interest rate was the three-month EIBOR rate of 4.33% plus 2.00% (or 6.33%). There were no outstanding borrowings under this facility at both December 31, 2009 and December 31, 2008. The facility also allows for up to 150,000,000 AED (approximately $40,839,000) in Letters of Guarantee of which 55,811,000 AED (approximately $15,195,000) was utilized at December 31, 2009. This facility expires on August 27, 2010.
The Company also maintains a revolving credit loan payable with a European bank up to €1,000,000 (approximately $1,434,000 at December 31, 2009), with interest rates at 2.50% plus Egnatia Bank’s prime rate of 6.25% (or 8.75%) at December 31, 2009 and interest rates at 2.50% plus Egnatia Bank’s prime rate of 8.00% (or 10.50%) at December 31, 2008, collateralized by certain assets of the Company. The facility also allows for letters of guarantee up to €4,500,000 (approximately $6,454,000) of which nothing had been utilized at December 31, 2009. The loan has an expiration date of April 30, 2010. The Company intends to renew this facility prior to the expiration date.
The Company also maintains an unsecured credit facility with a bank in Spain for €750,000 (approximately $1,076,000 at December 31, 2009). The interest rate on that facility is the three-month EURIBOR rate which at December 31, 2009 was 0.71%, plus 1.75% (or 2.46%) but no less than 4.00%. The interest rate December 31, 2008 on that facility was the three-month EURIBOR rate 2.9%, plus 0.75% (or 3.70%). At both December 31, 2009 and 2008 there were no outstanding borrowings under this facility which expires on December 24, 2011.
The Company also maintains another credit facility with another European bank that allows for €2,000,000 (approximately $2,868,000 at December 31, 2009) of bank guarantees of which €373,000 (approximately $535,000 at December 31, 2009) was utilized at December 31, 2009. The facility has an expiration date of March 31, 2010. The Company does not intend to renew this facility.
Scheduled maturities of long term debt are as follows:
| Years ending December 31, | |||
| 2010 |
$ | 1,972 | |
| 2011 |
20 | ||
| 2012 |
24,803 | ||
| Total debt |
$ | 26,795 | |
60
Table of Contents
Note 10—Noncash Investing and Financing Activities
On March 24, 2006, options to purchase 482,767 shares of common stock with an exercise price of $0.37 per share and options to purchase 48,277 shares of common stock with an exercise price of $0.53 per share were exercised on a cashless basis when the fair market value was $5.47 per common share resulting in the issuance of 493,465 shares of common stock. On June 28, 2006, options to purchase 2,838,669 shares of common stock with exercise prices ranging from $0.37 to $3.08 were exercised on a cashless basis resulting in the issuance of 2,246,852 shares of common stock. The exercises on March 24, 2006 and June 28, 2006 resulted in 3,369,713 options exercised, 629,396 shares surrendered and 2,740,317 shares issued.
Under the Merger Agreement with Arpeggio, shareholders of Old Hill agreed to escrow 1,450,000 shares to indemnify the Company against identified litigation claims in excess of amounts recorded at September 30, 2005 and other indemnifications. As of December 30, 2006, the Company had specifically identified judgments and awards totaling $3,865,000. During 2007, from the shares held in escrow, 69,540 shares representing $515,000 were released to the Company in satisfaction of one claim and have been placed in treasury.
On each of April 15, 2008 and April 9, 2007, the Company issued 2,300,000 shares of its common stock and on March 16, 2009, the Company issued 1,000,000 shares of its common stock in connection with the earn-out provision of the Merger Agreement with Arpeggio.
On August 9, 2007, the Company issued 30,000 shares, and on June 10, 2009, the Company issued 66,410 shares of its common stock to its non-employee directors as partial compensation for services as directors on the Company’s Board through the next annual stockholders meeting. The Company recorded expense of $273,600 and $123,000 in selling, general and administrative expenses in the consolidated statements of earnings for the years ended December 31, 2009 and 2007, respectively.
In connection with Arpeggio’s initial public offering, representatives of the underwriter were granted options to purchase 300,000 units, consisting of one share of common stock and two warrants to purchase common stock for $6.25 per share. In November 2007, the representatives exercised the options on a cashless basis resulting in the issuance of 217,510 shares of the Company’s common stock.
On March 25, 2008, an individual exercised options to purchase 1,000 shares of the Company’s common stock on a cashless basis resulting in the issuance of 391 shares of common stock.
During 2008, the Company issued 82,436 shares of its common stock valued at $1,300,000 and a note payable amounting to $772,000 in connection with acquisitions. During 2009, the Company issued 429,241 shares of its common stock valued at $2,736,000 in connection with acquisitions and 132,479 shares of its common stock valued at $1,650,000 in settlement of contingent consideration obligations for acquisitions made in 2008.
| Years Ended December 31, | |||||||||
| 2009 | 2008 | 2007 | |||||||
| (in thousands) | |||||||||
| Supplemental disclosures: |
|||||||||
| Interest paid |
$ | 2,154 | $ | 393 | $ | 987 | |||
| Income taxes paid |
$ | 3,047 | $ | 6,695 | $ | 1,558 | |||
61
Table of Contents
Note 11—Equity in Earnings of Affiliates
Stanley Baker Hill, LLC
Equity in earnings of affiliates reflects ownership by the Company of 33.33% of the members’ equity of Stanley Baker Hill, LLC (“SBH”). SBH is a joint venture formed in February 2004 between Stanley Consultants, Inc., Michael Baker, Jr., Inc., and Hill.
SBH has a contract for an indefinite delivery and indefinite quantity for construction management and general architect-engineer services for facilities in Iraq with the U.S. Army Corps of Engineers.
Summary information for SBH follows:
| December 31, | ||||||
| 2009 | 2008 | |||||
| (in thousands) | ||||||
| Current assets |
$ | 17,376 | $ | 27,970 | ||
| Current liabilities |
12,594 | 22,436 | ||||
| Working capital |
4,782 | 5,534 | ||||
| Property and equipment, net |
20 | 7 | ||||
| Members’ equity |
$ | 4,802 | $ | 5,541 | ||
| Years Ended December 31, | |||||||||
| 2009 | 2008 | 2007 | |||||||
| (in thousands) | |||||||||
| Revenue |
$ | 154,140 | $ | 130,409 | $ | 77,226 | |||
| Net earnings |
$ | 21,161 | $ | 9,195 | $ | 6,663 | |||
| Summary information of the Company’s ownership interest is as follows: |
|||||||||
| Equity in earnings of affiliate |
$ | 7,201 | $ | 3,065 | $ | 2,221 | |||
| Undistributed earnings included in consolidated retained earnings |
$ | 1,600 | $ | 221 | $ | 1,479 | |||
| Distributions from affiliate |
$ | 7,300 | $ | 2,844 | $ | 1,528 | |||
At December 31, 2009 and 2008, the Company reported receivables totaling $3,534,000 and $7,654,000, respectively, from SBH for work performed by the Company as a subcontractor to SBH. Such amounts were payable in accordance with the subcontract agreement between the Company and SBH.
Revenue from SBH pursuant to such subcontract agreement for the years ended December 31, 2009, 2008 and 2007 was $34,334,737, $32,570,000 and $15,136,000, respectively.
Hill TMG
Equity in earnings of affiliates also reflects ownership by the Company of 50.0% of the members’ equity of Hill TMG, a joint venture formed in May 2008 between Talaat Moustafa Group Holding Co. (“TMG”), and Hill. Hill TMG is managing the construction of several of TMG’s largest developments in Egypt and elsewhere in the Middle East.
At December 31, 2009, the Company reported receivables totaling $2,215,000 for work performed by the Company as a subcontractor to Hill TMG. Such amounts are payable in accordance with the subcontract agreement between the Company and Hill TMG.
62
Table of Contents
Revenue from Hill TMG pursuant to such subcontract agreement for the years ended December 31, 2009 and 2008 was $3,600,000 and $2,082,000, respectively.
The following table summarizes the equity in earnings of affiliates as follows:
| Years Ended December 31, | |||||||||
| 2009 | 2008 | 2007 | |||||||
| (in thousands) | |||||||||
| Stanley Baker Hill |
$ | 7,201 | $ | 3,065 | $ | 2,221 | |||
| Hill TMG |
1,017 | 593 | — | ||||||
| Other |
4 | — | — | ||||||
| Total |
$ | 8,222 | $ | 3,658 | $ | 2,221 | |||
Note 12—Share-Based Compensation
2008 Employee Stock Purchase Plan
On June 10, 2008, the stockholders approved the Employee Stock Purchase Plan covering 2,000,000 shares of the Company’s common stock. Eligible employees may purchase shares at 85% of the fair market value on the date of purchase. During 2009 and 2008, employees purchased 120,798 and 158,887 common shares, respectively, for an aggregate purchase price of $372,000 and $959,000, respectively. The Company recognized compensation expense amounting to $66,000 and $169,000 during 2009 and 2008, respectively.
2007 Restricted Stock Grant Plan
On June 10, 2008, the stockholders approved the 2007 Restricted Stock Grant Plan covering 340,000 shares of the Company’s common stock. Awards aggregating 335,000 shares were approved by the Compensation Committee on February 28, 2007. The shares vest annually over a five-year period commencing on February 28, 2008. On the date of stockholder approval, the fair value of the awards was $5,494,000 which has been recorded as deferred compensation and is being amortized to expense over the corresponding vesting periods. During 2009 and 2008, the Company recognized compensation expense amounting to $1,013,000 and $2,015,000, respectively.
2006 Employee Stock Option Plan
The 2006 Employee Stock Option Plan (the “Plan”) covers 3,000,000 shares of the Company’s common stock. Under its terms, directors, officers and employees of the Company and its subsidiaries are eligible to receive non-qualified and incentive stock options. Options granted to non-employee directors vest immediately and have a five year contractual term. Options granted to officers and employees vest over five years and have a seven-year contractual term. Generally, each option has an exercise price equal to the closing quoted market price of a share of the Company’s common stock on the date of grant. For grants of incentive stock options, if the grantee owns, or is deemed to own, 10% or more of the total voting power of the Company, then the exercise price shall be 110% of the closing quoted market price on the date of grant and the option will have a five-year contractual term. Options that are forfeited or expire are available for future grants. At December 31, 2009, a total of 940,605 shares of common stock were reserved for future issuance under the Plan.
63
Table of Contents
The Black-Scholes option valuation model is used to estimate the fair value of the options. The following table summarizes the fair value of options granted during 2009, 2008 and 2007 and the assumptions used to estimate the fair value (no dividends were assumed):
| December 31, | ||||||
| 2009 | 2008 | 2007 | ||||
| Average expected life (years) |
4.66 | 4.76 | 3-5 | |||
| Forfeiture range |
0% - 15% | 0% - 15% | 0% - 15% | |||
| Weighted average forfeiture rate |
4.3% | 9.2% | 6.1% | |||
| Volatility range |
46.6%- 48.7% | 35.2% - 40.7% | 31.2% - 37.4% | |||
| Weighted average volatility |
48.2% | 36.7% | 37.1% | |||
| Range of risk-free interest rates |
1.83% - 2.69% | 2.50% - 2.87% | 4.21% - 4.56% | |||
| Weighted average risk-free interest rate |
1.86% | 2.74% | 4.47% | |||
| Weighted average fair value at grant date |
$1.11 | $4.30 | $3.01 | |||
The expected term of the options is estimated based on the “simplified method” as permitted by SAB No. 110. Expected volatility was calculated using the average historical volatility of similar public companies. The risk-free interest rate is based on U.S. Treasury yields for securities in effect at the time of grants with terms approximating the term of the grants. The assumptions used in the Black-Scholes option valuation model are highly subjective, particularly as to stock price volatility of the underlying stock, which can materially affect the resulting valuation.
A summary of the Company’s stock option activity and related information for the years ended December 31, 2009, 2008 and 2007 is as follows:
| Options | Weighted Average Exercise Price |
Weighted Average Remaining Contractual Life |
Aggregate Intrinsic Value | ||||||||
| (in thousands, except exercise price and remaining life data) | |||||||||||
| Outstanding, December 30, 2006 |
25 | $ | 5.22 | ||||||||
| Granted |
905 | 7.66 | |||||||||
| Exercised |
— | ||||||||||
| Expired |
— | ||||||||||
| Forfeited |
(75 | ) | 7.58 | ||||||||
| Outstanding, December 31, 2007 |
855 | 7.60 | |||||||||
| Granted |
205 | 12.26 | |||||||||
| Exercised |
(20 | ) | 7.66 | ||||||||
| Expired |
— | — | |||||||||
| Forfeited |
(61 | ) | 8.70 | ||||||||
| Outstanding, December 31, 2008 |
979 | 8.49 | |||||||||
| Granted |
1,190 | 2.73 | |||||||||
| Exercised |
— | ||||||||||
| Expired |
(23 | ) | 8.24 | ||||||||
| Forfeited |
(107 | ) | 7.72 | ||||||||
| Outstanding, December 31, 2009 |
2,039 | $ | 5.18 | 5.04 | $ | 2,153 | |||||
| Exercisable at December 31, 2009 |
463 | $ | 7.46 | 3.98 | $ | — | |||||
Aggregate intrinsic value represents the difference between the exercise prices and the closing stock price on December 31, 2009.
64
Table of Contents
For various price ranges, weighted average characteristics of outstanding stock options at December 31, 2009 are as follows:
| Exercise Prices |
Options Outstanding | Options Exercisable | ||||||||||
| Number Outstanding at December 31, 2009 |
Weighted Average Remaining Contractual Life |
Weighted Average Exercise Price |
Number Exercisable at December 31, 2009 |
Weighted Average Exercise Price | ||||||||
| $2.45 |
840,000 | 6.19 | $ | 2.45 | — | $ | — | |||||
| 2.70 | 200,000 | 4.19 | 2.70 | — | — | |||||||
| 4.12 | 104,895 | 4.44 | 4.12 | 104,895 | 4.12 | |||||||
| 4.37 | 10,000 | 6.34 | 4.37 | — | — | |||||||
| 4.92 | 5,000 | 6.59 | 4.92 | — | — | |||||||
| 5.22 | 25,000 | 1.62 | 5.22 | 25,000 | 5.22 | |||||||
| 6.24 | 10,000 | 7.00 | 6.24 | — | — | |||||||
| 6.32 | 25,000 | 5.85 | 6.32 | 5,000 | 6.32 | |||||||
| 6.73 | 5,000 | 6.84 | 6.73 | — | — | |||||||
| 7.01 | 25,000 | 2.61 | 7.01 | 25,000 | 7.01 | |||||||
| 7.06 | 5,000 | 6.86 | 7.06 | — | — | |||||||
| 7.35 | 10,000 | 4.35 | 7.35 | 4,000 | 7.35 | |||||||
| 7.43 | 40,000 | 4.71 | 7.43 | 16,000 | 7.43 | |||||||
| 7.57 | 16,000 | 4.36 | 7.57 | 7,000 | 7.57 | |||||||
| 7.67 | 526,000 | 4.16 | 7.67 | 208,000 | 7.67 | |||||||
| 8.44 | 50,000 | 2.16 | 8.44 | 20,000 | 8.44 | |||||||
| 11.10 | 20,000 | 5.08 | 11.10 | 4,000 | 11.10 | |||||||
| 12.82 | 87,500 | 5.13 | 12.82 | 17,500 | 12.82 | |||||||
| 16.79 | 35,000 | 4.49 | 16.79 | 27,000 | 16.79 | |||||||
| 2,039,395 | 5.04 | $ | 5.18 | 463,395 | $ | 7.46 | ||||||
In the years ended December 31, 2009, 2008 and 2007, the Company recorded share-based compensation related to stock options of approximately $760,000, $546,000 and $337,000, respectively, which is included in selling, general and administrative expenses.
65
Table of Contents
The following table summarizes the Company’s non-vested stock option activity and related information for the years ended December 31, 2009, 2008 and 2007:
| Options | Weighted Average Grant Date Fair Value | |||||
| (in thousands, except weighted average grant date fair value) | ||||||
| Non-vested options at December 30, 2006 |
— | $ | — | |||
| Granted |
905 | 7.66 | ||||
| Vested |
(25 | ) | 7.01 | |||
| Forfeited |
(75 | ) | 7.58 | |||
| Non-vested options at December 31, 2007 |
805 | 7.69 | ||||
| Granted |
205 | 12.26 | ||||
| Vested |
(187 | ) | 8.87 | |||
| Forfeited |
(61 | ) | 8.70 | |||
| Non-vested options at December 31, 2008 |
762 | 8.54 | ||||
| Granted |
1,190 | 2.73 | ||||
| Vested |
(269 | ) | 6.83 | |||
| Forfeited |
(107 | ) | 7.72 | |||
| Non-vested options at December 31, 2009 |
1,576 | $ | 4.52 | |||
At December 31, 2009, total unrecognized compensation cost related to non-vested options was $2,185,000 and will be recognized over the remaining weighted-average service period of 1.9 years.
Note 13 – Stockholders’ Equity
Stock Repurchase Program
On November 10, 2008, the Board of Directors approved a stock repurchase program authorizing the Company to purchase shares of its common stock up to a total purchase price of $20,000,000 over the subsequent 12 months. During 2009, the Company purchased 2,487,343 shares at a cost of approximately $9,172,000, including 1,000,000 shares purchased from the Company’s Chairman and Chief Executive Officer for $4,300,000. The transaction with the Company’s Chairman and Chief Executive Officer was authorized by the Board of Directors on June 30, 2009 and was based on the closing price of the Company’s common stock on that date. To date, the Company has purchased 3,652,572 shares of its common stock for an aggregate purchase price of $15,110,000, or an average of approximately $4.14 per share. On August 4, 2009, the Board of Directors amended the stock repurchase program to increase the authorized amount to $40,000,000 and extend the program to December 31, 2010. The Company’s Credit Agreement (see Note 9) currently limits the aggregate purchases under the program to $20,000,000. Purchases in excess of that amount will require a waiver from the bank.
Warrants
Following the Company’s initial public offering, there were 13,600,000 Redeemable Common Stock Purchase Warrants (the “Warrants”) issued and outstanding. Each Warrant entitled the holder to purchase from the Company one share of common stock at an exercise price of $5.00 commencing on June 28, 2006 and expiring on June 23, 2008. The Warrants were redeemable at a price of $.01 per Warrant upon 30 days notice, only in the event that the closing market price of the common stock was at least $8.50 per share for any 20 trading days within a 30 trading day period, ending on the third day prior to the date on which notice of redemption is given. On October 23, 2007, the Company notified the warrant holders of its intention to redeem the warrants on November 23, 2007. The holders exercised all but 24,399 warrants which were redeemed by the Company. During 2007, the Company received $67,878,000 in connection with the exercise of warrants.
66
Table of Contents
In connection with its initial public offering, the Company issued an option for $100 to representatives of the underwriters to purchase 300,000 Units at an exercise price of $9.90 per Unit. Each Unit consists of one share of the Company’s common stock and warrants to purchase two shares of the Company’s common stock at an exercise price of $6.25 per share. In October and November 2007, the holders exercised on a cashless basis their options and the underlying warrants resulting in the issuance of 217,510 shares of the Company’s common stock.
Note 14—Selling, General and Administrative Expenses
Also included in selling, general and administrative expenses in the consolidated statements of earnings is bad debt expense of $5,156,000, $3,361,000 and $2,271,000 for the years ended December 31, 2009, 2008 and 2007, respectively.
Note 15—Income Taxes
The effective tax rates for the years ended December 31, 2009, 2008 and 2007 were 18.5%, 16.4% and 16.2%, respectively. The Company’s effective tax rate continues to remain low since a substantial portion of its profit comes from foreign operations which are taxed at lower rates, if at all. It is anticipated that the Company’s effective tax rate may fluctuate in the future due to the mix of foreign and domestic pre-tax earnings.
Earnings before provision for income taxes is allocated as follows:
| Years Ended December 31, | |||||||||||
| 2009 | 2008 | 2007 | |||||||||
| (in thousands) | |||||||||||
| Earnings (loss) before provision for income taxes from U.S. operations |
$ | (1,016 | ) | $ | (1,887 | ) | $ | 3,325 | |||
| Earnings before provision for income taxes from foreign operations |
25,776 | 24,219 | 13,854 | ||||||||
| $ | 24,760 | $ | 22,332 | $ | 17,179 | ||||||
Provision for (benefit from) income taxes consists of the following:
| Current | Deferred | Total | ||||||||||
| (in thousands) | ||||||||||||
| Year ended December 31, 2009: |
||||||||||||
| U.S. Federal |
$ | (244 | ) | $ | (708 | ) | $ | (952 | ) | |||
| State and local |
534 | (271 | ) | 263 | ||||||||
| Foreign jurisdiction |
5,292 | (26 | ) | 5,266 | ||||||||
| $ | 5,582 | $ | (1,005 | ) | $ | 4,577 | ||||||
| Year ended December 31, 2008: |
||||||||||||
| U.S. Federal |
$ | (445 | ) | $ | (840 | ) | $ | (1,285 | ) | |||
| State and local |
727 | (321 | ) | 406 | ||||||||
| Foreign jurisdiction |
4,430 | 103 | 4,533 | |||||||||
| $ | 4,712 | $ | (1,058 | ) | $ | 3,654 | ||||||
| Year ended December 30, 2007: |
||||||||||||
| U.S. Federal |
$ | 105 | $ | 1,072 | $ | 1,177 | ||||||
| State and local |
97 | 246 | 343 | |||||||||
| Foreign jurisdiction |
1,355 | (87 | ) | 1,268 | ||||||||
| $ | 1,557 | $ | 1,231 | $ | 2,788 | |||||||
67
Table of Contents
The differences between income taxes based on the statutory U.S. federal income tax rate and the Company’s effective income tax rate are provided in the following reconciliation:
| Years Ended December 31, | ||||||||||||
| 2009 | 2008 | 2007 | ||||||||||
| (in thousands) | ||||||||||||
| Statutory federal income tax |
$ | 8,419 | $ | 7,244 | $ | 5,757 | ||||||
| Foreign tax benefit for earnings taxed at lower rates |
(6,853 | ) | (5,349 | ) | (3,328 | ) | ||||||
| Change in the valuation allowance |
2,849 | 1,996 | 725 | |||||||||
| Net liability reductions for uncertain tax positions |
(820 | ) | (2,348 | ) | (648 | ) | ||||||
| Modification of the cash to accrual method |
— | 1,638 | — | |||||||||
| Excess compensation |
372 | 58 | — | |||||||||
| State and local income taxes, net of federal income tax benefit |
111 | 282 | 226 | |||||||||
| Stock options |
135 | 144 | 99 | |||||||||
| Benefit for net operating losses not previously recorded |
— | — | (250 | ) | ||||||||
| Other |
364 | (11 | ) | 207 | ||||||||
| Total |
$ | 4,577 | $ | 3,654 | $ | 2,788 | ||||||
68
Table of Contents
The tax effect of temporary differences that give rise to deferred tax assets and deferred tax liabilities are as follows:
| December 31, | ||||||||
| 2009 | 2008 | |||||||
| (in thousands) | ||||||||
| Deferred tax assets: |
||||||||
| Allowance for uncollectible accounts |
$ | 550 | $ | 571 | ||||
| Amortization of intangibles |
1,663 | 1,042 | ||||||
| Compensated absences |
1,276 | 1,271 | ||||||
| Foreign income taxes on currency translations |
328 | 424 | ||||||
| Net operating loss carryforward—foreign operations |
5,781 | 3,211 | ||||||
| Share based compensation |
813 | 742 | ||||||
| Legal accrual |
— | 291 | ||||||
| Incentive compensation |
93 | 526 | ||||||
| Capital loss carryforward |
85 | — | ||||||
| Investment in affiliates |
356 | — | ||||||
| Other |
57 | 156 | ||||||
| Total gross deferred tax assets |
11,002 | 8,234 | ||||||
| Less: valuation allowance |
(5,962 | ) | (3,113 | ) | ||||
| Net total deferred tax assets |
5,040 | 5,121 | ||||||
| Non current deferred tax liabilities |
||||||||
| Intangible assets of acquired subsidiaries |
(6,822 | ) | (6,276 | ) | ||||
| Investment in affiliates |
0 | (221 | ) | |||||
| Property and equipment, principally due to difference in depreciation |
(1,169 | ) | (1,178 | ) | ||||
| Prepaid expenses |
(578 | ) | (362 | ) | ||||
| Change in tax method |
(431 | ) | (1,085 | ) | ||||
| Other |
(160 | ) | — | |||||
| Total gross deferred tax liabilities |
(9,160 | ) | (9,122 | ) | ||||
| Net deferred tax liabilities |
$ | (4,120 | ) | $ | (4,001 | ) | ||
| Amounts included in the consolidated balance sheets: |
||||||||
| Current deferred tax assets |
$ | 878 | $ | 568 | ||||
| Non-current deferred tax assets |
4,162 | — | ||||||
| Current deferred tax liabilities |
(432 | ) | — | |||||
| Non-current deferred tax liabilities |
(8,728 | ) | (4,569 | ) | ||||
| $ | (4,120 | ) | $ | (4,001 | ) | |||
In assessing the realizability of deferred tax assets, management considers whether it is more likely than not that some portion of all of the deferred tax assets will not be realized. The ultimate realization of deferred tax assets is dependent upon the generation of future taxable income during the periods in which those temporary differences become deductible. Management considers the scheduled reversal of deferred tax liabilities and projected future taxable income in making this assessment. Based upon the level of historical taxable income and projections for future taxable income over the periods in which the deferred tax assets are deductible, management believes it is more likely than not that the Company will realize the benefits of these deductible differences, with the exception of foreign net operating losses. The amount of the deferred tax asset considered realizable, however, could be reduced in the near term if estimates of future taxable income during the carryforward period are reduced.
69
Table of Contents
At December 31, 2009 and 2008, there were approximately $20,650,000 and $11,124,000, respectively, of gross foreign net operating loss carryforwards. The majority of these net operating loss carryforwards have an unlimited carryforward period. A valuation allowance of $5,962,000 and $3,113,000 was recorded at December 31, 2009 and 2008, respectively, primarily related to the foreign net operating losses. It is anticipated that these will not be utilized due to continuing losses in these jurisdictions.
The Company has made no provision for U.S. taxes on $63,761,000 of cumulative earnings of foreign subsidiaries as those earnings are intended to be reinvested for an indefinite period of time. Upon distribution of these earnings in the form of dividends or otherwise, the Company may be subject to U.S. income taxes and foreign withholding taxes. It is not practical, however, to estimate the amount of taxes that may be payable on the eventual repatriation of these earnings.
At December 31, 2009 and 2008, the Company reduced current income tax payable and increased additional paid in capital by $131,000 and $985,000, respectively, to reflect interest expense on the earn out shares awarded to the shareholders. In 2009, the deferred tax asset and additional paid in capital were reduced by $326,000 to record the differential between book expense and tax expense related to the vesting of restricted stock. In 2008, goodwill was increased by $359,000 and deferred tax assets decreased to reflect an adjustment in purchase accounting with respect to net operating losses recorded on the Knowles acquisition in 2006.
The Company will recognize a tax benefit in the financial statements for an uncertain tax position only if management’s assessment is that the position is “more likely than not” (i.e., a likelihood greater than 50 percent) to be allowed by the tax jurisdiction based solely on the technical merits of the position. The term “tax position” refers to a position in a previously filed tax return or a position expected to be taken in a future tax return that is reflected in measuring current or deferred income tax assets and liabilities for financial reporting purposes.
The following table indicates the changes to the Company’s uncertain tax positions for the years ended December 31, 2009 and 2008 including interest and penalties:
| Year Ended December 31, | ||||||||
| 2009 | 2008 | |||||||
| Balance, beginning of year |
$ | 3,395 | $ | 5,743 | ||||
| Reductions due to lapse of statute of limitations |
(1,895 | ) | (2,506 | ) | ||||
| Additions based on tax positions related to the current year |
921 | — | ||||||
| Additions based on tax positions related to prior years |
154 | 278 | ||||||
| Settlements with taxing authorities |
— | (120 | ) | |||||
| Balance, end of year |
$ | 2,575 | $ | 3,395 | ||||
| Amounts included in consolidated balance sheets: |
||||||||
| Income taxes payable |
$ | — | $ | 1,471 | ||||
| Other liabilities |
2,575 | 1,924 | ||||||
| $ | 2,575 | $ | 3,395 | |||||
The Company files income tax returns in the U.S. federal jurisdiction and in various states and foreign jurisdictions. The Company generally is no longer subject to U.S. federal, state or foreign examinations by tax authorities for tax years prior to 2006.
The Company’s policy is to record income tax related interest and penalties in income tax expense. At December 31, 2009, the Company had accrued $1,104,000 for potential interest and penalties.
The Company’s income tax returns are based on calculations and assumptions that are subject to examinations by the Internal Revenue Service and other tax authorities. While the Company believes it has
70
Table of Contents
appropriate support for the positions taken on its tax returns, the Company regularly assesses the potential outcomes of these examinations and any future examinations for the current or prior years in determining the adequacy of its provision for income taxes. As part of its assessment of potential adjustments to its tax returns, the Company increases its current tax liability to the extent an adjustment would result in a cash tax payment or decreases its deferred tax assets to the extent an adjustment would not result in a cash tax payment. The Company continually assesses the likelihood and amount of potential adjustments and adjusts the income tax provision, the current tax liability and deferred taxes in the period in which the facts that give rise to a revision become known.
Note 16—Commitments and Contingencies
Litigation
On July 16, 2009, Al Areen Desert Resort Holding Company (“Al Areen”) filed a complaint with the Ministry of Justice & Islamic Affairs in the Kingdom of Bahrain against the Company alleging breach of contract and other causes of action in connection with its performance of a construction project known as Al Areen Desert Spa and Resort (the “Project”), seeking the sum of approximately 10,200,000 Bahraini Dinars (approximately $27,052,000 at December 31, 2009) in damages. The Company provided project management services on the Project and Al Areen failed to pay the Company 679,000 Bahraini Dinars (approximately $1,801,000 at December 31, 2009) for services rendered on the Project. The Company served notice of termination on April 28, 2009. On September 26, 2009, the Company filed a Request for Arbitration with the International Chamber of Commerce, International Court of Arbitration, seeking the sum of 679,000 Bahraini Dinars. The Company has reserved approximately $531,000 against the receivable; however, the Company believes that Al Areen’s claim is without merit and, based on the Company’s current understanding and evaluation of the relevant facts and circumstances, no accrual has been made because the Company considers the chance of loss to be remote.
On September 23, 1996, William Hughes General Contractors, Inc. (“Hughes”) filed a complaint in the Superior Court of New Jersey, Law Division, Gloucester County, against the Monroe Township Board of Education, the Company and other parties, alleging breach of contract and other causes of action in connection with its performance of a construction project for Monroe Township, seeking in excess of $3,500,000 in damages. Monroe Township, which had terminated Hughes from the construction project prior to the commencement of the litigation on the basis of Hughes’ performance, made a cross claim against the Company and other parties for contribution and indemnification. Monroe Township sought approximately $89,000 in damages from the Company, in addition to an indemnification for Hughes’ claims. In relation to the Hughes claims, a claim was made against the Company by Fidelity and Deposit Company of Maryland (“F&D”). F&D claimed damages in the range of $425,000 to $470,000. The F&D claim was defended by the New Jersey Professional Liability Insurance Guarantee Association (“NJPLIGA”) and losses are covered up to $300,000. On September 18, 2009, the parties reached a global settlement in which the NJPLIGA agreed to pay $110,000 to Hughes and Hill agreed to pay $30,000. The Company’s payment of $30,000 is reflected in selling, general and administrative expenses for the year ended December 31, 2009.
General Litigation
From time to time, the Company is a defendant or plaintiff in various legal actions which arise in the normal course of business. As such the Company is required to assess the likelihood of any adverse outcomes to these matters as well as potential ranges of probable losses. A determination of the amount of the provision required for these commitments and contingencies, if any, which would be charged to earnings, is made after careful analysis of each matter. The provision may change in the future due to new developments or changes in circumstances. Changes in the provision could increase or decrease the Company’s earnings in the period the changes are made. It is the opinion of management, after consultation with legal counsel, that the ultimate resolution of these matters will not have a material adverse effect on the Company’s financial condition, results of operations or cash flows.
71
Table of Contents
Off-Balance Sheet Arrangements
The Company enters into agreements with banks for the banks to issue bonds to clients or potential clients for three separate purposes as follows:
| (1) | Certain of the Company’s subsidiaries (Hill International S.A., Hill International (UK) Ltd. and Hill International (Middle East) Ltd.) have entered into contracts for the performance of construction management services which provide that the Company receive advance payment of some of the management fee from the client prior to commencement of the construction project. However, the clients require a guarantee of service performance in the form of an advance payment bond. These bonds are evidenced by Letters of Guarantee issued by the subsidiaries’ banks in favor of the clients. In some cases these clients also require a parent company guarantee. |
| (2) | The Company may also enter into certain contracts which require a performance bond to be issued by a bank in favor of the client for a portion of the value of the contract. These bonds may be exercised by the client in instances where the Company fails to provide the contracted services. |
| (3) | Certain clients may require bonds as part of the bidding process for new work. The bid bonds are provided to demonstrate the financial strength of the companies seeking the work and are usually outstanding for short periods. If the bid is rejected the bond is cancelled and if the bid is accepted the Company may be required to provide a performance bond. |
The maximum potential future payment under these arrangements at December 31, 2009 was $26,743,000.
Cash held in restricted accounts as collateral for the issuance of performance and advance payment bonds at December 31, 2009 and 2008 were $4,401,000 and $4,546,000, respectively.
Note 17—Operating Leases
The Company has numerous operating leases which have various expiration dates through June 2018. Rent expense was approximately $10,414,000, $9,774,000 and $6,511,000 for the years ended December 31, 2009, 2008 and 2007, respectively, which is included in selling, general and administrative expenses in the consolidated statements of earnings. The Company is required to pay property taxes, utilities and other costs related to several of its leased office facilities.
At December 31, 2009, approximate future minimum payments under these leases that have remaining non-cancelable lease terms in excess of one year are as follows:
| (in thousands) | |||
| 2010 |
$ | 8,236 | |
| 2011 |
6,167 | ||
| 2012 |
5,215 | ||
| 2013 |
3,030 | ||
| 2014 |
1,312 | ||
| Thereafter |
937 | ||
| Total |
$ | 24,897 | |
Note 18—Benefit Plans
The Company maintains a 401(k) Retirement Savings Plan (the “401(k) Plan”) for qualified employees. The terms of the 401(k) Plan define qualified employees as those over 21 years of age. Through 2007, the Company matched 50% of the employee contributions up to 4% of employee compensation; commencing in 2008, the Company matched 50% of the employee contributions up to 6% of employee compensation. For the years ended
72
Table of Contents
December 31, 2009 2008 and 2007, the Company recognized expense amounting to $1,384,000, $1,398,000 and $710,000, respectively, which is included in selling, general and administrative expenses in the consolidated statements of earnings.
Note 19—Business Segment Information
The Company’s business segments reflect how executive management makes resource decisions and assesses its performance. The Company bases these decisions on the type of services provided (Project Management and Construction Claims services) and secondarily by their geography (Americas, Europe, the Middle East, North Africa and Asia/Pacific).
The Project Management business segment provides extensive construction and project management services to construction owners worldwide. Such services include program management, project management, construction management, project management oversight, staff augmentation, management consulting, and estimating and cost management services.
The Construction Claims business segment provides such services as claims consulting, litigation support, expert witness testimony, cost and damages assessment, delay and disruption analysis, lender advisory and adjudication services to clients worldwide.
The Company evaluates the performance of its segments primarily on operating profit before corporate overhead allocations and income taxes.
The following tables reflect the required disclosures for the Company’s reportable segments for the fiscal years 2009, 2008 and 2007 (in thousands):
Consulting Fee Revenue:
| 2009 | 2008 | 2007 | ||||||||||||||||
| $ | % | $ | % | $ | % | |||||||||||||
| Project Management |
$ | 276,811 | 76.0 | % | $ | 247,326 | 74.1 | % | $ | 134,968 | 66.4 | % | ||||||
| Construction Claims |
87,199 | 24.0 | % | 86,556 | 25.9 | % | 68,150 | 33.6 | % | |||||||||
| Total |
$ | 364,010 | 100.0 | % | $ | 333,882 | 100.0 | % | $ | 203,118 | 100.0 | % | ||||||
Total Revenue:
| 2009 | 2008 | 2007 | ||||||||||||||||
| $ | % | $ | % | $ | % | |||||||||||||
| Project Management |
$ | 331,986 | 78.7 | % | $ | 289,933 | 76.2 | % | $ | 208,563 | 71.8 | % | ||||||
| Construction Claims |
89,796 | 21.3 | % | 90,549 | 23.8 | % | 81,760 | 28.2 | % | |||||||||
| Total |
$ | 421,782 | 100.0 | % | $ | 380,482 | 100.0 | % | $ | 290,323 | 100.0 | % | ||||||
Operating Profit:
| 2009 | 2008 | 2007 | ||||||||||
| Project Management before equity in earnings of affiliates |
$ | 35,095 | $ | 34,419 | $ | 22,404 | ||||||
| Equity in earnings of affiliates |
8,222 | 3,658 | 2,221 | |||||||||
| 43,317 | 38,077 | 24,625 | ||||||||||
| Construction Claims |
8,277 | 9,480 | 8,229 | |||||||||
| Corporate |
(25,097 | ) | (25,359 | ) | (15,242 | ) | ||||||
| Total |
$ | 26,497 | $ | 22,198 | $ | 17,612 | ||||||
73
Table of Contents
Depreciation and Amortization Expense:
| 2009 | 2008 | 2007 | |||||||
| Project Management |
$ | 4,139 | $ | 3,626 | $ | 994 | |||
| Construction Claims |
2,294 | 2,060 | 2,427 | ||||||
| Subtotal segments |
6,433 | 5,686 | 3,421 | ||||||
| Corporate |
910 | 699 | 319 | ||||||
| Total |
$ | 7,343 | $ | 6,385 | $ | 3,740 | |||
Consulting Fee Revenue by Geographic Region
| 2009 | 2008 | 2007 | ||||||||||||||||
| (in thousands) | ||||||||||||||||||
| Americas |
$ | 75,468 | 20.8 | % | $ | 79,199 | 23.8 | % | $ | 70,264 | 34.5 | % | ||||||
| Europe |
107,193 | 29.4 | % | 110,416 | 33.0 | % | 48,257 | 23.8 | % | |||||||||
| Middle East |
126,749 | 34.8 | % | 116,254 | 34.8 | % | 76,144 | 37.5 | % | |||||||||
| North Africa |
47,482 | 13.0 | % | 20,693 | 6.2 | % | 1,787 | 0.9 | % | |||||||||
| Asia / Pacific |
7,118 | 2.0 | % | 7,320 | 2.2 | % | 6,666 | 3.3 | % | |||||||||
| Total |
$ | 364,010 | 100.0 | % | $ | 333,882 | 100.0 | % | $ | 203,118 | 100.0 | % | ||||||
| 2009 | 2008 | 2007 | ||||||||||||||||
| U.S. |
$ | 72,957 | 20.0 | % | $ | 74,485 | 22.3 | % | $ | 65,796 | 32.4 | % | ||||||
| Non-U.S. |
291,053 | 80.0 | % | 259,397 | 77.7 | % | 137,322 | 67.6 | % | |||||||||
| Total |
$ | 364,010 | 100.0 | % | $ | 333,882 | 100.0 | % | $ | 203,118 | 100.0 | % | ||||||
Total Revenue by Geographic Region:
| 2009 | 2008 | 2007 | ||||||||||||||||
| (in thousands) | ||||||||||||||||||
| Americas |
$ | 122,962 | 29.1 | % | $ | 118,434 | 31.1 | % | $ | 127,424 | 43.9 | % | ||||||
| Europe |
111,165 | 26.4 | % | 114,953 | 30.2 | % | 67,529 | 23.3 | % | |||||||||
| Middle East |
131,963 | 31.3 | % | 118,072 | 31.0 | % | 85,894 | 29.6 | % | |||||||||
| North Africa |
48,311 | 11.5 | % | 21,592 | 5.7 | % | 1,896 | — | ||||||||||
| Asia / Pacific |
7,381 | 1.7 | % | 7,431 | 2.0 | % | 7,580 | 2.6 | % | |||||||||
| Total |
$ | 421,782 | 100.0 | % | $ | 380,482 | 100.0 | % | $ | 290,323 | 99.3 | % | ||||||
| 2009 | 2008 | 2007 | ||||||||||||||||
| U.S. |
$ | 119,858 | 28.4 | % | $ | 113,611 | 29.9 | % | $ | 121,573 | 41.9 | % | ||||||
| Non-U.S. |
301,924 | 71.6 | % | 266,871 | 70.1 | % | 168,750 | 58.1 | % | |||||||||
| Total |
$ | 421,782 | 100.0 | % | $ | 380,482 | 100.0 | % | $ | 290,323 | 100.0 | % | ||||||
In the fourth quarter of 2009, the Company refined its identification of client type and, accordingly, revised it allocation of revenues in the following two tables. The amounts for 2008 and 2007 have been changed to conform to the current year’s presentation.
74
Table of Contents
Consulting Fee Revenue By Client Type:
| 2009 | 2008 | 2007 | ||||||||||||||||
| (Revised) | (Revised) | |||||||||||||||||
| (in thousands) | ||||||||||||||||||
| U.S. federal government |
$ | 45,493 | 12.5 | % | $ | 45,048 | 13.5 | % | $ | 30,696 | 15.1 | % | ||||||
| U.S. state and local governments |
39,003 | 10.7 | % | 34,876 | 10.4 | % | 31,242 | 15.4 | % | |||||||||
| Foreign governments |
104,764 | 28.8 | % | 61,561 | 18.4 | % | 28,001 | 13.8 | % | |||||||||
| Private sector |
174,750 | 47.9 | % | 192,397 | 57.7 | % | 113,179 | 55.7 | % | |||||||||
| Total |
$ | 364,010 | 100.0 | % | $ | 333,882 | 100.0 | % | 203,118 | 100.0 | % | |||||||
Total Revenue By Client Type:
| 2009 | 2008 | 2007 | ||||||||||||||||
| (Revised) | (Revised) | |||||||||||||||||
| (in thousands) | ||||||||||||||||||
| U.S. federal government |
$ | 46,898 | 11.1 | % | $ | 46,892 | 12.3 | % | $ | 33,928 | 11.7 | % | ||||||
| U.S. state, local and regional government |
84,219 | 20.0 | % | 61,475 | 16.2 | % | 85,077 | 29.3 | % | |||||||||
| Foreign government |
107,049 | 25.4 | % | 63,817 | 16.8 | % | 39,581 | 13.6 | % | |||||||||
| Private sector |
183,616 | 43.5 | % | 208,297 | 54.7 | % | 131,737 | 45.4 | % | |||||||||
| Total |
$ | 421,782 | 100.0 | % | $ | 380,481 | 100.0 | % | $ | 290,323 | 100.0 | % | ||||||
Total Assets by Geographic Region:
| December 31, 2009 |
December 31, 2008 | |||||
| Americas |
$ | 139,250 | $ | 138,189 | ||
| Europe |
84,123 | 68,603 | ||||
| Middle East |
57,160 | 41,798 | ||||
| North Africa |
7,308 | 1,876 | ||||
| Asia / Pacific |
3,698 | 3,575 | ||||
| Total |
$ | 291,539 | $ | 254,041 | ||
Property, Plant and Equipment, Net by Geographic Location:
| December 31, 2009 |
December 31, 2008 | |||||
| Americas |
$ | 6,611 | $ | 6,437 | ||
| Europe |
2,628 | 3,046 | ||||
| Middle East |
1,852 | 1,748 | ||||
| North Africa |
232 | 278 | ||||
| Asia / Pacific |
253 | 267 | ||||
| Total |
$ | 11,576 | $ | 11,776 | ||
| 2009 | 2008 | |||||
| U.S. |
$ | 6,611 | $ | 6,370 | ||
| Non-U.S. |
4,965 | 5,406 | ||||
| Total |
$ | 11,576 | $ | 11,776 | ||
75
Table of Contents
Report of Independent Registered Public Accounting Firm
To the Stockholders of
Hill International, Inc. and Subsidiaries
We have audited the accompanying consolidated balance sheets of Hill International, Inc. and Subsidiaries as of December 31, 2009 and 2008, and the related consolidated statements of earnings, stockholders’ equity, comprehensive earnings and cash flows for each of the three years in the period ended December 31, 2009. We also have audited Hill International, Inc. and Subsidiaries’ internal control over financial reporting as of December 31, 2009, based on criteria established in Internal Control-Integrated Framework issued by the Committee of Sponsoring Organizations of the Treadway Commission (‘COSO’). Hill International, Inc. and Subsidiaries’ management is responsible for these financial statements, for maintaining effective internal control over financial reporting, and for its assessment of the effectiveness of internal control over financial reporting, included in the accompanying management’s report. Our responsibility is to express an opinion on these financial statements and an opinion on the company’s internal control over financial reporting based on our audits.
We conducted our audits in accordance with the standards of the Public Company Accounting Oversight Board (United States). Those standards require that we plan and perform the audits to obtain reasonable assurance about whether the financial statements are free of material misstatement and whether effective internal control over financial reporting was maintained in all material respects. Our audits of the financial statements included examining, on a test basis, evidence supporting the amounts and disclosures in the financial statements, assessing the accounting principles used and significant estimates made by management, and evaluating the overall financial statement presentation. Our audit of internal control over financial reporting included obtaining an understanding of internal control over financial reporting, assessing the risk that a material weakness exists, and testing and evaluating the design and operating effectiveness of internal control based on the assessed risk. Our audits also included performing such other procedures as we considered necessary in the circumstances. We believe that our audits provide a reasonable basis for our opinions.
A company’s internal control over financial reporting is a process designed to provide reasonable assurance regarding the reliability of financial reporting and the preparation of financial statements for external purposes in accordance with generally accepted accounting principles. A company’s internal control over financial reporting includes those policies and procedures that (1) pertain to the maintenance of records that, in reasonable detail, accurately and fairly reflect the transactions and dispositions of the assets of the company; (2) provide reasonable assurance that transactions are recorded as necessary to permit preparation of financial statements in accordance with generally accepted accounting principles, and that receipts and expenditures of the company are being made only in accordance with authorizations of management and directors of the company; and (3) provide reasonable assurance regarding prevention or timely detection of unauthorized acquisition, use, or disposition of the company’s assets that could have a material effect on the consolidated financial statements.
Because of its inherent limitations, internal control over financial reporting may not prevent or detect misstatements. Also, projections of any evaluation of effectiveness to future periods are subject to the risk that controls may become inadequate because of changes in conditions, or that the degree of compliance with the policies or procedures may deteriorate.
In our opinion, the consolidated financial statements referred to above present fairly, in all material respects, the financial position of Hill International, Inc and Subsidiaries as of December 31, 2009 and 2008, and the results of their operations and their cash flows for each of the three years in the period ended December 31, 2009 in conformity with accounting principles generally accepted in the United States of America. Also in our opinion, Hill International, Inc. and Subsidiaries maintained, in all material respects, effective internal control over financial reporting as of December 31, 2009, based on criteria established in Internal Control-Internal Framework issued by the Committee of Sponsoring Organizations of the Treadway Commission (COSO).
76
Table of Contents
We have also audited the consolidated financial statement schedule listed in the index at Item 15(a), Schedule II for each of the three years in the period ended December 31, 2009. In our opinion, such consolidated financial statement schedule, when considered in relation to the basic consolidated financial statements taken as a whole, presents fairly in all material respects the information set forth therein.
Amper, Politziner & Mattia, LLP
Edison, New Jersey
March 12, 2010
77
Table of Contents
Quarterly Results (Unaudited)
The following is a summary of certain quarterly financial information for fiscal years 2009 and 2008:
| First Quarter |
Second Quarter |
Third Quarter |
Fourth Quarter |
Total | |||||||||||
| (Revised) | (Revised) | (Revised) | |||||||||||||
| (in thousands, except per share data) | |||||||||||||||
| Year Ended December 31, 2009 |
|||||||||||||||
| Consulting fee revenue |
$ | 92,148 | $ | 91,542 | $ | 86,697 | $ | 93,623 | $ | 364,010 | |||||
| Total revenue |
103,934 | 104,343 | 103,195 | 110,310 | 421,782 | ||||||||||
| Gross profit |
39,255 | 39,069 | 35,551 | 41,083 | 154,958 | ||||||||||
| Operating profit |
4,339 | 6,495 | 8,168 | 7,495 | 26,497 | ||||||||||
| Consolidated net earnings |
4,553 | 5,014 | 6,020 | 4,596 | 20,183 | ||||||||||
| Net earnings attributable to Hill |
4,401 | 4,674 | 5,832 | 4,563 | 19,470 | ||||||||||
| Basic earnings per common share |
0.11 | 0.12 | 0.15 | 0.12 | 0.49 | ||||||||||
| Diluted earnings per common share |
0.11 | 0.12 | 0.15 | 0.12 | 0.49 | ||||||||||
| (Revised) | (Revised) | (Revised) | (Revised) | (Revised) | |||||||||||
| Year Ended December 31, 2008 |
|||||||||||||||
| Consulting fee revenue |
$ | 69,638 | $ | 81,790 | $ | 87,274 | $ | 95,180 | $ | 333,882 | |||||
| Total revenue |
80,893 | 96,880 | 98,100 | 104,609 | 380,482 | ||||||||||
| Gross profit |
32,236 | 36,520 | 38,085 | 43,556 | 150,397 | ||||||||||
| Operating profit |
5,519 | 5,660 | 7,246 | 3,773 | 22,198 | ||||||||||
| Consolidated net earnings |
7,041 | 4,218 | 5,385 | 2,034 | 18,678 | ||||||||||
| Net earnings attributable to Hill |
6,831 | 3,760 | 5,207 | 1,853 | 17,651 | ||||||||||
| Basic earnings per common share |
0.17 | 0.09 | 0.13 | 0.05 | 0.43 | ||||||||||
| Diluted earnings per common share |
0.17 | 0.09 | 0.13 | 0.05 | 0.43 | ||||||||||
During the fourth quarter of 2009, the Company began charging a portion of depreciation and amortization expense, which had previously been reflected in selling, general and administrative expenses, to cost of services. As a result, the consolidated statements of earnings for the first, second and third quarters of 2009 and for each quarter in 2008 have been revised to increase cost of services and decrease selling, general and administrative expenses. This change decreased gross profit, but had no effect on operating profit or net earnings.
| Item 9. | Changes in and Disagreements with Accountants on Accounting and Financial Disclosures. |
None.
| Item 9A. | Controls and Procedures. |
(a) Evaluation of Disclosure Controls and Procedures.
The management of the Company, under the supervision and with the participation of the Company’s Chief Executive Officer and Chief Financial Officer, has evaluated the effectiveness of the Company’s disclosure controls and procedures (as such term is defined in Rule 13a-15(e) of the Securities Exchange Act of 1934, as amended (the “Exchange Act”)), as of December 31, 2009. Based on this evaluation, the Chief Executive Officer and Chief Financial Officer have concluded that, as of that date, the Company’s disclosure controls and procedures were effective to provide reasonable assurance that information required to be disclosed in our reports under the Exchange Act is recorded, processed, summarized and reported within the time periods specified in the Securities and Exchange Commission’s rules and forms, and that such information is accumulated and communicated to management, including our Chief Executive Officer and our Chief Financial Officer, as appropriate, to allow timely decisions regarding required disclosure.
78
Table of Contents
A control system, no matter how well conceived and operated, can provide only reasonable, not absolute, assurance that the objectives of the control system will be met. Further, the design of a control system must reflect the fact that there are resource constraints and the beneifts of controls must be considered relative to their costs. Because of the inherent limitations in all control systems, no evaluation of controls can provide absolute assurance that all control issues and instances of fraud, if any, within the company have been detected. Because of the inherent limitations in a cost-effective control system, misstatements due to error or fraud may occur and not be detected. However, our disclosure controls and procedures are designed to provide reasonable assurance of achieving their objectives.
(b) Management’s Report on Internal Control over Financial Reporting.
The Company’s management is responsible for establishing and maintaining adequate internal control over financial reporting. Internal control over financial reporting is a process designed to provide reasonable assurance of the reliability of financial reporting and of the preparation of financial statements for external reporting purposes, in accordance with U.S. generally accepted accounting principles.
Internal control over financial reporting includes policies and procedures that (1) pertain to the maintenance of records that, in reasonable detail, accurately and fairly reflect transactions and disposition of assets; (2) provide reasonable assurance that transactions are recorded as necessary to permit preparation of financial statements in accordance with U.S. generally accepted accounting principles, and that receipts and expenditures are being made only in accordance with the authorization of its management and directors; and (3) provide reasonable assurance regarding the prevention or timely detection of unauthorized acquisition, use, or disposition of the Company’s assets that could have a material effect on its financial statements.
Because of its inherent limitations, internal control over financial reporting may not prevent or detect misstatements. Also, projections of any evaluation of the effectiveness to future periods are subject to the risk that controls may become inadequate because of changes in conditions, or that the degree of compliance with the policies and procedures included in such controls may deteriorate.
The Company’s management has assessed the effectiveness of the Company’s internal control over financial reporting as of December 31, 2009. In making this assessment, the Company used the criteria established by the Committee of Sponsoring Organizations of the Treadway Commission (COSO) in “Internal Control—Integrated Framework.” These criteria are in the areas of control environment, risk assessment, control activities, information and communication, and monitoring. The Company’s assessment included extensive documenting, evaluating and testing the design and operating effectiveness of its internal controls over financial reporting.
Based on the Company’s processes and assessment, as described above, management has concluded that, as of December 31, 2009, the Company’s internal control over financial reporting was effective.
The Company’s independent registered public accounting firm, Amper, Politziner & Mattia, LLP, independently assessed the effectiveness of the Company’s internal control over financial reporting. Amper, Politziner & Mattia, LLP has issued an attestation report concurring with management’s assessment, which is included at the end of Part II, Item 8 of this Form 10-K.
(c) Changes in Internal Control.
There were no changes in the Company’s internal control over financial reporting during the Company’s fourth quarter ended December 31, 2009, that have materially affected, or are reasonably likely to materially affect, the Company’s internal control over financial reporting.
| Item 9B. | Other Information. |
Not applicable.
79
Table of Contents
| Item 10. | Directors, Executive Officers and Corporate Governance. |
The information in our 2010 Proxy Statement regarding directors and executive officers appearing under the headings “Proposal 1: Election of Directors” and “Other Matters—Section 16(a) Beneficial Ownership Reporting Compliance” is incorporated by reference in this section. The information under the heading “Executive Officers” in Part I, Item 1 of this Form 10-K is also incorporated by reference in this section. In addition, the information under the heading “Corporate Governance” in our 2010 Proxy Statement is incorporated by reference in this section.
We have adopted a code of ethics that applies to all of our employees, including our principal executive officer, principal financial officer, principal accounting officer or controller, or persons performing similar functions. This code of ethics is available on our website at www.hillintl.com, or may be obtained free of charge by making a written request addressed to our Legal Department. We will disclose on our website amendments to, and, if any are granted, waivers of, our code of ethics for our principal executive officer, principal financial officer, principal accounting officer or controller.
| Item 11. | Executive Compensation. |
The information appearing in our 2010 Proxy Statement under the headings “Director Compensation,” “Compensation Discussion and Analysis,” “Report of the Compensation Committee”, and “Executive Compensation” is incorporated by reference in this section.
| Item 12. | Security Ownership of Certain Beneficial Owners and Management and Related Stockholder Matters. |
The information appearing in our 2010 Proxy Statement under the heading “Security Ownership of Certain Beneficial Owners and Management” is incorporated by reference in this section.
Equity Compensation Plan Information
The following table provides information as of December 31, 2009 for common shares of the Company that may be issued under our 2006 Employee Stock Option Plan and our 2008 Employee Stock Purchase Plan. See Note 12 to the consolidated financial statements for further information related to these plans.
| Number of securities to be issued upon exercise of outstanding options, warrants and rights A |
Weighted-average exercise price of outstanding options, warrants and rights B |
Number of securities remaining available for future issuance under equity compensation plans (excluding securities reflected in column A) C |
||||||
| Equity compensation plans approved by security holders (a) |
2,039,500 | $ | 5.18 | 2,993,920 | (1) | |||
| Equity compensation plans not approved by security holders |
— | — | — | |||||
| Total |
2,039,500 | $ | 5.18 | 2,993,920 | ||||
| (1) | Includes 940,605 shares which remain available for future issuance under our 2006 Employee Stock Option Plan, 202,000 shares which remain available for future issuance under our 2006 Restricted Stock Grant Plan, 1,717,315 shares which remain available for future issuance under our 2008 Employee Stock Purchase Plan and 134,000 shares which remain available for future issuance under our 2009 Non-Employee Director Stock Grant Plan. |
80
Table of Contents
| Item 13. | Certain Relationships and Related Transactions, and Director Independence. |
The information appearing in our 2010 Proxy Statement under the headings “Corporate Governance” and “Certain Relationships and Related Transactions” is incorporated by reference in this section.
| Item 14. | Principal Accounting Fees and Services. |
The information appearing in our 2010 Proxy Statement under the headings “Report of the Audit Committee” and “Proposal 2: Ratification of Selection of Independent Registered Public Accounting Firm” is incorporated by reference in this section.
81
Table of Contents
| Item 15. | Exhibits and Financial Statement Schedules. |
| (a) | Documents filed as part of this report: |
Financial statements:
The consolidated balance sheets of the Registrant as of December 31, 2009 and December 31, 2008, the related consolidated statements of earnings, stockholders’ equity, comprehensive earnings and cash flows for each of the years in the three-year period ended December 31, 2009, the footnotes thereto, and the report of Amper, Politziner & Mattia, LLP, independent auditors, are filed herewith.
The balance sheet of Stanley Baker Hill, LLC as of December 31, 2009 and the related statements of operations and members’ equity and cash flows for the year ended December 31, 2009, the footnotes thereto, and the report of Schneider Downs & Co., Inc., independent auditors, are filed herewith.
Financial statement schedule:
Schedule II—Valuation and Qualifying Accounts for the years ended December 31, 2009, 2008 and 2007.
82
Table of Contents
[GRAPHIC APPEARS HERE]
REPORT OF INDEPENDENT REGISTERED PUBLIC ACCOUNTING FIRM
Board of Directors
Stanley Baker Hill, LLC
Beaver, Pennsylvania
We have audited the accompanying balance sheet of Stanley Baker Hill, LLC (Company) as of December 31, 2009, and the related statements of operations and changes in members’ equity and cash flows for the year then ended. These financial statements are the responsibility of the Company’s management. Our responsibility is to express an opinion on these financial statements based on our audit.
We conducted our audit in accordance with the standards of the Public Company Accounting Oversight Board (United States). Those standards require that we plan and perform the audit to obtain reasonable assurance about whether the financial statements are free of material misstatement. The Company is not required to have, nor were we engaged to perform, an audit of its internal control over financial reporting. Our audit included consideration of internal control over financial reporting as a basis for designing audit procedures that are appropriate in the circumstances, but not for the purpose of expressing an opinion on the effectiveness of the Company’s internal control over financial reporting. Accordingly, we express no such opinion. An audit includes examining, on a test basis, evidence supporting the amounts and disclosures in the financial statements. An audit also includes assessing the accounting principles used and significant estimates made by management, as well as evaluating the overall financial statement presentation. We believe that our audit provides a reasonable basis for our opinion,
In our opinion, the financial statements referred to above present fairly, in all material respects, the financial position of Stanley Baker Hill, LLC as of December 31, 2009, and the results of its operations and its cash flows for the year then ended in conformity with accounting principles generally accepted in the United States of America.
[GRAPHIC APPEARS HERE]
Pittsburgh, Pennsylvania
February 12, 2010
[GRAPHIC APPEARS HERE]
83
Table of Contents
STANLEY BAKER HILL, LLC
BALANCE SHEET
DECEMBER 31, 2009
| ASSETS | |||
| CURRENT ASSETS |
|||
| Cash and cash equivalents |
$ | 1,769,000 | |
| Receivables |
14,599,865 | ||
| Costs and estimated earnings in excess of billings on uncompleted contracts |
173,480 | ||
| Prepaid expenses |
834,036 | ||
| Total Current Assets |
17,376,381 | ||
| EQUIPMENT AND SOFTWARE, net |
20,298 | ||
| TOTAL ASSETS |
$ | 17,396,679 | |
| LIABILITIES | |||
| CURRENT LIABILITIES |
|||
| Accounts payable |
$ | 12,418,981 | |
| Other current liabilities |
175,045 | ||
| Total Current Liabilities |
12,594,026 | ||
| MEMBERS’ EQUITY | |||
| MEMBERS’ EQUITY |
4,802,653 | ||
| TOTAL LIABILITIES AND MEMBERS’ EQUITY |
$ | 17,396,679 | |
See notes to financial statements.
84
Table of Contents
STANLEY BAKER HILL, LLC
STATEMENT OF OPERATIONS AND CHANGES IN MEMBERS’ EQUITY
FOR THE YEAR ENDED DECEMBER 31, 2009
| CONTRACT REVENUE EARNED |
$ | 154,140,155 | ||
| COST OF REVENUE EARNED |
||||
| Direct costs |
79,373,556 | |||
| Indirect costs |
53,003,192 | |||
| Gross Profit |
21,763,407 | |||
| SELLING, GENERAL AND ADMINISTRATIVE EXPENSES |
638,845 | |||
| Income From Operations |
21,124,562 | |||
| INTEREST INCOME |
36,757 | |||
| Net Income |
21,161,319 | |||
| MEMBERS’ EQUITY |
||||
| Beginning of year |
5,541,334 | |||
| Distributions |
(21,900,000 | ) | ||
| End of year |
$ | 4,802,653 | ||
See notes to financial statements.
85
Table of Contents
STANLEY BAKER HILL, LLC
STATEMENT OF CASH FLOWS
FOR THE YEAR ENDED DECEMBER 31, 2009
| CASH FLOWS FROM OPERATING ACTIVITIES |
||||
| Net income |
$ | 21,161,319 | ||
| Adjustments to reconcile net income to net cash provided by operating activities: |
||||
| Depreciation and amortization |
10,335 | |||
| Changes in assets and liabilities: |
||||
| Receivables |
8,027,568 | |||
| Costs and estimated earnings in excess of billings on uncompleted contracts |
(638,932 | ) | ||
| Prepaid expenses |
(354,191 | ) | ||
| Accounts payable |
(9,014,549 | ) | ||
| Other current liabilities |
114,575 | |||
| Net Cash Provided By Operating Activities |
19,306,125 | |||
| CASH FLOWS FROM INVESTING ACTIVITIES |
||||
| Purchases of equipment and software |
(23,132 | ) | ||
| CASH FLOWS FROM FINANCING ACTIVITIES |
||||
| Distributions |
(21,900,000 | ) | ||
| Net Decrease In Cash And Cash Equivalents |
(2,617,007 | ) | ||
| CASH AND CASH EQUIVALENTS |
||||
| Beginning of year |
4,386,007 | |||
| End of year |
$ | 1,769,000 | ||
See notes to financial statements.
86
Table of Contents
STANLEY BAKER HILL, LLC
NOTES TO FINANCIAL STATEMENTS
DECEMBER 31, 2009
NOTE 1—ORGANIZATION
Stanley Baker Hill, LLC (Company) is a joint venture formed in February 2004 between Stanley Consultants, Inc. (Stanley), Michael Baker, Jr., Inc. (Baker) and Hill International, Inc. (Hill). The Company provides various architect-engineer services in Iraq for the U.S. Army Corps of Engineers Transatlantic Program Center (U.S. Corps). The Company has a contract for an indefinite delivery and indefinite quantity for construction management and general architect-engineer services for facilities in Iraq with U.S. Corps. Anticipated completion of open contracts is likely to occur in September 2010, barring any additional new contracts or modification to existing contracts obtained in 2010.
NOTE 2—SUMMARY OF SIGNIFICANT ACCOUNTING POLICIES
A summary of significant accounting policies consistently applied by management in the preparation of the accompanying financial statements follows:
The Financial Accounting Standards Board (FASB) issued the FASB Accounting Standards Codification (Codification). The Codification became the single source of authoritative nongovernmental United States generally accepted accounting principles (GAAP), superseding existing FASB, American Institute of Certified Public Accountants, Emerging Issues Task Force and related literature. The Codification eliminates the previous GAAP hierarchy and establishes one level of authoritative GAAP. All other literature is considered nonauthoritative. The Codification was effective for fiscal years ending after September 15, 2009.
Use of Estimates—The preparation of financial statements in conformity with generally accepted accounting principles requires management to make estimates and assumptions that affect the reported amounts of assets and liabilities and disclosure of contingent assets and liabilities at the date of the financial statements and the reported amounts of revenues and expenses during the reporting period. Actual results could differ from those estimates.
Operating Cycle—The Company’s work is performed under cost-plus-fee contracts and fixed-price contracts. The length of the Company’s contracts varies, but is typically less than a year. Assets and liabilities related to long-term contracts are included in current assets and current liabilities in the accompanying balance sheets, since they will be satisfied in the normal course of contract completion, although that might require more than one year at times.
Cash and Cash Equivalents—The Company maintains, at various financial institutions, cash and certificates of deposit that might exceed federally insured amounts at times. For purposes of the statements of cash flows, the Company considers all interest-bearing money market funds and noninterest-bearing accounts to be cash and cash equivalents.
Revenue Recognition and Contract Accounting—The Company typically incurs direct labor costs, subcontractor costs and certain other indirect costs (ODCs) in connection with architect-engineer services. Contracts are structured such that margin is earned on labor costs and not on ODCs. The Company includes revenues related to its direct labor, subcontractors and ODCs in its total contract revenues as long as the Company remains responsible to the client for the acceptability of the services provided.
The Company recognizes revenues under the percentage-of-completion method of accounting. Revenues on fixed-price contracts with a predetermined scope of work are determined by multiplying the estimated margin at completion for each contract by the project’s percentage of completion to date, adding labor costs, subcontractor
87
Table of Contents
STANLEY BAKER HILL, LLC
NOTES TO FINANCIAL STATEMENTS—(Continued)
DECEMBER 31, 2009
NOTE 2—SUMMARY OF SIGNIFICANT ACCOUNTING POLICIES—(Continued)
costs and ODCs incurred to date, and subtracting revenues recognized in prior periods. In applying the percentage-of-completion method to these contracts, the Company measures the extent of progress toward completion as the ratio of labor costs incurred to date over total estimated labor costs at completion. As work is performed under contracts, estimates of the costs to complete are regularly reviewed and updated. As changes in estimates of total costs at completion on projects are identified, appropriate earnings adjustments are recorded during the period that the change is identified.
For contracts with predetermined time period of service, revenue is recognized on a ratio of time elapsed as compared to the total length of the contract.
The majority of new task orders in 2009 were fixed-price contracts, and the remaining new task orders were time-and-materials arrangements. For time-and-materials task orders, revenue is recognized and billed by multiplying the number of hours expended by our professionals in the performance of the contract by the established billing rates.
Provisions for estimated losses on uncompleted contracts are recorded during the period in which such losses are determined. Revenues related to contractual claims that arise from customer-caused delays or change orders unapproved as to both scope and price are recorded only when the amounts have been agreed with the client. Profit incentives and/or award fees are recorded as revenues when the amounts are both probable and reasonably estimable.
The current asset, “Costs and estimated earnings in excess of billings on uncompleted contracts,” represents revenue recognized in excess of amounts billed. The current liability, “Billings in excess of costs and estimated earnings on uncompleted contracts,” represents amounts billed in excess of revenue recognized.
Equipment and Leasehold Improvements—Equipment and leasehold improvements are stated at the lower of cost or fair value. Depreciation and amortization are provided on the straight-line method over the estimated useful lives of the assets. Repairs and maintenance that do not extend the lives of the applicable assets are charged to expense as incurred. Gain or loss resulting from the retirement or other disposition of assets is included in income.
Income Taxes—The Company is organized as an LLC and is not subject to federal or state income taxes. Accordingly, no provision has been made for current or deferred income taxes in these financial statements. The taxable income of the Company is included in the tax returns of the individual members.
Effective January 1, 2009, the Company adopted the Codification Topic for Income Taxes, which prescribes a recognition threshold and measurement attribute for the financial statement recognition and measurement of a tax position taken or expected to be taken in a tax return. This topic also provides guidance on de-recognition, classification, interest and penalties, disclosure and transition. The adoption of this topic did not have a material impact on the Company’s consolidated financial statements. As of December 31, 2009, no liability for unrecognized tax positions was required to be recorded.
Subsequent Events—Subsequent events are defined as events or transactions that occur after the balance sheet date, but before the financial statements are issued or are available to be issued. Management has evaluated subsequent events through February 12, 2010, the date on which the financial statements were available to be issued.
88
Table of Contents
STANLEY BAKER HILL, LLC
NOTES TO FINANCIAL STATEMENTS—(Continued)
DECEMBER 31, 2009
NOTE 3—RECEIVABLES
Receivables at December 31, 2009 consist of the following:
| Contract receivables: |
|||
| Contracts in progress |
$ | 14,582,865 | |
| Other |
17,000 | ||
| $ | 14,599,865 | ||
NOTE 4—COSTS AND ESTIMATED EARNINGS ON UNCOMPLETED CONTRACTS
Costs incurred to date, estimated earnings and the related progress billings to date on contracts in progress at December 31, 2009 are as follows:
| Costs incurred on uncompleted contracts |
$ | 87,768,654 | |
| Estimated earnings |
15,938,361 | ||
| Revenue recognized |
103,707,015 | ||
| Less—Billings to date |
103,533,535 | ||
| Costs and estimated earnings in excess of billings on uncompleted contracts |
$ | 173,480 | |
This amount is reflected in the accompanying balance sheet under the caption “Costs and estimated earnings in excess of billings on uncompleted contracts,”
NOTE 5—EQUIPMENT AND SOFTWARE
Equipment and software at December 31, 2009 consist of the following:
| Computer hardware |
$ | 67,203 | |
| Furniture and fixtures |
2,153 | ||
| 69,356 | |||
| Less—Accumulated depreciation |
49,058 | ||
| $ | 20,298 | ||
89
Table of Contents
STANLEY BAKER HILL, LLC
NOTES TO FINANCIAL STATEMENTS—(Continued)
DECEMBER 31, 2009
NOTE 6—RELATED PARTY TRANSACTIONS
The Company engages in significant related-party transactions as a result of the three partners providing a majority of the costs of contract services. In accordance with the Operating Agreement of the Company, the members also charge the Company for time incurred for management and administrative services at agreed-upon rates. A summary of the related party transactions included in the financial statements at December 31, 2009 is as follows:
| Accounts Payable |
Costs of Services Incurred | |||||
| Stanley |
$ | 3,437,835 | $ | 33,904,272 | ||
| Baker |
3,963,195 | 33,946,307 | ||||
| Hill |
3,534,291 | 34,539,795 | ||||
| $ | 10,935,321 | $ | 102,390,374 | |||
NOTE 7—COMMITMENTS AND CONTINGENCIES
The Company is a defendant in one legal proceeding encountered in the normal course of its business. Additionally, the Company has received a letter threatening lawsuit over a separate matter. In the opinion of management, based upon discussion with counsel, the ultimate outcome of these matters will not have a material adverse effect on the financial position, results of operations or cash flow of the Company.
NOTE 8—FAIR VALUE MEASUREMENTS
The Company’s financial instruments consist primarily of cash, receivables, accounts payable and other current liabilities. The carrying amount of these assets and liabilities approximate fair value due to the short-term nature of such instruments.
90
Table of Contents
| (b) | Exhibits |
Exhibit Index
| Exhibit |
Description | |
| 2.1 | Agreement and Plan of Merger dated December 5, 2005, by and among Arpeggio Acquisition Corporation, Hill International, Inc. and certain stockholders of Hill International, Inc., as amended. (1) | |
| 3.1 | Amended and Restated Certificate of Incorporation of Arpeggio Acquisition Corporation. (2) | |
| 3.2 | Amended and Restated By-laws of Hill International, Inc. (3) | |
| 4.1 | Specimen Common Stock Certificate. (4) | |
| 4.2 | Form of Unit Purchase Option granted to Early Bird Capital, Inc. (4) | |
| 10.1 | Form of Registration Rights Agreement among the Registrant and the Initial Stockholders. (4) | |
| 10.2* | Hill International, Inc. 2006 Employee Stock Option Plan (as amended April 21, 2008). (5) | |
| 10.3 | Form of Escrow Agreement. (6) | |
| 10.4* | Form of Irvin E. Richter Employment Agreement. (7) | |
| 10.5* | Form of David L. Richter Employment Agreement. (8) | |
| 10.6* | Form of Stuart S. Richter Employment Agreement. (9) | |
| 10.7 | Limited Liability Company Agreement of Stanley Baker Hill, LLC. (10) | |
| 10.8 | Joint Venture Operating Agreement dated April 8, 2004 of Stanley Baker Hill, LLC (11) | |
| 10.9 | Subconsultant Agreement dated August 27, 2004 between Hill International, Inc. and Stanley Baker Hill, LLC. (12) | |
| 10.10 | Contract for Construction Management/Build Services dated February 11, 2004 between Hill International, Inc. and City of New York, Department of Design and Construction. (13) | |
| 10.11 | Credit Agreement dated as of June 30, 2009 among Hill International, Inc., as the borrower, Bank of America, N.A., Capital One, N.A., The Private Bank and Trust Company and PNC Bank N.A. (14) | |
| 10.12* | Hill International, Inc. 2009 Non-Employee Director Stock Grant Plan. (15) | |
| 10.13* | Hill International, Inc. 2007 Restricted Stock Grant Plan. (16) | |
| 10.14* | Hill International, Inc. 2008 Employee Stock Purchase Plan. (17) | |
| 14 | Code of Ethics. (18) | |
| 21 | Subsidiaries of the Registrant. | |
| 23.1 | Consent of Independent Registered Public Accounting Firm | |
| 23.2 | Consent of Independent Registered Public Accounting Firm | |
| 31.1 | Certification of Chief Executive Officer pursuant to Section 302 of the Sarbanes-Oxley Act of 2002. | |
| 31.2 | Certification of Chief Financial Officer pursuant to Section 302 of the Sarbanes-Oxley Act of 2002. | |
| 32.1 | Certification of Chief Executive Officer pursuant to Section 906 of the Sarbanes-Oxley Act of 2002 | |
| 32.2 | Certification of Chief Financial Officer pursuant to Section 906 of the Sarbanes-Oxley Act of 2002 | |
91
Table of Contents
| (1) | Included as Annex A of the Definitive Proxy Statement (No. 000-50781) filed on June 6, 2006 and incorporated herein by reference. |
| (2) | Included as Annex B of the Definitive Proxy Statement (No. 000-50781) filed on June 6, 2006 and incorporated herein by reference. |
| (3) | Included as Exhibit 3.2 to the Registrant’s Quarterly Report on Form 10-Q for the quarter ended September 30, 2007 filed on November 13, 2007 and incorporated herein by reference. |
| (4) | Included as an exhibit to the Registrant’s Registration Statement on Form S-1 (No. 333-114816) filed on April 23, 2004 and incorporated herein by reference. |
| (5) | Included as Exhibit 4.4 to the Registrant’s Registration Statement on Form S-8 (No. 333-155332), filed on November 13, 2008 and incorporated herein by reference. |
| (6) | Included as Annex F of the Definitive Proxy Statement (No. 000-50781) filed on June 6, 2006 and incorporated herein by reference. |
| (7) | Included as Annex G of the Definitive Proxy Statement (No. 000-50781) filed on June 6, 2006 and incorporated herein by reference. |
| (8) | Included as Annex H of the Definitive Proxy Statement (No. 000-50781) filed on June 6, 2006 and incorporated herein by reference. |
| (9) | Included as Annex I of the Definitive Proxy Statement (No. 000-50781) filed on June 6, 2006 and incorporated herein by reference. |
| (10) | Included as Exhibit 10.7 to the Registrant’s Current Report on Form 8-K filed on July 5, 2006 and incorporated herein by reference. |
| (11) | Included as Exhibit 10.8 to the Registrant’s Current Report on Form 8-K filed on July 5, 2006 and incorporated herein by reference. |
| (12) | Included as Exhibit 10.9 to the Registrant’s Current Report on Form 8-K filed on July 5, 2006 and incorporated herein by reference. |
| (13) | Included as Exhibit 10.10 to the Registrant’s Current Report on Form 8-K filed on July 5, 2006 and incorporated herein by reference. |
| (14) | Included as Exhibit 10.15 to the Registrant’s Current Report on Form 8-K filed on July 7, 2009 and incorporated herein by reference. |
| (15)* | Included as Exhibit 4.5 to the Registrant’s Registration on Form S-8 (No. 333-155332), filed on June 19, 2009 and incorporated herein by reference. |
| (16)* | Included as Exhibit 4.4 to the Registrant’s Registration Statement on Form S-8 (No. 333-141814), filed on April 2, 2007 and incorporated herein by reference. |
| (17)* | Included as Exhibit 4.4 to the Registrant’s Registration Statement on Form S-8 (No. 333-152145), filed on July 3, 2007 and incorporated herein by reference. |
| (18) | Included as Exhibit 14 to the Registrant’s Quarterly Report on Form 10-QSB for the quarter ended June 30, 2004 filed on August 11, 2004 and incorporated herein by reference. |
| * | Constitutes a management contract or compensatory plan. |
92
Table of Contents
Pursuant to the requirements of Section 13 or 15(d) of the Securities Exchange Act of 1934, the Registrant has duly caused this report to be signed on its behalf by the undersigned, thereunto duly authorized.
| Hill International, Inc. | ||
| By: |
/s/ IRVIN E. RICHTER | |
| Irvin E. Richter | ||
| Chairman and Chief Executive Officer | ||
| Date: March 12, 2010 | ||
Pursuant to the requirements of the Securities and Exchange Act of 1934, this report has been signed by the following persons on behalf of the Registrant and in the capacities and on the dated indicated.
| By: | /s/ IRVIN E. RICHTER Irvin E. Richter Chairman, Chief Executive Officer and Director |
By: | /s/ WILLIAM J. DOYLE William J. Doyle Director | |||
| Date: March 12, 2010 | Date: March 12, 2010 | |||||
| By: | /s/ DAVID L. RICHTER David L. Richter President, Chief Operating Officer and Director |
By: | /s/ BRIAN W. CLYMER Brian W. Clymer Director | |||
| Date: March 12, 2010 | Date: March 12, 2010 | |||||
| By: | /s/ JOHN FANELLI III John Fanelli III Senior Vice President and Chief Financial Officer |
By: | /s/ ALAN S. FELLHEIMER Alan S. Fellheimer Director | |||
| Date: March 12, 2010 | Date: March 12, 2010 | |||||
| By: | /s/ CAMILLE S. ANDREWS Camille S. Andrews Director |
By: | /s/ ERIC S. ROSENFELD Eric S. Rosenfeld Director | |||
| Date: March 12, 2010 | Date: March 12, 2010 | |||||
| By: | /s/ RONALD F. EMMA |
|||||
| Ronald F. Emma Senior Vice President and Chief Accounting Officer |
||||||
| Date: March 12, 2010 | ||||||
93
Table of Contents
Schedule II
Hill International, Inc. and Subsidiaries
Valuation and Qualifying Accounts
(Allowance for Uncollectible Receivables)
| Balance at Beginning of Fiscal Year |
Additions Charged to Earnings |
Other – Allowance Acquired in Acquisitions |
Uncollectible Receivables Written Off, Net of Recoveries |
Balance at End of Fiscal Year | ||||||||||||
| (in thousands) | ||||||||||||||||
| Fiscal year ended December 31, 2009 |
$ | 5,999 | $ | 5,156 | $ | 6 | $ | (1,381 | ) | $ | 9,780 | |||||
| Fiscal year ended December 31, 2008 |
$ | 5,143 | $ | 3,361 | $ | 1,949 | $ | (4,454 | ) | $ | 5,999 | |||||
| Fiscal year ended December 31, 2007 |
$ | 3,373 | $ | 2,271 | $ | 135 | $ | (636 | ) | $ | 5,143 | |||||
94