Attached files
| file | filename |
|---|---|
| 8-K - 8-K - CAMDEN NATIONAL CORP | a8kinvestorpresentation119.htm |

Investor Presentation Gregory Dufour | President & Chief Executive Officer Deborah Jordan | Chief Operating & Financial Officer Renée Smyth | Chief Marketing Officer November 9-10, 2015 0

Forward Looking Statements 1 This presentation contains certain statements that may be considered forward-looking statements under the Private Securities Litigation Reform Act of 1995 and other federal securities laws, including certain plans, exceptions, goals, projections, and statements, which are subject to numerous risks, assumptions, and uncertainties. Forward-looking statements can be identified by the use of the words “believe,” “expect,” “anticipate,” “intend,” “estimate,” “assume,” “plan,” “target,” or “goal” or future or conditional verbs such as “will,” “may,” “might,” “should,” “could” and other expressions which predict or indicate future events or trends and which do not relate to historical matters. Forward-looking statements should not be relied on, because they involve known and unknown risks, uncertainties and other factors, some of which are beyond the control of Camden National Corporation (the “Company”). These risks, uncertainties and other factors may cause the actual results, performance or achievements of the Company to be materially different from the anticipated future results, performance or achievements expressed or implied by the forward-looking statements. The following factors, among others, could cause the Company’s financial performance to differ materially from the Company’s goals, plans, objectives, intentions, expectations and other forward-looking statements: weakness in the United States economy in general and the regional and local economies within the New England region and Maine, which could result in a deterioration of credit quality, an increase in the allowance for loan losses or a reduced demand for the Company’s credit or fee-based products and services; changes in trade, monetary, and fiscal policies and laws, including interest rate policies of the Board of Governors of the Federal Reserve System; inflation, interest rate, market, and monetary fluctuations; competitive pressures, including continued industry consolidation and the increased financial services provided by non-banks; volatility in the securities markets that could adversely affect the value or credit quality of the Company’s assets, impairment of goodwill, the availability and terms of funding necessary to meet the Company’s liquidity needs, and could lead to impairment in the value of securities in the Company's investment portfolio; changes in information technology that require increased capital spending; changes in consumer spending and savings habits; changes in tax, banking, securities and insurance laws and regulations; changes in accounting policies, practices and standards, as may be adopted by the regulatory agencies as well as the Financial Accounting Standards Board ("FASB"), and other accounting standard setters; and the ability of the company to successfully integrate SBM Financial, Inc. and The Bank of Maine. You should carefully review all of these factors, and be aware that there may be other factors that could cause differences, including the risk factors listed in the Company’s filings with the SEC, including our Annual Report on Form 10-K for the year ended December 31, 2014, as updated by the Company's quarterly reports on Form 10-Q and other filings with the Securities and Exchange Commission. You should carefully review the risk factors described therein and should not place undue reliance on our forward-looking statements. These forward-looking statements were based on information, plans and estimates at the date of this report, and we undertake no obligation to update any forward-looking statements to reflect changes in underlying assumptions or factors, new information, future events or other changes, except to the extent required by applicable law or regulation.

Camden National Corporation Camden National Corporation, headquartered in Maine, is a full-service community bank focused on delivering long-term shareholder value through banking, brokerage and wealth management services in Maine, New Hampshire and select markets of New England. A diversified business model includes: Consumer Banking • 64 banking centers throughout Maine • Mortgage lending in Maine & Massachusetts Business Banking • Commercial lending offices in Maine & New Hampshire Wealth Management and Brokerage • Investment management and fiduciary services through Acadia Trust, N.A. and brokerage through Camden Financial Consultants 2

Camden National Corporation Headquarters Camden, ME Ticker CAC (NASDAQ) Current Price $42.82 52 Week Range $35.67 to $43.29 Avg. Daily Volume 14,600 Assets $3.7 billion Loans $2.5 billion Deposits $2.7 billion Market Cap $437 million Analyst Coverage Piper Jaffrey (overweight) KBW (outperform) Information as of 11/5/2015. Pro-forma with SBM acquisition. 3
Investment Summary Experienced Senior Management Team: • Senior management team has an average of over 25 years experience in banking and 12 years with the Company Strong Market Share and Brand Recognition • 140 year operating history • 3rd overall deposit market share in Maine upon acquisition of SBM Financial and top five deposit market share in 11 out of the 13 counties in which we operate • Upon the completion of the SBM Financial acquisition, #2 mortgage originator in Maine, with 7.9% of all mortgage originations in the state (per MRS, Inc. thru August 31, 2015) • Acadia Trust serves over 400 clients throughout the Northeast with $700 million of assets under management Quality Growth • Consistent long-term growth both organically and through acquisitions • Expanded presence in higher growth Southern Maine markets and enhanced scale, density, and deposit costs in existing markets Strong Fundamental Operating Metrics • Historically strong credit quality with nonperforming assets consistently less than 1.5% of total assets • Efficiency ratio, ROAA and ROAE superior to peers 4

Focused Priorities Following a strategic plan with three major initiatives 5 Growth through acquisitions • Acquired SBM Financial (October 2015) • Acquired 14 Bank of America Branches and $287 million of deposits (2012) Growth through talent • Added 8 new lenders since 2013 • Deepened the credit bench • Increased internal training Retail • Branch consolidation • 4 locations (2015) • 2 locations (2013) • Divested 5 rural branches (2013) IT/Support • Outsourced core processing system (Jack Henry) • Expanded digital technology platform • Levered mortgage loan platform and AML/BSA system. Business bank • Opened New Hampshire commercial loan production office (2014) • Expanding Treasury Management services and capabilities (2015) • Maintain #1 Finance Authority of Maine (FAME) ranking Build Market Share Create Efficiencies Expand Business Segment 1 2 3

Market Overview Maine • Projected 7.79% growth in household income for 2015 to 2020 • Unemployment rate of 4.5% as of August 2015 • Hospitality and tourism generate more than $2 billion in household income annually New Hampshire • Projected 7.32% growth in household income for 2015 to 2020 • Unemployment rate of 3.6% as of August 2015 • State GDP grew 2.3% to $71.6 billion in 2014 1) Mass Affluent Households defined as households with Interest Producing Assets between $250,000 and $1,000,000 Sources: SNL Financial, Bureau of Economic Analysis, Nielsen, Maine Office of Tourism 6 Expanding Footprint to Higher Growth Market Pre-Merger Southern Maine Southern Market Segments & Growth Footprint Maine New Hampshire Total Households 291,602 202,605 453,657 Projected Growth, 2014 to 2019 0.2% 1.9% 1.3% Mass Affluent Households1 78,216 102,179 259,169 % of Total Households 26.8% 50.4% 57.1% Number of Businesses 41,767 32,627 65,959

Growth through Acquisition SBM Financial (The Bank of Maine) • Acquired October 2015 • 24 branches • Deposits: $685 million • Loans: $646 million • Smooth integration and limited/isolated customer transition issues • Immediately expands market share to southern Maine • Opportunity to rebrand bank and create new consumer products • Positions Camden National as the largest community bank in Maine 7

Earnings Results • Solid earnings performance complimented by cost savings and momentum from the SBM Financial acquisition 8 SBM Financial Impact • Mid-teens EPS accretion in 2016 and beyond • Tangible Book Value dilution of 13.6% with earn back in five years • 15%+ Internal Rate of Return • Pro-forma Tangible Common Equity of 7% • Target Return on Tangible Equity of 15% in 2016 Net Income and EPS $0.00 $0.50 $1.00 $1.50 $2.00 $2.50 $3.00 $3.50 $4.00 $0 $5 $10 $15 $20 $25 $30 2010 2011 2012 2013 2014 YTD Q3 2015 M il li o n s

Strong Credit Culture • Community-based, relationship focused lenders with local decision making • Significant small-business lending driven by unmatched market expertise • Disciplined risk management culture • Proactive internal and external loan review process anticipating problematic loans • Conservative limits • All of the key credit quality ratios remain strong 9

Long-Term Shareholder Value 10 $1.27 $3.28 $0.00 $1.00 $2.00 $3.00 $4.00 '99 '00 '01 '02 '03 '04 '05 '06 '07 '08 '09 '10 '11 '12 '13 '14 $8.57 $26.52 $0.00 $5.00 $10.00 $15.00 $20.00 $25.00 $30.00 '99 '00 '01 '02 '03 '04 '05 '06 '07 '08 '09 '10 '11 '12 '13 '14 0% 10% 20% 30% 40% 50% 60% '99 '00 '01 '02 '03 '04 '05 (a) '06 '07 '08 '09 '10 '11 (a) '12 '13 '14 $0 $10 $20 $30 $40 $50 $60 $70 $80 $90 '99 '00 '01 '02 '03 '04 '05 '06 (b) '07 '08 '09 '10 '11 '12 '13 '14 a) 2005 and 2011, special $0.50 dividend b) 2006 issuance of trust preferred and share buyback Earnings Per Share Dividends as % of Net Income Cumulative Stock Repurchases ($ in millions) TBV Per Share

Why Invest in Camden National? • Diversified business model creates strong franchise value • Track record of solid performance • Geographic footprint expanding into high growth markets • History of successfully integrating acquisitions • Strong and stable asset quality with disciplined credit environment • Strong mortgage platform • Largest public company in Northern New England • Consistent, experienced leadership team 11
12 Appendix

Seasoned Management Team 13 Name Position Age Years of Banking Experience Year joined Camden Greg Dufour President and CEO 55 25+ 2001 Debbie Jordan, CPA COO & CFO 50 20+ 2008 Joanne Campbell EVP Risk Management 52 30+ 1996 Carolyn Crosby SVP Human Resources 49 25+ 1996 Peter Greene(a) EVP Operations/Technology 55 30+ 2008 Edmund Hayden(b) EVP Chief Credit Officer 59 30+ 2015 Tim Nightingale EVP Senior Loan Officer 57 30+ 2000 June Parent EVP Retail Banking 51 25+ 1995 Renee Smyth(b) SVP Chief Marketing Officer 45 15+ 2015 (a) On October 23, 2015, Mr. Greene notified the Company of his intention to retire effective January 1, 2016. Refer to Form 8K filed on October 29, 2015 for further information. (b) Former SBM Financial employees.

Financial Highlights 14 (in million’s) 9/30/15 9/30/14 12/31/14 12/31/13 Loans (a) $1,830 $1,726 $1,773 $1,580 Investment Securities 820 804 804 828 Total Assets 2,872 2,742 2,790 2,604 Deposits (b) 2,008 1,929 1,932 1,814 Borrowings 564 541 577 530 Shareholders’ Equity 259 240 245 231 Tier 1 Leverage Ratio 9.41% 9.15% 9.26% 9.43% (a) Loans: 6% growth – 9/30/15 over 9/30/14 12% growth - 12/31/14 over 12/31/13 (b) Deposits: 4% growth – 9/30/15 over 9/30/14 7% growth – 12/31/14 over 12/31/13 Balance Sheet

Financial Highlights 15 Nine Months Ended Year Ended Core(a) 9/30/15 GAAP 9/30/15 9/30/14 2014 2013 Net Income (in millions) $20.5 $19.3 $18.5 $24.6 $22.8 Diluted Earnings per Share $2.74 $2.57 $2.46 $3.28 $2.97 Return on Tangible Equity(a) 13.75% 12.60% 13.71% 13.46% 14.55% Return on Assets 0.97% 0.91% 0.93% 0.92% 0.88% Efficiency Ratio(a) 59.80% 59.80% 61.01% 61.58% 62.78% Net Interest Margin 3.08% 3.12% 3.10% 3.11% 3.20% Net Income and Key Ratios (a) Core earnings excludes merger costs and net investment gains recorded through 9/30/15 and is a non-GAAP measure. The Return on Tangible Equity and Efficiency Ratio are also non-GAAP measures. Refer to the Form 10-Q for 9/30/15 and the Form 10-K for 12/31/14 for the reconciliation of non-GAAP to GAAP financial measures.
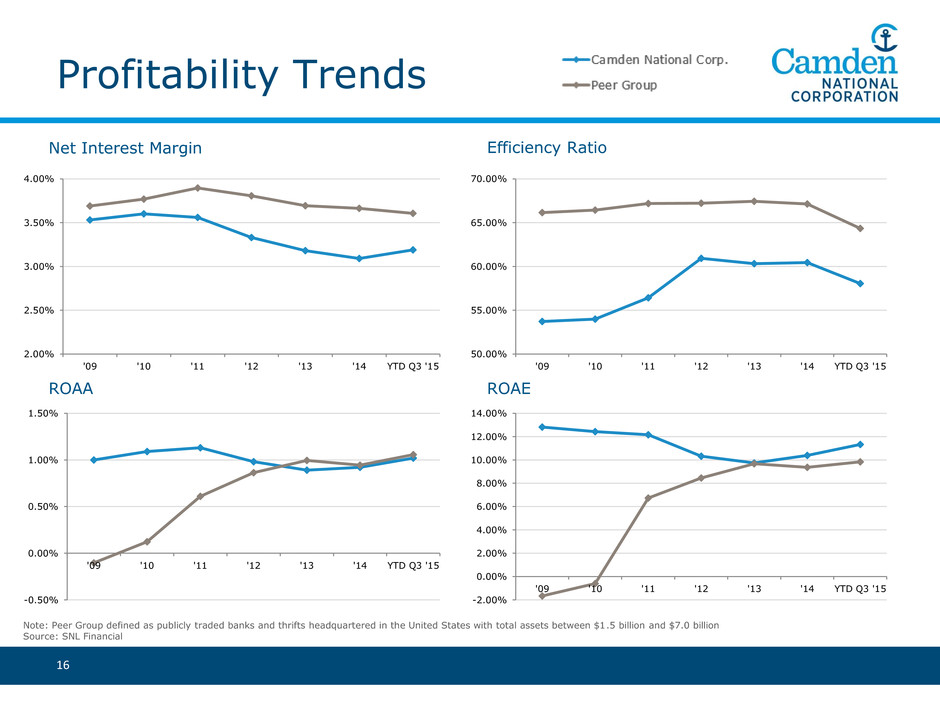
Profitability Trends Note: Peer Group defined as publicly traded banks and thrifts headquartered in the United States with total assets between $1.5 billion and $7.0 billion Source: SNL Financial 16 Net Interest Margin Efficiency Ratio ROAEROAA 2.00% 2.50% 3.00% 3.50% 4.00% '09 '10 '11 '12 '13 '14 YTD Q3 '15 50.00% 55.00% 60.00% 65.00% 70.00% '09 '10 '11 '12 '13 '14 YTD Q3 '15 -0.50% 0.00% 0.50% 1.00% 1.50% '09 '10 '11 '12 '13 '14 YTD Q3 '15 -2.00% 0.00% 2.00% 4.00% 6.00% 8.00% 10.00% 12.00% 14.00% '09 '10 '11 '12 '13 '14 YTD Q3 '15
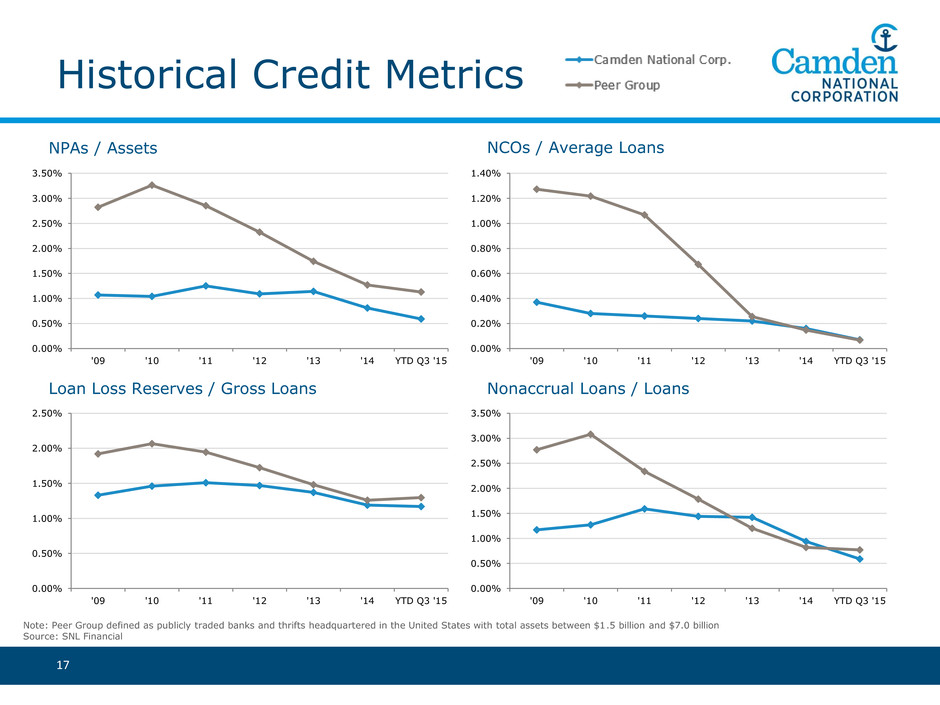
Historical Credit Metrics Note: Peer Group defined as publicly traded banks and thrifts headquartered in the United States with total assets between $1.5 billion and $7.0 billion Source: SNL Financial 17 NPAs / Assets NCOs / Average Loans Loan Loss Reserves / Gross Loans Nonaccrual Loans / Loans 0.00% 0.50% 1.00% 1.50% 2.00% 2.50% 3.00% 3.50% '09 '10 '11 '12 '13 '14 YTD Q3 '15 0.00% 0.20% 0.40% 0.60% 0.80% 1.00% 1.20% 1.40% '09 '10 '11 '12 '13 '14 YTD Q3 '15 0.00% 0.50% 1.00% 1.50% 2.00% 2.50% '09 '10 '11 '12 '13 '14 YTD Q3 '15 0.00% 0.50% 1.00% 1.50% 2.00% 2.50% 3.00% 3.50% '09 '10 '11 '12 '13 '14 YTD Q3 '15

Loan Profile 18 As of 9/30/15 Commercial 14% Commercial Real Estate 38% Residential Mortgages 32% Home Equity/Consumer 16% CNC Pro Forma Change in Portfolio Mix (Average Balances) Total Loans:$1.83 billion Yield: 4.07% Commercial 15% Commercial Real Estate 35% Residential Mortgages 35% Home Equity/Consumer 15% Total Loans:$2.48 billion Yield: 4.13% 0 200 400 600 800 1,000 1,200 1,400 2009 2010 2011 2012 2013 2014 2015Q3 Pro Forma M il li o n s Commercial Retail

Funding 19 As of 9/30/15 CNC Checking 31% Saving/Money Market 25% CD's 22% Borrowings 22% Pro Forma Change in Funding Mix (Average Balances) Funding:$2.57 billion Total Funding Cost: 0.47% Deposit Cost: 0.27% Checking 31% Saving/Money Market 28% CD's 23% Borrowings 18% Funding:$3.30 billion Total Funding Cost: 0.45% Deposit Cost: 0.30% 0 200 400 600 800 1,000 1,200 1,400 1,600 1,800 2,000 2009 2010 2011 2012 2013 2014 2015Q3 Pro Forma M il li o n s Core Deposits CDs & Borrowings

$0 $500 $1,000 $1,500 $2,000 $2,500 $3,000 $3,500 1994 1996 1998 2000 2002 2004 2006 2008 2010 2012 2014 Asset Growth 20 Through 12/31/14 Organic Growth: $1,194 million Acquired Growth: $1,140 million Total Growth CAGR: 9.5% United Corp. $54 million KSB Bancorp $179 million Key Bank 4 Branches $54 million Union Bankshares $565 million Bank of America 14 Branches $287 million Branch Sale 5 Branches $46 million The Bank of Maine $806 million • Successful track record of growing the franchise through combination of organic growth and acquisitions (51% organic growth over 20 year horizon).
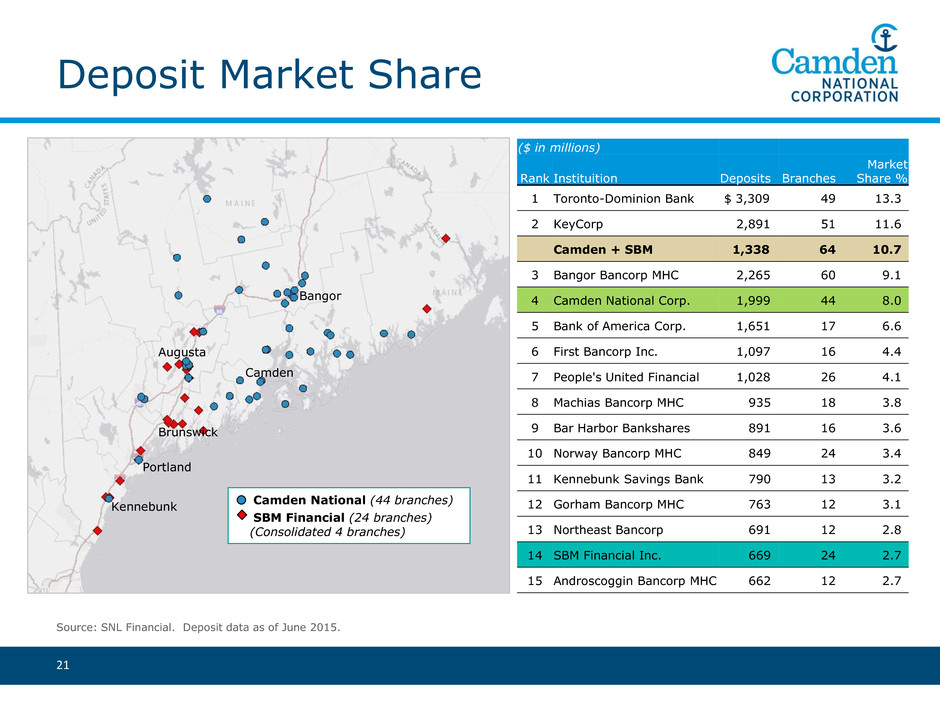
Deposit Market Share 21 Camden National (44 branches) SBM Financial (24 branches) (Consolidated 4 branches) Bangor Camden Augusta Brunswick Portland Kennebunk Source: SNL Financial. Deposit data as of June 2015. ($ in millions) Rank Instituition Deposits Branches Market Share % 1 Toronto-Dominion Bank $ 3,309 49 13.3 2 KeyCorp 2,891 51 11.6 Camden + SBM 1,338 64 10.7 3 Bangor Bancorp MHC 2,265 60 9.1 4 Camden National Corp. 1,999 44 8.0 5 Bank of America Corp. 1,651 17 6.6 6 First Bancorp Inc. 1,097 16 4.4 7 People's United Financial 1,028 26 4.1 8 Machias Bancorp MHC 935 18 3.8 9 Bar Harbor Bankshares 891 16 3.6 10 Norway Bancorp MHC 849 24 3.4 11 Kennebunk Savings Bank 790 13 3.2 12 Gorham Bancorp MHC 763 12 3.1 13 Northeast Bancorp 691 12 2.8 14 SBM Financial Inc. 669 24 2.7 15 Androscoggin Bancorp MHC 662 12 2.7

Mortgage Banking Activity • The SBM Financial acquisition positions CAC as the #2 Mortgage Originator in Maine 22 Source: MRS, Inc. Year-to-Date as of August 31, Year Ended December 31, 2014 2015 2014 Top 15 Lenders Originations Rank % of Total Originations Originations Rank % Total Bangor Savings Bank 2,312 1 8.6% 2,000 3,059 1 8.6% Camden National Bank + The Bank of Maine 2,105 7.9% 1,732 2,692 7.5% Residential Mortgage Services Inc. 1,528 2 5.7% 1,197 1,902 2 5.2% Camden National Bank 1,459 3 5.4% 1,212 1,882 3 5.2% Key Bank 1,176 4 4.4% 999 1,593 4 4.3% TD Bank, N.A. 1,055 5 3.9% 1,040 1,561 5 4.5% Kennebec Savings Bank 895 6 3.3% 699 1,124 7 3.0% Quicken Loans 865 7 3.2% 760 1,287 6 3.3% First, N.A. 772 8 2.9% 650 1,042 9 2.8% Norway Savings Bank 723 9 2.7% 581 956 10 2.5% Bank of America 674 10 2.5% 547 896 11 2.4% Machias Savings Bank 665 11 2.5% 687 1,050 8 3.0% The Bank of Maine 646 12 2.4% 520 810 13 2.2% Saco & Biddeford Savings Inst. 513 13 1.9% 492 764 14 2.1% Wells Fargo Bank 502 14 1.9% 449 684 15 1.9% Gorham Savings Bank 490 15 1.8% 382 632 16 1.6% Total for All Lenders 26,815 -- 100.0% 23,166 36,618 -- 100.0%
