Attached files
| file | filename |
|---|---|
| 8-K - 8-K - New York REIT Liquidating LLC | v423830_8k.htm |
Exhibit 99.1

0 February 2014 Investor Presentation November 2015

1 1 Forward Looking Statements & Projections Certain statements included in this presentation are forward - looking statements . Those statements include statements regarding the intent, belief or current expectations of New York REIT, Inc . (the “Company,” “NYRT,” "we," "our" or "us ") and members of our management team, as well as the assumptions on which such statements are based, and generally are identified by the use of words such as "may," " will", " seeks," "anticipates," "believes," "estimates," "expects," " plans," "intends," "should" or similar expressions . Actual results may differ materially from those contemplated by such forward - looking statements, including those set forth in the Risk Factors section of NYRT's Annual Report on Form 10 - K filed with the U . S . Securities and Exchange Commission . Further , forward - looking statements speak only as of the date they are made, and we undertake no obligation to update or revise forward - looking statements to reflect changed assumptions, the occurrence of unanticipated events or changes to future operating results over time, unless required by law . The following are some of the risks and uncertainties, although not all risks and uncertainties, that could cause our actual results to differ materially from those presented in our forward - looking statements : • All of our executive officers are also officers, managers and/or holders of a direct or indirect interest in our Advisor and other American Realty Capital - affiliated entities ; as a result, our executive officers, New York Recovery Advisors, LLC (our “Advisor”) and its affiliates face conflicts of interest, including significant conflicts created by our Advisor’s compensation arrangements with us and other investor entities advised by American Realty Capital affiliates, and conflicts in allocating time among these entities and us, which could negatively impact our operating results ; • Because investment opportunities that are suitable for us may also be suitable for other American Realty Capital - advised programs or investors , our Advisor and its affiliates face conflicts of interest relating to the purchase of properties and other investments and such conflicts may not be resolved in our favor, meaning that we could invest in less attractive assets, which could reduce the investment return to our stockholders ; • We depend on tenants for our revenue, and, accordingly, our revenue is dependent upon the success and economic viability of our tenants ; • We may not be able to achieve our rental rate incentives and our expenses could be greater, which may impact our results of operations ; • Increases in interest rates could increase the amount of our debt payments and limit our ability to pay dividends ; • We have not generated and may not generate cash flows sufficient to pay returns to our stockholders, as such, we may be forced to borrow at higher rates or depend on our Advisor or our property manager, New York Recovery Properties, LLC (our "Property Manager"), to waive fees or reimbursement of certain expenses to fund our operations, and any payments to our stockholders . There is no assurance these entities will waive such amounts . • We may be unable to pay or maintain cash dividends or increase dividends over time . Amounts paid to our stockholder may be a return of capital and not a return on a stockholder's investment . • We are obligated to pay fees, which may be substantial, to our Advisor and its affiliates, including fees payable upon the sale of properties ; • We are subject to risks associated with the significant dislocations and liquidity disruptions that recently existed or occurred in the credit markets of the United States ; • We may fail to continue to qualify to be treated as a real estate investment trust for U . S . federal income tax purposes ; • Our properties may be adversely affected by economic cycles and risks inherent to the New York metropolitan statistical area, especially New York City ; and • We may be adversely affected by changes in general economic, business and political conditions, including the possibility of intensified international hostilities, acts of terrorism, and changes in conditions of United States or international lending, capital and financing markets . This presentation includes estimated projections of future operating results. These projections were not prepared in accordan ce with published guidelines of the SEC or the guidelines established by the American Institute of Certified Public Accountants for preparation and presentation of financial projections. This information is not fact and shou ld not be relied upon as being necessarily indicative of future results; the projections were prepared in good faith by management and are based on numerous assumptions that may prove to be wrong. Important factors that may affect act ual results and cause the projections to not be achieved include, but are not limited to, risks and uncertainties relating to the company and other factors described under “Risk Factors” sections of the Company’s Annual Report on Form 10 - K and any subsequent Quarterly Reports on Form 10 - Q or Current Reports on Form 8 - K and “Forward - Looking Statements.” The projections also reflect assumptions as to certain business decisions that are subject t o change. As a result, actual results may differ materially from those contained in the estimates. Accordingly, there can be no assurance that the estimates will be realized. This presentation also contains estimates and information concerning our industry, including market position, market size, an d g rowth rates of the markets in which we participate, that are based on industry publications and reports. This information involves a number of assumptions and limitations, and you are cautioned not to give undue weight to th ese estimates. We have not independently verified the accuracy or completeness of the data contained in these industry publications and reports. The industry in which we operate is subject to a high degree of uncerta int y and risk due to variety of factors, including those described in the “Risk Factors” section of the Company’s Annual Report on Form 10 - K and any subsequent Quarterly Reports on Form 10 - Q or Current Reports on Form 8 - K. These and other factors could cau se results to differ materially from those expressed in these publications and reports .

2 » NYRT announced a series of strategic initiatives to enhance shareholder value on October 1 • Appointed Marc Rowan as a Director • Plan to appoint two independent directors in the near future • Engaged Eastdil Secured as strategic advisor to identify and consider potential strategic transactions at the asset or entity level • R eleasing parties who participated in a previous strategic transaction process from the standstill provisions of their non - disclosure agreements • In the process of implementing a joint venture arrangement with American Realty Capital New York City REIT, Inc. (“NYCR”) • Intended to better align interests between the two entities • Proposed changes to management agreement to further align its terms with the interests of NYRT’s shareholders • Will be implemented as part of the renewal of the agreement in mid - 2016 • Remain a one - year agreement • N o disposition fees • No leasing or property management fees paid to the advisor or its affiliates • C ontinuing the process to identify and hire a permanent CFO » NYRT also has recently taken steps to refinance its debt to provide for more financial flexibility • Provides for incremental liquidity in near - term to execute on strategic initiatives Update on Strategic Initiatives
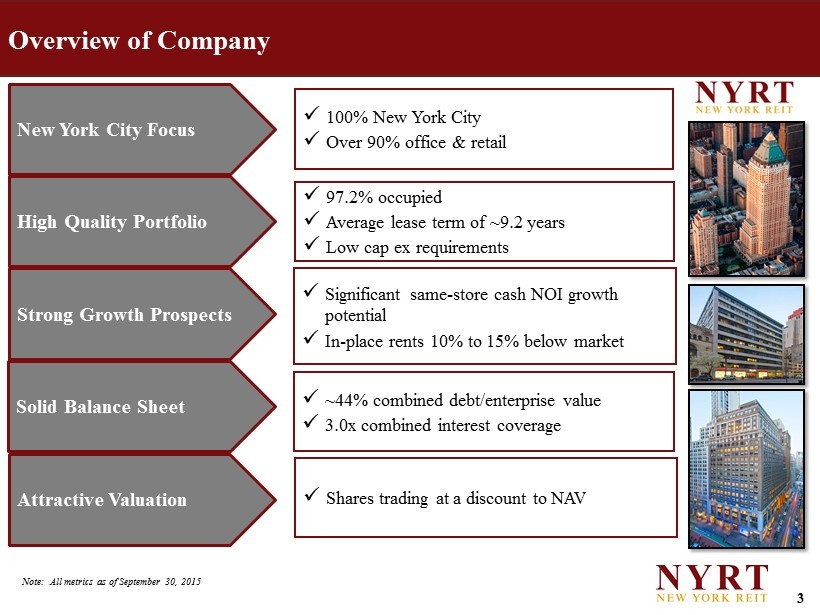
3 Overview of Company x Significant same - store cash NOI growth potential x In - place rents 10% to 15 % below market x 100% New York City x Over 90% office & retail x 97.2% occupied x Average lease term of ~9.2 years x Low cap ex requirements x ~ 44% combined debt/enterprise value x 3.0x combined interest coverage x Shares trading at a discount to NAV New York City Focus High Quality Portfolio Solid Balance Sheet Strong Growth Prospects Attractive Valuation Note: All metrics as of September 30, 2015

4 Portfolio Snapshot (as of 9/30/15) In - place rents are believed to be 10 - 15% below market Number of Properties 23 Square Feet 3.4 million Occupancy 97.2 % % SF Expiring by Year 2015 6.0% 2016 3.3% 2017 3.4% Sub - total 12.7%

5 Cash Rent Portfolio Mix (1) Includes retail at office buildings (2) Includes parking, hotel, and multifamily Note: All calculations are based on September 30, 2015 annualized cash rents, excluding Viceroy Hotel and 416 Washington Street parking garage which are third party managed and based on September 30, 2015 annualized Cash NOI. Cash Rent by Property Type Manhattan Brooklyn Queens Cash Rent by Borough NYRT is: » 100% New York City » 92% Office/Retail Office Retail (1) Other (2) 76% 16% 8% 96% 3% 1%

6 Five Properties Account for 70% Portfolio Cash NOI Note: All metrics are as of 9/30/2015 (1) Square footage represents 48.9 % of building total which is NYRT’s pro rata share of its joint venture investment in Worldwide Plaza (2) Weighted by Annualized Cash Rental Income Top 5 properties account for more than 70 % of portfolio Cash NOI Property Square Footage Occupancy (as of 9/30/15) Average Remaining Lease Term (2) Borough Worldwide Plaza (1) 1,002,251 99.9% 11.9 Manhattan 1440 Broadway 747,854 96.8% 4.9 Manhattan Twitter Building 281,294 100.0% 11.8 Manhattan 333 West 34th Street 346,728 100.0% 8.6 Manhattan Red Bull Building 165,670 100.0% 7.8 Manhattan Total 5 Major Assets 2,543,797 99.0% 9.3
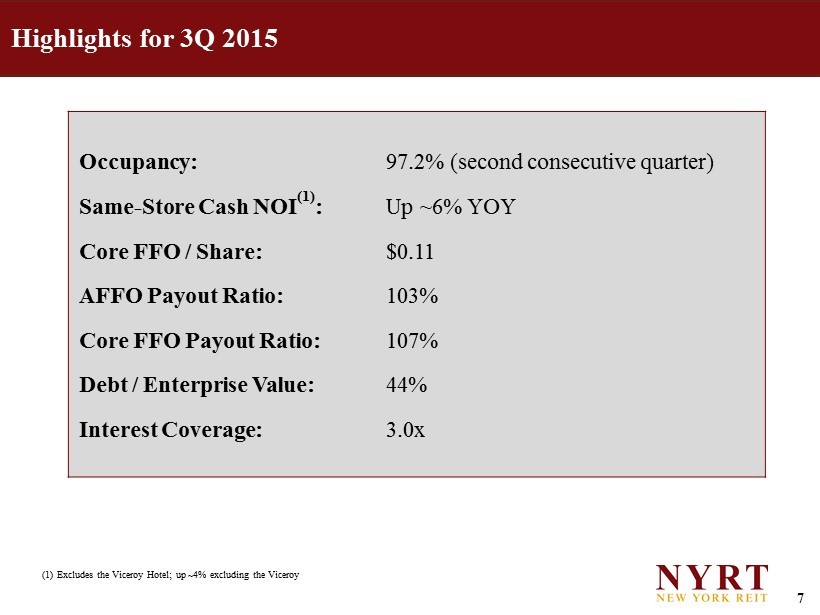
7 Highlights for 3Q 2015 Occupancy: 97.2% (second consecutive quarter ) Same - Store Cash NOI (1) : Up ~6% YOY Core FFO / Share: $0.11 AFFO Payout Ratio: 103% Core FFO Payout Ratio: 107% Debt / Enterprise Value: 44% Interest Coverage: 3.0x (1) Excludes the Viceroy Hotel; up ~4% excluding the Viceroy

8 (1) Per NYRT Q3 2015 Quarterly Supplemental (excludes Viceroy Hotel); quarterly figure is multiplied by 4 to arrive at an annuali zed number (2) Includes free rent from executed leases that commenced during or after Q3 2015 and thus did not have a full quarter of Increm ent al Cash NOI in Q3 (3) Based on total estimated gross revenue using $55 psf blended rent on total portfolio square feet excluding hotel and multifa mil y Note: Cash net operating income (“Cash NOI”) is a non - GAAP metric and is further defined in the “Non - GAAP Metrics” section of this presentation Same - Store NOI Bridge Run Rate Q3 Cash NOI ( 1 ) (excluding Viceroy) $ 124 mm Plus: Existing Contractual Free Rent (1) $7 mm =Adjusted Run Rate Q3 Cash NOI (excluding Viceroy) $131mm Key Events: Approximate Incremental Cash NOI (millions) A) Remaining Contractual Free Rent Burn Off (2) 1 B) Stabilize Viceroy Cash NOI 10 C) Reposition 1440 Broadway Retail 4 D) Mark to Market 2015 & 2016 Lease Rollover 0 Total Cash NOI from Key Events $15 Total Run Rate Cash NOI + Key Events $ 146 Other Contractual Rent Increases (2 years @ 3%) 9 Lease up to 100% Occupancy 4 General Vacancy @ 4% (3) - 7 Target Stabilized Cash NOI $ 152
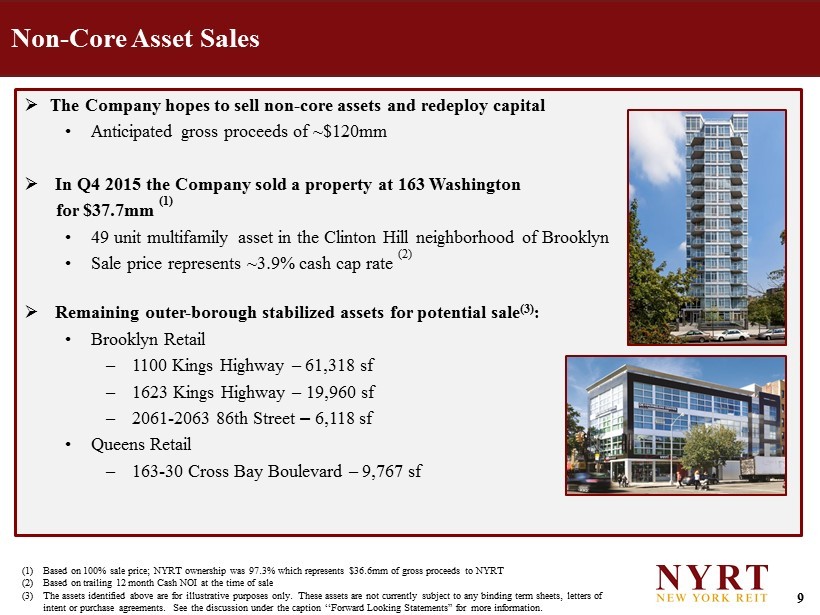
9 » The Company hopes to sell non - core assets and redeploy capital • Anticipated gross proceeds of ~$120mm » In Q4 2015 the Company sold a property at 163 Washington for $37.7mm (1) • 49 unit multifamily asset in the Clinton Hill neighborhood of Brooklyn • Sale price represents ~3.9% cash cap rate (2) » Remaining outer - borough stabilized assets for potential sale (3) : • Brooklyn Retail ‒ 1100 Kings Highway – 61,318 sf ‒ 1623 Kings Highway – 19,960 sf ‒ 2061 - 2063 86th Street – 6,118 sf • Queens Retail ‒ 163 - 30 Cross Bay Boulevard – 9,767 sf Non - Core Asset Sales (1) Based on 100% sale price; NYRT ownership was 97.3% which represents $36.6mm of gross proceeds to NYRT (2) Based on trailing 12 month Cash NOI at the time of sale (3) The assets identified above are for illustrative purposes only. These assets are not currently subject to any binding term sheets, letters of intent or purchase agreements. See the discussion under the caption “Forward Looking Statements” for more information.

10 Benefits of External Management Cost Management Contract Terms Share - Based Incentives Potential misalignment of interests between shareholders and managers regarding growth initiatives Benefits Challenges More cost efficient given current size Depth of management team and breadth of support services platform Short term contract (one - year term), subject to annual review by independent directors Outperformance Plan is entirely based on total return to shareholders

11 Non - GAAP Metrics This presentation uses certain non - GAAP metrics, including Funds from Operations (“FFO”), Adjusted Funds from Operations (“AFFO” ), Core Funds From Operations (“ Core FFO”), Net Operating Income (“NOI”), Cash Net Operating Income (“Cash NOI”) and Incremental Net Operating Income (“Incremental NOI”). We believe that, since real estate values historically rise and fall with market conditions, including inflation, int ere st rates, the business cycle, unemployment and consumer spending, presentations of operating results for a REIT using histori cal accounting may be something less informative than such non - GAAP financial metrics. However, these non - GAAP metrics should be read in conjunction with our reported GAAP financial statement s. Note that our computation of these non - GAAP performance metrics may not be comparable to similarly - named performance metrics rep orted by other REITs or real estate companies, limiting their usefulness as a comparative measure. We compensate for these li mit ations by relying primarily on our GAAP results and using the non - GAAP measures only for supplemental purposes. Please see our consolidated financial statements and the related notes thereto. We use these non - GAAP metrics as an important part of our report and planning processes to, among other things,: • Monitor and evaluate the performance of our business operations; • Facilitate management’s internal comparisons of the historical operating performance of our business operations; • Facilitate management’s external comparisons of the results of our overall business to the historical operating performance ot her companies that may have different capital structures and debt levels; • Analyze and evaluate financial and strategic planning decisions regarding future operating investments; • Provide useful information to investors regarding financial and business trends related to our results of operations; and • Plan for and prepare future annual operating budgets and determine appropriate levels of operating investments. These non - GAAP measures have limitations as analytical tools, and you should not consider any of these measures in isolation or as a substitute for analyses of our income or cash flows as reported under GAAP. Some these limitations are: • They do not reflect our cash expenditures, or future requirements for capital expenditures, or contractual commitments; • They do not reflect changes in, or cash requirements for, our working capital needs; • They do not reflect the interest expense, or the cash requirements necessary to service interest or principal payments, on our debt; and depreciation, amortization and non - cash expense items that are reflected in our statements of cash flows . Funds from operations (FFO) Pursuant to the revised definition of funds from operations adopted by the Board of Governors of the National Association of Real Estate Investment Trusts (“NAREIT”), we calculate funds from operations (FFO) ; a non - GAAP financial measure ; by adjusting net income (loss) attributable stockholders (computed in accordance with GAAP, including non - recurring items) for gains (or losses) from sales of properties, impairment losses on depreciable real estate of consolidated real estate, impairment losses on investments in unconsolidated joint ventures driven by a measurable decrease in the fair value of depreciable real estate held by the unconsolidated joint ventures, real estate related depreciation and amortization, and after adjustment for unconsolidated partnerships and joint ventures . FFO is a non - GAAP financial measure . The use of FFO, combined with the required primary GAAP presentations, has been fundamentally beneficial in improving the understanding of operating results of REITs among the investing public and making comparisons of REIT operating results more meaningful . Management generally considers FFO to be a useful measure for reviewing our comparative operating and financial performance because, by excluding gains and losses related to asset sales (land and property), impairment losses and real estate asset depreciation and amortization (which can vary among owners of identical assets in similar condition based on historical cost accounting and useful life estimates), FFO can help one compare the operating performance of a company’s real estate between periods or as compared to different companies . Our computation of FFO may not be comparable to FFO reported by other REITs or real estate companies that do not define the term in accordance with the current NAREIT definition or that interpret the current NAREIT definition differently . FFO should not be considered as an alternative to net income attributable to stockholders (determined in accordance with GAAP) as an indication of our performance . FFO does not represent cash generated from operating activities determined in accordance with GAAP, and is not a measure of liquidity or an indicator of our ability to make cash distributions . We believe that to further understand our performance, FFO should be compared with our reported net income attributable to stockholders and considered in addition to cash flows determined in accordance with GAAP, as presented in our consolidated financial statements . Adjusted funds from operations (AFFO) AFFO ; a non - GAAP financial measure ; is core FFO excluding certain income or expense items that we consider more reflective of investing activities, other non - cash income and expense items and the income and expense effects of other activities that are not a fundamental attribute of our business plan . These items include unrealized gains and losses, which may not ultimately be realized, such as gains or losses on derivative instruments, gains or losses on contingent valuation rights, gains and losses on investments and early extinguishment of debt . In addition, by excluding non - cash income and expense items such as amortization of above and below market leases, amortization of deferred financing costs, straight - line rent and non - cash equity compensation from AFFO we believe we provide useful information regarding income and expense items which have no cash impact and do not provide liquidity to the company or require capital resources of the company . We exclude distributions related to Class B units and certain interest expenses related to securities that are convertible to common stock as the shares are assumed to have converted to common stock in our calculation of weighted average common shares - fully diluted . Furthermore we include certain cash inflow and outflows that are reflective of operating activities including preferred returns on joint ventures, second generation tenant improvement and leasing commissions (included in the period in which the lease commences) and recurring capital expenditures . Although our AFFO may not be comparable to that of other REITs and real estate companies, we believe it provides a meaningful indicator of our ability to fund cash needs and to make cash distributions to stockholders . In addition, we believe that to further understand our liquidity, AFFO should be compared with our cash flows determined in accordance with GAAP, as presented in our consolidated financial statements . AFFO does not represent cash generated from operating activities determined in accordance with GAAP, and AFFO should not be considered as an alternative to net income (determined in accordance with GAAP) as an indication of our performance, as an alternative to net cash flows from operating activities (determined in accordance with GAAP), or as a measure of our liquidity . Core funds from operations (Core FFO) Core funds from operations (Core FFO), is FFO excluding acquisition and transaction related costs, non - cash equity compensation, other costs that are considered to be non - recurring, such as charges relating to the Listing Note, non - recurring revenue, such as lease termination or modification fees, and other non - recurring expenses . The purchase of properties, and the corresponding expenses associated with that process, is a key operational feature of our business plan to generate operational income and cash flows in order to make dividend payments to investors . In evaluating investments in real estate, we differentiate the costs to acquire the investment from the operations derived from the investment . By excluding expensed acquisition and transaction related costs as well as non - recurring revenues and expenses, we believe Core FFO provides useful supplemental information that is comparable for each type of real estate investment and is consistent with management's analysis of the investing and operating performance of our properties . Net operating income (NOI) Net operating income (NOI) is a non - GAAP financial measure equal to net income attributable to stockholders, the most directly c omparable GAAP financial measure, less discontinued operations, plus corporate general and administrative expense, acquisitio n a nd transaction costs, depreciation and amortization and interest expense, income from unconsolidated joint ventures, interest and other income and gains from investments in securiti es. NOI is adjusted to include our pro - rata share of NOI from unconsolidated joint ventures. We use NOI internally as a performanc e measure and believe NOI provides useful information to investors regarding our financial condition and results of operations because it reflects only those income and expense items th at are incurred at the property level. Therefore, we believe NOI is a useful measure for evaluating the operating performance of our real estate assets and to make decisions about resource allocations. Further, we believe NOI is useful to investors as a performance measure because, when compared across periods, N OI reflects the impact on operations from trends in occupancy rates, rental rates, operating costs acquisition activity on an un lev eraged basis, providing perspective not immediately apparent from net income. NOI excludes certain components from net income in order to provide results that are more closely r ela ted to a property's results of operations. For example, interest expense is not necessarily linked to the operating performan ce of a real estate asset and is often incurred at the corporate level as opposed to the property level. In addition, depreciation and amortization, because of historical cost accounting and us eful life estimates, may distort operating performance at the property level. NOI presented by us may not be comparable to NO I r eported by other REITs that define NOI differently. We believe that in order to facilitate a clear understanding of our operating results, NOI should be examined in conjunction wit h n et income as presented in our consolidated financial statements. NOI should not be considered as an alternative to net income as an indication of our performance or to cash flows as a measure of our liquidity or ability to make distributions. Cash net operating income (Cash NOI) NOI, presented on a cash basis, which is equal to NOI after eliminating the effects of straight - lining of rent and fair value le ase revenue. Incremental cash net operating income (Incremental Cash NOI) Incremental NOI, presented on a cash basis, which is attributed to certain specific future anticipated events; incremental Ca sh NOI can include but is not limited to NOI generated from future vacant lease up, future building reconfiguration, and future mar k to market of expiring leases. Annualized Adjusted Cash NOI NOI, presented on a cash basis, which is equal to NOI after eliminating the effects of straight - line rent and fair value lease r evenue, plus contractual free rent. The quarterly number is multiplied by 4 to arrive at an annualized figure. 11