Attached files
| file | filename |
|---|---|
| 8-K - FORM 8-K - MITEL NETWORKS CORP | d46707d8k.htm |
Exhibit 99.1
|
|

Mitel Q3 2015 Earnings Call Presentation
November 5, 2015
Exhibit 99.1
|
|
Safe Harbor Statement
Forward Looking Statements
This presentation contains projections and other forward-looking statements regarding future events or the future performance of Mitel, including future operating and financial results. These projections and statements are only predictions. Actual events or results may differ materially from those provided in the projections or other forward-looking statements. Please see Mitel’s annual and quarterly reports filed with the SEC and the Canadian securities regulator, including its most recent Form 10-K filed on February 26, 2015 and Form 10-Q filed on November 5, 2015, for a discussion of important risk factors that could cause actual events or results to differ materially from those in the projections or other forward-looking statements.
Non-GAAP Financial Measurements
In an effort to provide additional and useful information regarding the company’s financial results and other financial information as determined by generally accepted accounting principles (GAAP), the company also discusses, in its earnings press release and earnings presentation materials, certain non-GAAP information. Mitel provides a reconciliation between GAAP and non-GAAP financial information in our quarterly results announcements and in the supplemental slides used in conjunction with the company’s quarterly call. This information is available on our website at www.mitel.com under the ‘Investor Relations’ section http://investor.mitel.com/events.cfm.
Non-GAAP measures for future periods would not include, when applicable, share-based compensation expense, amortization of acquisition-related intangible assets, impact to revenue and cost of sales from purchase accounting adjustments, acquisition-related/divestiture costs, significant asset impairments and restructurings, significant litigation settlements, the income tax effects of the foregoing, significant tax matters, and other items that Mitel may exclude from time to time in the future, such as significant gains or losses from contingencies.
2 | ©2015 Mitel. Proprietary and Confidential.
|
|
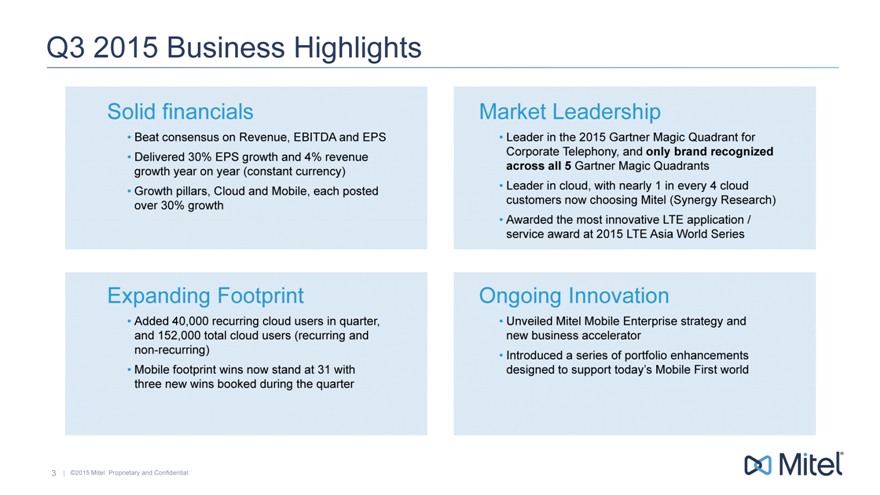
Q3 2015 Business Highlights
Solid financials Market Leadership
Beat consensus on Revenue, EBITDA and EPS Leader in the 2015 Gartner Magic Quadrant for
Delivered 30% EPS growth and 4% revenue Corporate Telephony, and only brand recognized
growth year on year (constant currency) across all 5 Gartner Magic Quadrants
Growth pillars, Cloud and Mobile, each posted Leader in cloud, with nearly 1 in every 4 cloud
over 30% growth customers now choosing Mitel (Synergy Research)
Awarded the most innovative LTE application /
service award at 2015 LTE Asia World Series
Expanding Footprint Ongoing Innovation
Added 40,000 recurring cloud users in quarter, Unveiled Mitel Mobile Enterprise strategy and
and 152,000 total cloud users (recurring and new business accelerator
non-recurring) Introduced a series of portfolio enhancements
Mobile footprint wins now stand at 31 with designed to support today’s Mobile First world
three new wins booked during the quarter
3 | ©2015 Mitel. Proprietary and Confidential.
|
|
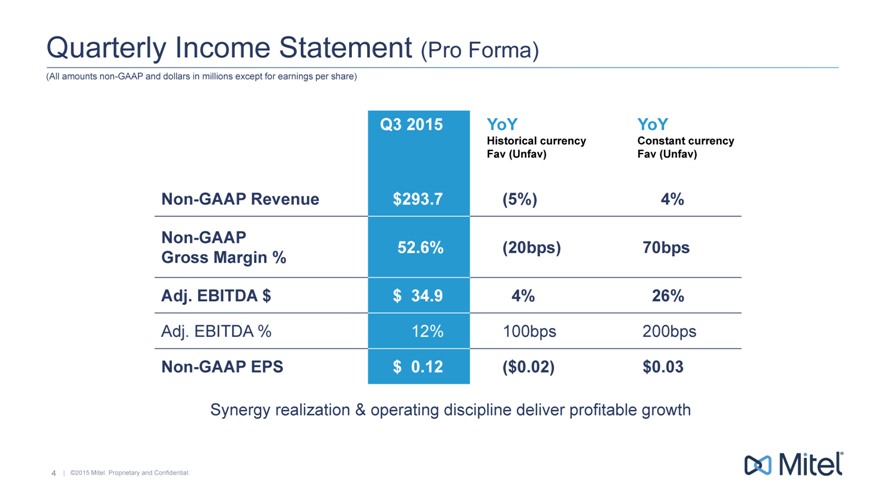
Quarterly Income Statement (Pro Forma)
(All amounts non-GAAP and dollars in millions except for earnings per share)
Q3 2015 YoY YoY
Historical currency Constant currency
Fav (Unfav) Fav (Unfav)
Non-GAAP Revenue $293.7(5%) 4%
Non-GAAP 52.6%(20bps) 70bps
Gross Margin %
Adj. EBITDA $ $ 34.9 4% 26%
Adj. EBITDA % 12% 100bps 200bps
Non-GAAP EPS $ 0.12($0.02) $0.03
Synergy realization & operating discipline deliver profitable growth
4 | ©2015 Mitel. Proprietary and Confidential.
|
|
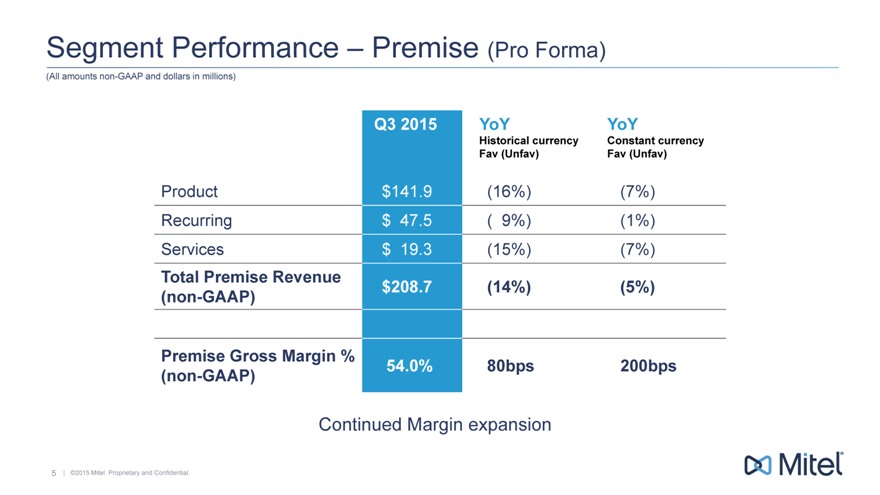
Segment Performance—Premise(Pro Forma)
(All amounts non-GAAP and dollars in millions)
Q3 2015 YoY YoY
Historical currency Constant currency
Fav (Unfav) Fav (Unfav)
Product $ 141.9(16%)(7%)
Recurring $ 47.5( 9%)(1%)
Services $ 19.3(15%)(7%)
Total Premise Revenue $ 208.7(14%)(5%)
(non-GAAP)
Premise Gross Margin % 54.0% 80bps 200bps
(non-GAAP)
Continued Margin expansion
5 | ©2015 Mitel. Proprietary and Confidential.
|
|
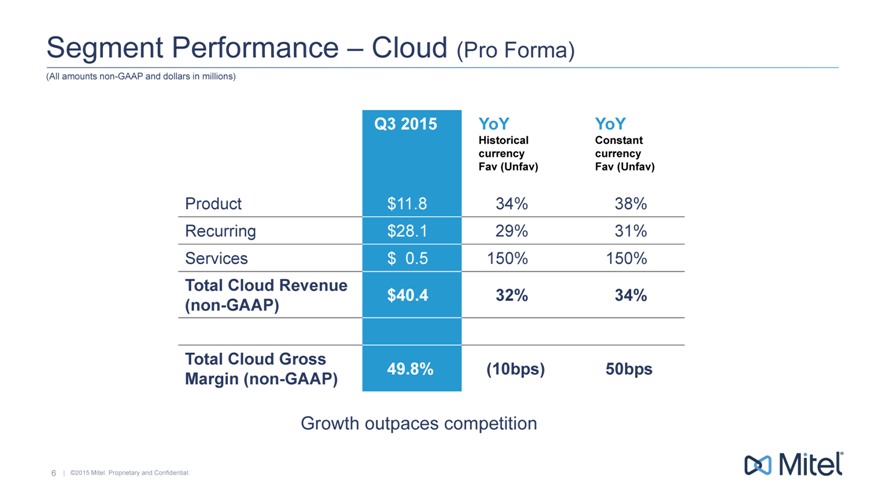
Segment Performance—Cloud(Pro Forma)
(All amounts non-GAAP and dollars in millions)
Q3 2015 YoY YoY
Historical Constant
currency currency
Fav (Unfav) Fav (Unfav)
Product $ 11.8 34% 38%
Recurring $ 28.1 29% 31%
Services $ 0.5 150% 150%
Total Cloud Revenue
(non-GAAP) $ 40.4 32% 34%
Total Cloud Gross 49.8%(10bps) 50bps
Margin (non-GAAP)
Growth outpaces competition
6 | ©2015 Mitel. Proprietary and Confidential.
|
|
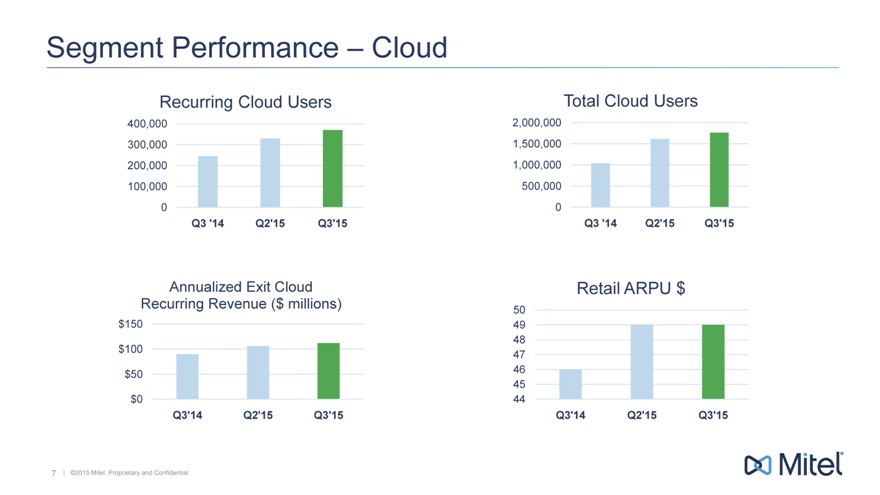
Segment Performance—Cloud
Recurring Cloud Users Total Cloud Users
400,000 2,000,000
300,000 1,500,000
200,000 1,000,000
100,000 500,000
0 0
Q3 ‘14 Q2’15 Q3’15 Q3 ‘14 Q2’15 Q3’15
Annualized Exit Cloud Retail ARPU $
Recurring Revenue ($ millions) 50
$150 49
48
$100 47
$50 46
45
$0 44
Q3’14 Q2’15 Q3’15 Q3’14 Q2’15 Q3’15
7 | ©2015 Mitel. Proprietary and Confidential.
|
|
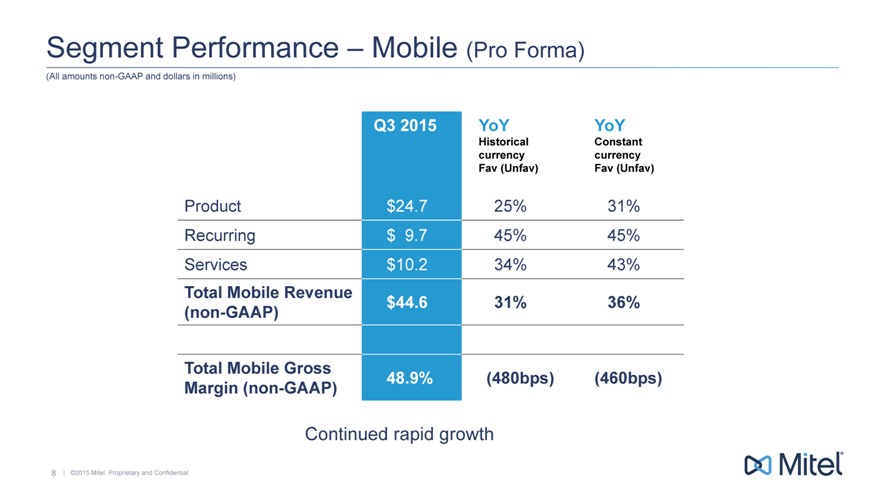
Segment Performance—Mobile(Pro Forma)
(All amounts non-GAAP and dollars in millions)
Q3 2015 YoY YoY
Historical Constant
currency currency
Fav (Unfav) Fav (Unfav)
Product $ 24.7 25% 31%
Recurring $ 9.7 45% 45%
Services $ 10.2 34% 43%
Total Mobile Revenue $ 44.6 31% 36%
(non-GAAP)
Total Mobile Gross 48.9%(480bps)(460bps)
Margin (non-GAAP)
Continued rapid growth
8 | ©2015 Mitel. Proprietary and Confidential.
|
|
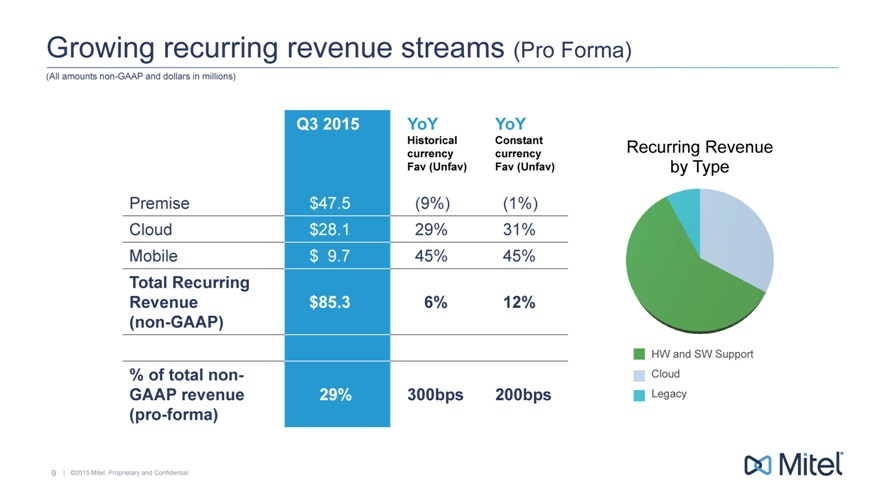
Growing recurring revenue streams (Pro Forma)
(All amounts non-GAAP and dollars in millions)
Q3 2015 YoY YoY
Historical Constant Recurring Revenue
currency currency
Fav (Unfav) Fav (Unfav) by Type
Premise $ 47.5(9%)(1%)
Cloud $ 28.1 29% 31%
Mobile $ 9.7 45% 45%
Total Recurring
Revenue $ 85.3 6% 12%
(non-GAAP)
HW and SW Support
% of total non- Cloud
GAAP revenue 29% 300bps 200bps Legacy
(pro-forma)
9 | ©2015 Mitel. Proprietary and Confidential.
|
|
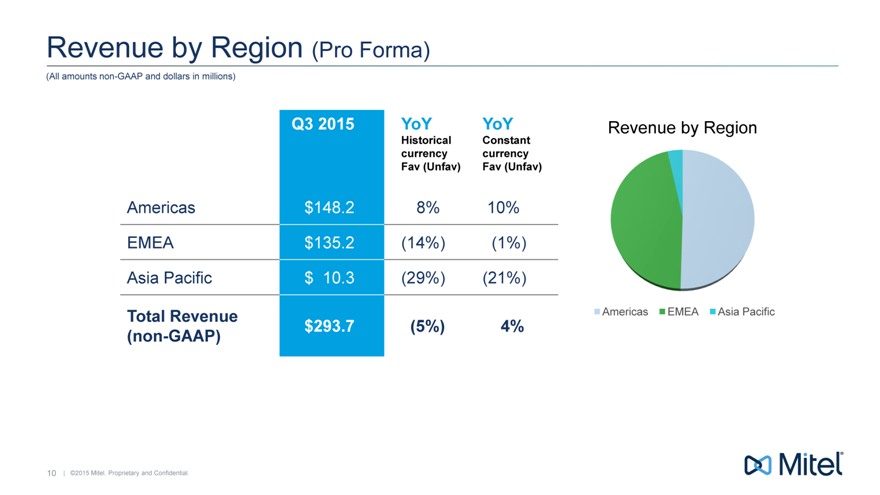
Revenue by Region(Pro Forma)
(All amounts non-GAAP and dollars in millions)
Q3 2015 YoY YoY Revenue by Region
Historical Constant
currency currency
Fav (Unfav) Fav (Unf
Americas $ 148.2 8% 10%
EMEA $ 135.2(14%) (1%)
Asia Pacific $ 10.3(29%) (21%)
Total Revenue Americas EMEA Asia Pacific
(non-GAAP) $ 293.7(5%) 4%
10 | ©2015 Mitel. Proprietary and Confidential.
|
|
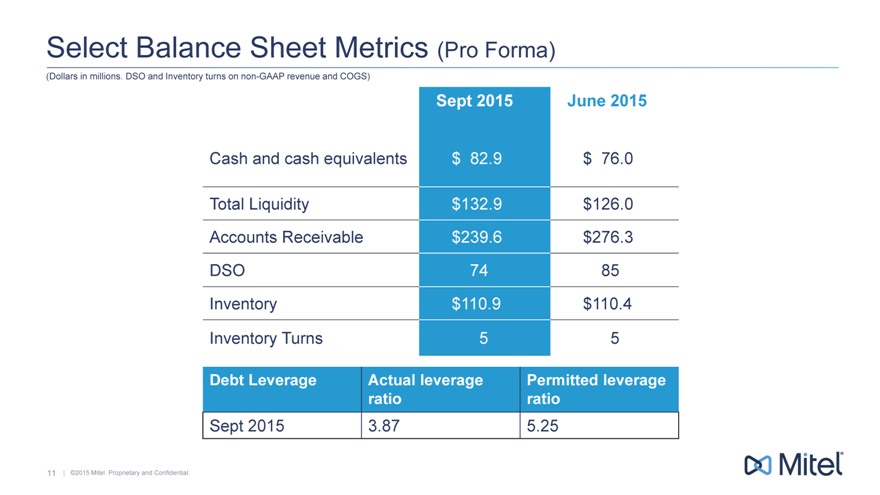
Select Balance Sheet Metrics(Pro Forma)
(Dollars in millions. DSO and Inventory turns on non-GAAP revenue and COGS)
Sept 2015 June 2015
Cash and cash equivalents $ 82.9 $ 76.0
Total Liquidity $ 132.9 $ 126.0
Accounts Receivable $ 239.6 $ 276.3
DSO 74 85
Inventory $ 110.9 $ 110.4
Inventory Turns 5 5
Debt Leverage Actual leverage Permitted leverage
ratio ratio
Sept 2015 3.87 5.25
11 | ©2015 Mitel. Proprietary and Confidential.
|
|
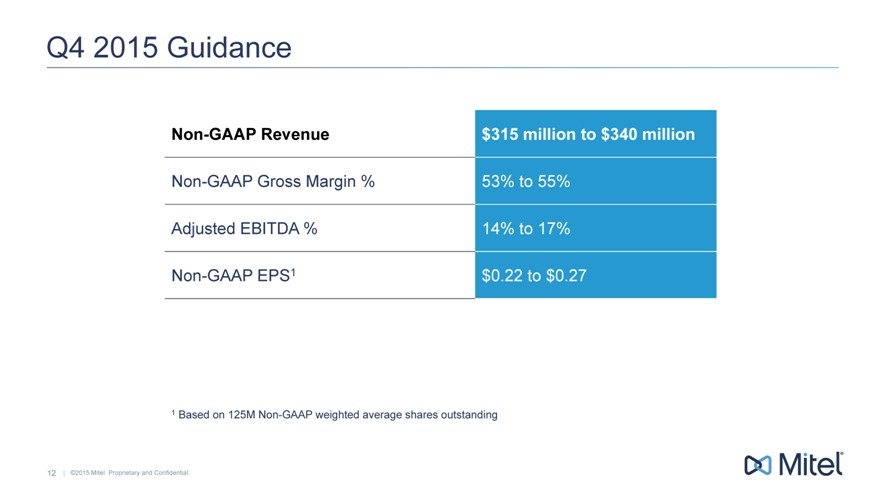
Q4 2015 Guidance
Non-GAAP Revenue $315 million to $340 million
Non-GAAP Gross Margin % 53% to 55%
Adjusted EBITDA % 14% to 17%
Non-GAAP EPS1 $0.22 to $0.27
1 Based on 125M Non-GAAP weighted average shares outstanding
12 | ©2015 Mitel. Proprietary and Confidential.
|
|

Appendix
13 | ©2015 Mitel. Proprietary and Confidential.
|
|
Non-GAAP Financial Measurements
In an effort to provide investors with additional information regarding the company’s results as determined by generally accepted accounting principles (GAAP), the company also discusses, in its earnings press release and earnings presentation materials, the following Non-GAAP information which management believes provides useful information to investors. Mitel provides a reconciliation between GAAP and non-GAAP financial information in our quarterly results announcements and in the supplemental slides used in conjunction with the company’s quarterly call. This information is available on our website at www.mitel.com under the ‘Investor Relations’ section http://investor.mitel.com/events.cfm.
Non-GAAP Financial Measures
This presentation includes references to non-GAAP financial measures including Adjusted EBITDA, non-GAAP net income, Non-GAAP revenues, Non-GAAP gross margin and non-GAAP operating expenses,. Non-GAAP financial measures do not have any standardized meaning and are therefore unlikely to be comparable to similar measures presented by other companies. We use these non-GAAP financial measures to assist management and investors in understanding our past financial performance and prospects for the future, including changes in our operating results, trends and marketplace performance, exclusive of unusual events or factors which do not directly affect what we consider to be our core operating performance. Non-GAAP measures are among the primary indicators management uses as a basis for our planning and forecasting of future periods. Investors are cautioned that non-GAAP financial measures should not be relied upon as a substitute for financial measures prepared in accordance with generally accepted accounting principles. Please see the reconciliation of non-GAAP financial measures to the most directly comparable U.S. GAAP measure attached to our quarterly results announcement.
Mitel completed the acquisition of Mavenir Systems on April 29, 2015. ‘As reported’ results in this release and the attached tables refer to the U.S. GAAP results of Mitel, which include the results of Mavenir from the date of acquisition, April 29, 2015. Pro-forma results reflect the results of the company as if it had been fully combined with Mavenir Systems for the full presented period. For a reconciliation of Mitel’s as-reported results to the pro-forma results and non-GAAP results, please see the tables attached to our quarterly results announcement as well as the Form 8-K presenting combined historical results of Mitel and Mavenir filed with the SEC on August 6, 2015.
Constant Currency
Management refers to growth rates at constant currency or adjusting for currency so that certain financial results can be viewed without the impact of fluctuations in foreign currency exchange rates, thereby facilitating period-to-period comparisons of the company’s business performance. Financial results adjusted for currency are calculated by translating prior period activity in local currency using the current period currency conversion rate. This approach is used for countries where the functional currency is the local currency. Generally, when the US dollar either strengthens or weakens against other currencies, the growth at constant currency rates or adjusting for currency will be higher or lower than growth reported at actual exchange rates.
Annualized Exit Monthly Cloud Recurring Revenue
Annualized Exit Monthly Cloud Recurring Revenue is a leading indicator of our anticipated cloud recurring revenues. We believe that trends in revenue are important to understanding the overall health of our cloud business. Our Annualized Exit Monthly Cloud Recurring Revenue equals our Monthly Cloud Recurring Revenue multiplied by 12. Our Monthly Cloud Recurring Revenue equals the monthly value of all customer subscriptions in effect at the end of a given month. For example, our Monthly Recurring Subscriptions at September 30, 2015 were $9.3 million. As such, our Annualized Exit Monthly Cloud Recurring Revenue at September 30, 2015 were $111.6 million.
14 | ©2015 Mitel. Proprietary and Confidential.
|
|
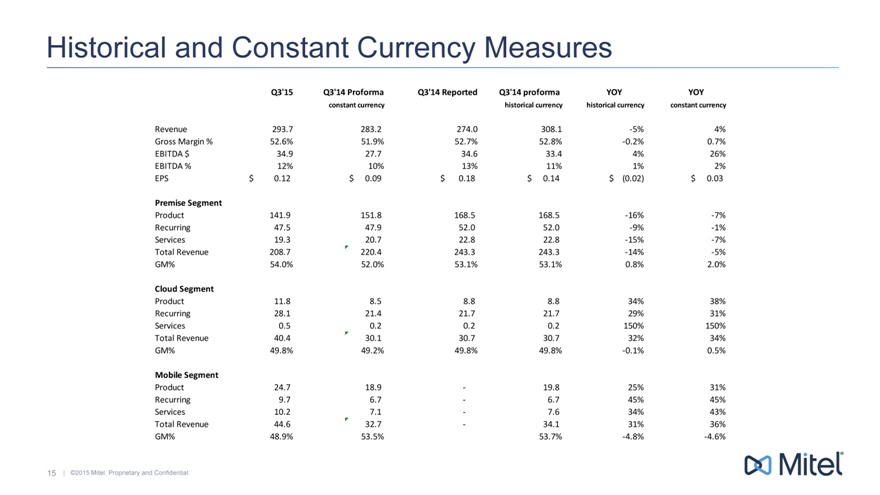
Historical and Constant Currency Measures
Q3’15 Q3’14 Proforma Q3’14 Reported Q3’14 proforma YOY YOY
constant currency historical currency historical currency constant currency
Revenue 293.7 283.2 274.0 308.1 -5% 4%
Gross Margin % 52.6% 51.9% 52.7% 52.8% -0.2% 0.7%
EBITDA $ 34.9 27.7 34.6 33.4 4% 26%
EBITDA % 12% 10% 13% 11% 1% 2%
EPS $ 0.12 $ 0.09 $ 0.18 $ 0.14 $ (0.02) $ 0.03
Premise Segment
Product 141.9 151.8 168.5 168.5 -16% -7%
Recurring 47.5 47.9 52.0 52.0 -9% -1%
Services 19.3 20.7 22.8 22.8 -15% -7%
Total Revenue 208.7 220.4 243.3 243.3 -14% -5%
GM% 54.0% 52.0% 53.1% 53.1% 0.8% 2.0%
Cloud Segment
Product 11.8 8.5 8.8 8.8 34% 38%
Recurring 28.1 21.4 21.7 21.7 29% 31%
Services 0.5 0.2 0.2 0.2 150% 150%
Total Revenue 40.4 30.1 30.7 30.7 32% 34%
GM% 49.8% 49.2% 49.8% 49.8% -0.1% 0.5%
Mobile Segment
Product 24.7 18.9—19.8 25% 31%
Recurring 9.7 6.7—6.7 45% 45%
Services 10.2 7.1—7.6 34% 43%
Total Revenue 44.6 32.7—34.1 31% 36%
GM% 48.9% 53.5% 53.7% -4.8% -4.6%
15 | ©2015 Mitel. Proprietary and Confidential.
|
|

#Mitel