Attached files
| file | filename |
|---|---|
| 8-K - 8-K - MAGNUM HUNTER RESOURCES CORP | a15-22292_18k.htm |
| EX-99.3 - EX-99.3 - MAGNUM HUNTER RESOURCES CORP | a15-22292_1ex99d3.htm |
| EX-10.3 - EX-10.3 - MAGNUM HUNTER RESOURCES CORP | a15-22292_1ex10d3.htm |
| EX-10.2 - EX-10.2 - MAGNUM HUNTER RESOURCES CORP | a15-22292_1ex10d2.htm |
| EX-99.1 - EX-99.1 - MAGNUM HUNTER RESOURCES CORP | a15-22292_1ex99d1.htm |
| EX-10.1 - EX-10.1 - MAGNUM HUNTER RESOURCES CORP | a15-22292_1ex10d1.htm |
Exhibit 99.2
Investor Presentation October 2015 Confidential Subject to Non-Disclosure Agreement Subject to FRE 408

Confidential Subject to Non-Disclosure Agreement Subject to FRE 408 Forward-Looking Statements The statements and information contained in this presentation that are not statements of historical fact, including any estimates and assumptions contained herein, are "forward looking statements" as defined in Section 27A of the Securities Act of 1933, as amended, referred to as the Securities Act, and Section 21E of the Securities Exchange Act of 1934, as amended, referred to as the Exchange Act. These forward-looking statements include, among others, statements, estimates and assumptions relating to our business and growth strategies, our oil and gas reserve estimates, estimates of oil and natural gas resource potential, our ability to successfully and economically explore for and develop oil and gas resources, our exploration and development prospects, future inventories, projects and programs, expectations relating to availability and costs of drilling rigs and field services, anticipated trends in our business or industry, our future results of operations, our liquidity and ability to finance our exploration and development activities and our midstream activities, market conditions in the oil and gas industry and the impact of environmental and other governmental regulation. In addition, with respect to any pending transactions described herein, forward-looking statements include, but are not limited to, statements regarding the expected timing of the completion of proposed transactions; the ability to complete proposed transactions considering various closing conditions; the benefits of any such transactions and their impact on the Company's business; and any statements of assumptions underlying any of the foregoing. In addition, if and when any proposed transaction is consummated, there will be risks and uncertainties related to the Company's ability to successfully integrate the operations and employees of the Company and the acquired business. Forward-looking statements generally can be identified by the use of forward-looking terminology such as "may," "will," "could," "should," "expect," "intend," "estimate," "anticipate," "believe," "project," "pursue," "plan" or "continue" or the negative thereof or variations thereon or similar terminology. These forward-looking statements are subject to numerous assumptions, risks, and uncertainties. Factors that may cause our actual results, performance, or achievements to be materially different from those anticipated in forward-looking statements include, among others, the following: adverse economic conditions in the United States and globally; difficult and adverse conditions in the domestic and global capital and credit markets; changes in domestic and global demand for oil and natural gas; volatility in the prices we receive for our oil, natural gas and natural gas liquids; the effects of government regulation, permitting and other legal requirements; future developments with respect to the quality of our properties, including, among other things, the existence of reserves in economic quantities; uncertainties about the estimates of our oil and natural gas reserves; our ability to increase our production and therefore our oil and natural gas income through exploration and development; our ability to successfully apply horizontal drilling techniques; the effects of increased federal and state regulation, including regulation of the environmental aspects, of hydraulic fracturing; the number of well locations to be drilled, the cost to drill and the time frame within which they will be drilled; drilling and operating risks; the availability of equipment, such as drilling rigs and transportation pipelines; changes in our drilling plans and related budgets; regulatory, environmental and land management issues, and demand for gas gathering services, relating to our midstream investment; and the adequacy of our capital resources and liquidity including, but not limited to, access to additional borrowing capacity. These factors are in addition to the risks described in the "Risk Factors" and "Management's Discussion and Analysis of Financial Condition and Results of Operations" sections of the Company's 2014 annual report on Form 10-K, as amended, filed with the Securities and Exchange Commission, which we refer to as the SEC, and subsequently filed quarterly reports on Form 10-Q. Most of these factors are difficult to anticipate and beyond our control. Because forward-looking statements are subject to risks and uncertainties, actual results may differ materially from those expressed or implied by such statements. You are cautioned not to place undue reliance on forward-looking statements contained herein, which speak only as of the date of this document. Other unknown or unpredictable factors may cause actual results to differ materially from those projected by the forward-looking statements. Unless otherwise required by law, we undertake no obligation to publicly update or revise any forward-looking statements, whether as a result of new information, future events or otherwise. We urge readers to review and consider disclosures we make in our reports that discuss factors germane to our business. See in particular our reports on Forms 10-K, 10-Q and 8-K subsequently filed from time to time with the SEC. All forward-looking statements attributable to us are expressly qualified in their entirety by these cautionary statements. The SEC requires oil and natural gas companies, in filings made with the SEC, to disclose proved reserves, which are those quantities of oil and natural gas that by analysis of geoscience and engineering data can be estimated with reasonable certainty to be economically producible from a given date forward, from known reservoirs, and under existing economic conditions, operating methods, and government regulations. Probable reserves are those additional reserves that are less certain to be recovered than proved reserves but which, together with proved reserves, are as likely as not to be recovered. When deterministic methods are used, it is as likely as not that actual remaining quantities recovered will exceed the sum of estimated proved plus probable reserves. When probabilistic methods are used, there should be at least a 50% probability that the actual quantities recovered will equal or exceed the proved plus probable reserves estimates. Probable reserves may be assigned to areas of a reservoir adjacent to proved reserves where data control or interpretations of available data are less certain, even if the interpreted reservoir continuity of structure or productivity does not meet the reasonable certainty criterion. Probable reserves may be assigned to areas that are structurally higher than the proved area if these areas are in communication with the proved reservoir. Probable reserves estimates also include potential incremental quantities associated with a greater percentage recovery of the hydrocarbons in place than assumed for proved reserves. Possible reserves are those additional reserves that are less certain to be recovered than probable reserves. When deterministic methods are used, the total quantities ultimately recovered from a project have a low probability of exceeding proved plus probable plus possible reserves. When probabilistic methods are used, there should be at least a 10% probability that the total quantities ultimately recovered will equal or exceed the proved plus probable plus possible reserves estimates. Possible reserves may be assigned to areas of a reservoir adjacent to probable reserves where data control and interpretations of available data are progressively less certain. Frequently, this will be in areas where geoscience and engineering data are unable to define clearly the area and vertical limits of commercial production from the reservoir by a defined project. Possible reserves also include incremental quantities associated with a greater percentage recovery of the hydrocarbons in place than the recovery quantities assumed for probable reserves. Possible reserves may be assigned where geoscience and engineering data identify directly adjacent portions of a reservoir within the same accumulation that may be separated from proved areas by faults with displacement less than formation thickness or other geological discontinuities and that have not been penetrated by a wellbore, and the Company believes that such adjacent portions are in communication with the known (proved) reservoir. Possible reserves may be assigned to areas that are structurally higher or lower than the proved area if these areas are in communication with the proved reservoir. Where direct observation has defined a highest known oil (“HKO”) elevation and the potential exists for an associated gas cap, proved oil reserves should be assigned in the structurally higher portions of the reservoir above the HKO only if the higher contact can be established with reasonable certainty through reliable technology. Portions of the reservoir that do not meet this reasonable certainty criterion may be assigned as probable and possible oil or gas based on reservoir fluid properties and pressure gradient interpretations. The term “contingent resources” is a broader description of potentially recoverable volumes than probable and possible reserves, as defined by SEC regulations. In this presentation disclosure of “contingent resources” represents a high estimate scenario, rather than a middle or low estimate scenario. Estimates of contingent resources are by their nature more speculative than estimates of proved, probable, or possible reserves and accordingly are subject to substantially greater risk of actually being realized by the Company. We believe our estimates of contingent resources and future drill sites are reasonable, but such estimates have not been reviewed by independent engineers. Estimates of contingent resources may change significantly as development provides additional data, and actual quantities that are ultimately recovered may differ substantially from prior estimates. Note Regarding Non-GAAP Measures This presentation includes certain non-GAAP measures, including Adjusted EBITDAX and PV-10, which are described in greater detail in this presentation. Management believes that these non-GAAP measures, which may be defined differently by other companies, better explain the Company's results of operations in a manner that allows for a more complete understanding of the underlying trends in the Company's business, and are also measures that are important to the Company’s lenders. However, these measures should not be viewed as a substitute for those determined in accordance with GAAP. 1
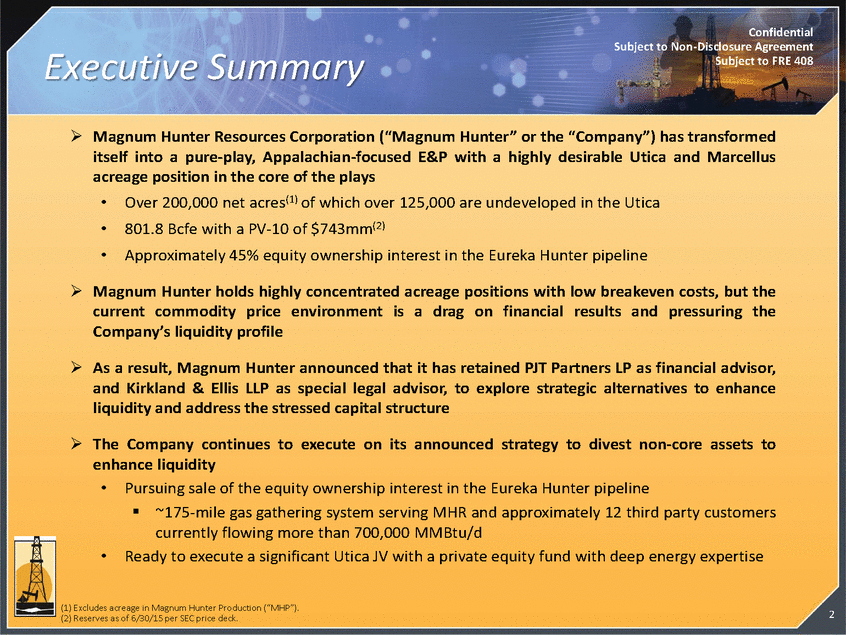
Confidential Subject to Non-Disclosure Agreement Subject to FRE 408 Executive Summary Magnum Hunter Resources Corporation (“Magnum Hunter” or the “Company”) has transformed itself into a pure-play, Appalachian-focused E&P with a highly desirable Utica and Marcellus acreage position in the core of the plays • • • Over 200,000 net acres(1) of which over 125,000 are undeveloped in the Utica 801.8 Bcfe with a PV-10 of $743mm(2) Approximately 45% equity ownership interest in the Eureka Hunter pipeline Magnum Hunter holds highly concentrated acreage positions with low breakeven costs, but the current commodity price environment is a drag on financial results and pressuring the Company’s liquidity profile As a result, Magnum Hunter announced that it has retained PJT Partners LP as financial advisor, and Kirkland & Ellis LLP as special legal advisor, to explore strategic alternatives to enhance liquidity and address the stressed capital structure The Company continues to execute on its announced strategy to divest non-core assets to enhance liquidity • Pursuing sale of the equity ownership interest in the Eureka Hunter pipeline ~175-mile gas gathering system serving MHR and approximately 12 third party customers currently flowing more than 700,000 MMBtu/d • Ready to execute a significant Utica JV with a private equity fund with deep energy expertise (1) Excludes acreage in Magnum Hunter Production (“MHP”). (2) Reserves as of 6/30/15 per SEC price deck. 2
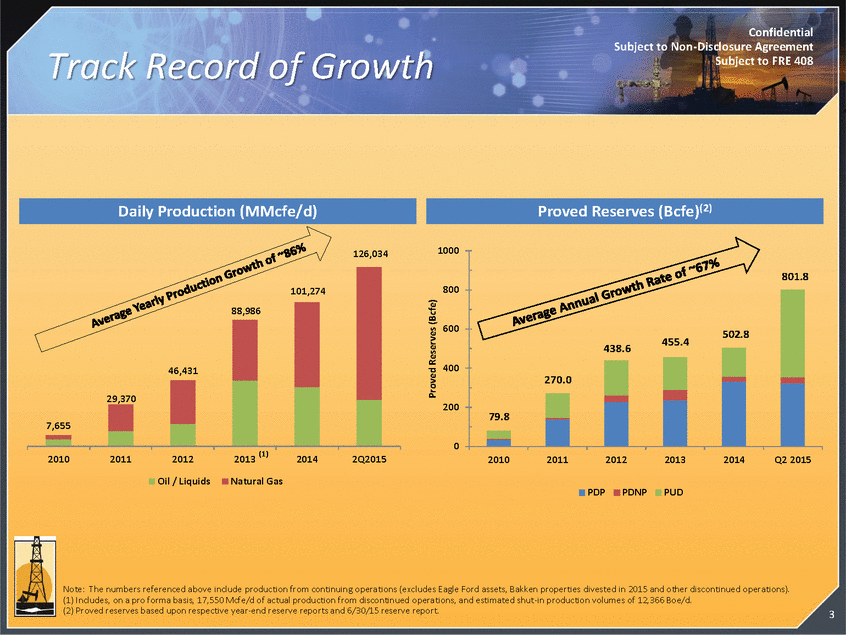
Confidential Subject to Non-Disclosure Agreement Subject to FRE 408 Track Record of Growth 1000 126,034 800 600 455.4 438.6 400 200 0 2013 (1) Natural Gas 2010 2011 2012 2014 2Q2015 2010 2011 2012 2013 2014 Q2 2015 Oil / Liquids PDP PDNP PUD Note: The numbers referenced above include production from continuing operations (excludes Eagle Ford assets, Bakken properties divested in 2015 and other discontinued operations). (1) Includes, on a pro forma basis, 17,550 Mcfe/d of actual production from discontinued operations, and estimated shut-in production volumes of 12,366 Boe/d. (2) Proved reserves based upon respective year-end reserve reports and 6/30/15 reserve report. 3 Proved Reserves (Bcfe) 101,274 88,986 46,431 29,370 7,655 801.8 502.8 270.0 79.8 Daily Production (MMcfe/d) Proved Reserves (Bcfe)(2)
Confidential Subject to Non-Disclosure Agreement Subject to FRE 408 Valuable Asset Base Mid-year estimate reserves of 801.8 Bcfe Proved PV-10 of reserves at June 30, 2015 of $743mm Positioned to substantially grow reserves from a combination of joint venture and offsetting undeveloped drilling activity Strong Reserve Position Dry Utica continues to provide highly economic returns at current commodity prices, with an estimated IRR of above 40% for new wells(1) Wet Marcellus acreage positioned to benefit from improving takeaway capacity in the basin and/or an eventual recovery in NGL pricing Highly Economic Returns at Current Prices Utica and Marcellus expected to serve as the primary source for U.S. natural gas for decades to come Extensive dry Utica position comprised of ~139,000 gross / ~125,000 net acres Differentials expected to improve from ongoing expansion of transportation pipeline capacity Substantial Leasehold in the Most Economic Gas Plays in the U.S. Fee-based midstream system continues to benefit from its strategic location in West Virginia, with access to growing Ohio Utica volumes Throughput volumes continue to grow and add value to MHR’s ownership interest Volumes anticipated to be approximately 1 Bcf/d at year-end 2015 Ten interconnects with other pipelines, with two more under construction and expected to be completed by year-end Growing Value in Eureka Hunter Ownership Interest 4 (1) Based on a well with 6000’ lateral length. IRR reflects single-well economics assuming strip pricing as of 9/4/15.
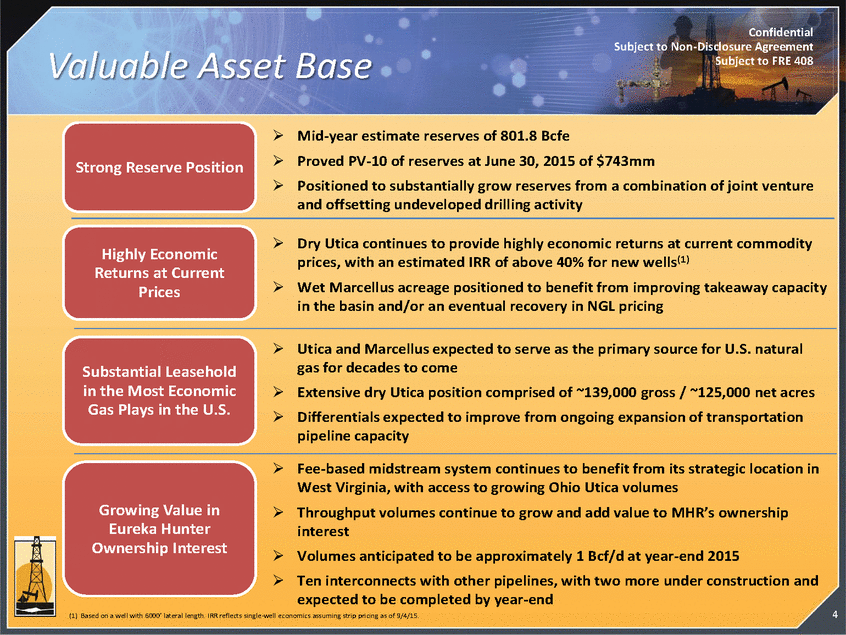
Confidential Subject to Non-Disclosure Agreement Subject to FRE 408 Total Reserves Summary Extensive drilling inventory in the Marcellus Shale and a proved reserve life (R/P ratio) of ~8.5 years based on current production Significant development potential in the wet/dry gas window of the Utica Shale in Ohio and West Virginia PDP PDNP PUD 16.2 0.6 16.0 226.2 26.4 351.7 323.6 30.3 447.9 40.4% 3.8% 55.9% $437 43 263 Probable / Possible 3.4 64.6 85.4 52 Contingent Resources 140.3 4,505.0 5,346.6 Appalachia 95.7% Gas 75.4% Oil / Liquids 24.6% Williston Basin 4.3% 5 Proved Reserves by Region Proved Reserves By Type Total Contingent Resources176.65,173.96,233.8 Total 3P Reserves36.3668.9887.2$795 Total Proved Reserves32.9604.3801.8$743 Category Net Reserves as of June 30, 2015 (SEC PRICING)June 30, 2015 Liquids GasTotal% PV-10 (MMBbls)(Bcf)(Bcfe)of Total Proved($MM) Reserves Summary
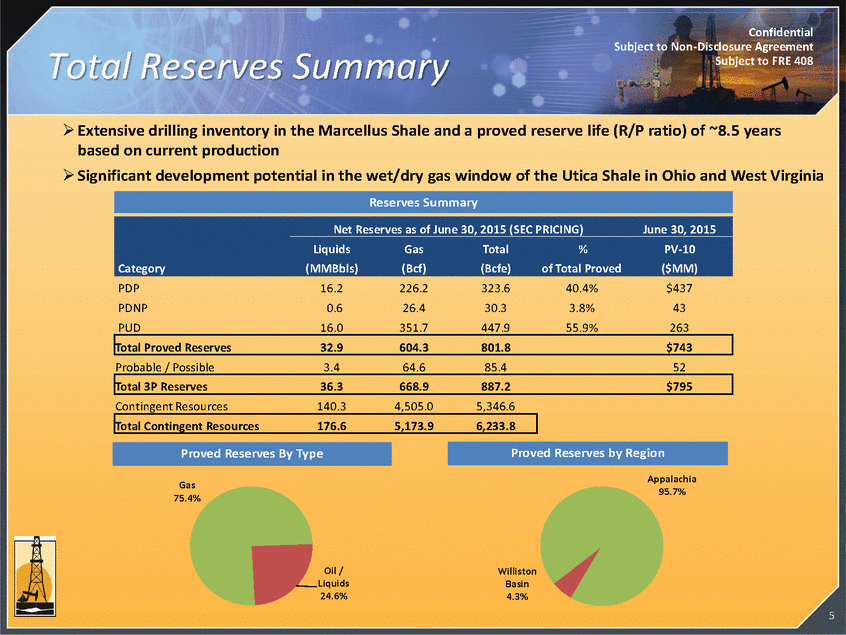
Confidential Subject to Non-Disclosure Agreement Subject to FRE 408 Utica Shale – Recent Well Results 1450 bbls/d + 1172 bbls NGL/d 30 Day Rate: 35 mmcf/d PLEASANTS Production Note: MHR currently owns approximately 125,000 net acres in the Utica Shale. 6 OHIO W.V. 1009 bbls NGL/d MARSHALL Antero – Miley #2H + 8.6 mmcf/d | (3740 boe/d) 3 Marcellus Wells 3 Utica Wells Drilling NOBLE MONROE Eclipse - Herrick Pad 3 Utica Dry Gas Wells WETZEL Utica Well Permitted TYLER WASHINGTON Magnum Hunter Acreage Area Of Dual Marcellus - Utica MHR – Stewart-Winland Pad Utica Dry Gas Test Peak Rate: 46.5 mmcf/d Antero - Pursley #2HD D u a l M a r c el l u s & U t i c a A r ea MHR – Price Pad Stone Energy Utica Well Permitted PDC – Garvin #1H Producing 1530 boe/d | Choke 20/64th 54% Liquids ( Assuming Full Ethane Recovery ) MHR – Farley #1035H 10 Stage Frac / 3.0 mmcfe/d MHR – Haynes Pad EdgeMarc – Merlin Pad MHR - Wood Chopper Pad Chesapeake - Messenger #3H Waiting On Completion MHR - Crooked Tree Pad MHR - Stalder #3UH 32.5 mmcf/d | 97% Methane Antero – Yontz #2H 52 bbls/d + 3177 bbls NGL/d + 38.9 mmcf/d | (8879 boe/d) MHR - Ormet #15 Pad Gastar - Simms U-5H 48 Hour IP: 29.4 mmcf/d MHR - Ormet #9 Pad Flowing to Sales Antero – Rubel #1H 214 bbls/d + 3391 bbls NGL/d + 31.1 mmcf/d | (7917 boe/d) Eclipse - Tippens #6H 23 mmcf/d | Dry Gas Chevron - Berger 3H & 7H Permitted Locations Gulfport – Stutzman #1-14H 4 Hour Rate: 945 bbls NGL/d + 21.0 mmcf/d | (4060 boe/d) Gulfport – Irons #1-4H 30.3 mmcf/d | 100% Gas Gulfport – McCort #2-28H + 10.0 mmcf/d Chevron - Connor 6H 24 Hour IP: 25 mmcf/d Antero – Wayne #4H 1922 bbls/d + 1907 bbls NGL/d + 14.2 mmcf/d | (5698 boe/d) Antero – Myron #3H Frac In Progress Waiting On Completion
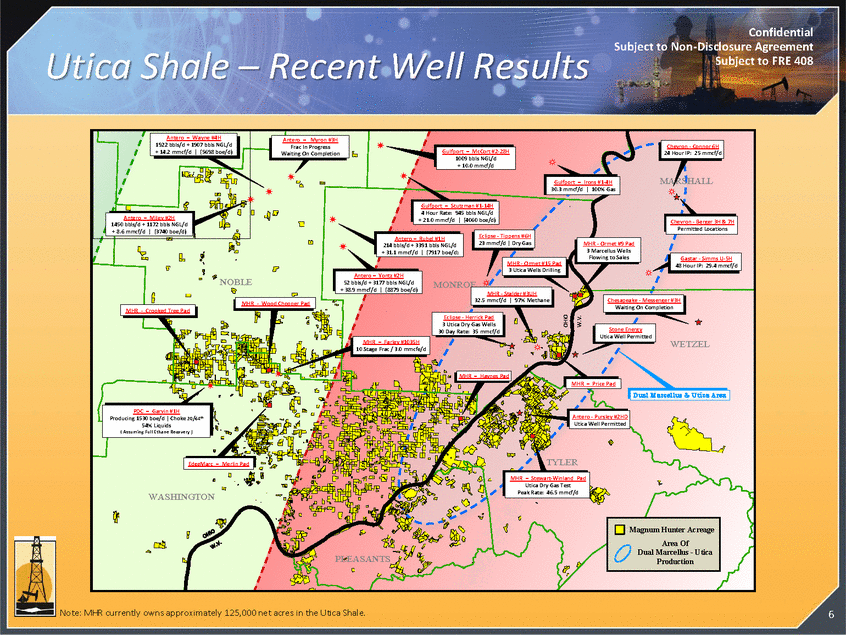
Confidential Subject to Non-Disclosure Agreement Subject to FRE 408 Highly Economic Returns from Drilling MHR's dry Utica acreage continues to offer highly economic returns from drilling activity Based on the Company's typical Utica type curve, we project that a new well with a 6000' lateral length should generate an IRR of greater than 40% at current strip prices(1) 1,000 $20,000 Gross Locations Net Acreage Est. Drilling Capital PV-10 to MHR(3) 100 $10,000 Proposed JV 41 9,500 $344.5 $138.9 10 $0 Identified Utica Locations 265 30,000 - 40,000 $2,261.7 $977.2 1 ($10,000) Total 306 39,500 - 49,500 $2,606.2 $1,116.1 0 2 4 6 8 10 12 14 16 18 20 22 # of Years Gross Gas (Mmcf) - Most Likely (LHS) Cumulative Cash Flows (RHS) Potential Add'l Inventory(4) 575 - 875 76,000 - 86,000 TBD TBD 20,000 70% 60% 50% 40% 30% 20% 10% 0% 15,000 10,000 5,000 0 $0 $0.25 $0.50 $0.75 $1.00 Price Increment from Strip PV-10 IRR (1) Based on strip natural gas prices on 9/4/15. (2) Reflects Most Likely case based on CWC +$8mm, 6000’ lateral, EUR 16.2 Bcf and 2.7 Bcf/1000’. Sensitivity analysis assumes $0.25 price increments to NYMEX strip as of 9/4/15. (3) Reflects Magnum Hunter Management estimates based on strip prices as of 9/4/15. (4) Management estimates. 7 IRR $ in thousands PV-10 ($ in thousands) Mmcf/Month Utica PV-10 and IRR Sensitivity to Gas Price(2) MHR Value Creation in the Utica ($ in millions) Gross Monthly Production and Cumulative Cash Flow(1)
Confidential Subject to Non-Disclosure Agreement Subject to FRE 408 Substantial Leasehold Inventory MHR holds a core position in the most economic gas play in the U.S. with over 200,000 net acres in the Utica and Marcellus, including 45,494 net overlapping acres for both reservoirs 66,000 net, centrally-located acres in the Bakken and Three Forks Shale plays remain for ultimate divestiture Developed Acreage (1) Undeveloped Acreage (2) As of June 30, 2015 Total Acreage Gross Net Gross Net Gross Net Appalachian Basin (3) Marcellus Shale Utica Shale Magnum Hunter Production Other 61,576 73,267 116,422 14,032 59,276 67,680 40,020 14,032 20,509 65,599 201,799 40 16,649 57,767 168,289 12 82,085 138,866 318,221 14,072 75,925 125,447 208,309 14,044 Sub-Total 265,297 181,007 287,947 242,718 553,243 423,725 South Texas Other(4) 1,777 880 618 546 2,395 1,426 Sub-Total 1,777 880 618 546 2,395 1,426 Williston Basin - USA North Dakota 93,637 37,901 49,227 27,749 142,864 65,650 Sub-Total 93,637 37,901 49,227 27,749 142,864 65,650 (1) Developed acreage is the number of acres allocated or assignable to producing wells or wells capable of production. (2) Undeveloped acreage is lease acreage on which wells have not been drilled or completed to a point that would permit the production of commercial quantities of oil and natural gas, regardless of whether such acreage includes proved reserves. (3) Approximately 51,009 gross acres and 45,494 net acres overlap in our Utica Shale and Marcellus Shale. (4) Pertains to certain miscellaneous properties in Texas and Louisiana. 8 Total360,711219,788337,791271,013698,502490,801 Acreage By Play at June 30, 2015
Confidential Subject to Non-Disclosure Agreement Subject to FRE 408 Midstream Update 9
Confidential Subject to Non-Disclosure Agreement Subject to FRE 408 Update Regarding Eureka Hunter Sale Targeted auction process for MHR’s equity ownership in Eureka Hunter interest from the midstream sector brought significant • Reverse inquiry from 17+ potential buyers • 10 confidentiality agreements signed by strategic and financial buyers • 8 in-depth, face-to-face management presentations to potential buyers • 3 preemptive bid attempts • 6 written bids submitted on bid date in August Despite continuing weakness in commodity prices and a steep fall-off in MLP prices, formal and informal bids were submitted by 7 potential buyers 10
Confidential Subject to Non-Disclosure Agreement Subject to FRE 408 Joint Venture Update 11
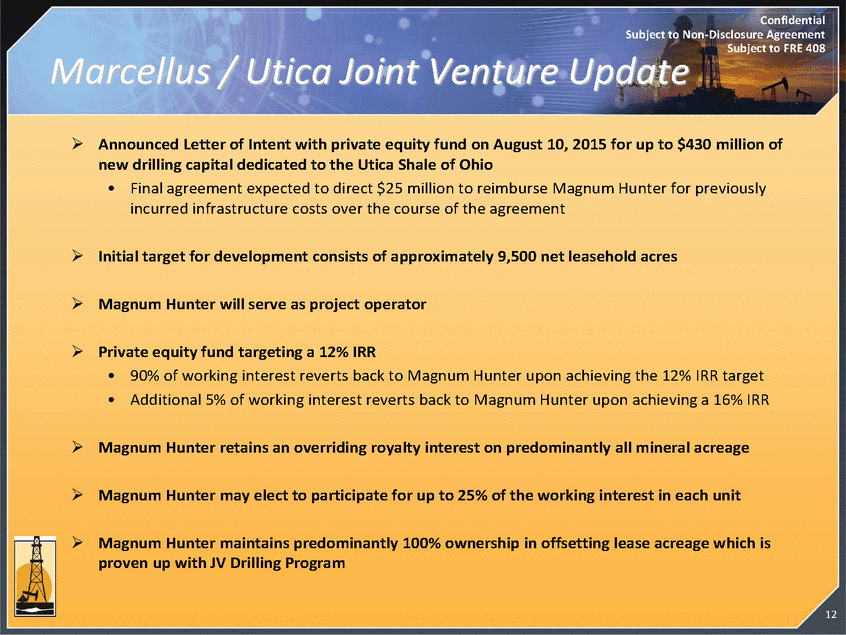
Confidential Subject to Non-Disclosure Agreement Subject to FRE 408 Marcellus / Utica Joint Venture Update Announced Letter of Intent with private equity fund on August 10, 2015 for up to $430 million of new drilling capital dedicated to the Utica Shale of Ohio • Final agreement expected to direct $25 million to reimburse Magnum Hunter for previously incurred infrastructure costs over the course of the agreement Initial target for development consists of approximately 9,500 net leasehold acres Magnum Hunter will serve as project operator Private equity fund targeting a 12% IRR • • 90% of working interest reverts back to Magnum Hunter upon achieving the 12% IRR target Additional 5% of working interest reverts back to Magnum Hunter upon achieving a 16% IRR Magnum Hunter retains an overriding royalty interest on predominantly all mineral acreage Magnum Hunter may elect to participate for up to 25% of the working interest in each unit Magnum Hunter maintains predominantly 100% ownership in offsetting lease acreage which is proven up with JV Drilling Program 12
Confidential Subject to Non-Disclosure Agreement Subject to FRE 408 Financial Update 13

Confidential Subject to Non-Disclosure Agreement Subject to FRE 408 Financial Strategy Given the commodity price environment, the Company has cut capital spending across all operating areas o Year-to-date capital spending of $65 million (including ~$20 million of leasehold acquisition previously required), versus $100 million capital budget Focus on cost control o o Closed Calgary and Denver offices in January of 2015 with substantial overhead reduction Moved corporate headquarters from Houston to Dallas on April 1, 2015 to further reduce G&A Continuing emphasis on G&A reductions coupled with decreasing reliance on third-party consultants o Approach the A&D market opportunistically to monetize remaining non-core properties in the Bakken Shale and Appalachia Use expected improvement in gas and NGL pricing over the winter to add hedges o Target rolling 50% hedging program one to two years forward – will hedge further opportunistically 14
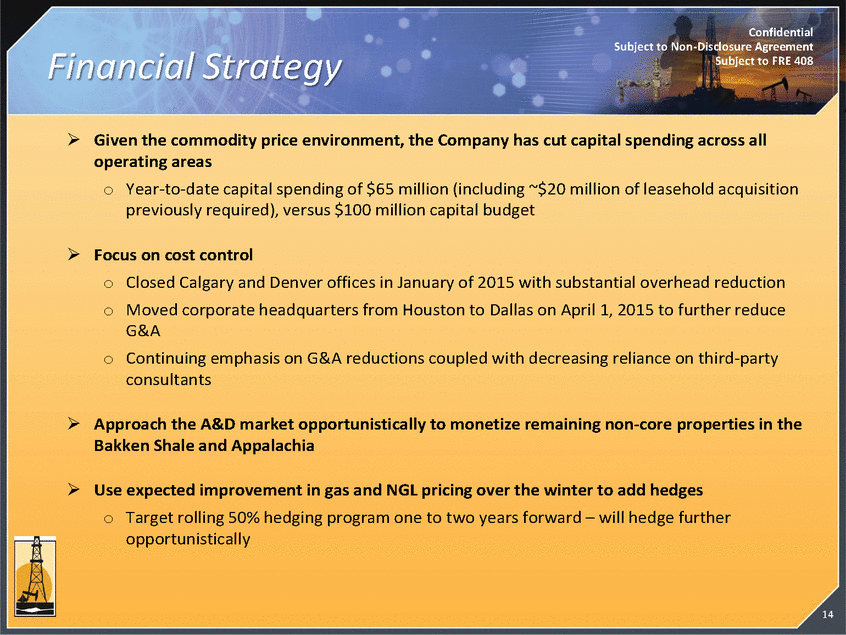
Confidential Subject to Non-Disclosure Agreement Subject to FRE 408 Building Value Through Drilling Operational and financial estimates below reflect Management projections. Daily Production (Mmcfe/d) Oil and Natural Gas Sales 300 $350 $300 250 $250 200 $200 150 $150 100 $100 50 $50 – 0 2014A 2015E 2016E 2017E 2018E 2014A 2015E 2016E 2017E 2018E Capital Expenditures EBITDAX $140 $120 $160 $100 $120 $100 $80 $60 $80 $40 $40 $20 – – 2015E (1) 2014A 2015E 2016E 2017E 2018E 2014A 2016E 2017E 2018E Note: Based on benchmark oil / natural gas prices of $55 / $3.00 in 2016, $60 / $3.25 in 2017, and $65 / $3.50 in 2018. (1) $65mm in capital expenditures year-to-date. $100mm reflects previously approved capital expenditures budget for full year 2015. 15 Capital Expenditures ($mm) Daily Production (MMcfe/d) Oil and Natural Gas Sales ($mm) EBITDAX ($mm) $122 $112 $57 $34 $13 $373 $150 $111 $107 $65 $316 $269 $260 $203 $144 269 239 190 139 101
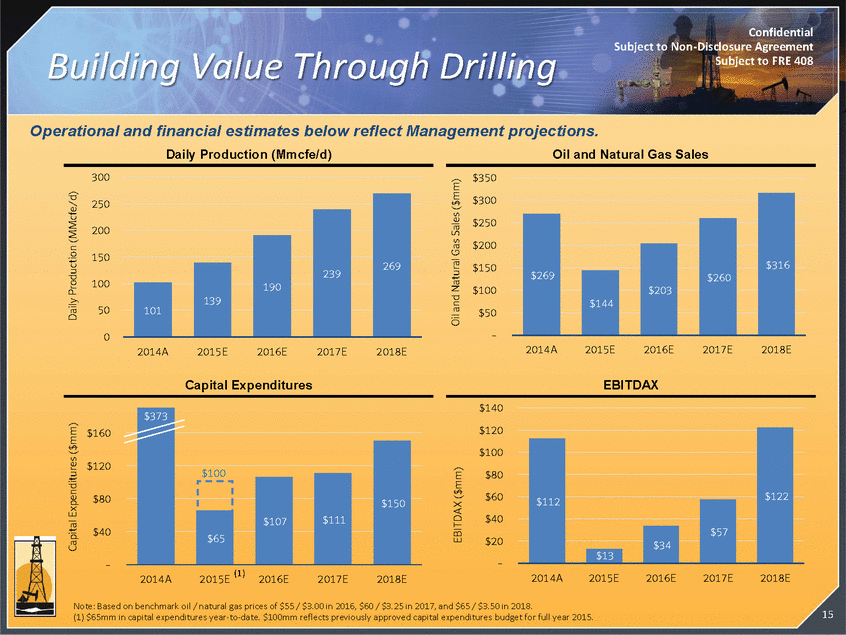
Confidential Subject to Non-Disclosure Agreement Subject to FRE 408 Financial Summary Estimates below reflect assumed drilling budgets prepared by Management. $ in millions, except pricing data 2014A 2015E 2016E 2017E 2018E Benchmark Pricing Oil ($/Bbl) NGL ($/Bbl) Gas ($/Mcf) $93.17 $23.29 $4.35 $54.35 $13.59 $2.84 $55.00 $13.75 $3.00 $60.00 $15.00 $3.25 $65.00 $16.25 $3.50 Realized Pricing Oil ($/Bbl) NGL ($/Bbl) Gas ($/Mcf) $83.53 $48.04 $4.19 $40.47 $15.13 $2.06 $43.26 $11.93 $2.57 $48.40 $13.09 $2.78 $53.34 $13.98 $2.99 Net Production Oil (MBbls) Gas (Mmcf) NGL (MBbls) Total Net Production (Mmcfe) 1,570 21,788 960 1,163 35,322 1,387 1,066 54,231 1,508 688 75,362 1,308 794 84,520 1,512 36,968 50,624 69,675 87,333 98,356 Total Net Production (Mmcfe/d) 101.3 138.7 190.4 239.3 269.5 Oil and Natural Gas Sales $ 269 $ 144 $ 203 $ 260 $ 316 EBITDAX $ 112 $ 13 $ 34 $ 57 $ 122 (1) Capital Expenditures $ 373 $ 65 $ 107 $ 111 $ 150 Note: Forecast NGL realized pricing assumed at 25% of oil pricing. (1) $65mm in capital expenditures year-to-date. $100mm reflects previously approved capital expenditures budget for full year 2015. 16 Estimate
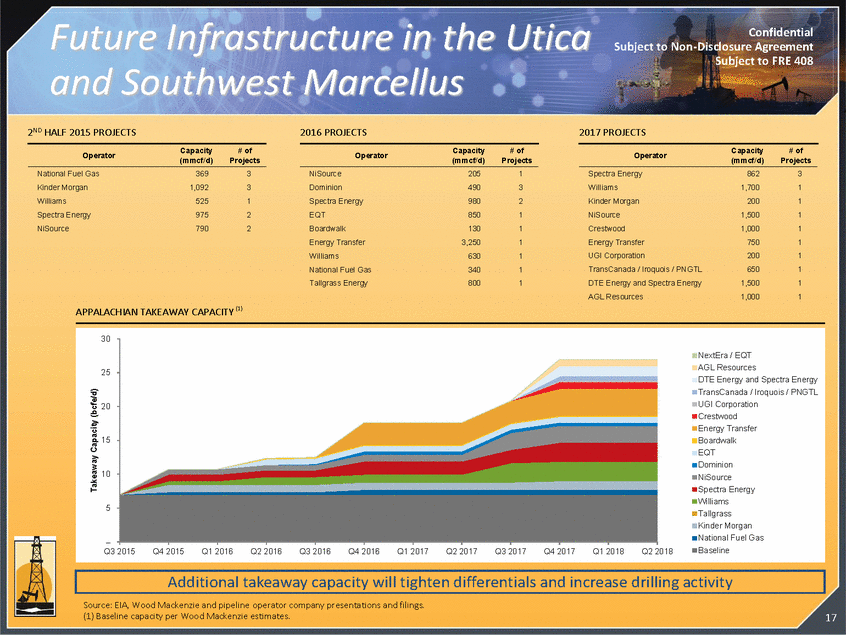
Future Infrastructure in the Utica Confidential Subject to Non-Disclosure Agreement Subject to FRE 408 and Southwest 2ND HALF 2015 PROJECTS Marcellus 2016 PROJECTS 2017 PROJECTS Capacity (mmcf/d) # of Projects Capacity (mmcf/d) # of Projects Capacity (mmcf/d) # of Projects Operator Operator Operator National Fuel Gas Kinder Morgan Williams Spectra Energy NiSource 369 1,092 525 975 790 3 3 1 2 2 NiSource Dominion Spectra Energy EQT Boardwalk Energy Transfer Williams National Fuel Gas Tallgrass Energy 205 490 980 850 130 3,250 630 340 800 1 3 2 1 1 1 1 1 1 Spectra Energy Williams Kinder Morgan NiSource Crestwood Energy Transfer UGI Corporation TransCanada / Iroquois / PNGTL DTE Energy and Spectra Energy AGL Resources 862 1,700 200 1,500 1,000 750 200 650 1,500 1,000 3 1 1 1 1 1 1 1 1 1 APPALACHIAN TAKEAWAY CAPACITY (1) 30 NextEra / EQT AGL Resources DTE Energy and Spectra Energy TransCanada / Iroquois / PNGTL UGI Corporation Crestwood Energy Transfer Boardwalk EQT Dominion NiSource Spectra Energy Williams Tallgrass Kinder Morgan National Fuel Gas Baseline 25 20 15 10 5 – Q3 2015 Q4 2015 Q1 2016 Q2 2016 Q3 2016 Q4 2016 Q1 2017 Q2 2017 Q3 2017 Q4 2017 Q1 2018 Q2 2018 Source: EIA, Wood Mackenzie and pipeline operator company presentations and filings. (1) Baseline capacity per Wood Mackenzie estimates. 17 Takeaway Capacity (bcfe/d) Additional takeaway capacity will tighten differentials and increase drilling activity
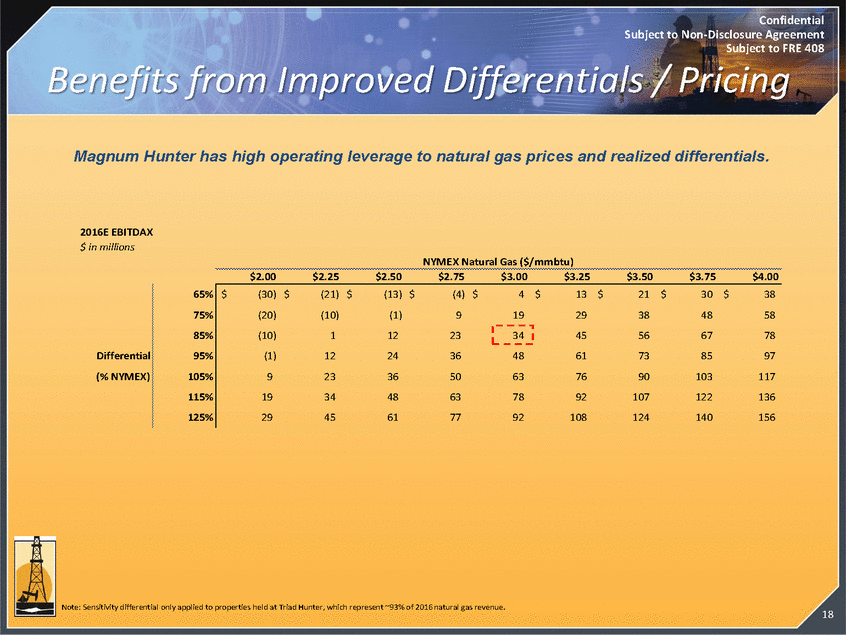
Confidential Subject to Non-Disclosure Agreement Subject to FRE 408 Benefits from Improved Differentials / Pricing Magnum Hunter has high operating leverage to natural gas prices and realized differentials. 2016E EBITDAX $ in millions NYMEX Natural Gas ($/mmbtu) $2.00 $2.25 $2.50 $2.75 $3.00 $3.25 $3.50 $3.75 $4.00 65% 75% 85% 95% 105% 115% 125% Differential (% NYMEX) Note: Sensitivity differential only applied to properties held at Triad Hunter, which represent ~93% of 2016 natural gas revenue. 18 $ (30) $ (21) $ (13) $ (4) $ 4 $ 13 $ 21 $ 30 $ 38 (20) (10) (1) 9 19 29 38 48 58 (10) 1 12 23 45 56 67 78 (1) 12 24 36 48 61 73 85 97 9 23 36 50 63 76 90 103117 19 34 48 63 78 92 107 122136 29 45 61 77 92 108 124 140156 34
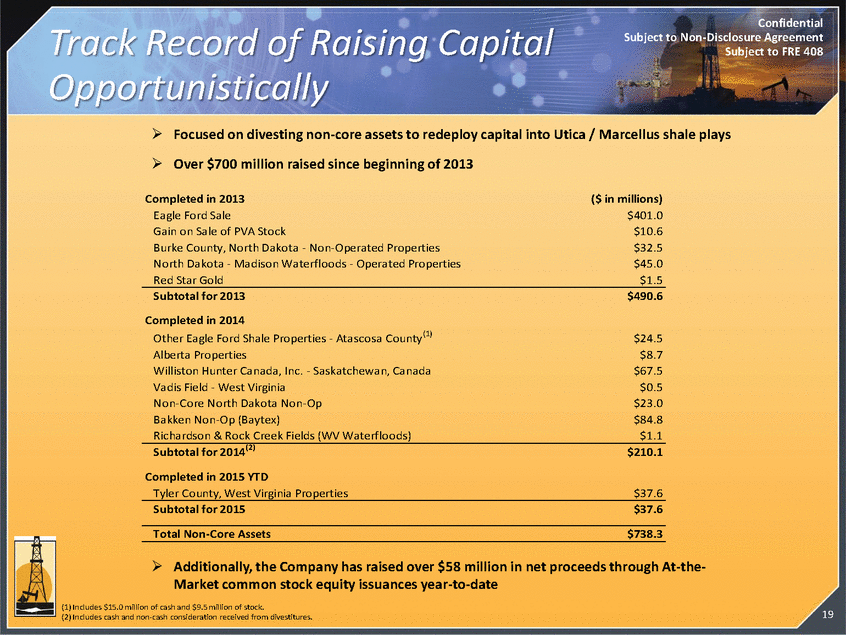
Confidential Subject to Non-Disclosure Agreement Subject to FRE 408 Track Record of Raising Capital Opportunistically Focused on divesting non-core assets to redeploy capital into Utica / Marcellus shale plays Over $700 million raised since beginning of 2013 Completed in 2013 Eagle Ford Sale Gain on Sale of PVA Stock Burke County, North Dakota - Non-Operated Properties North Dakota - Madison Waterfloods - Operated Properties Red Star Gold ($ in millions) $401.0 $10.6 $32.5 $45.0 $1.5 Subtotal for 2013 Completed in 2014 Other Eagle Ford Shale Properties - Atascosa County(1) Alberta Properties Williston Hunter Canada, Inc. - Saskatchewan, Canada Vadis Field - West Virginia Non-Core North Dakota Non-Op Bakken Non-Op (Baytex) Richardson & Rock Creek Fields (WV Waterfloods) $490.6 $24.5 $8.7 $67.5 $0.5 $23.0 $84.8 $1.1 Subtotal for 2014(2) $210.1 Completed in 2015 YTD Tyler County, West Virginia Properties $37.6 Subtotal for 2015 $37.6 Total Non-Core Assets $738.3 Additionally, the Company has raised over $58 million in net proceeds through At-the-Market common stock equity issuances year-to-date (1) Includes $15.0 million of cash and $9.5 million of stock. (2) Includes cash and non-cash consideration received from divestitures. 19
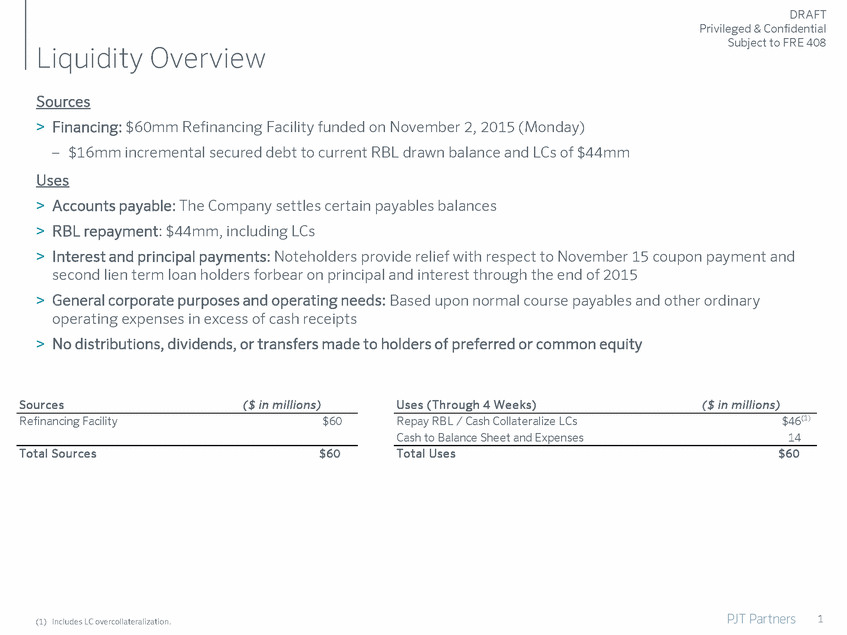
DRAFT Privileged & Confidential Subject to FRE 408 Liquidity Overview Sources > Financing: $60mm Refinancing Facility funded on November 2, 2015 (Monday) – $16mm incremental secured debt to current RBL drawn balance and LCs of $44mm Uses > > > Accounts payable: The Company settles certain payables balances RBL repayment: $44mm, including LCs Interest and principal payments: Noteholders provide relief with respect to November 15 coupon payment and second lien term loan holders forbear on principal and interest through the end of 2015 General corporate purposes and operating needs: Based upon normal course payables and other ordinary operating expenses in excess of cash receipts No distributions, dividends, or transfers made to holders of preferred or common equity > > Sources ($ in millions) Uses (Through 4 Weeks) ($ in millions) $46(1) 14 Refinancing Facility $60 Repay RBL / Cash Collateralize LCs Cash to Balance Sheet and Expenses Total Sources $60 Total Uses $60 1 (1) Includes LC overcollateralization.
