Attached files
| file | filename |
|---|---|
| 8-K - 8-K - ENCORE CAPITAL GROUP INC | a8-kxearningsslidesq320151.htm |

Encore Capital Group, Inc. Q3 2015 EARNINGS CALL Exhibit 99.1

PROPRIETARY 2 CAUTIONARY NOTE ABOUT FORWARD-LOOKING STATEMENTS The statements in this presentation that are not historical facts, including, most importantly, those statements preceded by, or that include, the words “will,” “may,” “believe,” “projects,” “expects,” “anticipates” or the negation thereof, or similar expressions, constitute “forward-looking statements” within the meaning of the Private Securities Litigation Reform Act of 1995 (the “Reform Act”). These statements may include, but are not limited to, statements regarding our future operating results, earnings per share, and growth. For all “forward-looking statements,” the Company claims the protection of the safe harbor for forward-looking statements contained in the Reform Act. Such forward-looking statements involve risks, uncertainties and other factors which may cause actual results, performance or achievements of the Company and its subsidiaries to be materially different from any future results, performance or achievements expressed or implied by such forward-looking statements. These risks, uncertainties and other factors are discussed in the reports filed by the Company with the Securities and Exchange Commission, including its most recent report on Form 10-K, as it may be amended from time to time. The Company disclaims any intent or obligation to update these forward-looking statements.

PROPRIETARY 3 ENCORE DELIVERED RECORD ECONOMIC EARNINGS Economic EPS** $1.34 GAAP EPS* ($0.43) GAAP Net Income* ($11) million Adjusted Income** $34 million Estimated Remaining Collections of $5.7 billion * Attributable to Encore ** Please refer to Appendix for reconciliation of Economic EPS, Adjusted EBITDA, and Adjusted Income to GAAP *** Cost to Collect = Adjusted Operating Expenses / Dollars collected. See Appendix for reconciliation of Adjusted Operating Expenses to GAAP. Adjusted EBITDA** $268 million Collections $422 million Cost to Collect*** 39.2%

PROPRIETARY 4 OUR CAPITAL DEPLOYMENT IN THE U.S. REFLECTS OUR SUBSTANTIAL DOMESTIC MARKET SHARE Q3 2015 Deployments $M United States $160 Europe $42 Latin America $13 Total $215

PROPRIETARY WE REMAIN ON-TRACK TO MEET OUR 2015 US CORE DEPLOYMENT TARGET 5 US Core Deployment 2015e vs. Historical 526 554562 0 200 400 600 2012 Expected Deployed or Committed 2015e 500–600 2014 2013 Our deployment target in the US core market remains consistent with prior years at $500M - $600M / year Core deployment excludes Propel $M

PROPRIETARY 6 ACCOUNTS OUTSIDE THE U.S. NOW GENERATE APPROXIMATELY ONE-THIRD OF OUR COLLECTIONS Collections by Geography - 100 200 300 400 500 2 0 1 3 2 0 1 4 2 0 1 4 2 0 1 5 2 0 1 4 2 0 1 5 2 0 1 4 2 0 1 5 Q4 Q1 Q2 Q3 United States Europe Latin America 409 422 351 397 437 407 394 425 $M
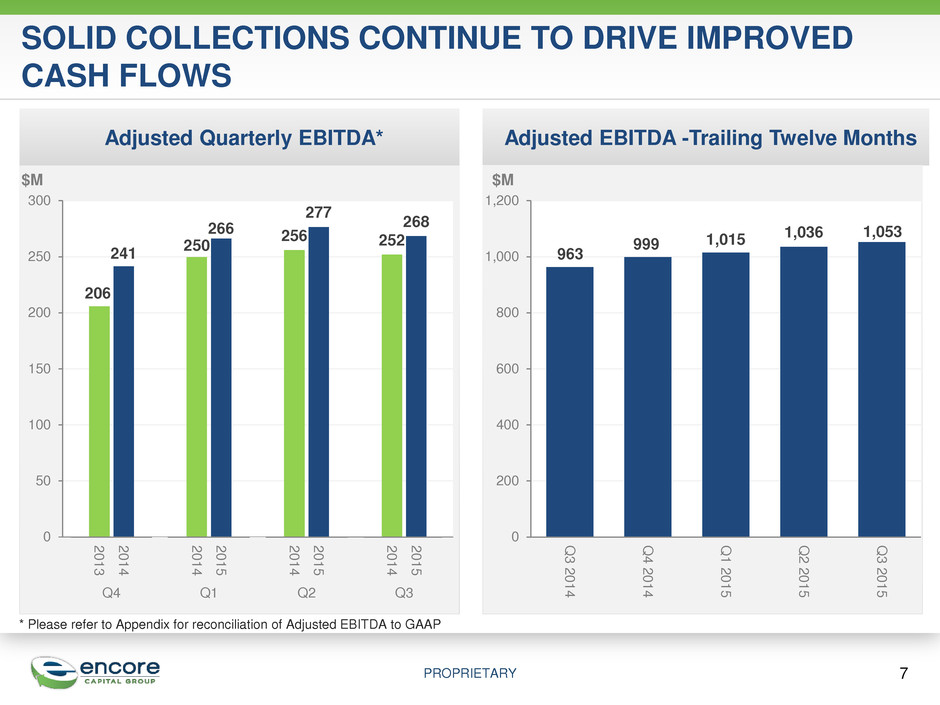
PROPRIETARY SOLID COLLECTIONS CONTINUE TO DRIVE IMPROVED CASH FLOWS 7 * Please refer to Appendix for reconciliation of Adjusted EBITDA to GAAP $M Adjusted Quarterly EBITDA* Adjusted EBITDA -Trailing Twelve Months 206 241 250 266 256 277 252 268 0 50 100 150 200 250 300 2 0 1 3 2 0 1 4 2 0 1 4 2 0 1 5 2 0 1 4 2 0 1 5 2 0 1 4 2 0 1 5 Q4 Q1 Q2 Q3 963 999 1,015 1,036 1,053 0 200 400 600 800 1,000 1,200 Q 3 2 0 1 4 Q 4 2 0 1 4 Q 1 2 0 1 5 Q 2 2 0 1 5 Q 3 2 0 1 5 $M $M

PROPRIETARY 8 Increased revenues 22% during the third quarter of 2015 compared to the third quarter of 2014 Increased collections 20% during the third quarter of 2015 compared to the third quarter of 2014 Deployed $335 million through the first three quarters of 2015 Cabot contributed $0.30 of Economic EPS to Encore earnings in Q3 of 2015 Cabot Update CABOT CONTINUES TO IMPROVE ITS POSITION AS THE LEADER IN THE U.K. DEBT RECOVERY MARKET

PROPRIETARY ENCORE ACQUIRED BAYCORP TO ENTER ATTRACTIVE MARKETS IN AUSTRALIA AND NEW ZEALAND Strong Markets • Australian credit market growing at > 4% annually • Australian deployments ~$330 million per year • New Zealand credit market growing at >7% annually 9 Future Vision • Promising opportunities to grow and consolidate market share • Employ Encore’s global innovation and best practices to become the leading debt resolution specialist in the region Established Leader • Top 4 market share in Australia • Dominant share in New Zealand • More than 1/3 of business in contingency collections
PROPRIETARY ENCORE’S SETTLEMENT WITH THE CFPB PROVIDES CERTAINTY AND CLARITY TO FUTURE OPERATIONS 10 • Reaching this settlement and removing the associated uncertainty was in the best interest of our stakeholders and the industry • In Q3, Encore took a one-time, after-tax charge of $43 million that we expect will completely cover the penalties and legal costs associated with this settlement and a subsequent multi-state arrangement • Agreement requires fine-tuning of procedures that will not materially impact operations • Encore’s earnings growth trajectory remains intact • We now have more clarity regarding operational expectations ahead of formal rule making • Operational outcome based on “best practices” being adopted by issuers and has now become a competitive advantage

11 Detailed Financial Discussion
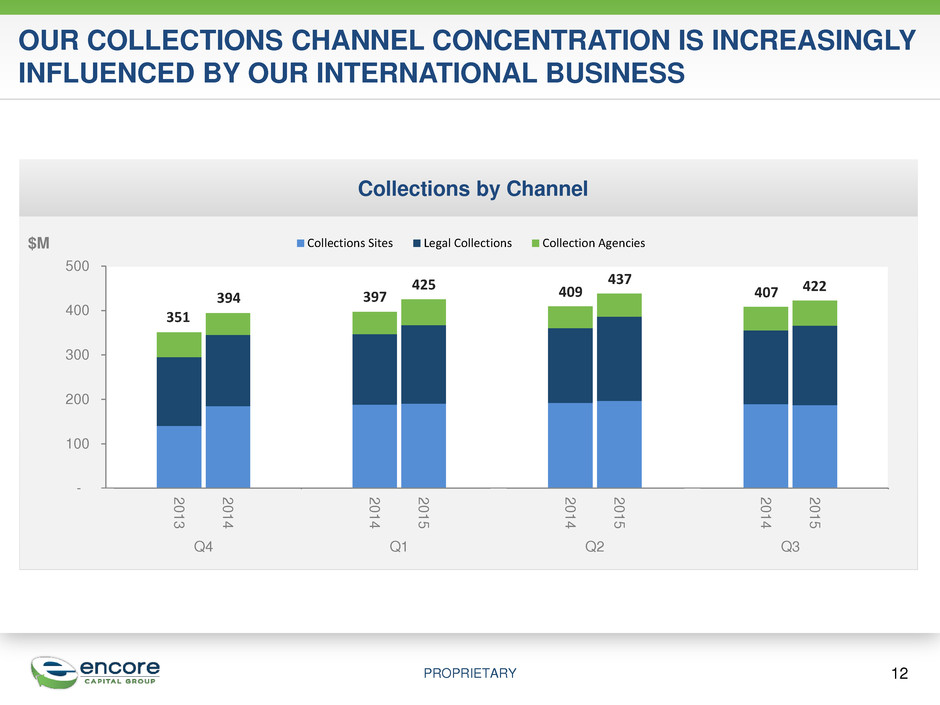
PROPRIETARY 12 OUR COLLECTIONS CHANNEL CONCENTRATION IS INCREASINGLY INFLUENCED BY OUR INTERNATIONAL BUSINESS Collections by Channel - 100 200 300 400 500 2 0 1 3 2 0 1 4 2 0 1 4 2 0 1 5 2 0 1 4 2 0 1 5 2 0 1 4 2 0 1 5 Q4 Q1 Q2 Q3 Collections Sites Legal Collections Collection Agencies 409 422 351 397 437 407 394 425 $M
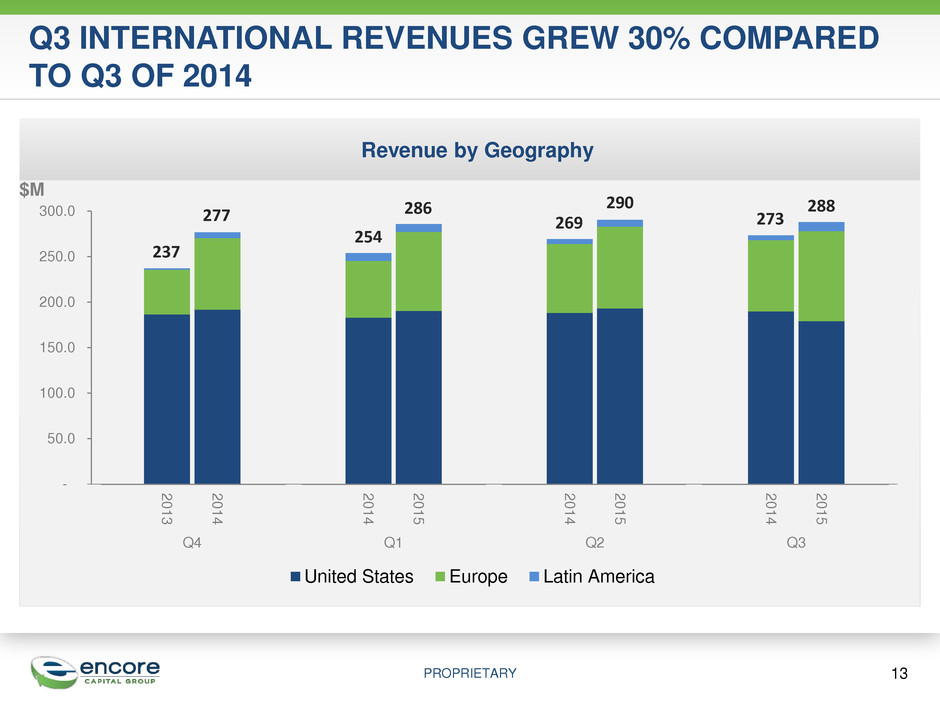
PROPRIETARY Q3 INTERNATIONAL REVENUES GREW 30% COMPARED TO Q3 OF 2014 Revenue by Geography 13 - 50.0 100.0 150.0 200.0 250.0 300.0 2 0 1 3 2 0 1 4 2 0 1 4 2 0 1 5 2 0 1 4 2 0 1 5 2 0 1 4 2 0 1 5 Q4 Q1 Q2 Q3 United States Europe Latin America $M 269 273 237 254 290 288 277 286

PROPRIETARY OVERALL COST TO COLLECT REFLECTS A MODEST SHIFT TOWARD LEGAL COLLECTIONS IN EUROPE 14 Overall Cost to Collect* 42% 40% 38% 39% 38% 38% 39% 39% 0% 10% 20% 30% 40% 50% 2 0 1 3 2 0 1 4 2 0 1 4 2 0 1 5 2 0 1 4 2 0 1 5 2 0 1 4 2 0 1 5 Q4 Q1 Q2 Q3 ⃰ Cost to Collect = Adjusted Operating Expenses / Dollar collected. See Appendix for reconciliation of Adjusted Operating Expenses to GAAP. Channel Q3 2015 CTC Q3 2014 CTC Europe 31.4% 30.3% United States 43.0% 42.2% Latin America 30.2% 28.1% Encore 39.2% 38.9%
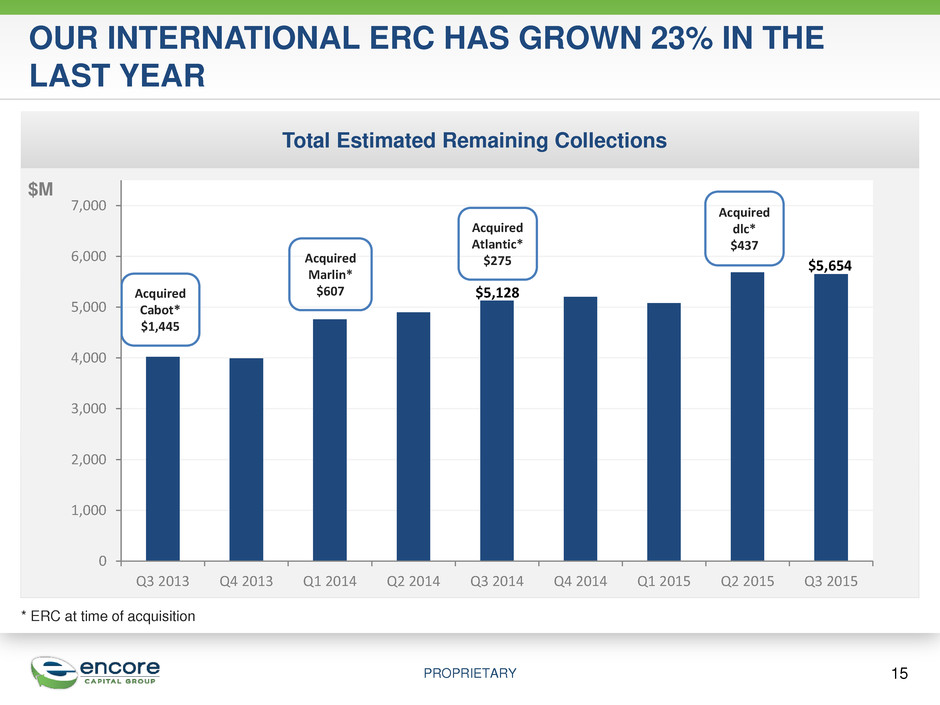
PROPRIETARY Total Estimated Remaining Collections $M 0 1,000 2,000 3,000 4,000 5,000 6,000 7,000 Q3 2013 Q4 2013 Q1 2014 Q2 2014 Q3 2014 Q4 2014 Q1 2015 Q2 2015 Q3 2015 Acquired dlc* $437 15 OUR INTERNATIONAL ERC HAS GROWN 23% IN THE LAST YEAR * ERC at time of acquisition Acquired Cabot* $1,445 Acquired Marlin* $607 Acquired Atlantic* $275 $5,654 $5,128
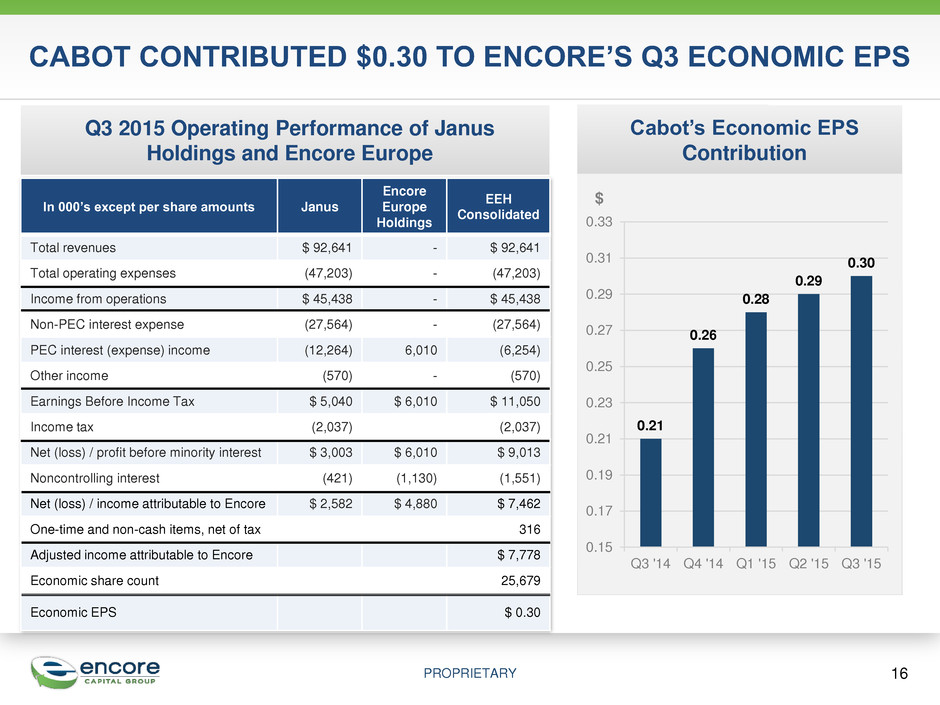
PROPRIETARY CABOT CONTRIBUTED $0.30 TO ENCORE’S Q3 ECONOMIC EPS In 000’s except per share amounts Janus Encore Europe Holdings EEH Consolidated Total revenues $ 92,641 - $ 92,641 Total operating expenses (47,203) - (47,203) Income from operations $ 45,438 - $ 45,438 Non-PEC interest expense (27,564) - (27,564) PEC interest (expense) income (12,264) 6,010 (6,254) Other income (570) - (570) Earnings Before Income Tax $ 5,040 $ 6,010 $ 11,050 Income tax (2,037) (2,037) Net (loss) / profit before minority interest $ 3,003 $ 6,010 $ 9,013 Noncontrolling interest (421) (1,130) (1,551) Net (loss) / income attributable to Encore $ 2,582 $ 4,880 $ 7,462 One-time and non-cash items, net of tax 316 Adjusted income attributable to Encore $ 7,778 Economic share count 25,679 Economic EPS $ 0.30 16 Q3 2015 Operating Performance of Janus Holdings and Encore Europe 0.21 0.26 0.28 0.29 0.30 0.15 0.17 0.19 0.21 0.23 0.25 0.27 0.29 0.31 0.33 Q3 '14 Q4 '14 Q1 '15 Q2 '15 Q3 '15 Cabot’s Economic EPS Contribution $

PROPRIETARY ENCORE DELIVERED RECORD ECONOMIC EPS OF $1.34 IN Q3 17 * Please refer to Appendix for reconciliation of Adjusted EPS / Economic EPS measurements to GAAP ($0.43) $0.04 $1.30 $1.34 $1.61 $0.07 $0.01 ($0.50) ($0.25) $0.00 $0.25 $0.50 $0.75 $1.00 $1.25 $1.50 Net income per diluted share attributable to Encore CFPB/Regulatory one-time charges, net of tax Net non-cash interest and issuance cost amortization, net of tax Acquisition, integration and restructuring related fees, net of tax Effect of diluted potential shares excluded from loss per share calculation Adjusted income per diluted share attributable to Encore - (Accounting)* Adjusted Income Attributable to Encore - (Economic)* Less ~800K shares which are reflected in Adjusted EPS, but will not be issued

PROPRIETARY SUMMARY AND OUTLOOK Strong Financial Track-Record • Delivered Economic EPS of $1.34 in Q3, up 15% Adaptable To Evolving Markets • On track to deploy capital globally, across all asset classes, within target range of $1.2 billion to $1.4 billion in 2015 Excellent US Competitive Position • On track to deploy capital in the core U.S. market within target range of $500 million to $600 million in 2015 Proven International Capabilities • Acquired Baycorp to expand into Australia and New Zealand • Continue to evaluate new opportunities to strengthen and expand internationally 18

19 Q&A

20 Appendix

PROPRIETARY 21 NON-GAAP FINANCIAL MEASURES This presentation includes certain financial measures that exclude the impact of certain items and therefore have not been calculated in accordance with U.S. generally accepted accounting principles (“GAAP”). The Company has included information concerning Adjusted EBITDA because management utilizes this information, which is materially similar to a financial measure contained in covenants used in the Company's revolving credit facility, in the evaluation of its operations and believes that this measure is a useful indicator of the Company’s ability to generate cash collections in excess of operating expenses through the liquidation of its receivable portfolios. The Company has included information concerning Adjusted Operating Expenses in order to facilitate a comparison of approximate cash costs to cash collections for the portfolio purchasing and recovery business in the periods presented. The Company has included Adjusted Income Attributable to Encore and Adjusted Income Attributable to Encore per Share (also referred to as Economic EPS when adjusted for certain shares associated with our convertible notes that will not be issued but are reflected in the fully diluted share count for accounting purposes) because management uses these measures to assess operating performance, in order to highlight trends in the Company’s business that may not otherwise be apparent when relying on financial measures calculated in accordance with GAAP. Adjusted EBITDA, Adjusted Operating Expenses, Adjusted Income Attributable to Encore and Adjusted Income Attributable to Encore per Share/Economic EPS have not been prepared in accordance with GAAP. These non-GAAP financial measures should not be considered as alternatives to, or more meaningful than, net income, net income per share, and total operating expenses as indicators of the Company’s operating performance. Further, these non-GAAP financial measures, as presented by the Company, may not be comparable to similarly titled measures reported by other companies. The Company has attached to this presentation a reconciliation of these non-GAAP financial measures to their most directly comparable GAAP financial measures.

PROPRIETARY 22 RECONCILIATION OF ADJUSTED INCOME AND ECONOMIC / ADJUSTED EPS Reconciliation of Adjusted Income and Economic / Adjusted EPS to GAAP EPS (Unaudited, In Thousands, except per share amounts), Three Months Ended September 30, 2015 2014 $ Per Diluted Share – Accounting Per Diluted Share – Economic* $ Per Diluted Share – Accounting Per Diluted Share – Economic* GAAP net income attributable to Encore, as reported ($ 10,959) ($ 0.43) ($ 0.43) $ 30,335 $ 1.11 $ 1.15 Effect of diluted potential shares excluded from loss per share calculation 1 --- 0.01 --- --- --- --- Adjustments: Convertible notes non-cash interest and issuance cost amortization, net of tax 1,755 0.07 0.07 1,773 0.06 0.07 CFPB/Regulatory one-time charges, net of tax 42,554 1.61 1.66 --- --- --- Acquisition, integration and restructuring related expenses, net of tax 1,125 0.04 0.04 1,001 0.04 0.04 Net effect of non-recurring tax adjustments --- --- --- (2,291) (0.08) (0.09) Adjusted Income Attributable to Encore $ 34,475 $ 1.30 $ 1.34 $ 30,818 $ 1.13 $ 1.17 * Economic EPS for the three months ended September 30, 2015 and September 30, 2014 excludes approximately 0.8 million and 1.0 million shares, respectively, issuable upon the conversion of the company’s convertible senior notes that are included for accounting purposes but will not be issued due to certain hedge and warrant transactions. 1. The shares used to calculate GAAP net loss per diluted share – accounting and GAAP net loss per diluted share – economic during the three months ended September 30, 2015 exclude dilutive potential common shares because of their anti-dilutive effect.

PROPRIETARY Reconciliation of Adjusted EBITDA to GAAP Net Income (Unaudited, In $ Thousands) Three Months Ended 12/31/13 3/31/14 6/30/14 9/30/14 12/31/14 3/31/15 6/30/15 9/30/15 GAAP net income, as reported $ 22,216 $ 18,830 $ 21,353 $ 30,138 $ 27,957 $ 29,967 $ 25,185 ($ 9,364) (Gain) loss from discontinued operations, net of tax 1,432 - - - 1,612 - - - Interest expense 29,747 37,962 43,218 43,498 42,264 42,303 46,250 47,816 Provision for income taxes 15,278 11,742 14,010 10,154 16,819 15,883 15,964 (4,887) Depreciation and amortization 5,020 6,117 6,829 6,933 8,070 8,350 8,084 8,235 Amount applied to principal on receivable portfolios 124,520 159,106 161,048 155,435 139,075 160,961 167,024 156,229 Stock-based compensation expense 3,486 4,836 4,715 4,009 3,621 5,905 6,198 5,156 CFPB/Regulatory one-time charges --- --- --- --- --- --- --- 63,019 Acquisition, integration and restructuring related expenses 4,260 11,081 4,645 1,622 1,951 2,772 7,900 2,246 Adjusted EBITDA $ 205,959 $ 249,674 $ 255,818 $ 251,789 $ 241,369 $ 266,141 $ 276,605 $ 268,450 RECONCILIATION OF ADJUSTED EBITDA 23

PROPRIETARY Reconciliation of Adjusted Operating Expenses to GAAP Operating Expenses (Unaudited, In $ Thousands) Three Months Ended RECONCILIATION OF ADJUSTED OPERATING EXPENSES 12/31/13 3/31/14 6/30/14 9/30/14 12/31/14 3/31/15 6/30/15 9/30/15 GAAP total operating expenses, as reported $ 168,466 $ 185,472 $ 190,689 $ 188,960 $ 188,224 $ 199,627 $ 203,352 $ 253,307 Adjustments: Stock-based compensation expense (3,486) (4,836) (4,715) (4,009) (3,621) (5,905) (6,198) (5,156) Operating expense related to other operating segments (12,755) (19,832) (26,409) (25,058) (25,867) (26,349) (24,928) (25,946) Operating expense related CFPB/Regulatory one-time charges --- --- --- --- --- --- --- (54,697) Acquisition, integration and restructuring related expenses (4,260) (11,081) (4,645) (1,622) (1,951) (2,772) (7,900) (2,246) Adjusted Operating Expenses $ 147,965 $ 149,723 $ 154,920 $ 158,271 $ 156,785 $ 164,601 $ 164,326 $ 165,262 24
