Attached files
| file | filename |
|---|---|
| EX-32.1 - EXHIBIT 32.1 - ENCORE CAPITAL GROUP INC | ecpg-20161231ex321.htm |
| EX-31.2 - EXHIBIT 31.2 - ENCORE CAPITAL GROUP INC | ecpg-20161231ex312.htm |
| EX-31.1 - EXHIBIT 31.1 - ENCORE CAPITAL GROUP INC | ecpg-20161231ex311.htm |
| EX-23 - EXHIBIT 23 - ENCORE CAPITAL GROUP INC | ecpg-20161231ex23.htm |
| EX-21 - EXHIBIT 21 - ENCORE CAPITAL GROUP INC | ecpg-20161231ex21.htm |
| EX-10.108 - EXHIBIT 10.108 - ENCORE CAPITAL GROUP INC | ecpg-20161231ex10108.htm |
| EX-10.107 - EXHIBIT 10.107 - ENCORE CAPITAL GROUP INC | ecpg-20161231ex10107.htm |
| EX-10.106 - EXHIBIT 10.106 - ENCORE CAPITAL GROUP INC | ecpg-20161231ex10106.htm |
| EX-10.105 - EXHIBIT 10.105 - ENCORE CAPITAL GROUP INC | ecpg-20161231ex10105.htm |
UNITED STATES
SECURITIES AND EXCHANGE COMMISSION
WASHINGTON, D.C. 20549
FORM 10-K
(Mark One)
x | ANNUAL REPORT PURSUANT TO SECTION 13 OR 15(d) OF THE SECURITIES EXCHANGE ACT OF 1934 |
For the fiscal year ended December 31, 2016 or
TRANSITION REPORT PURSUANT TO SECTION 13 OR 15(d) OF THE SECURITIES EXCHANGE ACT OF 1934
For the transition period from to .
COMMISSION FILE NUMBER: 000-26489
ENCORE CAPITAL GROUP, INC.
(Exact name of registrant as specified in its charter)
Delaware | 48-1090909 | |
(State or other jurisdiction of incorporation or organization) | (IRS Employer Identification No.) | |
3111 Camino Del Rio North, Suite 103 San Diego, California | 92108 | |
(Address of principal executive offices) | (Zip code) | |
(877) 445-4581
(Registrant’s telephone number, including area code)
Securities registered pursuant to Section 12(b) of the Act:
Title of Each Class | Name of Each Exchange on Which Registered | |
Common Stock, $.01 Par Value Per Share | The NASDAQ Stock Market LLC | |
Securities registered pursuant to Section 12(g) of the Act: None
Indicate by check mark if the registrant is a well-known seasoned issuer, as defined in Rule 405 of the Securities Act. Yes x No ¨
Indicate by check mark if the registrant is not required to file reports pursuant to Section 13 or Section 15(d) of the Act. Yes ¨ No x
Indicate by check mark whether the registrant: (1) has filed all reports required to be filed by Section 13 or 15(d) of the Securities Exchange Act of 1934 during the preceding 12 months (or for such shorter period that the registrant was required to file such reports), and (2) has been subject to such filing requirements for the past 90 days. Yes x No ¨
Indicate by check mark whether the registrant has submitted electronically and posted on its corporate Web site, if any, every Interactive Data File required to be submitted and posted pursuant to Rule 405 of Regulation S-T (§232.405 of this chapter) during the preceding 12 months (or for such shorter period that the registrant was required to submit and post such files). Yes x No ¨
Indicate by check mark if disclosure of delinquent filers pursuant to Item 405 of Regulation S-K is not contained herein, and will not be contained, to the best of registrant’s knowledge, in definitive proxy or information statements incorporated by reference in Part III of this Form 10-K or any amendment to this Form 10-K. x
Indicate by check mark whether the registrant is a large accelerated filer, an accelerated filer, a non-accelerated filer or a smaller reporting company. See the definitions of “large accelerated filer,” “accelerated filer” and “smaller reporting company” in Rule 12b-2 of the Exchange Act. (Check one):
Large accelerated filer x | Accelerated filer ¨ | Non-accelerated filer ¨ | Smaller reporting company ¨ | |||
Indicate by check mark whether the registrant is a shell company (as defined in Rule 12b-2 of the Act). Yes ¨ No x
The aggregate market value of the voting stock held by non-affiliates of the registrant totaling 23,649,615 shares was approximately $556,475,441 at June 30, 2016, based on the closing price of the common stock of $23.53 per share on such date, as reported by the NASDAQ Global Select Market.
The number of shares of our Common Stock outstanding at February 9, 2017, was 25,598,192.
Documents Incorporated by Reference
Portions of the registrant’s proxy statement in connection with its annual meeting of stockholders to be held in 2017 are incorporated by reference in Items 10, 11, 12, 13, and 14 of Part III of this Annual Report on Form 10-K for the fiscal year ended December 31, 2016.
TABLE OF CONTENTS
Page | |
Item 5—Market for the Registrant’s Common Equity, Related Stockholder Matters and Issuer Purchases of Equity Securities | |
PART I
Item 1—Business
An Overview of Our Business
Nature of Our Business
We are an international specialty finance company providing debt recovery solutions and other related services for consumers across a broad range of financial assets.
Portfolio Purchasing and Recovery Business
We purchase portfolios of defaulted consumer receivables at deep discounts to face value and manage them by working with individuals as they repay their obligations and work toward financial recovery. Defaulted receivables are consumers’ unpaid financial commitments to credit originators, including banks, credit unions, consumer finance companies, commercial retailers, and telecommunication companies. Defaulted receivables may also include receivables subject to bankruptcy proceedings.
United States
Through certain subsidiaries, we are a market leader in portfolio purchasing and recovery in the United States, including Puerto Rico.
Europe
Through our controlling interest in U.K.-based Cabot Credit Management Limited and its subsidiaries (collectively, “Cabot”), we are a market leader in debt management in the United Kingdom and Ireland. Cabot specializes in collecting higher balance, “semi-performing” accounts (i.e., debt portfolios in which over 50% of the accounts have received a payment in three of the last four months immediately prior to the portfolio purchase). In February 2014, Cabot acquired Marlin Financial Group Limited (“Marlin”), a leading acquirer of non-performing consumer debt in the United Kingdom. Marlin is differentiated by its use of litigation-enhanced collections for non-paying financial services receivables, which complements Cabot’s management of semi-performing accounts. On June 1, 2015, Cabot continued to expand in the United Kingdom with its acquisition of Hillesden Securities Ltd and its subsidiaries (“dlc”).
Our wholly-owned subsidiary, Grove Holdings (“Grove”), is a leading specialty investment firm focused on consumer non-performing loans, including insolvencies in the United Kingdom (in particular, individual voluntary arrangements, or IVAs) and bank and non-bank receivables in Spain. To date, operating results from our subsidiaries in Europe other than Cabot have not been significant to our total consolidated operating results. As a result, descriptions of our international operations in Part I - Item 1 of this Form 10-K will focus substantially on our combined Cabot operations.
Latin America
Through our majority ownership interest in Refinancia S.A. (“Refinancia”), we are a market leader in debt collection and management in Colombia and Peru. In addition to purchasing defaulted receivables, Refinancia offers portfolio management services to banks for non-performing loans. Refinancia also specializes in non-traditional niches in the geographic areas in which it operates, including providing financial solutions to individuals who have previously defaulted on their obligations. In addition to operations in Colombia and Peru, we evaluate and purchase non-performing loans in other countries in Latin America, including Mexico and Brazil. We also invest in non-performing secured residential mortgages in Latin America. To date, operating results from our Latin America operations have not been significant to our total consolidated operating results. As a result, descriptions of our international operations in Part 1 - Item 1 of this Form 10-K will not include a detailed discussion of our Latin American operations.
Asia Pacific
Through our majority ownership interest in Baycorp Holdings Pty Limited (“Baycorp”), we are one of Australasia's leading debt resolution specialists. Baycorp specializes in the management of non-performing loans in Australia and New Zealand. In addition to purchasing defaulted receivables, Baycorp offers portfolio management services to banks for non-performing loans. To date, Baycorp’s operating results have been immaterial to our total consolidated operating results. As a result, descriptions of our international operations in Part 1 - Item 1 of this Form 10-K will not include a detailed discussion of Baycorp’s operations.
Throughout this Annual Report on Form 10-K, when we refer to our United States operations, we include accounts originated in the United States that are serviced through our operations centers in the United States, India and Costa Rica. When we refer to our international operations, we are referring to accounts originated outside of the United States. Those accounts are serviced in the country of origin.
1
Tax Lien Business
Beginning with the first quarter 2016, we conduct business through one reportable segment, portfolio purchasing and recovery. On March 31, 2016, we completed the divestiture of our membership interests in Propel Acquisition LLC (“Propel”). Propel represented our entire tax lien business reportable segment prior to the divestiture. Propel’s operations are presented as discontinued operations in our consolidated statements of income.
Keys to Success
The foundation of our success is our people, our organizational agility, and our integrity. This foundation supports strengths in five key areas, which we refer to as our pillars:
• | Superior Analytics, including our extensive investments in data and behavioral science and our use of sophisticated predictive modeling techniques; |
• | Operational Scale and Cost Leadership, driven by our specialized call centers, efficient international operations, and effective internal and external litigation operations; |
• | Strong Capital Stewardship, underpinned by our disciplined ability to raise and deploy capital prudently; |
• | Consumer-centric Commitment to Ethics and Principled Intent: we strive to conduct business ethically and in ways that support consumers’ financial recovery. We commit to treat consumers with respect, compassion and integrity, and we demonstrate that commitment by continuous investment in compliance programs that enable us to efficiently adjust our business practices to a changing regulatory environment; and |
• | Extendable Business Model, driven by our scalable platform that supports strategic investment opportunities in new asset classes and geographic areas. |
Although we have enabled millions of consumers to retire a portion of their outstanding debt, one of the debt collection industry’s most formidable challenges is that many financially distressed consumers will never make a payment, much less retire their total debt obligation. To address these challenges, we evaluate portfolios of receivables that are available for purchase using robust, account-level valuation methods, and we employ proprietary statistical and behavioral models across all our operations. We believe these business practices contribute to our ability to value portfolios accurately, avoid buying portfolios that are incompatible with our methods or goals, and align the accounts we purchase with our operational channels to maximize future collections. We also have one of the industry’s largest databases of financially distressed consumers. We believe that our specialized knowledge, along with our investments in data and analytic tools, have enabled us to realize significant returns from the receivables we have acquired. We maintain strong relationships with many of the largest credit providers in the United States. In addition, through our international subsidiaries, we maintain strong relationships with many of the largest credit providers in the international markets we serve.
Seasonality
United States
While seasonality does not have a material impact on our business, collections are generally strongest in our first calendar quarter, slower in the second and third calendar quarters, and slowest in the fourth calendar quarter. Relatively higher collections in the first quarter could result in a lower cost-to-collect ratio compared to the other quarters, as our fixed costs are relatively constant and applied against a larger collection base. The seasonal impact on our business may also be influenced by our purchasing levels, the types of portfolios we purchase, and our operating strategies.
Collection seasonality can also affect revenue as a percentage of collections, also referred to as our revenue recognition rate. Generally, revenue for each pool group declines steadily over time, whereas collections can fluctuate from quarter to quarter based on seasonality, as described above. In quarters with lower collections (e.g., the fourth calendar quarter), the revenue recognition rate can be higher than in quarters with higher collections (e.g., the first calendar quarter).
In addition, seasonality could have an impact on the relative level of quarterly earnings. In quarters with stronger collections, total costs are higher as a result of the additional efforts required to generate those collections. Since revenue for each pool group declines steadily over time, in quarters with higher collections and higher costs (e.g., the first calendar quarter), all else being equal, earnings could be lower than in quarters with lower collections and lower costs (e.g., the fourth calendar quarter). Additionally, in quarters where a greater percentage of collections come from our legal and agency outsourcing channels, cost to collect will be higher than if there were more collections from our internal collection sites.
International
While seasonality does not have a material impact on European operations, collections are generally strongest in the second and third calendar quarters and slower in the first and fourth quarters, largely driven by the impact of the December
2
holiday season and the New Year holiday, and the related impact on customers’ ability to repay their balances. This drives a higher level of plan defaults over this period, which are typically repaired across the first quarter of the following year. The August vacation season in the United Kingdom also has an unfavorable effect on the level of collections, but this is traditionally compensated for by higher collections in July and September.
Operating Segments
Financial information regarding our operating segments and geographic operations is set forth in Note 15, “Segment Information” to our consolidated financial statements.
Company Information
We were incorporated in Delaware in 1999. Our headquarters is located at 3111 Camino Del Rio North, Suite 103, San Diego, California 92108 and our telephone number is (877) 445-4581. Investors wishing to obtain more information about us may access the Investors section of our Internet site at http://www.encorecapital.com. The site provides access, free of charge, to relevant investor related information, such as Securities and Exchange Commission (“SEC”) filings, press releases, featured articles, an event calendar, and frequently asked questions. SEC filings are available on our Internet site as soon as reasonably practicable after being filed with, or furnished to, the SEC. Also available on our website are our Standards of Business Conduct and charters for the committees of our board of directors. We intend to disclose any amendment to, or waiver of, a provision of our Standards of Business Conduct on our website. The content of our Internet site is not incorporated by reference into this Annual Report on Form 10-K. Any materials that we filed with the SEC may also be read and copied at the SEC’s Public Reference Room at 100 F Street, N.E., Washington, D.C. 20549. The public may obtain information on the operation of the Public Reference Room by calling the SEC at 1-800-SEC-0330. The SEC maintains an Internet site that contains reports, proxy and information statements, and other information regarding issuers that file electronically with the SEC (http://www.sec.gov).
Our Competitive Advantages
Analytic Strength. We believe that success in our business depends on our ability to establish and maintain an information advantage. Leveraging an industry-leading financially distressed consumer database, our in-house team of statisticians, business analysts, and software programmers have developed, and continually enhance, proprietary behavioral and valuation models, custom software applications, and other business tools that guide our portfolio purchases. Moreover, our collection channels are informed by powerful statistical models specific to each collection activity, and each year we deploy significant capital to purchase credit bureau and customized consumer data that describe demographic, account level, and macroeconomic factors related to credit, savings, and payment behavior. Our international expansion has enabled us to collaborate across our operating subsidiaries to employ and enhance our statistical models throughout the markets we service.
Consumer Intelligence. At the core of our analytic approach is a focus on characterizing our consumers’ willingness and ability to repay their financial obligations. In this effort, we apply tools and methods from statistics, psychology, economics, and management science across the full extent of our business. During portfolio valuation, we use an internally developed and proprietary family of statistical models that determines the likelihood and expected amount of payment for each consumer within a portfolio. Subsequently, the expectations for each account are aggregated to arrive at a portfolio-level liquidation solution and a valuation for the entire portfolio is determined. During the collection process, we apply a number of proprietary operational frameworks to match our collection approach to an individual consumer’s payment behavior.
Cost Leadership. Cost efficiency is central to our collection and purchasing strategies. We experience considerable cost advantages, stemming from our operations in India and Costa Rica, our enterprise-wide, activity-level cost database, and the development and implementation of operational models that enhance profitability. We believe that we are the only company in our industry with a successful, late-stage collection platform in India. This cost-saving, first-mover advantage helps to reduce our call center variable cost-to-collect.
Principled Intent. Across the full extent of our operations, we strive to treat consumers with respect, compassion, and integrity. From discounts and payment plans to hardship solutions, we work with our consumers as they attempt to return to financial health. We are committed to dialogue that is honorable and constructive, and hope to play an important and positive role in our consumers’ financial recovery. We believe that our interests, and those of the financial institutions from which we purchase portfolios, are closely aligned with the interests of government agencies seeking to protect consumer rights. In 2011, we unveiled the industry’s first and only Consumer Bill of Rights, which codifies our commitment to respectful consumer treatment. We expect to continue investing in infrastructure and processes that support consumer advocacy and financial literacy while promoting an appropriate balance between corporate and consumer responsibility.
3
Our Strategy
We have implemented a business strategy that emphasizes the following three elements:
Continue to Invest in our Core Businesses. Our core domestic portfolio purchasing and recovery business remains critical to our success. Supply and demand dynamics within the United States have fluctuated over time and will likely continue to do so. To position ourselves to continue to generate strong risk-adjusted returns in this environment, we continue to make investments in analytics, technology, risk management, compliance, and initiatives to enhance our relationships with consumers and improve liquidation rates on our portfolios. We intend to continue to deploy a meaningful amount of capital in our core domestic markets.
Expand into New Geographies. We believe we are well-positioned to take a leading role, worldwide, in the distressed debt and subprime consumer financial sectors. Our current footprint includes our industry-leading U.S. and U.K. core debt recovery businesses, our presence in Spain, our entrance into the Latin American and Australasian debt markets, and our international operations through our India and Costa Rica locations. We continue to evaluate other opportunities in new geographic markets. For example, one of our subsidiaries has a joint venture that has recently obtained a license to operate as an asset reconstruction company in India and, as a result, we expect to commence portfolio purchasing and recovery operations in India. As portfolio prices fluctuate and the complexity of our industry continues to increase, we expect that our international operations will continue to provide a significant competitive advantage.
Explore Business Model Adjacencies and Expansion. We are working to leverage some of our core competencies, such as our knowledge of financially distressed consumers, in other areas or for different types of defaulted consumer receivables or to provide other services to financial institutions. We believe that our existing underwriting and collection processes can be extended to a variety of consumer receivables. These capabilities have allowed us to develop and provide complementary products or services to specified financially distressed consumer segments and other complementary programs.
Acquisition of Portfolio Purchasing and Recovery Receivables
We provide sellers of delinquent receivables liquidity and immediate value through the purchase of charged-off consumer receivables. We believe that we are an appealing partner for these sellers given our financial strength, focus on principled intent, and track record of financial success.
United States
Identify purchase opportunities. We maintain relationships with some of the largest credit originators and portfolio resellers of charged-off consumer receivables in the United States. We identify purchase opportunities and secure, where possible, exclusive negotiation rights. We believe that we are a valued partner for credit originators and portfolio resellers from whom we purchase portfolios, and our ability to secure exclusive negotiation rights is typically a result of our strong relationships and our purchasing scale. Receivable portfolios are sold either through a general auction, where the seller requests bids from market participants, or through an exclusive negotiation, where the seller and buyer negotiate a sale privately. The sale transaction can be either for a one-time spot purchase or for a “forward flow” contract. A “forward flow” contract is a commitment to purchase receivables over a duration that is typically three to twelve months with specifically defined volume, frequency, and pricing. Typically, these forward flow contracts have provisions that allow for early termination or price re-negotiation should the underlying quality of the portfolio deteriorate over time or if any particular month’s delivery is materially different than the original portfolio used to price the forward flow contract. We generally attempt to secure forward flow contracts for receivables because a consistent volume of receivables over a set duration can allow us more precision in forecasting and planning our operational needs.
Evaluate purchase opportunities using account-level analytics. Once a portfolio of interest is identified, we obtain detailed information regarding the portfolio’s accounts, including certain information regarding the consumers themselves. We then purchase additional information for the consumers whose accounts we are contemplating purchasing, including credit, savings, or payment behavior. Our Decision Science team, responsible for asset valuation, statistical analysis, and forecasting, then analyzes this information to determine the expected value of each potential new consumer. Our collection expectations are based on these demographic data, account characteristics, and economic variables, which we use to predict a consumer’s willingness and ability to repay his or her debt. The expected value of collections for each account is aggregated to calculate an overall value for the portfolio. Additional adjustments are made to account for qualitative factors that may affect the payment behavior of our consumers (such as prior collection activities, or the underwriting approach of the seller), and servicing related adjustments to ensure our valuations are aligned with our operations.
Formal approval process. Once we have determined the value of the portfolio and have completed our qualitative diligence, we present the purchase opportunity to our investment committee, which either sets the maximum purchase price for the portfolio based on a corporate Internal Rate of Return (“IRR”) or other strategic objectives or declines to bid. Members of the investment committee include our Chief Executive Officer, Chief Financial Officer, other members of our senior management team, and experts, as needed.
4
We believe long-term success is best achieved by combining a diverse asset sourcing approach with an account-level scoring methodology and a disciplined evaluation process.
International
Through Cabot, we maintain strong relationships with many of the largest financial service providers in the United Kingdom. Cabot primarily acquires receivable portfolios through a competitive bidding process that is initiated by the portfolio seller. Portfolios are also acquired through forward flow agreements on occasion. In addition, Cabot purchases a small number of portfolios by entering into forward flow agreements, although it has substantially moved away from these arrangements.
When Cabot identifies a portfolio of interest, it evaluates account-level information and performs due diligence to evaluate certain features of the portfolio. Cabot next applies its proprietary, highly automated portfolio pricing models to further evaluate the portfolio, using separate models depending on the type of account: a paying model for semi-performing accounts and a regression model for non-performing accounts. Using its substantial database of account holder information, Cabot carries out additional statistical analysis that is customized to evaluate specific repayment characteristics to further evaluate the accounts. The results of due diligence and the outputs of the pricing models and data analysis is presented to Cabot’s pricing committee, which then decides whether to make an indicative bid for the portfolio. If, following the indicative bid, Cabot is short-listed by the vendor, it then conducts further due diligence on the portfolio and refines its analysis. Following this additional due diligence, the pricing committee decides whether to submit a final binding offer for the portfolio.
All purchases require approval by the pricing committee. Cabot’s pricing committee includes its Chief Executive Officer, Chief Financial Officer and other relevant officers. We believe that Cabot’s significant industry and management experience enable it to make informed decisions about the portfolios we acquire through Cabot.
Portfolio Purchasing and Recovery Collection Approach
United States
We expand and build upon the insight developed during our purchase process when developing our account collection strategies for portfolios we have acquired. Our proprietary consumer-level collectability analysis is the primary determinant of whether an account is actively serviced post-purchase. Generally, we pursue collection activities on only a fraction of the accounts we purchase, through one or more of our collection channels. The channel identification process is analogous to a decision tree where we first differentiate those consumers who we believe are unable to pay from those who we believe are able to pay. Consumers who we believe are financially incapable of making any payments, or are facing extenuating circumstances or hardships that would prevent them from making payments, are excluded from our collection process. It is our practice to assess each consumer’s willingness to pay through analytics, phone calls and/or letters. Despite our efforts to reach consumers and work out a settlement plan, only a small number of consumers who we contact choose to engage with us. Those who do are often offered discounts on their obligations or are presented with payment plans that are intended to suit their needs. However, the majority of consumers we contact do not respond to our calls or our letters and we must then make the decision about whether to pursue collections through legal action. Throughout our ownership period, we periodically refine our collection approach to determine the most effective collection strategy to pursue for each account. These strategies consist of:
• | Inactive. We strive to use our financial resources judiciously and efficiently by not deploying resources on accounts where the prospects of collection are remote based on a consumer’s situation. |
• | Direct Mail. We develop innovative, low-cost mail campaigns offering consumers appropriate discounts to encourage settlement of their accounts. |
• | Call Centers. We maintain domestic collection call centers in Phoenix, Arizona, St. Cloud, Minnesota, Troy, Michigan, and Roanoke, Virginia and international call centers in Gurgaon, India and San Jose, Costa Rica. Call centers generally consist of multiple collection departments. Account managers supervised by group managers are trained and divided into specialty teams. Account managers assess our consumers’ willingness and capacity to pay. They attempt to work with consumers to evaluate sources and means of repayment to achieve a full or negotiated lump sum settlement or develop payment programs customized to the individual’s ability to pay. In cases where a payment plan is developed, account managers encourage consumers to pay through automatic payment arrangements. We continuously educate account managers to understand and apply applicable laws and policies that are relevant in the account manager’s daily collection activities. Our ongoing training and monitoring efforts help ensure compliance with applicable laws and policies by account managers. |
• | Skip Tracing. If a consumer’s phone number proves inaccurate when an account manager calls an account, or if current contact information for a consumer is not available at the time of account purchase, then the account could be routed to our skip tracing process. We currently use a number of different skip tracing companies to provide accurate phone numbers and addresses. |
5
• | Legal Action. We generally refer accounts for legal action where the consumer has not responded to our direct mail efforts or our calls and it appears the consumer is able, but unwilling, to pay his or her obligations. When we decide to pursue legal action, we place the account into our internal legal channel or refer them to our network of retained law firms. If placed to our internal legal channel, attorneys in that channel will evaluate the accounts and make the final determination whether to pursue legal action. If referred to our network of retained law firms, we rely on our law firms’ expertise with respect to applicable debt collection laws to evaluate the accounts placed in that channel in order to make the decision about whether or not to pursue collection litigation. Prior to engaging an external law firm, we evaluate the firm’s compliance with consumer credit laws and regulations, operations, financial condition, and experience, among other key criteria. The law firms we hire may also attempt to communicate with the consumers in an attempt to collect their debts prior to initiating litigation. We pay these law firms a contingent fee based on amounts they collect on our behalf. |
• | Third-Party Collection Agencies. We selectively employ a strategy that uses collection agencies. Collection agencies receive a contingent fee for each dollar collected. Generally, we use these agencies on accounts when we believe they can liquidate better or less expensively than we can or to supplement capacity in our internal call centers. We also use agencies to initially provide us a way to scale quickly when large purchases are made and as a challenge to our internal call center collection teams. Prior to engaging a collection agency, we evaluate, among other things, those aspects of the agency’s business that we believe are relevant to its performance and compliance with consumer credit laws and regulations. |
• | Online. We offer an online payment portal that enhances consumer convenience by providing consumers the ability to make payments and submit inquiries online. |
• | Sale. We do not resell accounts to third parties in the ordinary course of our business. |
International
Cabot uses insights developed during its purchasing process to build account collection strategies. Cabot’s proprietary consumer-level collectability analysis is the primary determinant of how an account will be serviced post-purchase. Cabot continuously refines this analysis to determine the most effective collection strategy to pursue for each account it owns. In recent years, Cabot has concentrated on buying high-balance financial services debt, both paying and non-paying. Cabot will attempt to establish contact with these consumers in order to transfer payment arrangements and gauge the willingness of these consumers to pay. Consumers who Cabot believes are financially incapable of making any payments, those having negative disposable income, or those experiencing hardship (such as medical issues or mental incapacity), are handled outside of normal collections processes through dedicated and tailored strategies.
The remaining pool of accounts then receives further evaluation through the combined use of Cabot’s and Marlin’s data analytics. At that point, Cabot analyzes and determines a consumer’s perceived willingness to pay. Based on that analysis, Cabot pursues collections through letters and/or phone calls to its consumers. Where contact is made and consumers indicate a willingness to pay, a patient approach of forbearance is applied using regulatory protocols within the United Kingdom to assess affordability and ensure that repayment plans are fair and balanced and therefore sustainable. Where the customer is unwilling to pay, Cabot refers the account to the appropriate escalation point in the collection process, which may include its internal debt collection agency, a third-party collection agency or legal action. Cabot also has robust internal legal collection capabilities, allowing the organization to address consumers across the entire willingness to pay spectrum.
Legal, Compliance and Enterprise Risk Management, Oversight
United States
Our legal and compliance oversight functions are divided between our legal, compliance and enterprise risk management departments. Our legal department manages regulatory oversight, litigation, corporate transactions, and compliance with our internal ethics policy, while our compliance department tests and monitors adherence to State and Federal regulations and enterprise risk management manages risk and internal audit.
The legal department is responsible for interpreting and administering our Standards of Business Conduct (the “Standards”), which apply to all of our directors, officers, and employees and outlines our commitment to a culture of professionalism and ethical behavior. The Standards promote honest and ethical conduct, including the ethical handling of actual or apparent conflicts of interest between personal and professional relationships, compliance with applicable laws, rules and regulations, and full and fair disclosure in reports that we file with, or submit to, the SEC and in other public communications made by us. As described in the Standards, we have also established a toll-free Compliance Hotline to allow directors, officers, and employees to report any detected or suspected fraud, misappropriations, or other fiscal irregularities, any good faith concern about our accounting and/or auditing practices, or any other violations of the Standards.
6
The compliance department is responsible for promoting compliance with applicable laws and regulations. The compliance department facilitates oversight by our Board of Directors and management, assists in formulating policies and procedures, and engages in training, risk assessments, testing, monitoring and corrective action, complaint response, and compliance audits.
We continually monitor applicable changes to laws governing statutes of limitations and disclosures to consumers. We maintain policies, system controls, and processes designed to ensure that accounts past the applicable statute of limitations do not get placed into legal collections. Additionally, in written and verbal communications with consumers, we provide disclosures to the consumer that the account is past its applicable statute of limitations and, therefore, we will not pursue collections through legal means.
Credit originators who sell us defaulted consumer receivables routinely conduct examinations of our collection practices and procedures and typically make reports with recommendations to us as to how they believe we can improve those practices and procedures. We respond to these reports in the ordinary course and make changes to our practices and procedures that we believe are appropriate to address any issues raised in such reports.
The enterprise risk management department facilitates oversight by our Board of Directors and management and is responsible for the development and administration of internal policies, procedures, periodic risk assessments and controls and for performing internal audits to evaluate the level of compliance to both regulations, such as Sarbanes-Oxley 404, and standards of internal control for internal operations.
Beyond written policies, one of our core internal goals is the adherence to principled intent as it pertains to all consumer interactions. We believe that it is in our shareholders’ and our employees’ best interest to treat all consumers with the highest standards of integrity. Specifically, we have strict policies and a code of ethics, which guide all dealings with our consumers. To reinforce existing written policies, we have established a number of quality assurance procedures. Through our Quality Assurance program, our Fair Debt Collection Practices Act training for new account managers, our Fair Debt Collection Practices Act recertification program for continuing account managers, and our Consumer Support Services department, we take significant steps to ensure compliance with applicable laws and regulations and seek to promote consumer satisfaction. Our Quality Assurance team aims to enhance the skills of account managers and to drive compliance initiatives through active call monitoring, account manager coaching and mentoring, and the tracking and distribution of company-wide best practices. Finally, our Consumer Support Services department works directly with consumers to seek to resolve incoming consumer inquiries and to respond to consumer disputes as they may arise.
International
Cabot has established a compliance framework, operational procedures, and governance structures to enable it to conduct business in accordance with applicable rules, regulations, and guidelines. Cabot’s employees undergo comprehensive training on legal and regulatory compliance, and Cabot engages in regular call monitoring checks, data checks, performance reviews, and other operational reviews to ensure compliance with company guidelines. The laws and regulations under which Cabot operates have at their core the fair treatment of consumers, which is embedded within Cabot’s processes and culture.
Information Technology
Technical Infrastructure. Our internal network has been configured to be redundant in all critical functions, at all sites. This redundancy has been implemented within the local area network switches and the data center network and includes fully redundant Multiprotocol Label Switching (MPLS) networks. We have the capability to handle high transaction volume in our server network architecture with scalability to meet and exceed our future growth plans. Redundancy, coupled with seamless scalability and our high performance infrastructure, will allow for rapid business transformation and growth.
Omni-Channel Enabled Dialer Technology. Our call centers employ the use of upgraded dialer technology that expands our ability to service the consumer in their preferred channel of communication. This technology allows additional call volume capacity and greater efficiency through shorter wait times and an increase in the number of live contacts. This technology helps maximize account manager productivity and further optimizes the yield on our portfolio purchases. Additionally, the use of predictive dialing technology helps us comply with applicable federal and state laws in the United States that restrict the time, place, and manner in which debt collectors can call consumers. Recognizing mobile phone dialing has a different set of legal restrictions, we utilize a distinctly different platform for non-consented mobile phones in order to comply with all laws while providing a framework for us to maximize contact with our consumers.
Computer Hardware. We have made significant improvements in our data centers, and now have redundancy in support of continued growth. We use a robust computer platform to perform our daily operations, including the collection efforts of our global workforce. Our custom software applications are integrated within our database server environment allowing us to process transaction loads with speed and efficiency. The computer platform offers us reliability and expansion opportunities. Furthermore, this hardware incorporates state of the art data security protection. We back up our data utilizing a tapeless configuration, and copies are replicated to a secure secondary data center. We also mirror our production data to a remote
7
location to give us full protection in the event of the loss of our primary data center. To ensure the integrity and reliability of our computer platform, we periodically engage outside auditors specializing in information technology and cybersecurity to examine both our operating systems and disaster recovery plans.
Process Control. To provide assurance that our entire infrastructure continues to operate efficiently and securely, we have developed a strong process and control environment. These governance, risk management, and control protocols govern all areas of the enterprise: from physical security and cybersecurity, to change management, data protection, and segregation of duties.
Cybersecurity. We divide our cybersecurity and information security functions into the four core tenants that we believe make up a solid information security practice: (1) security strategy and architecture; (2) operational security; (3) vulnerability and threat management; and (4) IT governance, risk and controls. We invest in cybersecurity and advanced technologies, including next generation threat prevention and threat intelligence solutions, to protect our organization and consumer and proprietary data throughout its life cycle. We believe that our adoption and implementation of leading security frameworks for the financial services industry and the regulatory environments and geographies in which we operate demonstrates our commitment to cybersecurity and information security.
Competition
United States
The consumer credit recovery industry is highly competitive. We compete with a wide range of collection and financial services companies. We also compete with traditional contingency collection agencies and in-house recovery departments. Competitive pressures affect the availability and pricing of receivable portfolios, as well as the availability and cost of qualified recovery personnel. In addition, some of our competitors may have signed forward flow contracts under which credit originators or portfolio resellers have agreed to transfer charged-off receivables to them in the future, which could restrict those credit originators or portfolio resellers from selling receivables to us. We believe some of our major competitors, which include companies that focus primarily on the purchase of charged-off receivable portfolios, have continued to diversify into third-party agency collections and into offering credit card and other financial services as part of their recovery strategy.
When purchasing receivables, we compete primarily on the basis of the price paid for receivable portfolios, the ease of negotiating and closing the prospective portfolio purchases with us, our ability to obtain funding, and our reputation with respect to the quality of services that we provide. We believe that our ability to compete effectively in this market is also dependent upon, among other things, our relationships with credit originators and portfolio resellers of charged-off consumer receivables, and our ability to provide quality collection strategies in compliance with applicable laws.
We believe that smaller competitors are facing difficulties in the portfolio purchasing market because of the higher cost to operate due to increased regulatory pressure and because sellers of charged-off consumer receivables are being more selective with buyers in the marketplace, resulting in consolidation within the portfolio purchasing and recovery industry. We believe this favors larger participants in this market, such as us, because the larger market participants are better able to adapt to these pressures. As smaller competitors limit their participation in or exit the market, it may provide additional opportunities for us to purchase receivables from competitors or to acquire competitors directly.
International
When purchasing receivables in the United Kingdom market, Cabot competes on the basis of the price paid for receivable portfolios, the ease of negotiating and closing the prospective portfolio purchases with Cabot, its ability to obtain funding, and its reputation with respect to the quality of services it provides. We believe that Cabot’s ability to compete effectively in this market is also dependent upon, among other things, Cabot’s relationships with credit originators and financial services companies, its ability to segment portfolios effectively, its high level of compliance governance controls, and its ability to provide quality collection strategies in compliance with applicable laws.
Similar to certain trends we are observing in the United States, we believe that smaller competitors in the United Kingdom are facing difficulties in the portfolio purchasing market because of the higher cost to operate due to the increased regulatory environment and scrutiny applied by regulators, and also because sellers of charged-off consumer receivables are being more selective with buyers in the marketplace, resulting in consolidation within the portfolio purchasing and recovery industry and the exit of portfolio purchasing and recovery companies from the marketplace. As in the United States, we believe this favors larger participants in the market, such as Cabot, because the larger market participants are better able to adapt to these pressures. As smaller competitors limit their participation in or exit the market, it may provide additional opportunities for us to purchase receivables from competitors or to acquire competitors directly.
8
Government Regulation
United States
Our debt purchasing and collection activities are subject to federal, state, and municipal statutes, rules, regulations, and ordinances that establish specific guidelines and procedures that debt purchasers and collectors must follow when collecting consumer accounts. It is our policy to comply with the provisions of all applicable laws in all of our recovery activities. Our failure to comply with these laws could have a material adverse effect on us to the extent that they limit our recovery activities or subject us to fines or penalties in connection with such activities.
The federal Fair Debt Collection Practices Act (“FDCPA”) and comparable state and local laws establish specific guidelines and procedures that debt collectors must follow when communicating with consumers, including the time, place and manner of the communications, and prohibit unfair, deceptive, or abusive debt collection practices. Until 2011, the Federal Trade Commission (“FTC”) administered, and had primary responsibility for the enforcement of, the FDCPA. In July 2011, pursuant to the Dodd-Frank Wall Street Reform and Consumer Financial Protection Act of 2010 (the “Dodd-Frank Act”), Congress transferred the FTC’s role of administering the FDCPA to the Consumer Financial Protection Bureau (“CFPB”), along with certain other federal statutes, and gave the CFPB authority to implement regulations under the FDCPA. The FTC and the CFPB share enforcement responsibilities under the FDCPA.
In addition to the FDCPA, the federal laws that apply to our business (including the regulations that implement these laws) include the following:
Dodd-Frank Act, including the Consumer Financial Protection Act (Title X of the Dodd-Frank Act, “CFPA”) | Servicemembers’ Civil Relief Act | |
Electronic Fund Transfer Act | Telephone Consumer Protection Act (“TCPA”) | |
Equal Credit Opportunity Act | Truth In Lending Act | |
Fair Credit Billing Act | U.S. Bankruptcy Code | |
Fair Credit Reporting Act (“FCRA”) | Wire Act | |
Federal Trade Commission Act (“FTCA”) | Credit CARD Act | |
Gramm-Leach-Bliley Act | Foreign Corrupt Practices Act | |
Health Insurance Portability and Accountability Act | ||
The Dodd-Frank Act was adopted to reform and strengthen regulation and supervision of the U.S. financial services industry. It contains comprehensive provisions governing the oversight of financial institutions, some of which apply to us. Among other things, the Dodd-Frank Act established the CFPB, which has broad authority to implement and enforce “federal consumer financial law,” as well as authority to examine financial institutions, including credit issuers that may be sellers of receivables and debt buyers and collectors such as us, for compliance with federal consumer financial law. The CFPB has authority to prevent unfair, deceptive, or abusive acts or practices by issuing regulations or by using its enforcement authority without first issuing regulations. The Dodd-Frank Act also authorizes state officials to enforce regulations issued by the CFPB and to enforce the CFPA general prohibition against unfair, deceptive, and abusive acts or practices.
The CFPB’s authorities include the ability to issue regulations under all significant federal statutes that affect the collection industry, including the FDCPA, FCRA, and others. In July 2016, the CFPB released an outline of proposals under consideration for its debt collection rulemaking. The proposals are aimed at ensuring debt collectors, among other things: collect the correct debt; limit excessive or disruptive communications; stop collecting or suing for debt without proper documentation; and provide documentation substantiating debt to a consumer upon demand. In addition to consulting with business representatives, the CFPB will continue to seek input from the public, consumer groups, industry, and other stakeholders before continuing the rulemaking process. Shortly after his inauguration, President Trump issued an order halting all federal regulatory rulemakings, which may include the CFPB’s debt collection rulemaking.
The Dodd-Frank Act also gave the CFPB supervisory and examination authority over a variety of institutions that may engage in debt collection, including us. Accordingly, the CFPB is authorized to supervise and conduct examinations of our business practices. The prospect of supervision has increased the potential consequences of noncompliance with federal consumer financial law.
The CFPB can conduct hearings, adjudication proceedings, and investigations, either unilaterally or jointly with other state and federal regulators, to determine if federal consumer financial law has been violated. The CFPB has authority to impose monetary penalties for violations of applicable federal consumer financial laws (including the CFPA, FDCPA, and FCRA, among other consumer protection statutes), require remediation of practices, and pursue enforcement actions. The CFPB also has authority to obtain cease and desist orders (which can include orders for restitution or rescission of contracts, as well as other kinds of affirmative relief), costs, and monetary penalties ranging from $5,000 per day for ordinary violations of federal consumer financial laws to $25,000 per day for reckless violations and $1 million per day for knowing violations. In
9
addition, where a company has violated Title X of the Dodd-Frank Act or CFPB regulations implemented under Title X of the Dodd-Frank Act, the Dodd-Frank Act empowers state Attorneys General and state regulators to bring civil actions to remedy violations of state law. The CFPB has been active in its supervision, examination and enforcement of financial services companies, including bringing enforcement actions, imposing fines and mandating large refunds to customers of several financial institutions for practices relating to debt collection practices.
On September 9, 2015, we entered into a consent order (the “Consent Order”) with the CFPB in which we settled allegations arising from our practices between 2011 and 2015. The Consent Order includes obligations on us to, among other things: (1) follow certain specified operational requirements, substantially all of which are already part of our current operations; (2) submit to the CFPB for review a comprehensive plan designed to ensure that its debt collection practices comply with all applicable federal consumer financial laws and the terms of the Consent Order; (3) pay redress to certain specified groups of consumers; and (4) pay a civil monetary penalty. We will continue to cooperate and engage with the CFPB and work to ensure compliance with the Consent Order. In addition, we are subject to ancillary state attorney general investigations related to similar debt collection practices.
In addition, the CFPB has issued guidance in the form of bulletins on debt collection and credit furnishing activities generally, including one that specifically addresses representations regarding credit reports and credit scores during the debt collection process, another that focuses on the application of the CFPA’s prohibition of “unfair, deceptive, or abusive” acts or practices on debt collection and another that discusses the risks that in-person collection of consumer debt may create in violating the FDPCA and CFPA. The CFPB also accepts debt collection consumer complaints and released template letters for consumers to use when corresponding with debt collectors. The CFPB makes publicly available its data on consumer complaints. The Dodd-Frank Act also mandates the submission of multiple studies and reports to Congress by the CFPB, and CFPB staff regularly make speeches on topics related to credit and debt. All of these activities could trigger additional legislative or regulatory action. In addition, the CFPB has recently engaged in enforcement activity in sectors adjacent to our industry, impacting credit originators, collection firms, and payment processors, among others. The CFPB’s enforcement activity in these spaces, especially in the absence of clear rules or regulatory expectations, can be disruptive to third parties as they attempt to define appropriate business practices. As a result, certain commercial relationships we maintain may be disrupted or impacted by changes in third-parties’ business practices or perceptions of elevated risk relating to the debt collection industry.
Our activities are also subject to federal and state laws concerning identity theft, privacy, data security, the use of automated dialing equipment, and other laws related to consumers and consumer protection. In response to petitions filed by third parties, in July 2015, the Federal Communications Commission (“FCC”) released a declaratory ruling interpreting the TCPA, which could impact the way consumers may be contacted on their cellular phones and could impact our operations and financial results.
In addition to the federal statutes detailed above, many states have general consumer protection statutes, laws, regulations, or court rules that apply to debt purchasing and collection. In a number of states and cities, we must maintain licenses to perform debt recovery services and must satisfy related bonding requirements. It is our policy to comply with all material licensing and bonding requirements. Our failure to comply with existing licensing requirements, changing interpretations of existing requirements, or adoption of new licensing requirements, could restrict our ability to collect in regions, subject us to increased regulation, increase our costs, or adversely affect our ability to collect our receivables.
State laws, among other things, also may limit the interest rate and the fees that a credit originator may impose on our consumers, limit the time in which we may file legal actions to enforce consumer accounts, and require specific account information for certain collection activities. By way of example, the California Fair Debt Buying Practices Act that directly applies to debt buyers, applies to accounts sold after January 1, 2014. The law requires debt buyers operating in the state to have in their possession specific account information before debt collection efforts can begin, among other requirements. Moreover, the New York State Department of Financial Services issued new debt collection regulations, which took effect in September 2015 and established new requirements for collecting debt in the state. In addition, other state and local requirements and court rulings in various jurisdictions may also affect our ability to collect.
The relationship between consumers and credit card issuers is also extensively regulated by federal and state consumer protection and related laws and regulations. These laws may affect some of our operations because the majority of our receivables originate through credit card transactions. The laws and regulations applicable to credit card issuers, among other things, impose disclosure requirements when a credit card account is advertised, when it is applied for and when it is opened, at the end of monthly billing cycles, and at year-end. Federal law requires, among other things, that credit card issuers disclose to consumers the interest rates, fees, grace periods, and balance calculation methods associated with their credit card accounts. Some laws prohibit discriminatory practices in connection with the extension of credit. If the originating institution fails to comply with applicable statutes, rules, and regulations, it could create claims and rights for consumers that would reduce or eliminate their obligations related to those receivables. When we acquire receivables, we generally require the credit originator
10
or portfolio reseller to represent that they have complied with applicable statutes, rules, and regulations relating to the origination and collection of the receivables before they were sold to us.
Federal statutes further provide that, in some cases, consumers cannot be held liable for, or their liability is limited with respect to, charges to their credit card accounts that resulted from unauthorized use of their credit cards. These laws, among others, may give consumers a legal cause of action against us, or may limit our ability to recover amounts owing with respect to the receivables, whether or not we committed any wrongful act or omission in connection with the account.
These laws and regulations, and others similar to the ones listed above, as well as laws applicable to specific types of debt, impose requirements or restrictions on collection methods or our ability to enforce and recover certain of our receivables. Effects of the law, including those described above, and any new or changed laws, rules, or regulations, and reinterpretation of the same, may adversely affect our ability to recover amounts owing with respect to our receivables or the sale of receivables by creditors and resellers.
International
As we expand our international footprint, our operations are increasingly affected by foreign statutes, rules and regulations. It is our policy to comply with these laws in all of our recovery activities. For example, debt collection and debt purchase activities in the United Kingdom are highly regulated by a number of different governmental bodies.
The regulatory environment is currently undergoing substantial changes. The most significant changes include the transfer of responsibility for the regulation of consumer credit businesses in the United Kingdom from the Office of Fair Trading (“OFT”) to the Financial Conduct Authority (“FCA”) which occurred on April 1, 2014; the proposal to have a dedicated pre-action protocol before commencing debt recovery claims in court; and the proposal by the European Commission that substantial changes be made to the European Union (“E.U.”) data protection regime.
The FCA implemented an interim permission regime whereby businesses that held a consumer credit license were required to register with the FCA for interim permission before March 31, 2014 in order to continue consumer credit activities after April 1, 2014. Cabot applied for full authorization of its business with the FCA in March 2015 and Cabot Credit Management Group Limited (“CCMG”), a Cabot subsidiary, became authorized and regulated by the FCA in March 2016. CCMG appointed other Cabot subsidiaries to carry out debt-collecting and debt administration services on its behalf. CCMG assumes full regulatory responsibility for such entities. Cabot is now subject to the FCA supervisory regime and thematic reviews and supervisory visits. The FCA has power to impose significant fines or requirements on Cabot if it fails to comply with the FCA regime. In addition to the full authorization of its business with the FCA, CCMG has appointed certain individuals who have significant control or influence over the management of the business, known as “Approved Persons,” and are jointly and severally liable for the acts and omissions of CCMG and its business affairs. Approved Persons are subject to statements of principle and codes of practice established and enforced by the FCA.
The FCA has adopted detailed rules relating to conducting consumer credit activities, in addition to putting in place high level principles and conditions to which it expects businesses and Approved Persons in the sector to adhere. The FCA has significantly greater powers than the OFT, including, but not limited to, the ability to impose significant fines, ban certain individuals from carrying on trade within the financial services industry, impose requirements on a firm’s permission, cease certain products from being collected upon and in extreme circumstances remove permissions to trade.
Furthermore, the manner in which court claims are conducted in England and Wales in connection with the recovery of debt may be subject to significant changes. In September 2014, the Civil Procedure Rules Committee (“CPRC”), an advisory public body set up by statute and sponsored by the U.K. Ministry of Justice, issued a consultation on proposals to introduce a designated pre-action protocol for court claims for the recovery of debt. Due to the amount of responses from the industry against the introduction of a dedicated protocol, the CPRC created a dedicated sub-committee with industry and consumer group stakeholders. As a consequence, the CPRC issued an updated consultation in September 2015 in order to seek balance between the interests of the industry and consumer groups. Cabot and its industry body, the Credit Services Association, have each responded to this consultation. On December 9, 2016, the CPRC met and decided that the initial proposal, which would have required creditors to provide significant documentation, such as the original credit agreement prior to issuing a claim in court, should be amended. A final draft of the rules has been passed for approval in the UK legislative system. The new draft will require that a letter before claim informs a consumer of their right to request documentation and for a full statement of account to be included. However, this documentation no longer has to be provided with the letter before claim. The precise detail is yet to be made public.
In addition, the regulatory regime in the United Kingdom relating to the protection of consumers from unfair terms and practices is subject to change. In October 2015, the U.K. Parliament introduced new laws that reformed most of the previous U.K. consumer laws and was largely driven by the European Commission’s Directive for Consumer Rights. The U.K. Consumer Rights Act 2015 introduced enhanced consumer measures that can be imposed on businesses and gives greater protection to U.K. consumers from unfair business practices and unfair terms in consumer agreements.
11
Additionally, the Consumer Credit Act of 1974 (and its related regulations) and the U.K. Consumer Rights Act 2015 set forth requirements for the entry into and ongoing management of consumer credit arrangements in the United Kingdom. A failure to comply with these requirements can make agreements unenforceable or can result in a requirement that charged and collected interest be repaid.
In addition to these regulations on debt collection and debt purchase activities, Cabot must comply with requirements established by the Data Protection Act of 1998 in relation to processing the personal data of its consumers. New legislation, the E.U. General Data Protection Regulation (“GDPR”), will replace the current Data Protection Act in 2018 and will introduce significant changes to the data protection regime including but not limited to: the conditions for obtaining consent to process personal data; transparency and providing information to individuals regarding the processing of their personal data; enhanced rights for individuals; notification obligations for personal data breach; and new supervisory authorities, including a European Data Protection Board (“EDPB”). We have analyzed the GDPR requirements and are working to ensure that we become compliant.
The regulatory regime in the Republic of Ireland has been subject to significant changes. In July 2015, the Irish Parliament introduced the Consumer Protection (Regulation of Credit Servicing Firms) Act 2015, which requires credit servicing firms to be regulated by the Central Bank of Ireland to ensure regulatory protection for consumers following loan book sales was published in January 2015. The Consumer Protection (Regulation of Credit Servicing Firms) Act 2015 seeks to address concerns regarding the loss of regulatory protections for borrowers when portfolio of loans are sold and/or serviced to/by an unregulated entity. Cabot is registered with and regulated by the Central Bank of Ireland for credit servicing activities and its activities are subject to detailed rules on consumer protection. Cabot is undergoing the second stage of the authorization process in which it needs to provide its controls framework on how it ensures regulatory protection for consumers for debt portfolios it has acquired and manages. Cabot is already contractually obligated to ensure compliance with the relevant consumer protection codes through its debt sale and management agreements and is audited on a regular basis against such obligations.
On June 23, 2016, the United Kingdom held a referendum in which voters approved the United Kingdom’s exit from the E.U., commonly referred to as “Brexit”. The referendum was advisory, and the terms of any withdrawal are subject to a negotiation period that could last at least two years after the U.K. government formally initiates a withdrawal process. Nevertheless, the referendum has created significant uncertainty about the future relationship between the United Kingdom and the E.U., including with respect to the laws and regulations that will apply as the United Kingdom determines which E.U. laws to replace or replicate in the event of a withdrawal. Additionally, Brexit could, among other outcomes, disrupt the free movement of goods, services and people between the United Kingdom and the E.U., undermine bilateral cooperation in key policy areas and significantly disrupt trade between the United Kingdom and the E.U. Given the lack of comparable precedent, it is unclear what financial, trade and legal implications Brexit will have and how it will affect us. The GDPR requirements discussed above will not be impacted by the Brexit.
In addition, the other markets in which we currently operate are subject to local laws and regulations, and we have implemented compliance programs to facilitate compliance with all applicable laws and regulations in those markets. Our operations outside the United States are subject to the U.S. Foreign Corrupt Practices Act, which prohibits U.S. companies and their agents and employees from providing anything of value to a foreign official for the purposes of influencing any act or decision of these individuals in order to obtain an unfair advantage, to help, obtain, or retain business.
Employees
As of December 31, 2016, we had approximately 6,700 employees worldwide. None of our employees is represented by a labor union. We believe that our relations with our employees are good.
Item 1A—Risk Factors
There are risks and uncertainties in our business that could cause our actual results to differ from those anticipated. We urge you to read these risk factors carefully in connection with evaluating our business and in connection with the forward-looking statements and other information contained in this Annual Report on Form 10-K. Any of the risks described herein could affect our business, financial condition, or future results and the actual outcome of matters as to which forward-looking statements are made. The list of risks is not intended to be exhaustive, and the order in which the risks appear is not intended as an indication of their relative weight or importance. Additional risks and uncertainties not currently known to us, or that we currently deem to be immaterial, also may adversely affect our business, financial condition and/or operating results.
12
Risks Related to Our Business and Industry
Financial and economic conditions affect the ability of consumers to pay their obligations, which could harm our financial results.
Economic conditions globally and locally directly affect unemployment, credit availability, and real estate values. Adverse conditions, economic changes, and financial disruptions place financial pressure on the consumer, which may reduce our ability to collect on our consumer receivable portfolios and may adversely affect the value of our consumer receivable portfolios. Further, increased financial pressures on the financially distressed consumer may result in additional regulatory requirements or restrictions on our operations and increased litigation filed against us. These conditions could increase our costs and harm our business, financial condition, and operating results.
Our operating results may be affected by factors that could cause them to fluctuate significantly in the future.
Our operating results will likely vary in the future due to a variety of factors that could affect our revenues and operating expenses. We expect that our operating expenses as a percentage of collections will fluctuate in the future as we expand into new markets, increase our business development efforts, hire additional personnel, and incur increased insurance and regulatory compliance costs. In addition, our operating results have fluctuated and may continue to fluctuate as a result of the factors described below and elsewhere in this Annual Report on Form 10-K:
• | the timing and ability of consumers to make payments, including the effects of seasonality and macroeconomic conditions on their ability to pay; |
• | any charge to earnings resulting from an allowance against the carrying value of our receivable portfolios; |
• | increases in operating expenses associated with the growth or change of our operations or compliance with increased regulatory and other legal requirements; |
• | the cost of credit; and |
• | the supply of receivables portfolios for sale on acceptable terms. |
Because we recognize revenue on the basis of projected collections on purchased portfolios, we may experience variations in quarterly revenue and earnings due to the timing of portfolio purchases.
We may not be able to purchase receivables at favorable prices, which could limit our growth or profitability.
Our ability to continue to operate profitably depends upon the continued availability of receivable portfolios that meet our purchasing standards and are cost-effective based upon projected collections exceeding our costs. Due, in part, to fluctuating prices for receivable portfolios and competition within the marketplace, there has been considerable variation in our purchasing volume and pricing from quarter to quarter and we expect that to continue. The volume of our portfolio purchases may be limited when prices are high, and may or may not increase when portfolio pricing is more favorable to us. Further, our rates of return may decline when portfolio prices are high. We do not know how long portfolios will be available for purchase on terms acceptable to us, or at all.
The availability of receivable portfolios at favorable prices depends on a number of factors, including:
• | defaults in consumer debt; |
• | continued origination of loans by originating institutions at sufficient volumes; |
• | continued sale of receivable portfolios by originating institutions and portfolio resellers at sufficient volumes and acceptable price levels; |
• | competition in the marketplace; |
• | our ability to develop and maintain favorable relationships with key major credit originators and portfolio resellers; |
• | our ability to obtain adequate data from credit originators or portfolio resellers to appropriately evaluate the collectability of, estimate the value of, and collect on portfolios; and |
• | changes in laws and regulations governing consumer lending, bankruptcy, and collections. |
In recent periods, portfolio prices have been elevated above historical levels, particularly for fresh portfolios, which are those portfolios transacted within six months of the consumers’ accounts being charged off by the financial institution. We
13
believe this elevated pricing was due to a reduction in the supply of charged-off accounts and continued strong demand in the marketplace. We believe that the reduction in supply is partially due to shifts in underwriting standards by financial institutions, which have resulted in lower volumes of charged-off accounts. We believe that this reduction in supply is also the result of certain financial institutions temporarily halting or curtailing their sales of charged-off accounts in response to increased regulatory pressure on financial institutions. We are unable to predict the extent to which these financial institutions will re-commence selling charged-off accounts. Financial institutions might not return to selling charged-off accounts at historical levels and certain of them could elect to stop selling charged-off accounts permanently. We are taking measures to improve liquidation rates on our purchased portfolios so that we can achieve satisfactory returns on recently purchased portfolios despite their elevated prices. However, there can be no assurance that these measures will be effective in maintaining returns in line with historical levels, or at all.
In addition, because of the length of time involved in collecting charged-off consumer receivables on acquired portfolios and the volatility in the timing of our collections, we may not be able to identify trends and make changes in our purchasing strategies in a timely manner. Ultimately, if we are unable to continually purchase and collect on a sufficient volume of receivables to generate cash collections that exceed our costs or to generate satisfactory returns, our business, financial condition and operating results will be adversely affected.
We may experience losses on portfolios consisting of new types of receivables or receivables in new geographies due to our lack of collection experience with these receivables, which could harm our business, financial condition and operating results.
We continually look for opportunities to expand the classes of assets that make up the portfolios we acquire. Therefore, we may acquire portfolios consisting of assets with which we have little or no collection experience or portfolios of receivables in new geographies where we do not historically maintain an operational footprint. Our lack of experience with these assets may hinder our ability to generate expected levels of profits from these portfolios. Further, our existing methods of collections may prove ineffective for these new receivables, and we may not be able to collect on these portfolios. Our inexperience with these receivables may have an adverse effect on our business, financial condition and operating results.
We may purchase receivable portfolios that are unprofitable or we may not be able to collect sufficient amounts to recover our costs and to fund our operations.
We acquire and service charged-off receivables that the obligors have failed to pay and the sellers have deemed uncollectible and have written off. The originating institutions and/or portfolio resellers generally make numerous attempts to recover on these nonperforming receivables, often using a combination of their in-house collection and legal departments, as well as third-party collection agencies. In order to operate profitably over the long term, we must continually purchase and collect on a sufficient volume of charged-off receivables to generate revenue that exceeds our costs. These receivables are difficult to collect, and we may not be successful in collecting amounts sufficient to cover the costs associated with purchasing the receivables and funding our operations. If we are not able to collect on these receivables, collect sufficient amounts to cover our costs or generate satisfactory returns, this may adversely affect our business, financial condition and operating results.
Sellers may deliver portfolios that contain accounts that do not meet our account collection criteria and cannot be returned, which could have an adverse effect on our cash flows and our operations.
In the normal course of portfolio acquisitions, some accounts may be included in the portfolios that fail to conform to the terms of the purchase agreements and we may seek to return these accounts to the sellers for refund. However, we generally have a limited time in which to return these accounts to the sellers under the terms of our purchase agreements. In addition, sellers may not be able to meet their contractual obligations to us. Accounts that we are unable to return to sellers may yield no return. If sellers deliver portfolios containing too many accounts that do not conform to the terms of the purchase agreements, we may be unable to collect a sufficient amount and the portfolio purchase could generate lower returns or be unprofitable, which would have an adverse effect on our cash flows and our operations. If cash flows from operations are less than anticipated, our ability to satisfy our debt obligations and purchase new portfolios and, correspondingly, our business, financial condition and operating results, may be adversely affected.
A significant portion of our portfolio purchases during any period may be concentrated with a small number of sellers or resellers, which could adversely affect our volume and timing of purchases.
A significant percentage of our portfolio purchases for any given fiscal quarter or year may be concentrated with a few large sellers, some of which may also involve forward flow arrangements. We cannot be certain that any of our significant sellers will continue to sell charged-off receivables to us on terms or in quantities acceptable to us, or that we would be able to replace these purchases with purchases from other sellers.
A significant decrease in the volume of purchases available from any of our principal sellers on terms acceptable to us would force us to seek alternative sources of charged-off receivables. Further, we have historically complemented our portfolio
14
purchases from credit originators by purchasing portfolios from resellers or through the acquisition of portfolios from competitors looking to exit the market. As consolidation in the market continues, there may be fewer competitors to acquire on favorable terms. In addition, as the regulatory market continues to evolve, increased documentation requirements for collecting on portfolios may make purchasing accounts through resellers more difficult. Several larger issuers have also begun to prohibit resale of portfolios.
We may be unable to find alternative sources from which to purchase charged-off receivables, and even if we could successfully replace these purchases, the search could take time and the receivables could be of lower quality, cost more, or both, any of which could adversely affect our business, financial condition and operating results.
We face intense competition that could impair our ability to maintain or grow our purchasing volumes.
The charged-off receivables purchasing market is highly competitive and fragmented. We compete with a wide range of other purchasers of charged-off consumer receivables. To the extent our competitors are able to better maximize recoveries on their assets or are willing to accept lower rates of return, we may not be able to grow or sustain our purchasing volumes or we may be forced to acquire portfolios at expected rates of return lower than our historical rates of return. Some of our competitors may obtain alternative sources of financing at more favorable rates than those available to us, the proceeds from which may be used to fund expansion and to increase the amount of charged-off receivables they purchase.
Barriers to entry into the consumer debt collection industry have traditionally been low. More recently, increased regulatory standards have made entry into the market more difficult and have resulted in sellers of charged-off consumer receivables being more selective with buyers in the marketplace. Companies with greater financial resources than we have may elect at a future date to enter the market for charged-off consumer receivables. We believe that the entrance of new market participants in our industry could lead to additional upward pricing pressure on charged-off consumer receivables as a result of increased demand, but also because new purchasers may pay higher prices for the portfolios than more experienced purchasers would due to a lack of experience, data and analytics necessary to properly assess risks and return potential of the portfolios or a desire to add size to their existing operations.
We face bidding competition in our acquisition of charged-off consumer receivables. We believe that successful bids are predominantly awarded based on price and, to a lesser extent, based on service, reputation, and relationships with the sellers of charged-off receivables. Some of our current competitors, and potential new competitors, may have more effective pricing and collection models, greater adaptability to changing market needs, and more established relationships in our industry than we do. Moreover, our competitors may elect to pay prices for portfolios that we determine are not economically sustainable and, in that event, we may not be able to continue to offer competitive bids for charged-off receivables.
If we are unable to develop and expand our business or to adapt to changing market needs as well as our current or future competitors, we may experience reduced access to portfolios of charged-off consumer receivables in sufficient face value amounts at appropriate prices, which could adversely affect our business, financial condition and operating results.
The statistical models we use to project remaining cash flows from our receivable portfolios may prove to be inaccurate and, if so, our financial results may be adversely affected.
For our U.S. accounts, we use our internally developed statistical models to project the remaining cash flows from our receivable portfolios. These models consider known data about our consumers’ accounts, including, among other things, our collection experience and changes in external consumer factors, in addition to data known when we acquired the accounts. However, we may not be able to achieve the collections forecasted by our models. For our accounts serviced by Cabot, we use Cabot’s internally developed models to project the remaining cash flows from its receivable portfolios. If we are not able to achieve the levels of forecasted collection, our revenues will be reduced or we may be required to record an allowance charge, which may adversely affect our business, financial condition and operating results.
We may incur allowance charges based on the authoritative accounting guidance for loans and debt securities acquired with deteriorated credit quality.
We account for our portfolio revenue in accordance with the authoritative accounting guidance for loans and debt securities acquired with deteriorated credit quality. The authoritative guidance limits the revenue that may be accrued to the excess of the estimate of expected future cash flows over a portfolio’s initial cost and requires that the excess of the contractual cash flows over the expected cash flows not be recognized as an adjustment of revenue, expense, or on the balance sheet. The authoritative accounting guidance maintains the IRR originally estimated when the receivable portfolios are purchased and, rather than lower the estimated IRR if the expected future cash flow estimates are decreased, the carrying value of our receivable portfolios would be written down to maintain the then-current IRR. Increases in expected future cash flows would be recognized prospectively through an upward adjustment of the IRR over a portfolio’s remaining life. Any increased yield then becomes the new benchmark for allowance testing. Since the authoritative accounting guidance does not permit yields to be
15
lowered, there is an increased probability of us having to incur allowance charges in the future, which would adversely affect our business, financial condition and operating results.
If our goodwill or amortizable intangible assets become impaired we may be required to record a significant charge to earnings.
As of December 31, 2016, we carry approximately $785.0 million in goodwill and approximately $28.2 million in amortizable intangible assets. Under authoritative guidance, we review our goodwill for potential impairment at least annually, and review our amortizable intangible assets for impairment whenever events or changes in circumstances indicate that the carrying value may not be recoverable. Factors that may indicate that the carrying value of our goodwill or amortizable intangible assets may not be recoverable include adverse changes in estimated future cash flows, growth rates and discount rates. We may be required to record a significant charge in our financial statements during the period in which any impairment of our goodwill or amortizable intangible assets is determined, which could adversely affect our business, financial condition and operating results.
Our business is subject to extensive laws and regulations, which have increased and may continue to increase.
As noted in detail in “Item 1 - Part 1 - Business - Government Regulation” of this Annual Report on Form 10-K, extensive laws and regulations directly apply to key portions of our business. Our failure or the failure of third-party agencies and attorneys, or the credit originators or portfolio resellers selling receivables to us, to comply with existing or new laws, rules, or regulations could limit our ability to recover on receivables, affect the willingness of financial institutions to sell portfolios to us, cause us to pay damages to consumers or result in fines or penalties, which could reduce our revenues, or increase our expenses, and consequently adversely affect our business, financial condition and operating results.
We sometimes purchase accounts in asset classes that are subject to industry-specific and/or issuer-specific restrictions that limit the collection methods that we can use on those accounts. Further, we have seen a trend in laws, rules and regulations requiring increased availability of historic information about receivables in order to collect. If credit originators or portfolio resellers are unable or unwilling to meet these evolving requirements, we may be unable to collect on certain accounts. Our inability to collect sufficient amounts from these accounts, through available collections methods, could adversely affect our business, financial condition and operating results.
In addition, the CFPB has recently engaged in enforcement activity in sectors adjacent to our industry, impacting credit originators, collection firms, and payment processors, among others. Enforcement activity in these spaces by the CFPB or others, especially in the absence of clear rules or regulatory expectations, may be disruptive to third parties as they attempt to define appropriate business practices. As a result, certain commercial relationships we maintain may be disrupted or impacted by changes in third-parties’ business practices or perceptions of elevated risk relating to the debt collection industry, which could reduce our revenues, or increase our expenses, and consequently adversely affect our business, financial condition and operating results.
Additional consumer protection or privacy laws, rules and regulations may be enacted, or existing laws, rules or regulations may be reinterpreted or enforced in a different manner, imposing additional restrictions or requirements on the collection of receivables.
The implementation of the Dodd-Frank Wall Street Reform and Consumer Protection Act has subjected and will continue to subject us to substantial additional federal regulation, and we cannot predict the effect of this regulation on our business, financial condition and operating results.
Federal and state consumer protection, privacy, and related laws and regulations extensively regulate the relationship between debt collectors and consumers. In addition, federal and state laws may limit our ability to purchase or recover on our consumer receivables regardless of any act or omission on our part. On July 21, 2010, the Dodd-Frank Act was enacted. Title X of the Dodd-Frank Act (also referred to as the Consumer Financial Protection Act or “CFPA”) established the CFPB. Pursuant to the Dodd-Frank Act, the CFPB has rulemaking, supervisory, enforcement, and other authorities relating to consumer financial products and services, including debt collection. We generally are subject to the CFPB’s rulemaking, supervisory, and enforcement authority.
Given the uncertainty associated with how provisions of the Dodd-Frank Act will be implemented and enforced by the CFPB and various regulatory agencies, the full extent of the impact that these requirements will have on us is unclear. Changes resulting from the Dodd-Frank Act may affect the profitability of business activities, require changes to certain business practices, or otherwise adversely affect our business. In particular, we expect an increase in the cost of operating due to greater regulatory oversight, supervision, and compliance with consumer debt servicing and collection practices.
Subject to the provisions of the Dodd-Frank Act, the CFPB has responsibility to implement and enforce “federal consumer financial law,” and to examine regulated entities for compliance with such law. Those laws include, among others, (1) Title X itself, which prohibits unfair, deceptive, or abusive acts or practices in connection with consumer financial products
16
and services, and (2) “enumerated consumer laws” (and their implementing regulations), which include the FDCPA, the FCRA, and others.
The CFPB’s authorities include the ability to issue regulations under various federal statutes that affect the collection industry, including the FDCPA, FCRA, and others. This means, for example, that the CFPB has the ability to adopt rules that interpret any of the provisions of the FDCPA, potentially affecting all facets of debt collection, and our activities. In July 2016, the CFPB released an outline of proposals under consideration for its debt collection rulemaking. The proposals are aimed at ensuring debt collectors, among other things: collect the correct debt; limit excessive or disruptive communications; stop collecting or suing for debt without proper documentation; and provide documentation substantiating debt to a consumer upon demand. In addition to consulting with business representatives, the CFPB will continue to seek input from the public, consumer groups, industry, and other stakeholders before continuing the rulemaking process. Shortly after his inauguration, President Trump issued an order halting all federal regulatory rulemakings, which may include the CFPB’s debt collection rulemaking.
In addition, the CFPB has issued guidance in the form of bulletins on debt collection and credit furnishing activities generally, including one that specifically addresses representations regarding credit reports and credit scores during the debt collection process, and another that focuses on the application of the CFPA’s prohibition of “unfair, deceptive, or abusive” acts or practices on debt collection. The CFPB also accepts debt collection consumer complaints and released template letters for consumers to use when corresponding with debt collectors. The CFPB makes publicly available its data on consumer complaints, and consumer complaints against us, which could result in reputational damage to us. The Dodd-Frank Act also mandates the submission of multiple studies and reports to Congress by the CFPB, and CFPB staff regularly make speeches on topics related to credit and debt. All of these activities could trigger additional legislative or regulatory action.
The CFPB is authorized to supervise and conduct examinations of our business practices. The prospect of supervision has increased the potential consequences of noncompliance with federal consumer financial law. The CFPB can also conduct hearings and adjudication proceedings, conduct investigations, either unilaterally or jointly with other state and federal regulators, to determine if federal consumer financial law has been violated. The CFPB has authority to impose monetary penalties for violations of applicable federal consumer financial laws (including Title X of the Dodd-Frank Act, FDCPA, and FCRA, among other consumer protection statutes), require remediation of practices, and pursue enforcement actions. The CFPB also has authority to obtain cease and desist orders (which can include orders for restitution or rescission of contracts, as well as other kinds of affirmative relief), costs, and monetary penalties ranging from $5,000 per day for ordinary violations of federal consumer financial laws to $25,000 per day for reckless violations and $1 million per day for knowing violations. In addition, where a company has violated Title X of the Dodd-Frank Act or CFPB regulations implemented under Title X of the Dodd-Frank Act, the Dodd-Frank Act empowers state Attorneys General and state regulators to bring civil actions to remedy violations of state law. The CFPB has been active in its supervision, examination and enforcement of financial services companies, including bringing enforcement actions imposing fines and mandating large refunds to customers of several financial institutions for practices relating to debt collection practices.
On September 9, 2015, we entered into the Consent Order with the CFPB in which we settled allegations arising from our practices between 2011 and 2015. The Consent Order includes obligations on us to: (1) among other things follow certain specified operational requirements, substantially all of which are already part of our current operations; (2) submit to the CFPB for review a comprehensive plan designed to ensure that its debt collection practices comply with all applicable federal consumer financial laws and the terms of the Consent Order; (3) pay redress to certain specified groups of consumers; and (4) pay a civil monetary penalty. We will continue to cooperate and engage with the CFPB and work to ensure compliance with the Consent Order. In addition, we are subject to ancillary state attorney general investigations related to similar debt collection practices.
The Company incurred a one-time, after-tax charge of approximately $43 million in the third quarter of 2015. The Company believes this charge will cover all related impacts of the Consent Order, including civil monetary penalties, restitution, any such ancillary state regulatory matters, legal expenses and portfolio allowance charges on several pool groups due to the impact on the Company’s current estimated remaining collections related to its existing receivable portfolios. The Company anticipates that after this one-time charge, any future earnings impact will be immaterial.
If the CFPB, the FTC, acting under the FTCA or other applicable statute such as the FDCPA, or one or more state Attorneys General or state regulators believe that we have violated any of the applicable laws or regulations, they could exercise their enforcement powers in ways that could have an adverse effect on our business, financial condition and operating results.
We expect that we will be required to invest significant management attention and resources to continue to evaluate, develop, and make any changes to our policies and procedures necessary to comply with new statutory and regulatory requirements under the Dodd-Frank Act or other applicable laws, which may negatively affect our results of operations, cash flows, and our financial condition. However, we cannot predict the scope and substance of the regulations, guidance, and policies ultimately adopted by the CFPB related to our activities. The CFPB continues to initiate rulemakings, issue regulatory
17
guidance and bulletins, and exercise its supervisory and enforcement authority. It is therefore unclear at this time what effect these regulations will have on financial markets generally, original creditors, or our business and service providers; the additional costs associated with compliance with these regulations; or what changes, if any, to our operations may be necessary to comply with the CFPB’s expectations or the Dodd-Frank Act. Any of these factors could have an adverse effect on our business, financial condition and operating results.
Failure to comply with government regulation could result in the suspension or termination of our ability to conduct business, may require the payment of significant fines and penalties, or require other significant expenditures.
The collections industry is heavily regulated under various federal, state, and local laws, rules, and regulations. Many states and several cities require that we be licensed as a debt collection company. The CFPB, FTC, state Attorneys General and other regulatory bodies have the authority to investigate a variety of matters, including consumer complaints against debt collection companies, and can bring enforcement actions and seek monetary penalties, consumer restitution, and injunctive relief. If we, or our third-party collection agencies or law firms fail to comply with applicable laws, rules, and regulations, including, but not limited to, identity theft, privacy, data security, the use of automated dialing equipment, laws related to consumer protection, debt collection, and laws applicable to specific types of debt, it could result in the suspension or termination of our ability to conduct collection operations, which would adversely affect us. Further, our ability to collect our receivables may be affected by state laws, which require that certain types of account documentation be presented prior to the institution of any collection activities. In addition, new federal, state or local laws or regulations, or changes in the ways these rules or laws are interpreted or enforced, could limit our activities in the future and/or significantly increase the cost of regulatory compliance. Finally, our operations outside the United States are subject to foreign and U.S. laws and regulations that apply to our international operations, including the Foreign Corrupt Practices Act, the U.K. Bribery Act and other local laws prohibiting corrupt payments to government officials. Violations of these laws and regulations could result in fines and penalties, criminal sanctions, prohibitions on the conduct of our business and reputational damage. Any of the foregoing could have an adverse effect on our business, financial condition and operating results.
Investigations or enforcement actions by governmental authorities may result in changes to our business practices, negatively affect our portfolio purchasing volume, make collections more difficult or expose us to the risk of fines, penalties, restitution payments and litigation.
Our business practices may be subject to review from time to time by various governmental authorities. These reviews may involve governmental authority consideration of individual consumer complaints, or could involve a broader review of our debt collection policies and practices. These investigations could lead to assertions by governmental authorities that we are not complying with applicable laws or regulations, in which case authorities may request or seek to impose a range of remedies that could involve potential compensatory or punitive damage claims, fines, restitutionary payments, sanctions or injunctive relief. Government authorities could also request, or we may agree to change, practices that we believe are compliant with applicable law and regulations in order to respond to the concerns of governmental authorities. In addition, negative publicity relating to investigations or proceedings brought by governmental authorities could have an adverse effect on our reputation, could impair our relationships with industry participants, and could result in financial institutions reducing or eliminating sales of portfolios to us. Further, responding to governmental inquiries and investigations and defending lawsuits or other proceedings could require significant expenditures and could divert management’s attention from our business operations. Any of the foregoing could have an adverse effect on our business, financial condition and operating results.
Changes to the regulatory regime to which Cabot is subject may adversely affect our business, financial condition and operating results.
Cabot’s operations are subject to substantial regulations, and the regulatory regime to which it is subject may experience changes. The FCA implemented an interim permission regime whereby businesses that held a consumer credit license were required to register with the FCA for interim permission before March 31, 2014 in order to continue consumer credit activities after April 1, 2014. The interim permission regime is expected to continue until April 1, 2017, and during this time businesses will be called upon at different intervals to apply for authorization to be fully regulated by the FCA.
Cabot applied for full authorization of its business with the FCA in March 2015 and CCMG, a Cabot subsidiary, became authorized and regulated by the FCA in March 2016. CCMG appointed other Cabot subsidiaries as its representatives to carry out debt-collecting and debt administration services on its behalf. CCMG assumes full regulatory responsibility for such entities. In addition to the full authorization of its business with the FCA, CCMG has appointed certain individuals who have significant control or influence over the management of the business, known as “Approved Persons,” and who will jointly and severally be liable for the acts and omissions of the company and its business affairs. Approved Persons will be subject to statements of principle and codes of practice established and enforced by the FCA.
The FCA has adopted detailed rules relating to conducting consumer credit activities, in addition to putting in place high level principles and conditions to which it expects businesses and Approved Persons in the sector to adhere. The FCA has
18
significantly greater powers than the OFT, including, but not limited to, the ability to impose significant fines, ban certain individuals from carrying on trade within the financial services industry, impose requirements on a firm’s permission, and cease certain products from being collected upon.
As part of its philosophy of continuous improvement, CCMG regularly reviews policy and practice across all of its business units to ensure appropriate and consistent levels of compliance in relation to both FCA regulation and principles of business. The changes made to policy and practice over the last few years have gradually resulted in, among other things, the lengthening of consumer call duration, the reduction in the number of customer accounts being assessed as suitable for litigation, the extension of pre-litigation recovery periods, the reduction in the number of customer accounts that have been assessed as suitable for the application of interest, and an increase in the number of customers being identified as in a vulnerable situation and therefore not suitable for debt repayment.
The FCA also requires that debt repayments agreed to with consumers are evidenced as affordable to the consumer, which results in a means-based evaluation of proposed repayments, be that one time settlements or installments over time. We believe this, combined with the effects described above, have gradually resulted in: a reduction in the number of highly discounted near term one-time settlements; an increase in the number of payment plans, including a shift from legal collections to repayment plans; and an increase in the length of existing payment plans. As a result, we have seen a reduction in the amount of collections in the near term and expect a lengthening of our collections curve.
Furthermore, the regulatory regime in the United Kingdom relating to the protection of consumers from unfair terms and practices has also undergone changes. In October 2015, the U.K. Parliament introduced new laws, which reformed most of the previous U.K. consumer laws and was largely driven by the European Commission’s Directive for Consumer Rights. The U.K. Consumer Rights Act 2015 provides for enhanced consumer measures that can be imposed on businesses and gives greater protection to U.K. consumers from unfair business practices and unfair terms in consumer agreements.
Also, the manner in which court claims are conducted in England and Wales in connection with the recovery of debt may be subject to significant changes. In September 2014, the CPRC, an advisory public body set up by statute and sponsored by the U.K. Ministry of Justice, issued a consultation on proposals to introduce a designated pre-action protocol for court claims for the recovery of debt. Due to the amount of responses from the industry against the introduction of a dedicated protocol, the CPRC created a dedicated sub-committee with industry and consumer group stakeholders. As a consequence, the CPRC issued an updated consultation in September 2015 in order to seek balance between the interests of the industry and consumer groups. Cabot and its industry body, the Credit Services Association, have each responded to this consultation. On December 9, 2016, the CPRC met and decided that the initial proposal, which would have required creditors to provide significant documentation, such as the original credit agreement prior to issuing a claim in court should be amended. A final draft of the rules has been passed for approval in the UK legislative system. The new draft will require that a letter before claim informs a consumer of their right to request documentation and for a full statement of account to be included. However, this documentation no longer has to be provided with the letter before claim. The precise detail is yet to be made public.
Finally, in December 2015, the EU General Data Protection Regulation (“GDPR”) was proposed to replace the Data Protection Directive 95/46/EC. In May 2016 the GDPR was adopted and published in the Official Journal of the EU. The GDPR will be effective starting in 2018 and, although the full scope of the GDPR changes have not yet been released, is likely to introduce significant changes to the data protection regime including but not limited to: the conditions for obtaining consent to process personal data; transparency and providing information to individuals regarding the processing of their personal data; enhanced rights for individuals; notification obligations for personal data breach; and new supervisory authorities including a European Data Protection Board (“EDPB”).
It is not yet possible to predict the precise impact that the above-referenced changes will have on Cabot. It is likely that the rules and regulations applicable to Cabot, and the burden of regulatory scrutiny to which Cabot is subject, will continue to increase. The FCA’s imposition of additional requirements on Cabot’s operations or failure by Cabot to maintain FCA authorization for its collection activities, the addition, reinterpretation or enforcement of any laws, rules, regulations, or protocols, or increased enforcement of existing consumer protection or privacy laws, rules and regulations, may adversely affect our ability to collect on receivables and may increase our costs associated with regulatory compliance, which could adversely affect our business, financial condition and operating results.
Economic conditions and regulatory changes leading up to and following the United Kingdom’s expected exit from the European Union could have a material adverse effect on our business, financial condition and results of operations.
On June 23, 2016, the United Kingdom held a referendum in which voters approved the United Kingdom’s exit from the E.U., commonly referred to as “Brexit”. The referendum was advisory, and the terms of any withdrawal are subject to a negotiation period that could last at least two years after the U.K. government formally initiates a withdrawal process. Nevertheless, the referendum has created significant uncertainty about the future relationship between the United Kingdom and the E.U., including with respect to the laws and regulations that will apply as the United Kingdom determines which E.U. laws to replace or replicate in the event of a withdrawal. Additionally, Brexit could, among other outcomes, disrupt the free
19
movement of goods, services and people between the U.K. and the E.U., undermine bilateral cooperation in key policy areas and significantly disrupt trade between the U.K. and the E.U. Consequences such as deterioration in economic conditions, volatility in currency exchange rates or changes in regulation may adversely affect our business, financial condition and operating results.
Our business, financial condition and operating results may be adversely affected if consumer bankruptcy filings increase or if bankruptcy laws change.
Our business model may be uniquely vulnerable to an economic recession, which typically results in an increase in the amount of defaulted consumer receivables, thereby contributing to an increase in the amount of personal bankruptcy filings. Under certain bankruptcy filings, a consumer’s assets are sold to repay credit originators, with priority given to holders of secured debt. Since the defaulted consumer receivables we purchase are generally unsecured, we often are not able to collect on those receivables. In addition, since we purchase receivables that may have been delinquent for a long period of time, this may be an indication that many of the consumers from whom we collect will be unable to pay their debts going forward and are more likely to file for bankruptcy in an economic recession. Furthermore, potential changes to existing bankruptcy laws could contribute to an increase in consumer bankruptcy filings. We cannot be certain that our collection experience would not decline with an increase in consumer bankruptcy filings. If our actual collection experience with respect to a defaulted consumer receivable portfolio is significantly lower than we projected when we purchased the portfolio, our business, financial condition and operating results could be adversely affected.
We are dependent upon third parties to service a substantial portion of our consumer receivable portfolios.
We use outside collection services to collect a substantial portion of our charged-off receivables. We are dependent upon the efforts of third-party collection agencies and attorneys to help service and collect our charged-off receivables. Our third-party collection agencies and attorneys could fail to perform collection services for us adequately, remit those collections to us or otherwise perform their obligations adequately. In addition, one or more of those third-party collection agencies or attorneys could cease operations abruptly or become insolvent, or our relationships with such collection agencies or attorneys may otherwise change adversely. Further, we might not be able to secure replacement third-party collection agencies or attorneys or promptly transfer account information to our new third-party collection agencies, attorneys or in-house in the event our agreements with our third-party collection agencies and attorneys were terminated. Any of the foregoing factors could cause our business, financial condition and operating results to be adversely affected.
Increases in costs associated with our collections through collection litigation can raise our costs associated with our collection strategies and the individual lawsuits brought against consumers to collect on judgments in our favor.
We hire in-house counsel and contract with a nationwide network of attorneys that specialize in collection matters. In connection with collection litigation, we advance certain out-of-pocket court costs, which we refer to as deferred court costs. These court costs may be difficult or impossible to collect, and we may not be successful in collecting amounts sufficient to cover the amounts deferred in our financial statements. If we are not able to recover these court costs, our business, financial condition and operating results may be adversely affected.
Further, we have substantial collection activity through our legal channel and, as a consequence, increases in deferred court costs, increases in costs related to counterclaims, and an increase in other court costs may increase our costs in collecting on these accounts, which may have an adverse effect on our business, financial condition and operating results.
Our network of third-party agencies and attorneys may not utilize amounts collected on our behalf or amounts we advance for court costs in the manner for which they were intended.
In the normal course of operations, our third-party collection agencies and attorneys collect funds on our behalf. These third parties may fail to remit amounts owed to us in a timely manner or at all. Additionally, we advance court costs to our third-party attorneys, which are intended for their use in filing lawsuits on our behalf. These third-party attorneys may misuse some or all of the funds we advance to them. Our ability to recoup our funds may be diminished if these third parties become insolvent or enter into bankruptcy proceedings. If we are not able to recover these funds, our business, financial condition and operating results may be adversely affected.
A significant portion of our collections relies upon our success in individual lawsuits brought against consumers and our ability to collect on judgments in our favor.
We generate a significant portion of our revenue by collecting on judgments that are granted by courts in lawsuits filed against consumers. A decrease in the willingness of courts to grant these judgments, a change in the requirements for filing these cases or obtaining these judgments, or a decrease in our ability to collect on these judgments could have an adverse effect on our business, financial condition and operating results. As we increase our use of the legal channel for collections, our short-term margins may decrease as a result of an increase in upfront court costs and costs related to counter claims. We may not be
20
able to collect on certain aged accounts because of applicable statutes of limitations and we may be subject to adverse effects of regulatory changes. Further, courts in certain jurisdictions require that a copy of the account statements or applications be attached to the pleadings in order to obtain a judgment against consumers. If we are unable to produce those account documents, these courts could deny our claims, and our business, financial condition and operating results may be adversely affected.
We are subject to ongoing risks of regulatory investigations and litigation, including individual and class action lawsuits, under consumer credit, consumer protection, theft, privacy, collections, and other laws, and we may be subject to awards of substantial damages or be required to make other expenditures or change our business practices as a result.
We operate in an extremely litigious climate and currently are, and may in the future be, named as defendants in litigation, including individual and class action lawsuits under consumer credit, consumer protection, theft, privacy, data security, automated dialing equipment, debt collections, and other laws. Many of these cases present novel issues on which there is no clear legal precedent, which increases the difficulty in predicting both the potential outcomes and costs of defending these cases. We are subject to ongoing risks of regulatory investigations, inquiries, litigation, and other actions by the CFPB, FTC, state Attorneys General, or other governmental bodies relating to our activities. These litigation and regulatory actions involve potential compensatory or punitive damage claims, fines, costs, sanctions, civil monetary penalties, consumer restitution, or injunctive relief, as well as other forms of relief, that could require us to pay damages, make other expenditures or result in changes to our business practices. Any changes to our business practices could result in lower collections, increased cost to collect or reductions in estimated remaining collections. Actual losses incurred by us in connection with judgments or settlements of these matters may be more than our associated reserves. Further, defending lawsuits and responding to governmental inquiries or investigations, regardless of their merit, could be costly and divert management’s attention from the operation of our business. All of these factors could have an adverse effect on our business, financial condition and operating results.
Negative publicity associated with litigation, governmental investigations, regulatory actions, and other public statements could damage our reputation.
From time to time there are negative news stories about our industry or company, especially with respect to alleged conduct in collecting debt from consumers. These stories may follow the announcements of litigation or regulatory actions involving us or others in our industry. Negative publicity about our alleged or actual debt collection practices or about the debt collection industry in general could adversely affect our stock price, our position in the marketplace in which we compete, and our ability to purchase charged-off receivables, any of which could have an adverse effect on our business, financial condition and operating results.
We may make acquisitions that prove unsuccessful and any mergers, acquisitions, dispositions or joint venture activities may change our business and financial results and introduce new risks.
From time to time, we may make acquisitions of, or otherwise invest in, other companies that could complement our business, including the acquisition of entities in diverse geographic regions and entities offering greater access to businesses and markets that we do not currently serve. The acquisitions we make may be unprofitable or may take some time to achieve profitability. In addition, we may not successfully operate the businesses that we acquire, or may not successfully integrate these businesses with our own, which may result in our inability to maintain our goals, objectives, standards, controls, policies, culture, or profitability. Also, minority shareholders in certain entities that we have acquired have the right, at certain times, to require us to acquire their ownership interest in those entities at fair value, while others have the right to force a sale of the entity if we choose not to purchase their interests at fair value, which could result in additional constraints on our resources. Through acquisitions, we may enter markets in which we have limited or no experience. Any acquisition may result in a potentially dilutive issuance of equity securities, and the incurrence of additional debt which could reduce our profitability. We also pursue dispositions and joint ventures from time to time. Any such transactions could change our business lines, geographic reach, financial results or capital structure. Our company could be larger or smaller after any such transactions and may have a different investment profile.
We may consume resources in pursuing business opportunities, financings or other transactions that are not consummated, which may strain or divert our resources.
We anticipate that the investigation of various transactions, and the negotiation, drafting, and execution of relevant agreements, disclosure documents and other instruments with respect to such transactions, will require substantial management time and attention and substantial costs for financial advisors, accountants, attorneys and other advisors. If a decision is made not to consummate a specific transaction, the costs incurred up to that point for the proposed transaction likely would not be recoverable. Furthermore, even if an agreement is reached relating to a specific transaction, we may fail to consummate the transaction for any number of reasons, including those beyond our control. Any such event could consume significant
21
management time and result in a loss to us of the related costs incurred, which could adversely affect our financial position and our business.
We are dependent on our management team for the adoption and implementation of our strategies and the loss of its services could have an adverse effect on our business.
Our management team has considerable experience in finance, banking, consumer collections, and other industries. We believe that the expertise of our executives obtained by managing businesses across numerous other industries has been critical to the enhancement of our operations. Our management team has created a culture of new ideas and progressive thinking, coupled with increased use of technology and statistical analysis. The management teams at each of our operating subsidiaries are also important to the success of their respective operations. The loss of the services of one or more key members of management could disrupt our collective operations and seriously impair our ability to continue to acquire or collect on portfolios of charged-off receivables and to manage and expand our business, any of which could have an adverse effect on business, financial condition and operating results.
Regulatory, political, and economic conditions in the foreign countries in which we operate or may operate in the future expose us to risk, including loss of business.
While wage costs in certain countries in which we operate or may operate in the future are significantly lower than in the United States, the United Kingdom and other industrialized countries for comparably skilled workers, wages are increasing at a faster rate than in the United States or the United Kingdom, and we experience or may experience higher employee turnover in operations in those countries than is typical in our U.S. or U.K. locations. The continuation of these trends could reduce the cost savings we sought to achieve by establishing a portion of our operations outside of the United States. We may be adversely affected by changes in inflation, exchange rate fluctuations, interest rates, tax provisions, social stability or other political, economic or diplomatic developments in or affecting these countries in the future. Changes in the business or regulatory climate of these countries could have an adverse effect on our business, financial condition and operating results.
We may not be able to manage our growth effectively, including the expansion of our foreign operations.
We have expanded significantly in recent years. Continued growth will place additional demands on our resources, and we cannot be sure that we will be able to manage our growth effectively. For example, continued growth could place strains on our management, operations, and financial resources that our infrastructure, facilities, and personnel may not be able to adequately support. In addition, the recent expansion of our foreign operations subjects us to a number of additional risks and uncertainties, including:
• | compliance with and changes in international laws, including regulatory and compliance requirements that could affect our business; |
• | differing accounting standards and practices; |
• | increased exposure to U.S. laws that apply abroad, such as the Foreign Corrupt Practices Act, and exposure to other anti-corruption laws such as the U.K. Bribery Act; |
• | social, political and economic instability or recessions; |
• | fluctuations in foreign economies and currency exchange rates; |
• | difficulty in hiring, staffing and managing qualified and proficient local employees and advisors to run international operations; |
• | the difficulty of managing and operating an international enterprise, including difficulties in maintaining effective communications with employees due to distance, language, and cultural barriers; |
• | difficulties implementing and maintaining effective internal controls and risk management and compliance initiatives; |
• | potential disagreements with our joint venture business partners; |
• | differing labor regulations and business practices; and |
• | foreign tax consequences. |
To support our growth and improve our international operations, we continue to make investments in infrastructure, facilities, and personnel in our operations; however, these additional investments may not be successful or our investments may
22
not produce profitable results. If we cannot manage our growth effectively, our business, financial condition and operating results may be adversely affected.
If our technology and telecommunications systems were to fail, or if we are not able to successfully anticipate, invest in, or adopt technological advances within our industry, it could have an adverse effect on our operations.
Our success depends in large part on sophisticated computer and telecommunications systems. The temporary or permanent loss of our computer and telecommunications equipment and software systems, through casualty, operating malfunction, software virus, or service provider failure, could disrupt our operations. In the normal course of our business, we must record and process significant amounts of data quickly and accurately to properly bid on prospective acquisitions of receivable portfolios and to access, maintain, and expand the databases we use for our collection activities. Any simultaneous failure of our information systems and their backup systems would interrupt our business operations.
In addition, our business relies on computer and telecommunications technologies, and our ability to integrate new technologies into our business is essential to our competitive position and our success. We may not be successful in anticipating, investing in, or adopting technological changes on a timely or cost-effective basis. Computer and telecommunications technologies are evolving rapidly and are characterized by short product life cycles.
We continue to make significant modifications to our information systems to ensure that they continue to be adequate for our current and foreseeable demands and continued expansion, and our future growth may require additional investment in these systems. These system modifications may exceed our cost or time estimates for completion or may be unsuccessful. If we cannot update our information systems effectively, our business, financial condition and operating results may be adversely affected.
In the event of a cyber security breach or similar incident, our business and operations could suffer.
We rely on information technology networks and systems to process and store electronic information. We collect and store sensitive data, including personally identifiable information of our consumers, on our information technology networks. Despite the implementation of security measures, our information technology networks and systems may be vulnerable to disruptions and shutdowns due to attacks by hackers or breaches due to malfeasance by contractors, employees and others who have access to our networks and systems. The occurrence of any of these cyber security events could compromise our networks and the information stored on our networks could be accessed. Any such access could disrupt our operations or result in legal claims, liability, reputational damage or regulatory penalties under laws protecting the privacy of personal information, any of which could adversely affect our business, financial condition and operating results.
We rely on third parties to provide us with services in connection with certain aspects of our business, and any failure by these third parties to perform their obligations, or our inability to arrange for alternative third party providers for such services, could have an adverse effect on our business, financial condition and operating results.
We have entered into agreements with third parties to provide us with services in connection with our business, including payment processing, credit card authorization and processing, payroll processing, record keeping for retirement and benefit plans and certain information technology functions. Any failure by a third party to provide us with contracted services on a timely basis or within service level expectations and performance standards may have an adverse effect on our business, financial condition and operating results. In addition, we may be unable to find, or enter into agreements with, suitable replacement third party providers for such services, which could adversely affect our business, financial condition and operating results.
We may not be able to adequately protect the intellectual property rights upon which we rely and, as a result, any lack of protection may diminish our competitive advantage.
We rely on proprietary software programs and valuation and collection processes and techniques, and we believe that these assets provide us with a competitive advantage. We consider our proprietary software, processes, and techniques to be trade secrets, but they are not protected by patent or registered copyright. We may not be able to protect our technology and data resources adequately, which may diminish our competitive advantage, which may, in turn, adversely affect our business, financial condition and operating results.
Exchange rate fluctuations could adversely affect our business, financial condition and operating results.
Because we conduct some business in currencies other than U.S. dollars but report our financial results in U.S. dollars, we face exposure to fluctuations in currency exchange rates upon translation of these business results into U.S. dollars. In the normal course of business, we employ various strategies to manage these risks, including the use of derivative instruments. These strategies may not be effective in protecting us against the effects of fluctuations from movements in foreign exchange rates. Fluctuations in the foreign currency exchange rates could adversely affect our business, financial condition and operating results.
23
Taxes could adversely affect our results of operations, cash flows and financial condition.
We are subject to taxes in the United States and, increasingly, in foreign jurisdictions. Significant judgment is required in determining our worldwide provision for taxes. We regularly are under audit by tax authorities, and economic and political pressures to increase tax revenues in various jurisdictions may make resolving tax disputes more difficult. The final determination of tax audits and any related litigation could be different from our historical income tax provisions and accruals. In addition, potential adverse tax consequences could limit our ability to repatriate funds held in jurisdictions outside of the United States. Moreover, there may be unfavorable changes in the tax laws (or in the interpretation thereof) in the future. Accordingly, taxes could have an adverse effect on our results of operations, cash flows and financial condition.
Risks Related to Our Indebtedness and Common Stock
Our significant indebtedness could adversely affect our financial health and could harm our ability to react to changes to our business.
As described in greater detail in Note 10, “Debt” to our consolidated financial statements, as of December 31, 2016, our total long-term indebtedness outstanding was approximately $2.8 billion, which includes $1.5 billion of debt at our Cabot subsidiary. Our substantial indebtedness could have important consequences to investors. For example, it could:
• | increase our vulnerability to general economic downturns and industry conditions; |
• | require us to dedicate a substantial portion of our cash flow from operations to payments on our indebtedness, thereby reducing the availability of our cash flow to fund working capital, capital expenditures and other general corporate requirements; |
• | limit our flexibility in planning for, or reacting to, changes in our business and the industry in which we operate; |
• | place us at a competitive disadvantage compared to competitors that have less debt; |
• | increase our exposure to market and regulatory changes that could diminish the amount and value of our inventory that we borrow against under our secured credit facilities; and |
• | limit, along with the financial and other restrictive covenants contained in the documents governing our indebtedness, our ability to borrow additional funds, make investments and incur liens, among other things. |
Any of these factors could adversely affect our business, financial condition and operating results. If we do not have sufficient earnings to service our debt, we may be required to refinance all or part of our existing debt, sell assets, borrow more money, or sell securities, none of which we can guarantee we will be able to do.
Servicing our indebtedness requires a significant amount of cash, and we may not have sufficient cash flow from our business to pay our substantial indebtedness.
Our ability to make scheduled payments of the principal of, to pay interest on or to refinance our indebtedness or to make cash payments in connection with any conversion of our convertible notes depends on our future performance, which is subject to economic, financial, competitive and other factors beyond our control. Our business may not continue to generate cash flow from operations in the future sufficient to service our indebtedness and make necessary capital expenditures. If we are unable to generate adequate cash flow, we may be required to adopt one or more alternatives, such as selling assets, restructuring indebtedness or obtaining additional equity capital on terms that may be onerous or highly dilutive. Our ability to refinance our indebtedness will depend on the capital markets and our financial condition at that time. We may not be able to engage in any of these activities or engage in these activities on desirable terms, which could result in a default on our debt obligations which could, in turn, adversely affect our business, financial condition and operating results.
Despite our current indebtedness levels, we may still incur substantially more indebtedness or take other actions which would intensify the risks discussed above.
Despite our current consolidated indebtedness levels, we and our subsidiaries may be able to incur substantial additional indebtedness in the future, some of which may be secured indebtedness under our Third Amended and Restated Credit Agreement (as amended, the “Restated Credit Agreement”), subject to the restrictions contained in our debt instruments. We are not restricted under the terms of the indentures governing our convertible notes from incurring additional indebtedness, securing existing or future indebtedness, recapitalizing our indebtedness or taking a number of other actions that could have the effect of diminishing our ability to make payments on our indebtedness. Although the Restated Credit Agreement and some of our other existing debt currently limit the ability of us and certain of our subsidiaries to incur additional indebtedness, these restrictions are subject to a number of qualifications and exceptions and, under certain circumstances, additional indebtedness incurred in compliance with these restrictions, including additional secured indebtedness, could be substantial. Also, these
24
restrictions will not prevent us from incurring obligations that do not constitute indebtedness. To the extent new indebtedness or other new obligations are added to our current levels, the risks described above could intensify. Moreover, if the facilities under the Restated Credit Agreement are repaid or mature, we may not be subject to similar restrictions under the terms of any subsequent indebtedness.
We may not be able to continue to satisfy the covenants in our debt agreements.
Our debt agreements impose a number of covenants, including restrictive covenants on how we operate our business. Failure to satisfy any one of these covenants could result in negative consequences including the following, each of which could have an adverse effect on our business, financial condition and operating results:
• | acceleration of outstanding indebtedness; |
• | exercise by our lenders of rights with respect to the collateral pledged under certain of our outstanding indebtedness; |
• | our inability to continue to purchase receivables needed to operate our business; or |
• | our inability to secure alternative financing on favorable terms, if at all. |
Increases in interest rates could adversely affect our business, financial condition and operating results.
Portions of our outstanding debt bear interest at a variable rate. Increases in interest rates could increase our interest expense which would, in turn, lower our earnings. We may periodically evaluate whether to enter into derivative financial instruments, such as interest rate swap agreements, to reduce our exposure to fluctuations in interest rates on variable interest rate debt and their impact on earnings and cash flows. These strategies may not be effective in protecting us against the effects of fluctuations from movements in interest rates. Increases in interest rates could adversely affect our business, financial condition and operating results.
Our common stock price may be subject to significant fluctuations and volatility.
The market price of our common stock has been subject to significant fluctuations. Since the beginning of fiscal year 2016, our stock price has ranged from a low of $16.09 on January 19, 2016 to a high of $30.40 on December 9, 2016. These fluctuations could continue. Among the factors that could affect our stock price are:
• | our operating and financial performance and prospects; |
• | our ability to repay our debt; |
• | our access to financial and capital markets to refinance our debt; |
• | investor perceptions of us and the industry and markets in which we operate; |
• | future sales of equity or equity-related securities; |
• | changes in earnings estimates or buy/sell recommendations by analysts; |
• | changes in the supply of, demand for or price of portfolios; |
• | our acquisition activity, including our expansion into new markets; |
• | regulatory changes affecting our industry generally or our business and operations; |
• | general financial, domestic, international, economic and other market conditions; and |
• | the number of short positions on our stock at any particular time. |
The stock market in recent years has experienced significant price and volume fluctuations that have often been unrelated to the operating performance of companies. The market price of our common stock could fluctuate significantly for many reasons, including in response to the risks described in this Annual Report on Form 10-K, elsewhere in our filings with the SEC from time to time or for reasons unrelated to our operations, such as reports by industry analysts, investor perceptions or negative announcements by our customers, competitors or suppliers regarding their own performance, as well as industry conditions and general financial, economic and political instability.
The price of our common stock could also be affected by possible sales of our common stock by investors who view our convertible notes as a more attractive means of equity participation in us and by hedging or arbitrage trading activity that we
25
expect to develop involving our common stock.
If securities or industry analysts have a negative outlook regarding our stock or our industry, or our operating results do not meet their expectations, our stock price could decline. The trading market for our common stock is influenced by the research and reports that industry or securities analysts publish about us. If one or more of the analysts who cover our company downgrade our stock or if our operating results do not meet their expectations, our stock price could decline.
Future sales of our common stock or the issuance of other equity securities may adversely affect the market price of our common stock.
In the future, we may sell additional shares of our common stock or other equity or equity-related securities to raise capital or issue equity securities to finance acquisitions. In addition, a substantial number of shares of our common stock are reserved for issuance upon the exercise of stock options or vesting of restricted stock awards, upon conversion of our convertible notes and the warrant transactions entered into in connection with our convertible senior notes due 2017. We are not restricted from issuing additional common stock, including securities that are convertible into or exchangeable for, or that represent the right to receive, common stock.
The liquidity and trading volume of our common stock is limited. For the three months ended December 31, 2016, the average daily trading volume of our common stock was approximately 385,000 shares. The issuance or sale of substantial amounts of our common stock or other equity or equity-related securities (or the perception that such issuances or sales may occur) could adversely affect the market price of our common stock as well as our ability to raise capital through the sale of additional equity or equity-related securities. We cannot predict the effect that future issuances or sales of our common stock or other equity or equity-related securities would have on the market price of our common stock.
We may not have the ability to raise the funds necessary to repurchase our convertible notes upon a fundamental change or to settle conversions in cash, and our future indebtedness may contain limitations on our ability to pay cash upon conversion of our convertible notes.
Holders of our convertible notes will have the right to require us to repurchase their convertible notes upon the occurrence of a fundamental change at a repurchase price equal to 100% of their principal amount, plus accrued and unpaid interest, if any. In addition, upon a conversion of convertible notes, unless we elect to deliver solely shares of our common stock to settle the conversion (other than paying cash in lieu of delivering any fractional shares of our common stock), we will be required to make cash payments for each $1,000 in principal amount of convertible notes converted of at least the lesser of $1,000 and the sum of certain daily conversion values. However, we may not have enough available cash or be able to obtain financing at the time we are required to make repurchases of convertible notes surrendered therefor or to settle conversions in cash. In addition, our Restated Credit Agreement contains certain restrictive covenants that limit our ability to engage in specified types of transactions, which may affect our ability to repurchase our convertible notes. Further, our ability to repurchase our convertible notes or to pay cash upon conversion may be limited by law, by regulatory authority or by agreements governing our future indebtedness. Our failure to repurchase convertible notes or to pay cash upon conversion of the convertible notes at a time when the repurchase or cash payment upon conversion is required by any indenture pursuant to which the convertible notes were offered would constitute a default under the relevant indenture. Such default could constitute a default under another indenture, our Restated Credit Agreement or other agreements governing our future indebtedness. If the repayment of any indebtedness were to be accelerated, we may not have sufficient funds to repay such indebtedness and repurchase the convertible notes.
The conditional conversion feature of our convertible notes, if triggered, may adversely affect our financial condition and operating results.
In the event the conditional conversion feature of any of our convertible notes is triggered, holders of those convertible notes will be entitled to convert the convertible notes at any time during specified periods at their option. Even if holders do not elect to convert their convertible notes, we could be required under applicable accounting rules to reclassify all or a portion of the outstanding principal of the relevant series of convertible notes as a current rather than long-term liability, which would result in a material reduction of our net working capital.
The accounting method for convertible debt securities that may be settled in cash, such as our convertible notes, could have a material effect on our reported financial results.
Under U.S. generally accepted accounting principles, or GAAP, an entity must separately account for the debt component and the embedded conversion option of convertible debt instruments that may be settled entirely or partially in cash upon conversion, such as our convertible notes, in a manner that reflects the issuer’s economic interest cost. The effect of the accounting treatment for such instruments is that the value of such embedded conversion option would be treated as original issue discount for purposes of accounting for the debt component of the convertible notes, and that original issue discount is amortized into interest expense over the term of the convertible notes using an effective yield method. As a result, we will be
26
required to record a greater amount of non-cash interest expense as a consequence of the amortization of the original issue discount to face amount of the convertible notes over the respective terms of the convertible notes and as a consequence of the amortization of the debt issuance costs. Accordingly, we will report lower net income in our financial results because of the recognition of both the current period’s amortization of the debt discount and the coupon interest of the convertible notes, which could adversely affect our reported or future financial results and the trading price of our common stock.
Under certain circumstances, convertible debt instruments (such as our convertible notes) that may be settled entirely or partially in cash are evaluated for their impact on earnings per share utilizing the treasury stock method, the effect of which is that any shares issuable upon conversion of the convertible notes are not included in the calculation of diluted earnings per share except to the extent that the conversion value of the convertible notes exceeds their respective principal amount. Under the treasury stock method, for diluted earnings per share purposes, the convertible debt instrument is accounted for as if the number of shares of common stock that would be necessary to settle such excess, if we elected to settle such excess in shares, are issued. We cannot be certain that the accounting standards in the future will continue to permit the use of the treasury stock method, as is currently the case with our convertible notes. If we are unable to use the treasury stock method in accounting for any shares issuable upon conversion of our convertible notes, then our diluted earnings per share could be further adversely affected. In addition, if the conditional conversion feature of our convertible notes is triggered, even if holders of such notes do not elect to convert their notes, we could be required under applicable accounting rules to reclassify all or a portion of the outstanding principal of such notes as a current rather than long-term liability, which could result in a reduction of our net working capital.
Provisions in our charter documents and Delaware law may delay or prevent acquisition of us, which could decrease the value of shares of our common stock.
Our certificate of incorporation and bylaws and Delaware law contain provisions that could make it more difficult for a third party to acquire us without the consent of our Board of Directors. These provisions include advance notice provisions, limitations on actions by our stockholders by written consent and special approval requirements for transactions involving interested stockholders. We are authorized to issue up to five million shares of preferred stock, the relative rights and preferences of which may be fixed by our Board of Directors, subject to the provisions of our articles of incorporation, without stockholder approval. The issuance of preferred stock could be used to dilute the stock ownership of a potential hostile acquirer. The provisions that discourage potential acquisitions of us and adversely affect the voting power of the holders of common stock may adversely affect the price of our common stock and the value of the Convertible Notes.
We do not intend to pay dividends on our common stock for the foreseeable future.
We have never declared or paid cash dividends on our common stock. In addition, we must comply with the covenants in our credit facilities if we want to pay cash dividends. We currently intend to retain our future earnings, if any, to finance the further development and expansion of our business and do not intend to pay cash dividends in the foreseeable future. Any future determination to pay dividends will be at the discretion of our Board of Directors and will depend upon our financial condition, operating results, capital requirements, restrictions contained in current or future financing instruments and such other factors as our Board of Directors deems relevant. As a result, receiving a return on an investment in Encore’s common stock may only occur if the trading price of our common stock increases.
Item 1B—Unresolved Staff Comments
None.
27
Item 2—Properties
We lease the following properties with more than 30,000 square feet:
Location | Primary use | Approximate square footage | |||
San Diego, CA | Corporate headquarters, internal legal and consumer support services | 118,000 | |||
India | Call center and administrative offices | 146,000 | |||
United Kingdom | Cabot corporate office, call center, internal legal and consumer support services | 83,000 | |||
Troy, MI | Call center and internal legal | 62,000 | |||
St. Cloud, MN | Call center | 46,000 | |||
Roanoke, VA | Call center and administrative offices | 40,000 | |||
Spain | Call center and administrative offices | 39,000 | |||
Costa Rica | Call center and administrative offices | 32,000 | |||
Phoenix, AZ | Call center and administrative offices | 31,000 | |||
Australia | Baycorp corporate office, call center, and administrative offices | 31,000 | |||
The properties listed in the table above are our principal properties. We also lease other immaterial office space in the United States, Ireland, France, Colombia, Peru, New Zealand, and the Philippines.
We believe that our current leased facilities are generally well maintained and in good operating condition. We believe that these facilities are suitable and sufficient for our operational needs. Our policy is to improve, replace, and supplement the facilities as considered appropriate to meet the needs of our operations.
Item 3—Legal Proceedings
Information with respect to this item may be found in Note 14, “Commitments and Contingencies” to the consolidated financial statements in Item 8, which is incorporated herein by reference.
Item 4—Mine Safety Disclosures
Not applicable.
28
PART II
Item 5—Market for the Registrant’s Common Equity, Related Stockholder Matters and Issuer Purchases of Equity Securities
Our common stock is traded on the NASDAQ Global Select Market under the symbol “ECPG.”
The high and low sales prices of our common stock, as reported by NASDAQ Global Select Market for each quarter during our two most recent fiscal years, are reported below:
Market Price | |||||||
High | Low | ||||||
Fiscal Year 2016 | |||||||
First Quarter | $ | 29.44 | $ | 16.09 | |||
Second Quarter | 29.02 | 21.45 | |||||
Third Quarter | 25.52 | 20.32 | |||||
Fourth Quarter | 30.40 | 17.66 | |||||
Fiscal Year 2015 | |||||||
First Quarter | $ | 44.66 | $ | 36.40 | |||
Second Quarter | 44.61 | 37.89 | |||||
Third Quarter | 44.43 | 35.31 | |||||
Fourth Quarter | 41.44 | 28.17 | |||||
The closing price of our common stock on February 9, 2017, was $33.20 per share and there were 10 stockholders of record. Because many of our shares of common stock are held by brokers and other institutions on behalf of stockholders, we are unable to estimate the total number of beneficial owners of our stock represented by these stockholders of record.
Performance Graph
The following performance graph and related information shall not be deemed “soliciting material” or “filed” with the SEC, nor shall such information be incorporated by reference into any future filing under the Securities Act of 1933 or Securities Exchange Act of 1934, each, as amended, except to the extent that we specifically incorporate it by reference into such filing.
The following graph compares the total cumulative stockholder return on our common stock for the period from December 31, 2011 through December 31, 2016, with the cumulative total return of (a) the NASDAQ Composite Index and (b) Asta Funding, Inc. and PRA Group, Inc., which we believe are comparable companies. The comparison assumes that $100 was invested on December 31, 2011, in our common stock and in each of the comparison indices (including reinvestment of dividends). The stock price performance reflected in the following graph is not necessarily indicative of future stock price performance.
29
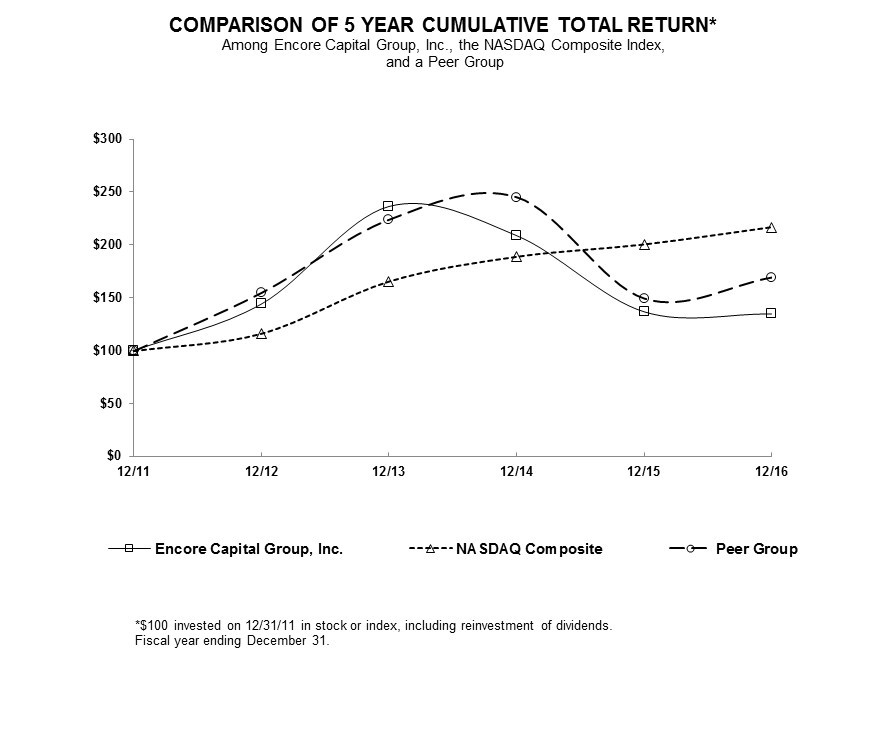
12/11 | 12/12 | 12/13 | 12/14 | 12/15 | 12/16 | ||||||||||||||||||
Encore Capital Group, Inc. | $ | 100.00 | $ | 144.03 | $ | 236.41 | $ | 208.84 | $ | 136.78 | $ | 134.76 | |||||||||||
NASDAQ Composite Index | $ | 100.00 | $ | 116.41 | $ | 165.47 | $ | 188.69 | $ | 200.32 | $ | 216.54 | |||||||||||
Peer Group | $ | 100.00 | $ | 154.84 | $ | 223.78 | $ | 244.82 | $ | 149.47 | $ | 169.32 | |||||||||||
Dividend Policy
As a public company, we have never declared or paid dividends on our common stock. However, the declaration, payment, and amount of future dividends, if any, is subject to the discretion of our board of directors, which may review our dividend policy from time to time in light of the then existing relevant facts and circumstances. Under the terms of our revolving credit facility, we are permitted to declare and pay dividends in an amount not to exceed, during any fiscal year, 20% of our audited consolidated net income for the then most recently completed fiscal year, so long as no default or unmatured default under the facility has occurred and is continuing or would arise as a result of the dividend payment. We may also be subject to additional dividend restrictions under future debt agreements or the terms of securities we may issue in the future.
30
Share Repurchases
On August 12, 2015, our Board of Directors approved a $50.0 million share repurchase program. Repurchases under this program are expected to be made with cash on hand and may be made from time to time, subject to market conditions and other factors, in the open market, through private transactions, block transactions, or other methods as determined by the management and our Board of Directors, and in accordance with market conditions, other corporate considerations, and applicable regulatory requirements. The program does not obligate the Company to acquire any particular amount of common stock, and it may be modified or suspended at any time at the Company’s discretion. We did not make any repurchases under the share repurchase program.
31
Item 6—Selected Financial Data
This table presents selected historical financial data of Encore Capital Group, Inc. and its consolidated subsidiaries. This information should be carefully considered in conjunction with the consolidated financial statements and notes thereto appearing elsewhere in this Annual Report on Form 10-K, including the acquisitions described therein that materially affected our results. The selected financial data in this section are not intended to replace the consolidated financial statements. The selected financial data (except for “Selected Operating Data”) in the table below, as of December 31, 2014, 2013 and 2012 and for the years ended December 31, 2013 and 2012, were derived from our audited consolidated financial statements not included in this Annual Report on Form 10-K. The selected financial data as of December 31, 2016, and 2015 and for the years ended December 31, 2016, 2015, and 2014, were derived from our audited consolidated financial statements included elsewhere in this Annual Report on Form 10-K. The Selected Operating Data were derived from our books and records (in thousands, except per share data):
As of and For The Year Ended December 31, | |||||||||||||||||||
2016 | 2015 | 2014 | 2013 | 2012 | |||||||||||||||
Revenues | |||||||||||||||||||
Revenue from receivable portfolios, net(1) | $ | 946,615 | $ | 1,072,436 | $ | 992,832 | $ | 744,870 | $ | 545,412 | |||||||||
Other revenues | 82,643 | 57,531 | 50,597 | 11,407 | 7 | ||||||||||||||
Total revenues | 1,029,258 | 1,129,967 | 1,043,429 | 756,277 | 545,419 | ||||||||||||||
Operating expenses | |||||||||||||||||||
Salaries and employee benefits | 281,097 | 262,281 | 238,942 | 159,319 | 98,173 | ||||||||||||||
Cost of legal collections | 200,855 | 229,847 | 205,661 | 186,959 | 168,703 | ||||||||||||||
Other operating expenses | 100,737 | 93,210 | 89,934 | 63,229 | 47,500 | ||||||||||||||
Collection agency commissions | 36,141 | 37,858 | 33,343 | 33,097 | 15,332 | ||||||||||||||
General and administrative expenses | 134,046 | 191,357 | 139,977 | 106,813 | 60,466 | ||||||||||||||
Depreciation and amortization | 34,868 | 33,160 | 27,101 | 13,057 | 5,580 | ||||||||||||||
Total operating expenses | 787,744 | 847,713 | 734,958 | 562,474 | 395,754 | ||||||||||||||
Income from operations | 241,514 | 282,254 | 308,471 | 193,803 | 149,665 | ||||||||||||||
Other (expense) income | |||||||||||||||||||
Interest expense | (198,367 | ) | (186,556 | ) | (166,942 | ) | (73,269 | ) | (25,564 | ) | |||||||||
Other income (expense) | 14,228 | 2,235 | 113 | (4,225 | ) | 800 | |||||||||||||
Total other expense | (184,139 | ) | (184,321 | ) | (166,829 | ) | (77,494 | ) | (24,764 | ) | |||||||||
Income from continuing operations before income taxes | 57,375 | 97,933 | 141,642 | 116,309 | 124,901 | ||||||||||||||
Provision for income taxes | (38,205 | ) | (27,162 | ) | (48,569 | ) | (43,653 | ) | (49,832 | ) | |||||||||
Income from continuing operations | 19,170 | 70,771 | 93,073 | 72,656 | 75,069 | ||||||||||||||
(Loss) income from discontinued operations, net of tax | (2,353 | ) | (23,387 | ) | 5,205 | 1,084 | (5,592 | ) | |||||||||||
Net income | 16,817 | 47,384 | 98,278 | 73,740 | 69,477 | ||||||||||||||
Net loss (income) attributable to noncontrolling interest | 59,753 | (2,249 | ) | 5,448 | 1,559 | — | |||||||||||||
Net income attributable to Encore Capital Group, Inc. stockholders | $ | 76,570 | $ | 45,135 | $ | 103,726 | $ | 75,299 | $ | 69,477 | |||||||||
Amounts attributable to Encore Capital Group, Inc.: | |||||||||||||||||||
Income from continuing operations | 78,923 | 68,522 | 98,521 | 74,215 | 75,069 | ||||||||||||||
(Loss) income from discontinued operations, net of tax | (2,353 | ) | (23,387 | ) | 5,205 | 1,084 | (5,592 | ) | |||||||||||
Net income | $ | 76,570 | $ | 45,135 | $ | 103,726 | $ | 75,299 | $ | 69,477 | |||||||||
32
As of and For The Year Ended December 31, | |||||||||||||||||||
2016 | 2015 | 2014 | 2013 | 2012 | |||||||||||||||
Earnings (loss) per share attributable to Encore Capital Group, Inc.: | |||||||||||||||||||
Basic earnings (loss) per share from: | |||||||||||||||||||
Continuing operations | $ | 3.07 | $ | 2.66 | $ | 3.81 | $ | 3.01 | $ | 3.02 | |||||||||
Discontinued operations | $ | (0.09 | ) | $ | (0.91 | ) | $ | 0.20 | $ | 0.04 | $ | (0.22 | ) | ||||||
Net basic earnings per share | $ | 2.98 | $ | 1.75 | $ | 4.01 | $ | 3.05 | $ | 2.80 | |||||||||
Diluted earnings (loss) per share from: | |||||||||||||||||||
Continuing operations | $ | 3.05 | $ | 2.57 | $ | 3.58 | $ | 2.83 | $ | 2.91 | |||||||||
Discontinued operations | $ | (0.09 | ) | $ | (0.88 | ) | $ | 0.19 | $ | 0.04 | $ | (0.22 | ) | ||||||
Net diluted earnings per share | $ | 2.96 | $ | 1.69 | $ | 3.77 | $ | 2.87 | $ | 2.69 | |||||||||
Weighted-average shares outstanding: | |||||||||||||||||||
Basic | 25,713 | 25,722 | 25,853 | 24,659 | 24,855 | ||||||||||||||
Diluted | 25,909 | 26,647 | 27,495 | 26,204 | 25,836 | ||||||||||||||
Selected operating data: | |||||||||||||||||||
Purchases of receivable portfolios, at cost | $ | 906,719 | $ | 1,023,722 | $ | 1,251,360 | $ | 1,204,779 | $ | 562,335 | |||||||||
Gross collections for the period | 1,685,604 | 1,700,725 | 1,607,497 | 1,279,506 | 948,055 | ||||||||||||||
Consolidated statements of financial condition data: | |||||||||||||||||||
Cash and cash equivalents | $ | 149,765 | $ | 123,993 | $ | 91,519 | $ | 118,539 | $ | 15,915 | |||||||||
Investment in receivable portfolios, net | 2,382,809 | 2,440,669 | 2,143,560 | 1,590,249 | 873,119 | ||||||||||||||
Total assets | 3,670,497 | 4,174,819 | 3,711,631 | 2,657,208 | 1,157,584 | ||||||||||||||
Total debt | 2,805,983 | 2,944,063 | 2,550,646 | 1,654,301 | 574,679 | ||||||||||||||
Total liabilities | 3,069,982 | 3,526,331 | 3,046,692 | 2,054,737 | 751,768 | ||||||||||||||
Total Encore equity | 559,304 | 596,453 | 623,000 | 571,897 | 405,816 | ||||||||||||||
________________________
(1) | Includes net allowance charge of $84.2 million for the year ended December 31, 2016, and net allowance reversals of $6.8 million, $17.4 million, $12.2 million and $4.2 million for the years ended December 31, 2015, 2014, 2013 and 2012, respectively. |
33
Item 7—Management’s Discussion and Analysis of Financial Condition and Results of Operations
This Annual Report on Form 10-K contains “forward-looking statements” relating to Encore Capital Group, Inc. (“Encore”) and its subsidiaries (which we may collectively refer to as the “Company,” “we,” “our” or “us”) within the meaning of the securities laws. The words “believe,” “expect,” “anticipate,” “estimate,” “project,” “intend,” “plan,” “will,” “may,” and similar expressions often characterize forward-looking statements. These statements may include, but are not limited to, projections of collections, revenues, income or loss, estimates of capital expenditures, plans for future operations, products or services, and financing needs or plans, as well as assumptions relating to these matters. Although we believe that the expectations reflected in these forward-looking statements are reasonable, we caution that these expectations or predictions may not prove to be correct or we may not achieve the financial results, savings or other benefits anticipated in the forward-looking statements. These forward-looking statements are necessarily estimates reflecting the best judgment of our senior management and involve a number of risks and uncertainties, some of which may be beyond our control or cannot be predicted or quantified, that could cause actual results to differ materially from those suggested by the forward-looking statements. Many factors including, but not limited to, those set forth in this Annual Report on Form 10-K under “Part I, Item 1A. Risk Factors,” could cause our actual results, performance, achievements, or industry results to be very different from the results, performance, achievements or industry results expressed or implied by these forward-looking statements. Our business, financial condition, or results of operations could also be materially and adversely affected by other factors besides those listed. Forward-looking statements speak only as of the date the statements were made. We do not undertake any obligation to update or revise any forward-looking statements to reflect new information or future events, or for any other reason, even if experience or future events make it clear that any expected results expressed or implied by these forward-looking statements will not be realized. In addition, it is generally our policy not to make any specific projections as to future earnings, and we do not endorse projections regarding future performance that may be made by third parties.
Our Business and Operating Segments
We are an international specialty finance company providing debt recovery solutions and other related services for consumers across a broad range of financial assets. We purchase portfolios of defaulted consumer receivables at deep discounts to face value and manage them by working with individuals as they repay their obligations and work toward financial recovery. Defaulted receivables are consumers’ unpaid financial commitments to credit originators, including banks, credit unions, consumer finance companies, commercial retailers, and telecommunication companies. Defaulted receivables may also include receivables subject to bankruptcy proceedings. Through certain subsidiaries, we are a market leader in portfolio purchasing and recovery in the United States, including Puerto Rico. Our subsidiary, Janus Holdings Luxembourg S.a.r.l. (“Janus Holdings”), through its indirectly held U.K.-based subsidiary Cabot Credit Management Limited and its subsidiaries (collectively, “Cabot”), is a market leader in credit management services in the United Kingdom, historically specializing in portfolios consisting of higher balance, semi-performing accounts (i.e., debt portfolios in which over 50% of the accounts have received a payment in three of the last four months immediately prior to the portfolio purchase). Cabot expanded in the United Kingdom with its consolidating acquisition of Hillesden Securities Ltd and its subsidiaries (“dlc”) in June 2015. Our subsidiary, Grove Holdings (“Grove”), is a U.K.-based leading specialty investment firm focused on consumer non-performing loans, including insolvencies (in particular, individual voluntary arrangements, or “IVAs”) in the United Kingdom and bank and non-bank receivables in Spain. Our majority-owned subsidiary, Refinancia S.A. (“Refinancia”), through its subsidiaries, is a market leader in debt collection and management in Colombia and Peru. Our majority-owned subsidiary, Baycorp Holdings Pty Limited (“Baycorp”), is one of Australasia's leading debt resolution specialists.
On March 31, 2016, we completed the divestiture of our membership interests in Propel Acquisition LLC (“Propel”). Propel represented our entire tax lien business reportable segment prior to the divestiture. Propel’s operations are presented as discontinued operations in our consolidated statements of income. Beginning in the first quarter 2016, we conduct business through one reportable segment, portfolio purchasing and recovery.
In the first quarter of 2017, we and our co-investor in Cabot, J.C. Flowers & Co. LLC (“J.C. Flowers”), began exploring options in relation to a potential initial public offering by Cabot.
Our long-term growth strategy involves continuing to invest in our core portfolio purchasing and recovery business, expanding into new geographies, and leveraging our core competencies to explore expansion into adjacent asset classes.
Government Regulation
Our U.S. debt purchasing business and collection activities are subject to federal, state and municipal statutes, rules, regulations and ordinances that establish specific guidelines and procedures that debt purchasers and collectors must follow when collecting consumer accounts, including among others, specific guidelines and procedures for communicating with consumers and prohibitions on unfair, deceptive or abusive debt collection practices. Additionally, our international operations
34
are affected by foreign statutes, rules and regulations regarding debt collection and debt purchase activities. These statutes, rules, regulations, ordinances, guidelines and procedures are modified from time to time by the relevant authorities charged with their administration, which could affect the way we conduct our business. See “Part I - Item 1 - Business - Government Regulation” in this Annual Report on Form 10-K.
Portfolio Purchasing and Recovery
United States
We purchase receivables based on robust, account-level valuation methods and employ proprietary statistical and behavioral models across our U.S. operations. These methods and models allow us to value portfolios accurately (and limit the risk of overpaying), avoid buying portfolios that are incompatible with our methods or goals and align the accounts we purchase with our business channels to maximize future collections. As a result, we have been able to realize significant returns from the receivables we acquire. We maintain strong relationships with many of the largest financial service providers in the United States.
While seasonality does not have a material impact on our business, collections are generally strongest in our first calendar quarter, slower in the second and third calendar quarters, and slowest in the fourth calendar quarter. Relatively higher collections in the first quarter could result in a lower cost-to-collect ratio compared to the other quarters, as our fixed costs are relatively constant and applied against a larger collection base. The seasonal impact on our business may also be influenced by our purchasing levels, the types of portfolios we purchase, and our operating strategies.
Collection seasonality can also affect revenue as a percentage of collections, also referred to as our revenue recognition rate. Generally, revenue for each pool group declines steadily over time, whereas collections can fluctuate from quarter to quarter based on seasonality, as described above. In quarters with lower collections (e.g., the fourth calendar quarter), the revenue recognition rate can be higher than in quarters with higher collections (e.g., the first calendar quarter).
In addition, seasonality could have an impact on the relative level of quarterly earnings. In quarters with stronger collections, total costs are higher as a result of the additional efforts required to generate those collections. Since revenue for each pool group declines steadily over time, in quarters with higher collections and higher costs (e.g., the first calendar quarter), all else being equal, earnings could be lower than in quarters with lower collections and lower costs (e.g., the fourth calendar quarter). Additionally, in quarters where a greater percentage of collections come from our legal and agency outsourcing channels, cost to collect will be higher than if there were more collections from our internal collection sites.
Europe
Cabot: Through Cabot, we purchase paying and non-paying receivable portfolios using a proprietary pricing model that utilizes account-level statistical and behavioral data. This model allows Cabot to value portfolios with a high degree of accuracy and quantify portfolio performance in order to maximize future collections. As a result, Cabot has been able to realize significant returns from the assets it has acquired. Cabot maintains strong relationships with many of the largest financial services providers in the United Kingdom and continues to expand in the United Kingdom and the rest of Europe with its acquisitions of portfolios and other credit management services providers.
While seasonality does not have a material impact on Cabot’s operations, collections are generally strongest in the second and third calendar quarters and slower in the first and fourth quarters, largely driven by the impact of the December holiday season and the New Year holiday, and the related impact on its customers’ ability to repay their balances. This drives a higher level of plan defaults over this period, which are typically repaired across the first quarter of the following year. The August vacation season in the United Kingdom also has an unfavorable effect on the level of collections, but this is traditionally compensated for by higher collections in July and September.
Grove: In April 2014, we acquired a controlling equity ownership interest in Grove. In December 2016, we acquired the remaining minority equity ownership interest in Grove. Grove, through its subsidiaries and affiliates, is a leading specialty investment firm focused on consumer non-performing loans, including insolvencies (in particular, IVAs) in the United Kingdom and bank and non-bank receivables in Spain. Grove purchases portfolio receivables using a proprietary pricing model. This model allows Grove to value portfolios and quantify portfolio performance in order to maximize future collections.
Latin America
In December 2013, we acquired a majority ownership interest in Refinancia, a market leader in debt collection and management in Colombia and Peru. In addition to purchasing defaulted receivables, Refinancia offers portfolio management services to banks for non-performing loans. Refinancia also specializes in non-traditional niches in the geographic areas in which it operates, including point-of-purchase lending to consumers and providing financial solutions to individuals who have
35
previously defaulted on their credit obligations. In addition to operations in Colombia and Peru, we evaluate and purchase non-performing loans in other countries in Latin America, including Mexico and Brazil. We also invest in non-performing secured residential mortgages in Latin America.
Asia Pacific
Through our acquisition of a majority ownership interest in Baycorp in October 2015 (the “Baycorp Acquisition”), we are one of Australasia’s leading debt resolution specialists. Baycorp specializes in the management of non-performing loans in Australia and New Zealand. In addition to purchasing defaulted receivables, Baycorp offers portfolio management services to banks for non-performing loans.
Purchases and Collections
Portfolio Pricing, Supply and Demand
United States
Prices for portfolios offered for sale directly from credit issuers are beginning to decrease after several years of elevated pricing, especially for fresh portfolios. Fresh portfolios are portfolios that are generally transacted within six months of the consumer’s account being charged-off by the financial institution. Industry delinquency and charge-off rates, which have been at historic lows, are beginning to increase which creates higher volumes of charged-off accounts. We believe the softening in pricing, especially for fresh portfolios, is primarily due to this anticipated growth in supply.
We believe that smaller competitors continue to face difficulties in the portfolio purchasing market because of the high cost to operate due to regulatory pressure and because issuers are being more selective with buyers in the marketplace, resulting in consolidation within the portfolio purchasing and recovery industry. We believe this favors larger participants in this market, such as Encore, because the larger market participants are better able to adapt to these pressures. Furthermore, as smaller competitors limit their participation in or exit the market, it may provide additional opportunities for Encore to purchase portfolios from competitors or to acquire competitors directly.
Europe
The U.K. market for charged-off portfolios has grown significantly in recent years driven by a consolidation of sellers and a material backlog of portfolio coming to market from credit issuers who are selling an increasing proportion of their non-performing loans. Prices for portfolios offered for sale directly from credit issuers remain at levels higher than historical averages. We expect that as a result of an increase in available funding to industry participants, and lower return requirements for certain debt purchasers, pricing will remain elevated.
The U.K. insolvency market as a whole has remained flat over the past twelve months, although we are seeing an increase in individual insolvencies driven by high unemployment rates. We expect that this trend will drive increased purchasing opportunities once large retail banks start to off-load their insolvency portfolios.
The Spanish debt market continues to be one of the largest in Europe with a significant amount of debt to be sold and serviced. In particular, we anticipate strong debt purchasing and servicing opportunities in the secured and small and medium enterprise asset classes given the backlog of non-performing debt that has accumulated in these sectors. Additionally, financial institutions continue to experience both market and regulatory pressure to dispose of non-performing loans which should further increase debt purchasing opportunities in Spain.
Although pricing has been elevated, we believe that as our U.K. businesses increase in scale and expand to other European markets, and with anticipated improvements in liquidation and improved efficiencies in collections, our margins will remain competitive. Additionally, Cabot’s continuing investment in its litigation liquidation channel has enabled them to collect from consumers who have the ability to pay, but have so far been unwilling to do so.
36
Purchases by Type and Geographic Location
The following table summarizes the types and geographic locations of consumer receivable portfolios we purchased during the periods presented (in thousands):
Year Ended December 31, | |||||||||||
2016 | 2015 | 2014 | |||||||||
United States: | |||||||||||
Credit card | $ | 517,590 | $ | 481,759 | $ | 525,813 | |||||
Consumer bankruptcy receivables | 43,953 | 24,373 | — | ||||||||
Subtotal | 561,543 | 506,132 | 525,813 | ||||||||
Europe: | |||||||||||
Credit card | 237,473 | 396,364 | 622,419 | ||||||||
Other | 27,240 | 27,200 | 9,837 | ||||||||
Subtotal | 264,713 | 423,564 | 632,256 | ||||||||
Other geographies: | |||||||||||
Credit card | 70,902 | 86,638 | 36,537 | ||||||||
Mortgages | — | 5,440 | 56,754 | ||||||||
Other | 9,561 | 1,948 | — | ||||||||
Subtotal | 80,463 | 94,026 | 93,291 | ||||||||
Total purchases | $ | 906,719 | $ | 1,023,722 | $ | 1,251,360 | |||||
During the year ended December 31, 2016, we invested $0.9 billion to acquire portfolios, primarily charged-off credit card portfolios, with face values aggregating $9.8 billion, for an average purchase price of 9.2% of face value.
During the year ended December 31, 2015, we invested $1.0 billion to acquire portfolios, primarily charged-off credit card portfolios, with face values aggregating $12.7 billion, for an average purchase price of 8.0% of face value. Purchases of charged-off credit card portfolios in Europe include $216.0 million of receivables acquired in connection with the acquisition of dlc. Purchases of charged-off credit card portfolios in other geographies include $60.3 million acquired in connection with the acquisition of Baycorp.
During the year ended December 31, 2014, we invested $1.3 billion to acquire portfolios, primarily charged-off credit card portfolios, with face values aggregating $13.8 billion, for an average purchase price of 9.1% of face value. Purchases of charged-off credit card portfolios in the United States include $105.4 million acquired in connection with the acquisition of Atlantic Credit & Finance, Inc. (“Atlantic”). Purchases of charged-off credit card portfolios in Europe include $208.5 million in connection with Cabot’s acquisition of Marlin Financial Group Limited (“Marlin”).
The increase in capital deployment in the United States for the year ended December 31, 2016, as compared to 2015, was primarily the result of increased purchasing volume due to the improved pricing environment. The decrease in capital deployment in Europe for the year ended December 31, 2016, as compared to 2015, was due to the $216.0 million of receivable portfolios acquired in connection with the acquisition of dlc in June 2015. Excluding the portfolios acquired in connection with the acquisition of dlc, capital deployment in Europe increased during the year ended December 31, 2016 as compared to 2015, primarily as a result of Cabot’s investment in Spain, France and Portugal as part of its European expansion strategy.
The average purchase price, as a percentage of face value, varies from period to period depending on, among other factors, the quality of the accounts purchased and the length of time from charge-off to the time we purchase the portfolios. Additionally, the improved pricing environment has not materialized to blend down the average purchase price as a percentage of face value in the United States.
37
Collections by Channel and Geographic Location
We currently utilize three channels for the collection of our receivables: collection sites, legal collections and collection agencies. The collection sites channel consists of collections that result from our call centers, direct mail program and online collections. The legal collections channel consists of collections that result from our internal legal channel or from our network of retained law firms. The collection agencies channel consists of collections from third-party collection agencies that we utilize when we believe they can liquidate better or less expensively than we can, or to supplement capacity in our internal call centers. The following table summarizes the total collections by collection channel and geographic area (in thousands):
Year Ended December 31, | |||||||||||
2016 | 2015 | 2014 | |||||||||
United States: | |||||||||||
Collection sites | $ | 470,898 | $ | 480,485 | $ | 502,829 | |||||
Legal collections | 557,250 | 633,166 | 610,285 | ||||||||
Collection agencies(1) | 53,572 | 68,283 | 79,699 | ||||||||
Subtotal | 1,081,720 | 1,181,934 | 1,192,813 | ||||||||
Europe: | |||||||||||
Collection sites | 250,036 | 234,904 | 221,771 | ||||||||
Legal collections | 122,392 | 92,464 | 42,456 | ||||||||
Collection agencies | 121,572 | 148,758 | 120,629 | ||||||||
Subtotal | 494,000 | 476,126 | 384,856 | ||||||||
Other geographies: | |||||||||||
Collection sites | 79,680 | 38,334 | 29,828 | ||||||||
Legal collections | 9,936 | 1,145 | — | ||||||||
Collection agencies | 20,268 | 3,186 | — | ||||||||
Subtotal | 109,884 | 42,665 | 29,828 | ||||||||
Total collections | $ | 1,685,604 | $ | 1,700,725 | $ | 1,607,497 | |||||
(1) | Collections through our collection agency channel in the United States include accounts subject to bankruptcy filings collected by others. Additionally, collection agency collections often include accounts purchased from a competitor where we maintain the collection agency servicing until the accounts can be recalled and placed in our collection channels. |
Gross collections decreased slightly by $15.1 million, or 0.9%, to $1,685.6 million during the year ended December 31, 2016, from $1,700.7 million during the year ended December 31, 2015. The decrease was primarily due to decreased collections in the United States, offset by increased collections in Europe and other geographies. The increase in collections in Europe was primarily the result of increased site collections and legal collections, offset by a decrease in collection agencies collections. As we continue to expand and enhance our in-house servicing capabilities in Europe, we expect collections to shift from collection agencies to collection sites and legal collections. The increase in legal collections was primarily due to an increase in the accounts placed in the legal channel as we continuously improve our ability to identify consumers that are able, but unwilling, to pay their obligations. The increase in collections in Europe was partially offset by the unfavorable impact of foreign currency translation, primarily driven by the weakening of the British Pound against the U.S. dollar. In other geographies collections continue to increase as we expand internationally. The decrease of collections in the United States was primarily due to a decrease in legal collections resulting from temporary delays in receiving media from issuers required to initiate the legal process for a number of accounts.
Gross collections increased $93.2 million, or 5.8%, to $1,700.7 million during the year ended December 31, 2015, from $1,607.5 million during the year ended December 31, 2014. The increase in gross collections was primarily due to increased portfolio purchases in the current and prior years and additional collections from our acquired subsidiaries.
38
Results of Operations
Results of operations, in dollars and as a percentage of total revenues, were as follows (in thousands, except percentages):
Year Ended December 31, | ||||||||||||||||||||
2016 | 2015 | 2014 | ||||||||||||||||||
Revenues | ||||||||||||||||||||
Revenue from receivable portfolios, net | $ | 946,615 | 92.0 | % | $ | 1,072,436 | 94.9 | % | $ | 992,832 | 95.2 | % | ||||||||
Other revenues | 82,643 | 8.0 | % | 57,531 | 5.1 | % | 50,597 | 4.8 | % | |||||||||||
Total revenues | 1,029,258 | 100.0 | % | 1,129,967 | 100.0 | % | 1,043,429 | 100.0 | % | |||||||||||
Operating expenses | ||||||||||||||||||||
Salaries and employee benefits | 281,097 | 27.3 | % | 262,281 | 23.2 | % | 238,942 | 22.9 | % | |||||||||||
Cost of legal collections | 200,855 | 19.5 | % | 229,847 | 20.3 | % | 205,661 | 19.7 | % | |||||||||||
Other operating expenses | 100,737 | 9.8 | % | 93,210 | 8.2 | % | 89,934 | 8.6 | % | |||||||||||
Collection agency commissions | 36,141 | 3.5 | % | 37,858 | 3.5 | % | 33,343 | 3.2 | % | |||||||||||
General and administrative expenses | 134,046 | 13.0 | % | 191,357 | 16.9 | % | 139,977 | 13.4 | % | |||||||||||
Depreciation and amortization | 34,868 | 3.4 | % | 33,160 | 2.9 | % | 27,101 | 2.6 | % | |||||||||||
Total operating expenses | 787,744 | 76.5 | % | 847,713 | 75.0 | % | 734,958 | 70.4 | % | |||||||||||
Income from operations | 241,514 | 23.5 | % | 282,254 | 25.0 | % | 308,471 | 29.6 | % | |||||||||||
Other (expense) income | ||||||||||||||||||||
Interest expense | (198,367 | ) | (19.3 | )% | (186,556 | ) | (16.5 | )% | (166,942 | ) | (16.0 | )% | ||||||||
Other income | 14,228 | 1.4 | % | 2,235 | 0.2 | % | 113 | 0.0 | % | |||||||||||
Total other expense | (184,139 | ) | (17.9 | )% | (184,321 | ) | (16.3 | )% | (166,829 | ) | (16.0 | )% | ||||||||
Income from continuing operations before income taxes | 57,375 | 5.6 | % | 97,933 | 8.7 | % | 141,642 | 13.6 | % | |||||||||||
Provision for income taxes | (38,205 | ) | (3.7 | )% | (27,162 | ) | (2.4 | )% | (48,569 | ) | (4.7 | )% | ||||||||
Income from continuing operations | 19,170 | 1.9 | % | 70,771 | 6.3 | % | 93,073 | 8.9 | % | |||||||||||
(Loss) income from discontinued operations, net of tax | (2,353 | ) | (0.3 | )% | (23,387 | ) | (2.1 | )% | 5,205 | 0.5 | % | |||||||||
Net income | 16,817 | 1.6 | % | 47,384 | 4.2 | % | 98,278 | 9.4 | % | |||||||||||
Net loss (income) attributable to noncontrolling interest | 59,753 | 5.8 | % | (2,249 | ) | (0.2 | )% | 5,448 | 0.5 | % | ||||||||||
Net income attributable to Encore Capital Group, Inc. stockholders | $ | 76,570 | 7.4 | % | $ | 45,135 | 4.0 | % | $ | 103,726 | 9.9 | % | ||||||||
39
Results of Operations—Cabot
The following tables summarize the operating results contributed by Cabot during the periods presented (in thousands):
Year Ended December 31, 2016 | |||||||||||
Janus Holdings | Encore Europe (1) | Consolidated | |||||||||
Total revenues | $ | 242,114 | $ | — | $ | 242,114 | |||||
Total operating expenses | (197,341 | ) | — | (197,341 | ) | ||||||
Income from operations | 44,773 | — | 44,773 | ||||||||
Interest expense-non-PEC | (109,178 | ) | — | (109,178 | ) | ||||||
PEC interest (expense) income | (47,646 | ) | 23,349 | (24,297 | ) | ||||||
Other income | 15,270 | — | 15,270 | ||||||||
(Loss) income before income taxes | (96,781 | ) | 23,349 | (73,432 | ) | ||||||
Provision for income taxes | 12,073 | — | 12,073 | ||||||||
Net (loss) income | (84,708 | ) | 23,349 | (61,359 | ) | ||||||
Net loss attributable to noncontrolling interest | 11,863 | 36,350 | 48,213 | ||||||||
Net (loss) income attributable to Encore | $ | (72,845 | ) | $ | 59,699 | $ | (13,146 | ) | |||
Year Ended December 31, 2015 | |||||||||||
Janus Holdings | Encore Europe(1) | Consolidated | |||||||||
Total revenues | $ | 349,379 | $ | — | $ | 349,379 | |||||
Total operating expenses | (188,296 | ) | — | (188,296 | ) | ||||||
Income from operations | 161,083 | — | 161,083 | ||||||||
Interest expense-non-PEC | (106,318 | ) | — | (106,318 | ) | ||||||
PEC interest (expense) income | (48,013 | ) | 23,529 | (24,484 | ) | ||||||
Other income | 591 | — | 591 | ||||||||
Income before income taxes | 7,343 | 23,529 | 30,872 | ||||||||
Provision for income taxes | 1,294 | — | 1,294 | ||||||||
Net income | 8,637 | 23,529 | 32,166 | ||||||||
Net income attributable to noncontrolling interest | (1,211 | ) | (3,705 | ) | (4,916 | ) | |||||
Net income attributable to Encore | $ | 7,426 | $ | 19,824 | $ | 27,250 | |||||
________________________
(1) | Includes only the results of operations related to Janus Holdings and therefore does not represent the complete financial performance of Encore Europe. |
40
Year Ended December 31, 2014 | |||||||||||
Janus Holdings | Encore Europe(1) | Consolidated | |||||||||
Total revenues | $ | 286,630 | $ | — | $ | 286,630 | |||||
Total operating expenses | (150,349 | ) | — | (150,349 | ) | ||||||
Income from operations | 136,281 | — | 136,281 | ||||||||
Interest expense-non-PEC | (96,419 | ) | — | (96,419 | ) | ||||||
PEC interest (expense) income | (43,630 | ) | 21,201 | (22,429 | ) | ||||||
Other expense | (646 | ) | — | (646 | ) | ||||||
(Loss) income before income taxes | (4,414 | ) | 21,201 | 16,787 | |||||||
Provision for income taxes | (3,241 | ) | — | (3,241 | ) | ||||||
Net (loss) income | (7,655 | ) | 21,201 | 13,546 | |||||||
Net loss attributable to noncontrolling interest | 1,108 | 3,267 | 4,375 | ||||||||
Net (loss) income attributable to Encore | $ | (6,547 | ) | $ | 24,468 | $ | 17,921 | ||||
________________________
(1) | Includes only the results of operations related to Janus Holdings and therefore does not represent the complete financial performance of Encore Europe. |
For all periods presented, Janus Holdings recognized all interest expense related to the outstanding preferred equity certificates (“PECs”) owed to Encore and other minority shareholders, while the interest income from PECs owed to Encore was recognized at Janus Holdings’ parent company, Encore Europe Holdings, S.a.r.l. (“Encore Europe”), which is a wholly-owned subsidiary of Encore.
Comparison of Results of Operations
Year Ended December 31, 2016 Compared to Year Ended December 31, 2015
Revenues
Our revenues consist of portfolio revenue and other revenue.
Portfolio revenue consists of accretion revenue and zero basis revenue. Accretion revenue represents revenue derived from pools (quarterly groupings of purchased receivable portfolios) with a cost basis that has not been fully amortized. Revenue from pools with a remaining unamortized cost basis is accrued based on each pool’s effective interest rate applied to each pool’s remaining unamortized cost basis. The cost basis of each pool is increased by revenue earned and decreased by gross collections and portfolio allowances. The effective interest rate is the internal rate of return (“IRR”) derived from the timing and amounts of actual cash received and anticipated future cash flow projections for each pool. All collections realized after the net book value of a portfolio has been fully recovered, or Zero Basis Portfolios (“ZBA”), are recorded as revenue, or zero basis revenue. We account for our investment in receivable portfolios utilizing the interest method in accordance with the authoritative guidance for loans and debt securities acquired with deteriorated credit quality. We may incur allowance charges when actual cash flows from our receivable portfolios underperform compared to our expectations or when there is a change in the timing of cash flows. Factors that may contribute to underperformance and to the recording of valuation allowances may include both internal as well as external factors. Internal factors that may have an impact on our collections include operational activities such as the productivity of our collection staff. External factors that may have an impact on our collections include new laws or regulations, new interpretations of existing laws or regulations, and the overall condition of the economy. We record allowance reversals on pool groups that have historic allowance reserves when actual cash flows from these receivable portfolios outperform our expectations. Allowance reversals are included in portfolio revenue.
Other revenues consist primarily of fee-based income earned on accounts collected on behalf of others, primarily credit originators.
Our operating results are impacted by foreign currency translation, which represents the effect of translating operating results where the functional currency is different than our U.S. dollar reporting currency. The strengthening of the U.S. dollar relative to other foreign currencies has an unfavorable impact on our international revenues, and the weakening of the U.S. dollar relative to other foreign currencies has a favorable impact on our international revenues. Our revenues were impacted by
41
foreign currency translation, primarily by the weakening of the British Pound, which devalued against the U.S. dollar by 11.4%, during the year ended December 31, 2016 as compared to the year ended December 31, 2015.
Portfolio revenue was $946.6 million during the year ended December 31, 2016, a decrease of $125.8 million, or 11.7%, compared to revenue of $1,072.4 million during the year ended December 31, 2015. The decrease in portfolio revenue during the year ended December 31, 2016, compared to the year ended December 31, 2015 was the result of allowance charges recorded on certain pools in Europe and the negative impact of foreign currency translation, primarily from the weakening of the British Pound against the U.S. dollar.
During the year ended December 31, 2016, we recorded a net allowance charge of $84.2 million, compared to a net portfolio allowance reversal of $6.8 million during the year ended December 31, 2015. During the quarter ended September 30, 2016, we recorded a portfolio allowance charges of $94.0 million resulting from delays or shortfalls in near term collections against our forecasts for certain pools in Europe. These allowance charges, net of portfolio allowance reversals on other pools, attributed to the net portfolio allowance of $84.2 million during the year ended December 31, 2016. The net portfolio allowance reversals recorded in 2015 were primarily due to the reversal of remaining allowance reserves for certain ZBA pool groups with cash collections, offset by an $8.3 million portfolio allowance charge resulting from our settlement with the Consumer Financial Protection Bureau (“CFPB”).
During the quarter ended September 30, 2016, we revised the forecasting methodology we use to value and calculate IRRs on certain portfolios in Europe by extending the collection forecast from 120 months to 180 months. This change was made as a result of (1) our observation that older portfolios in Europe have consistently experienced cash collections beyond 120 months, (2) an expectation that regulatory changes in the United Kingdom resulting in a reduction in the number of highly discounted near term one-time settlements, an increase in the number of payment plans, and an increase in the length of existing payment plans will cause a lengthening of our collections curve, (3) an expectation that, as a result of a higher percentage of semi-performing account purchases in the United Kingdom in recent years, newer vintages will have a larger percentage of collections after 120 months and (4) our increased confidence in our ability to forecast future cash collections to 180 months. The increase in the collection forecast from 120 months to 180 months was applied effective July 1, 2016, to certain portfolios in Europe for which we could accurately forecast through such term. In addition, during the three months ended September 30, 2016, we recorded allowance charges of approximately $94.0 million resulting from delays or shortfalls in collections against the forecasts for certain pools in Europe. These changes in forecasted future cash flows resulted in an increase in the aggregate total estimated remaining collections (“ERC”) for the receivable portfolios of approximately $296.5 million as of September 30, 2016. The increase in the collection forecast from 120 months to 180 months had the effect of reducing the allowance charges by approximately $13.2 million. For portfolios in Europe that were not extended to 180 months, we will continue to include collection forecast to 120 months in calculating accretion revenue and in our estimated remaining collection disclosures. In the United States, we will continue to include collection forecast to 120 months in calculating accretion revenue. Expected collections beyond the 120-month collection forecast in the United States are included in our estimated remaining collection disclosures but are not included in the calculation of accretion revenue.
42
The following tables summarize collections, revenue, end of period receivable balance and other related supplemental data, by year of purchase (in thousands, except percentages):
Year Ended December 31, 2016 | As of December 31, 2016 | |||||||||||||||||||||||
Collections(1) | Gross Revenue(2) | Revenue Recognition Rate(3) | Net Reversal (Portfolio Allowance) | Revenue % of Total Revenue | Unamortized Balances | Monthly IRR | ||||||||||||||||||
United States: | ||||||||||||||||||||||||
ZBA(4) | $ | 137,287 | $ | 130,627 | 95.1 | % | $ | 6,820 | 12.7 | % | $ | — | — | |||||||||||
2007 | 2,200 | 748 | 34.0 | % | 795 | 0.1 | % | 941 | 4.5 | % | ||||||||||||||
2008 | 8,687 | 4,301 | 49.5 | % | 2,219 | 0.4 | % | 3,631 | 5.2 | % | ||||||||||||||
2009(5) | — | — | — | — | — | — | 0.0 | % | ||||||||||||||||
2010 | 10,402 | 7,493 | 72.0 | % | — | 0.7 | % | 807 | 25.0 | % | ||||||||||||||
2011 | 54,991 | 35,643 | 64.8 | % | — | 3.4 | % | 7,866 | 17.7 | % | ||||||||||||||
2012 | 113,068 | 72,877 | 64.5 | % | — | 7.1 | % | 38,886 | 11.7 | % | ||||||||||||||
2013 | 196,752 | 126,666 | 64.4 | % | — | 12.3 | % | 90,720 | 9.1 | % | ||||||||||||||
2014 | 216,356 | 112,554 | 52.0 | % | — | 10.9 | % | 187,083 | 4.1 | % | ||||||||||||||
2015 | 231,101 | 103,073 | 44.6 | % | — | 10.0 | % | 313,089 | 2.4 | % | ||||||||||||||
2016 | 110,876 | 65,639 | 59.2 | % | — | 6.4 | % | 515,260 | 2.4 | % | ||||||||||||||
Subtotal | 1,081,720 | 659,621 | 61.0 | % | 9,834 | 64.0 | % | 1,158,283 | 3.7 | % | ||||||||||||||
Europe: | ||||||||||||||||||||||||
2013 | 165,616 | 127,606 | 77.0 | % | (76,018 | ) | 12.4 | % | 256,725 | 3.0 | % | |||||||||||||
2014 | 156,666 | 93,657 | 59.8 | % | (13,150 | ) | 9.1 | % | 308,568 | 2.1 | % | |||||||||||||
2015 | 127,083 | 62,769 | 49.4 | % | (4,843 | ) | 6.1 | % | 255,445 | 1.6 | % | |||||||||||||
2016 | 44,635 | 24,733 | 55.4 | % | — | 2.4 | % | 230,225 | 1.8 | % | ||||||||||||||
Subtotal | 494,000 | 308,765 | 62.5 | % | (94,011 | ) | 30.0 | % | 1,050,963 | 2.1 | % | |||||||||||||
Other geographies: | ||||||||||||||||||||||||
ZBA(4) | 7,552 | 7,433 | 98.4 | % | — | 0.7 | % | — | — | |||||||||||||||
2013 | 1,548 | — | 0.0 | % | — | 0.0 | % | 1,008 | — | |||||||||||||||
2014 | 17,443 | 17,675 | 101.3 | % | — | 1.7 | % | 56,691 | 2.2 | % | ||||||||||||||
2015 | 57,055 | 27,810 | 48.7 | % | — | 2.7 | % | 51,758 | 3.5 | % | ||||||||||||||
2016 | 26,286 | 9,488 | 36.1 | % | — | 0.9 | % | 64,106 | 1.9 | % | ||||||||||||||
Subtotal | 109,884 | 62,406 | 56.8 | % | — | 6.0 | % | 173,563 | 2.4 | % | ||||||||||||||
Total | $ | 1,685,604 | $ | 1,030,792 | 61.2 | % | $ | (84,177 | ) | 100.0 | % | $ | 2,382,809 | 2.9 | % | |||||||||
_______________________
(1) | Does not include amounts collected on behalf of others. |
(2) | Gross revenue excludes the effects of net portfolio allowance or net portfolio allowance reversals. |
(3) | Revenue recognition rate excludes the effects of net portfolio allowance or net portfolio allowance reversals. |
(4) | ZBA revenue typically has a 100% revenue recognition rate. However, collections on ZBA pool groups where a valuation allowance remains must first be recorded as an allowance reversal until the allowance for that pool group is zero. Once the entire valuation allowance is reversed, the revenue recognition rate will become 100%. ZBA gross revenue includes an immaterial amount of accounts that are returned to the seller in accordance with the respective purchase agreement (“Put-Backs”). |
(5) | Total collections realized exceed the net book value of the portfolio and have been converted to ZBA. |
43
Year Ended December 31, 2015 | As of December 31, 2015 | |||||||||||||||||||||||
Collections(1) | Gross Revenue(2) | Revenue Recognition Rate(3) | Net Reversal (Portfolio Allowance) | Revenue % of Total Revenue | Unamortized Balances | Monthly IRR | ||||||||||||||||||
United States: | ||||||||||||||||||||||||
ZBA(4) | $ | 103,398 | $ | 91,876 | 88.9 | % | $ | 11,765 | 8.6 | % | $ | — | — | |||||||||||
2007 | 3,150 | 1,118 | 35.5 | % | 1,009 | 0.1 | % | 1,573 | 4.6 | % | ||||||||||||||
2008 | 13,529 | 8,665 | 64.0 | % | 2,311 | 0.8 | % | 5,798 | 10.0 | % | ||||||||||||||
2009 | 18,084 | 10,347 | 57.2 | % | — | 1.0 | % | — | — | |||||||||||||||
2010 | 42,615 | 25,629 | 60.1 | % | — | 2.4 | % | 3,742 | 21.2 | % | ||||||||||||||
2011 | 112,753 | 85,303 | 75.7 | % | — | 8.0 | % | 27,257 | 18.5 | % | ||||||||||||||
2012 | 176,914 | 108,968 | 61.6 | % | — | 10.2 | % | 79,973 | 8.6 | % | ||||||||||||||
2013 | 298,068 | 176,878 | 59.3 | % | — | 16.6 | % | 161,539 | 7.4 | % | ||||||||||||||
2014 | 307,814 | 146,583 | 47.6 | % | — | 13.8 | % | 291,402 | 3.6 | % | ||||||||||||||
2015 | 105,609 | 47,300 | 44.8 | % | — | 4.4 | % | 445,527 | 1.8 | % | ||||||||||||||
Impact of CFPB settlement | — | — | — | (8,322 | ) | — | — | — | ||||||||||||||||
Subtotal | 1,181,934 | 702,667 | 59.5 | % | 6,763 | 65.9 | % | 1,016,811 | 4.4 | % | ||||||||||||||
Europe: | ||||||||||||||||||||||||
2013 | 212,129 | 171,750 | 81.0 | % | — | 16.1 | % | 439,619 | 3.1 | % | ||||||||||||||
2014 | 198,127 | 122,490 | 61.8 | % | — | 11.5 | % | 444,618 | 2.1 | % | ||||||||||||||
2015 | 65,870 | 38,129 | 57.9 | % | — | 3.6 | % | 384,231 | 1.9 | % | ||||||||||||||
Subtotal | 476,126 | 332,369 | 69.8 | % | — | 31.2 | % | 1,268,468 | 2.4 | % | ||||||||||||||
Other geographies: | ||||||||||||||||||||||||
ZBA(4) | 4,565 | 4,571 | 100.1 | % | — | 0.4 | % | — | — | |||||||||||||||
2012 | 471 | — | 0.0 | % | — | 0.0 | % | — | — | |||||||||||||||
2013 | 6,507 | 319 | 4.9 | % | — | 0.0 | % | 2,480 | 0.0 | % | ||||||||||||||
2014 | 16,062 | 19,910 | 124.0 | % | — | 1.9 | % | 67,714 | 2.4 | % | ||||||||||||||
2015 | 15,060 | 5,837 | 38.8 | % | — | 0.5 | % | 85,196 | 2.9 | % | ||||||||||||||
Subtotal | 42,665 | 30,637 | 71.8 | % | — | 2.9 | % | 155,390 | 2.6 | % | ||||||||||||||
Total | $ | 1,700,725 | $ | 1,065,673 | 62.7 | % | $ | 6,763 | 100.0 | % | $ | 2,440,669 | 3.2 | % | ||||||||||
_______________________
(1) | Does not include amounts collected on behalf of others. |
(2) | Gross revenue excludes the effects of net portfolio allowance or net portfolio allowance reversals. |
(3) | Revenue recognition rate excludes the effects of net portfolio allowance or net portfolio allowance reversals. |
(4) | ZBA revenue typically has a 100% revenue recognition rate. However, collections on ZBA pool groups where a valuation allowance remains must first be recorded as an allowance reversal until the allowance for that pool group is zero. Once the entire valuation allowance is reversed, the revenue recognition rate will become 100%. ZBA gross revenue includes an immaterial amount of accounts that are returned to the seller in accordance with the respective purchase agreement (“Put-Backs”). |
Other revenues were $82.6 million and $57.5 million for the years ended December 31, 2016 and 2015, respectively. The increase in other revenues was primarily attributable to fee-based income earned at our international subsidiaries that provide portfolio management services to credit originators for non-performing loans, offset by the negative impact of foreign currency translation. Most of our other revenues are from our international subsidiaries and therefore, other revenues were unfavorably impacted by the strengthening of the U.S. dollar relative to other foreign currencies during the periods presented.
44
Operating Expenses
Total operating expenses were $787.7 million during the year ended December 31, 2016, a decrease of $60.0 million, or 7.1%, compared to total operating expenses of $847.7 million during the year ended December 31, 2015.
Operating expenses are explained in more detail as follows:
Salaries and Employee Benefits
Salaries and employee benefits increased $18.8 million, or 7.2%, to $281.1 million during the year ended December 31, 2016, from $262.3 million during the year ended December 31, 2015. The increase was primarily the result of increases in compensation expense of approximately $33.4 million for our international subsidiaries, offset by a decrease of $9.4 million in stock-based compensation expense and a net decrease in other salaries and employee benefits in our U.S. operations.
Stock-based compensation decreased $9.4 million, or 42.6%, to $12.6 million during the year ended December 31, 2016, from $22.0 million during the year ended December 31, 2015. The decreases were primarily attributable to expense reversals resulting from adjustments to estimated vesting of certain performance-based awards and lower fair value of equity awards granted in recent periods.
Cost of Legal Collections
Cost of legal collections includes primarily contingent fees paid to our network of attorneys and the cost of litigation. We pursue legal collections using a network of attorneys that specialize in collection matters and through our internal legal channel. Under the agreements with our contracted attorneys, we advance certain out-of-pocket court costs, or Deferred Court Costs. We capitalize these costs in the consolidated financial statements and provide a reserve for those costs that we believe will ultimately be uncollectible. We determine the reserve based on an estimated court cost recovery rate based on our analysis of historical court costs recovery data. Based on recent trends of historical court costs recovery data, we noted a decrease in the estimated court cost recovery rate in the United Kingdom. Based on the revised estimated court cost recovery rate, we recorded an additional court costs reserve in the cost of legal collections of approximately $11.3 million during the three months ended September 30, 2016.
The cost of legal collections decreased $28.9 million, or 12.6%, to $200.9 million during the year ended December 31, 2016, compared to $229.8 million during the year ended December 31, 2015. Cost of legal collections in the United States decreased by $39.6 million, or 19.6%, while cost of legal collections in Europe increased by $8.9 million, or 32.3% as compared to the prior year. The cost of legal collections as a percentage of gross collections through this channel decreased to 29.1% during the year ended December 31, 2016, from 31.6% during the year ended December 31, 2015. During the year ended December 31, 2016, the cost of legal collections was 29.1% and 29.9% in the United States and Europe, respectively. During the year ended December 31, 2015, the cost of legal collections was 31.9% and 29.9% in the United States and Europe, respectively.
The decreases in the cost of legal collections and the cost of legal collections as a percentage of gross collections in the United States during the periods presented were due to a reduction in upfront court costs as a result of fewer accounts placed in this channel because of temporary delays in receiving media from issuers required to initiate the legal process for a number of accounts as compared to the corresponding period in the prior year. We began to see increased placement volume in the fourth quarter of 2016 and expect increased placements in our legal channel thereafter.
Other Operating Expenses
Other operating expenses increased $7.5 million, or 8.1%, to $100.7 million during the year ended December 31, 2016, from $93.2 million during the year ended December 31, 2015. The increases in other operating expenses was primarily due to increased costs relating to acquired international subsidiaries offset by lower domestic expenses.
Collection Agency Commissions
During the year ended December 31, 2016, we incurred $36.1 million in commissions to third-party collection agencies, or 18.5% of the related gross collections of $195.4 million. During the period, the commission rate as a percentage of related gross collections was 9.0% and 22.7% for our collection outsourcing channels in the United States and Europe, respectively. During the year ended December 31, 2015, we incurred $37.9 million in commissions, or 17.2%, of the related gross collections of $220.2 million. During 2015, the commission rate as a percentage of related gross collections was 14.4% and 18.5% for our collection outsourcing channels in the United States and Europe, respectively.
Collections through this channel vary from period to period depending on, among other things, the number of accounts placed with an agency versus accounts collected internally. Commissions, as a percentage of collections in this channel, also
45
vary from period to period depending on, among other things, the amount of time that has passed since the charge-off of the accounts placed with an agency, the asset class, and the geographic location of the receivables. Generally, freshly charged-off accounts have a lower commission rate than accounts that have been charged off for a longer period of time. Additionally, commission rates are lower in the United Kingdom, where most of the receivables in this channel are semi-performing loans and IVAs, while the commission rates are higher in other European countries where most of the receivables in this channel are non-performing loans.
General and Administrative Expenses
General and administrative expenses decreased $57.4 million, or 30.0%, to $134.0 million during the year ended December 31, 2016, from $191.4 million during the year ended December 31, 2015. The decrease was primarily due to CFPB related expenses of approximately $53.7 million recorded during the year ended December 31, 2015 and a reversal of an acquisition-related contingent consideration of approximately $8.1 million recorded during the year ended December 31, 2016.
Depreciation and Amortization
Depreciation and amortization expense increased $1.7 million, or 5.2%, to $34.9 million during the year ended December 31, 2016, from $33.2 million during the year ended December 31, 2015. The increase was primarily attributable to additional amortization expenses resulting from intangible assets acquired through our recent acquisitions.
Cost per Dollar Collected
We utilize adjusted operating expenses in order to facilitate a comparison of approximate cash costs to cash collections for our portfolio purchasing and recovery business. The calculation of adjusted operating expenses is illustrated in detail in the “Non-GAAP Disclosure” section. The following table summarizes our overall cost per dollar collected by geographic location during the periods presented:
Year Ended December 31, | |||||
2016 | 2015 | ||||
United States | 40.5 | % | 42.0 | % | |
Europe | 32.8 | % | 33.0 | % | |
Other geographies | 44.1 | % | 32.9 | % | |
Overall cost per dollar collected | 38.5 | % | 39.2 | % | |
Our overall cost per dollar collected (or “cost-to-collect”) for the year ended December 31, 2016 was 38.5%, down 70 basis points from 39.2% during the prior period. The decrease in overall cost-to-collect during the year ended December 31, 2016 as compared to the prior year, was primarily due to improved cost-to-collect in the United States and Europe, offset by higher cost-to-collect in other geographies. To counter higher prices in the United States, we implemented innovative consumer-centric programs aimed at increasing liquidations. These programs were initiated in the beginning of 2014 and have become increasingly successful. As we continue to grow our presence in the Latin American and Australasian markets, we expect to incur upfront cost in building our collection channels. As a result, cost-to-collect in other geographies may become elevated in the near term and may fluctuate over time.
Over time, we expect our cost-to-collect to remain competitive, but also to fluctuate from quarter to quarter based on seasonality, acquisitions, the cost of investments in new operating initiatives, and the changing regulatory and legislative environment.
Interest Expense
Interest expense increased $11.8 million to $198.4 million during the year ended December 31, 2016, from $186.6 million during the year ended December 31, 2015.
46
The following table summarizes our interest expense (in thousands, except percentages):
Year Ended December 31, | ||||||||||||||
2016 | 2015 | $ Change | % Change | |||||||||||
Stated interest on debt obligations | $ | 159,883 | $ | 151,617 | $ | 8,266 | 5.5 | % | ||||||
Interest expense on preferred equity certificates | 24,297 | 24,484 | (187 | ) | (0.8 | )% | ||||||||
Amortization of loan fees and other loan costs | 12,618 | 11,792 | 826 | 7.0 | % | |||||||||
Amortization of debt discount | 10,520 | 9,410 | 1,110 | 11.8 | % | |||||||||
Accretion of debt premium | (8,951 | ) | (10,747 | ) | 1,796 | (16.7 | )% | |||||||
Total interest expense | $ | 198,367 | $ | 186,556 | $ | 11,811 | 6.3 | % | ||||||
The payment of the accumulated interest on the PECs issued in connection with the acquisition of a controlling interest in Cabot will only be satisfied in connection with the disposition of the noncontrolling interest of J.C. Flowers and management.
The increase in interest expense was primarily attributable to increased average debt levels in the United States and Europe and interest expense recognized by Baycorp, which was acquired in October 2015.
Other Income
Other income consists primarily of foreign currency exchange gains or losses, interest income, and gains or losses recognized on certain transactions outside of our normal course of business. Other income was $14.2 million during the year ended December 31, 2016, up from $2.2 million during the year ended December 31, 2015. The increase was primarily due to net gains recognized on foreign exchange contracts of approximately $8.2 million.
In 2016, Encore and Cabot collectively began entering into currency exchange forward contracts to reduce the effects of currency exchange rate fluctuations between the British Pound and Euro. These derivative contracts generally mature within one to three months and are not designated as hedge instruments for accounting purposes. The gains or losses on these derivative contracts are recognized in other income or expense based on the changes in fair value. Before the effect of income tax and noncontrolling interest, the net gain on these derivative contracts recognized in our consolidated statements of income was $8.2 million during the year ended December 31, 2016.
Provision for Income Taxes
During the years ended December 31, 2016 and 2015, we recorded income tax provisions for income from continuing operations of $38.2 million and $27.2 million, respectively.
47
The effective tax rates for the respective periods are shown below:
Year Ended December 31, | |||||
2016 | 2015 | ||||
Federal provision | 35.0 | % | 35.0 | % | |
State provision | 2.3 | % | 0.2 | % | |
International benefit(1) | (3.6 | )% | (7.8 | )% | |
Tax reserves(2) | (3.2 | )% | (2.0 | )% | |
Permanent items(3) | 14.7 | % | 6.0 | % | |
Increase (decrease) in valuation allowance(4) | 20.7 | % | (5.6 | )% | |
Other | 0.7 | % | 1.9 | % | |
Effective rate | 66.6 | % | 27.7 | % | |
________________________
(1) | Relates primarily to the lower tax rate on the income attributable to international operations. |
(2) | Represents release of reserves taken for a certain tax position. |
(3) | Represents a provision for nondeductible items, including overall foreign loss in 2016 and a settlement with the CFPB in 2015. The Company incurred a $10.0 million civil monetary penalty related to a settlement with the CFPB during the year ended December 31, 2015, which is not deductible for income tax purposes. |
(4) | Valuation allowance increased in 2016 due to a foreign subsidiary’s cumulative operating loss. |
The effective tax rate for the year ended December 31, 2016 increased to 66.6% as compared to 27.7% for the year ended December 31, 2015. The increase in effective tax rate was primarily the result of the recording of a large valuation allowance at one of our foreign subsidiaries, the higher tax provision due to nondeductible items, and proportionately less earnings realized in countries that have lower statutory tax rates than the U.S. federal rate.
During the year ended December 31, 2016, one of our foreign subsidiaries has incurred a cumulative operating loss. Management believes that it is more likely than not that the net operating loss carryforwards will not be realized at this jurisdiction, therefore, we have recorded a valuation allowance against the previously established deferred tax assets.
Our effective tax rate could fluctuate significantly on a quarterly basis and could be adversely affected to the extent earnings are lower than anticipated in countries that have lower statutory tax rates and higher than anticipated in countries that have higher statutory tax rates.
Year Ended December 31, 2015 Compared to Year Ended December 31, 2014
Revenues
Total revenues were $1,130.0 million during the year ended December 31, 2015, an increase of $86.6 million, or 8.3%, compared to total revenues of $1,043.4 million during the year ended December 31, 2014.
48
The following tables summarize collections, revenue, end of period receivable balance and other related supplemental data, by year of purchase from our portfolio purchasing and recovery segment (in thousands, except percentages):
Year Ended December 31, 2015 | As of December 31, 2015 | |||||||||||||||||||||||
Collections(1) | Gross Revenue(2) | Revenue Recognition Rate(3) | Net Reversal (Portfolio Allowance) | Revenue % of Total Revenue | Unamortized Balances | Monthly IRR | ||||||||||||||||||
United States: | ||||||||||||||||||||||||
ZBA(4) | $ | 103,398 | $ | 91,876 | 88.9 | % | $ | 11,765 | 8.6 | % | $ | — | — | |||||||||||
2007 | 3,150 | 1,118 | 35.5 | % | 1,009 | 0.1 | % | 1,573 | 4.6 | % | ||||||||||||||
2008 | 13,529 | 8,665 | 64.0 | % | 2,311 | 0.8 | % | 5,798 | 10.0 | % | ||||||||||||||
2009 | 18,084 | 10,347 | 57.2 | % | — | 1.0 | % | — | — | |||||||||||||||
2010 | 42,615 | 25,629 | 60.1 | % | — | 2.4 | % | 3,742 | 21.2 | % | ||||||||||||||
2011 | 112,753 | 85,303 | 75.7 | % | — | 8.0 | % | 27,257 | 18.5 | % | ||||||||||||||
2012 | 176,914 | 108,968 | 61.6 | % | — | 10.2 | % | 79,973 | 8.6 | % | ||||||||||||||
2013 | 298,068 | 176,878 | 59.3 | % | — | 16.6 | % | 161,539 | 7.4 | % | ||||||||||||||
2014 | 307,814 | 146,583 | 47.6 | % | — | 13.8 | % | 291,402 | 3.6 | % | ||||||||||||||
2015 | 105,609 | 47,300 | 44.8 | % | — | 4.4 | % | 445,527 | 1.8 | % | ||||||||||||||
Impact of CFPB settlement | — | — | — | (8,322 | ) | — | — | — | ||||||||||||||||
Subtotal | 1,181,934 | 702,667 | 59.5 | % | 6,763 | 65.9 | % | 1,016,811 | 4.4 | % | ||||||||||||||
Europe: | ||||||||||||||||||||||||
2013 | 212,129 | 171,750 | 81.0 | % | — | 16.1 | % | 439,619 | 3.1 | % | ||||||||||||||
2014 | 198,127 | 122,490 | 61.8 | % | — | 11.5 | % | 444,618 | 2.1 | % | ||||||||||||||
2015 | 65,870 | 38,129 | 57.9 | % | — | 3.6 | % | 384,231 | 1.9 | % | ||||||||||||||
Subtotal | 476,126 | 332,369 | 69.8 | % | — | 31.2 | % | 1,268,468 | 2.4 | % | ||||||||||||||
Other geographies: | ||||||||||||||||||||||||
ZBA(4) | 4,565 | 4,571 | 100.1 | % | — | 0.4 | % | — | — | |||||||||||||||
2012 | 471 | — | 0.0 | % | — | 0.0 | % | — | — | |||||||||||||||
2013 | 6,507 | 319 | 4.9 | % | — | 0.0 | % | 2,480 | 0.0 | % | ||||||||||||||
2014 | 16,062 | 19,910 | 124.0 | % | — | 1.9 | % | 67,714 | 2.4 | % | ||||||||||||||
2015 | 15,060 | 5,837 | 38.8 | % | — | 0.5 | % | 85,196 | 2.9 | % | ||||||||||||||
Subtotal | 42,665 | 30,637 | 71.8 | % | — | 2.9 | % | 155,390 | 2.6 | % | ||||||||||||||
Total | $ | 1,700,725 | $ | 1,065,673 | 62.7 | % | $ | 6,763 | 100.0 | % | $ | 2,440,669 | 3.2 | % | ||||||||||
(1) | Does not include amounts collected on behalf of others. |
(2) | Gross revenue excludes the effects of net portfolio allowance or net portfolio allowance reversals. |
(3) | Revenue recognition rate excludes the effects of net portfolio allowance or net portfolio allowance reversals. |
(4) | ZBA revenue typically has a 100% revenue recognition rate. However, collections on ZBA pool groups where a valuation allowance remains must first be recorded as an allowance reversal until the allowance for that pool group is zero. Once the entire valuation allowance is reversed, the revenue recognition rate will become 100%. ZBA gross revenue includes an immaterial amount of Put-Backs. |
49
Year Ended December 31, 2014 | As of December 31, 2014 | |||||||||||||||||||||||
Collections(1) | Gross Revenue(2) | Revenue Recognition Rate(3) | Net Portfolio Allowance Reversal | Revenue % of Total Revenue | Unamortized Balances | Monthly IRR | ||||||||||||||||||
United States: | ||||||||||||||||||||||||
ZBA(4) | $ | 34,491 | $ | 22,271 | 64.6 | % | $ | 12,229 | 2.3 | % | $ | — | — | |||||||||||
2006 | 3,067 | 601 | 19.6 | % | — | 0.1 | % | — | — | |||||||||||||||
2007 | 7,971 | 3,316 | 41.6 | % | 1,612 | 0.3 | % | 2,603 | 4.8 | % | ||||||||||||||
2008 | 27,715 | 14,939 | 53.9 | % | 3,566 | 1.5 | % | 8,400 | 8.6 | % | ||||||||||||||
2009 | 52,661 | 39,586 | 75.2 | % | — | 4.1 | % | 7,894 | 25.6 | % | ||||||||||||||
2010 | 111,058 | 82,375 | 74.2 | % | — | 8.4 | % | 21,180 | 22.9 | % | ||||||||||||||
2011 | 154,930 | 108,167 | 69.8 | % | — | 11.1 | % | 55,968 | 13.5 | % | ||||||||||||||
2012 | 259,252 | 137,986 | 53.2 | % | — | 14.1 | % | 150,876 | 6.4 | % | ||||||||||||||
2013 | 397,864 | 220,121 | 55.3 | % | — | 22.6 | % | 284,819 | 5.0 | % | ||||||||||||||
2014 | 143,804 | 79,585 | 55.3 | % | — | 8.2 | % | 456,970 | 2.7 | % | ||||||||||||||
Subtotal | 1,192,813 | 708,947 | 59.4 | % | 17,407 | 72.7 | % | 988,710 | 5.0 | % | ||||||||||||||
Europe: | ||||||||||||||||||||||||
2013 | 249,307 | 160,074 | 64.2 | % | — | 16.4 | % | 505,213 | 2.4 | % | ||||||||||||||
2014 | 135,549 | 101,285 | 74.7 | % | — | 10.4 | % | 555,323 | 1.9 | % | ||||||||||||||
Subtotal | 384,856 | 261,359 | 67.9 | % | — | 26.8 | % | 1,060,536 | 2.1 | % | ||||||||||||||
Other geographies: | ||||||||||||||||||||||||
2012 | 2,561 | — | 0.0 | % | — | 0.0 | % | 505 | 0.0 | % | ||||||||||||||
2013 | 17,615 | 3,032 | 17.2 | % | — | 0.3 | % | 10,530 | 0.0 | % | ||||||||||||||
2014 | 9,652 | 2,087 | 21.6 | % | — | 0.2 | % | 83,279 | 1.8 | % | ||||||||||||||
Subtotal | 29,828 | 5,119 | 17.2 | % | — | 0.5 | % | 94,314 | 1.6 | % | ||||||||||||||
Total | $ | 1,607,497 | $ | 975,425 | 60.7 | % | $ | 17,407 | 100.0 | % | $ | 2,143,560 | 3.1 | % | ||||||||||
(1) | Does not include amounts collected on behalf of others. |
(2) | Gross revenue excludes the effects of net portfolio allowance or net portfolio allowance reversals. |
(3) | Revenue recognition rate excludes the effects of net portfolio allowance or net portfolio allowance reversals. |
(4) | ZBA revenue typically has a 100% revenue recognition rate. However, collections on ZBA pool groups where a valuation allowance remains must first be recorded as an allowance reversal until the allowance for that pool group is zero. Once the entire valuation allowance is reversed, the revenue recognition rate will become 100%. ZBA gross revenue includes an immaterial amount of Put-Backs. |
Portfolio revenue from our portfolio purchasing and recovery segment was $1.1 billion during the year ended December 31, 2015, an increase of $79.6 million, or 8.0%, compared to revenue of $992.8 million during the year ended December 31, 2014. The increase in portfolio revenue during the year ended December 31, 2015 compared to 2014 was due to additional accretion revenue associated with a higher portfolio balance, primarily associated with portfolios acquired through our increased level of merger and acquisition related activities and increases in yields on certain pool groups due to over-performance, offset by lower yields on recently formed pool groups.
During the year ended December 31, 2015, we recorded a net portfolio allowance reversal of $6.8 million, compared to a net portfolio allowance reversal of $17.4 million during the year ended December 31, 2014. During the year ended December 31, 2015, we recorded a portfolio allowance charge of $8.3 million as a result of a reduction in forecasted cash flows in certain pool groups related to the settlement we entered into with the CFPB in September 2015. Excluding this allowance charge, we recorded portfolio allowance reversals of $15.1 million and $17.4 million during the years ended December 31, 2015 and 2014, respectively. The recording of allowance reversals during the years ended December 31, 2015 and 2014 was primarily due to operational improvements that allowed us to assist our customers to repay their obligations and increased collections on our ZBA portfolios. Additionally, our refined valuation methodologies have limited the amount of valuation charges necessary during recent periods.
Other revenues were $57.5 million and $50.6 million for the years ended December 31, 2015 and 2014, respectively. Other revenues primarily represent fee-based income earned on accounts collected on behalf of others, primarily credit
50
originators. The increase in other revenues was primarily attributable to fee-based income earned at our recently acquired subsidiaries.
Operating Expenses
Total operating expenses were $847.7 million during the year ended December 31, 2015, an increase of $112.7 million, or 15.3%, compared to total operating expenses of $735.0 million during the year ended December 31, 2014.
Excluding the CFPB settlement related charges of $54.7 million, operating expenses increased $58.0 million, or 7.9%, to $793.0 million during the year ended December 31, 2015, as compared to the prior year.
Operating expenses are explained in more detail as follows:
Salaries and Employee Benefits
Salaries and employee benefits increased $23.4 million, or 9.8%, to $262.3 million during the year ended December 31, 2015, from $238.9 million during the year ended December 31, 2014. The increase was primarily the result of increases in headcount as a result of our recent mergers and acquisitions and increases in headcount and related compensation expense to support our growth.
Stock-based compensation increased $4.8 million, or 28.1%, to $22.0 million during the year ended December 31, 2015, from $17.2 million during the year ended December 31, 2014. This increase was primarily attributable to an increase in the number of shares granted and the higher fair value of equity awards granted in recent periods.
Cost of Legal Collections
The cost of legal collections increased $24.1 million, or 11.8%, to $229.8 million during the year ended December 31, 2015, compared to $205.7 million during the year ended December 31, 2014. The increase reflects an increase in gross legal collections, which were $726.8 million during the year ended December 31, 2015, up from $652.7 million during the year ended December 31, 2014. The cost of legal collections remained stable as a percentage of gross collections through this channel at 31.6% and 31.5% during the years ended December 31, 2015 and 2014, respectively. During the year ended December 31, 2015, the cost of legal collections was 31.9% and 29.9% in the United States and Europe, respectively. During the year ended December 31, 2014, the cost of legal collections was 31.4% and 32.5% in the United States and Europe, respectively.
Other Operating Expenses
Other operating expenses increased $3.3 million, or 3.6%, to $93.2 million during the year ended December 31, 2015, from $89.9 million during the year ended December 31, 2014. The increases in other operating expenses were primarily the result of additional other operating expenses at our recently acquired subsidiaries.
Collection Agency Commissions
During the year ended December 31, 2015, we incurred $37.9 million in commissions to third party collection agencies, or 17.2% of the related gross collections of $220.2 million. During the period, the commission rate as a percentage of related gross collections was 14.4% and 18.5% for our collection outsourcing channels in the United States and Europe, respectively. During the year ended December 31, 2014, we incurred $33.3 million in commissions, or 16.6%, of the related gross collections of $200.3 million. During 2014, the commission rate as a percentage of related gross collections was 16.2% and 16.9% for our collection outsourcing channels in the United States and Europe, respectively.
Collections through this channel vary from period to period depending on, among other things, the number of accounts placed with an agency versus the number of accounts collected internally. Commissions, as a percentage of collections in this channel, also vary from period to period depending on, among other things, the amount of time that has passed since the charge-off of the accounts placed with an agency, the asset class, and the geographic location of the receivables. Generally, freshly charged-off accounts have a lower commission rate than accounts that have been charged off for a longer period of time. Additionally, commission rates are lower in the United Kingdom, where most of the receivables in this channel are semi-performing loans and IVAs, and higher in other European countries where most of the receivables in this channel are non-performing loans.
General and Administrative Expenses
General and administrative expenses increased $51.4 million, or 36.7%, to $191.4 million during the year ended December 31, 2015, from $140.0 million during the year ended December 31, 2014. The increase was primarily due to the recording of CFPB settlement fees and related administrative expenses of $53.7 million during the year ended December 31,
51
2015 and increased general and administrative expenses due to our growth in 2015 as compared to 2014, offset by lower rent expense during the year ended December 31, 2015.
Depreciation and Amortization
Depreciation and amortization expense increased $6.1 million, or 22.4%, to $33.2 million during the year ended December 31, 2015, from $27.1 million during the year ended December 31, 2014. The increase during the year ended December 31, 2015 was primarily related to increased depreciation expense resulting from the acquisition of fixed assets in the current and prior years and additional depreciation and amortization expenses resulting from fixed assets and intangible assets acquired through our acquisitions.
Cost per Dollar Collected
We utilize adjusted operating expenses in order to facilitate a comparison of approximate cash costs to cash collections for our portfolio purchasing and recovery business. The calculation of adjusted operating expenses is illustrated in detail in the “Non-GAAP Disclosure” section. The following table summarizes our overall cost per dollar collected by geographic location during the periods presented:
Year Ended December 31, | |||||
2015 | 2014 | ||||
United States | 42.0 | % | 41.7 | % | |
Europe | 33.0 | % | 29.3 | % | |
Other geographies | 32.9 | % | 30.2 | % | |
Overall cost per dollar collected | 39.2 | % | 38.6 | % | |
Our overall cost-to-collect for the year ended December 31, 2015 was 39.2%, up 60 basis points from 38.6% during the prior period. Cabot’s cost-to-collect continues to trend lower than our overall cost-to-collect because its portfolio includes many consumers who are already on payment plans and historically involves little litigation. As more of Cabot’s accounts are serviced through its legal channel, we expect to see incremental net collections and a higher overall cost to collect. As we continue to grow our presence in the Latin American market, we expect to incur upfront cost in building our collection channels. As a result, cost-to-collect in this region may become elevated in the near term and may fluctuate over time.
Over time, we expect our cost-to-collect to remain competitive, but also to fluctuate from quarter to quarter based on seasonality, acquisitions, the cost of investments in new operating initiatives, and the changing regulatory and legislative environment.
Interest Expense
Interest expense increased $19.6 million to $186.6 million during the year ended December 31, 2015, from $166.9 million during the year ended December 31, 2014.
The following table summarizes our interest expense (in thousands, except percentages):
Year Ended December 31, | ||||||||||||||
2015 | 2014 | $ Change | % Change | |||||||||||
Stated interest on debt obligations | $ | 151,616 | $ | 137,274 | $ | 14,342 | 10.4 | % | ||||||
Interest expense on preferred equity certificates | 24,484 | 22,429 | 2,055 | 9.2 | % | |||||||||
Amortization of loan fees and other loan costs | 11,792 | 9,049 | 2,743 | 30.3 | % | |||||||||
Amortization of debt discount | 9,410 | 8,423 | 987 | 11.7 | % | |||||||||
Accretion of debt premium | (10,746 | ) | (10,233 | ) | (513 | ) | 5.0 | % | ||||||
Total interest expense | $ | 186,556 | $ | 166,942 | $ | 19,614 | 11.7 | % | ||||||
The payment of the accumulated interest on the PECs issued in connection with the acquisition of a controlling interest in Cabot will only be satisfied in connection with the disposition of the noncontrolling interest of J.C. Flowers and management.
52
The increase in interest expense was primarily attributable to increased debt levels in the United States and in Europe related to additional borrowings to finance recent acquisitions and portfolio purchases.
Other Income
Other income consists primarily of foreign currency exchange gains or losses and interest income. Other income was $2.2 million during the year ended December 31, 2015, up from $0.1 million during the year ended December 31, 2014. The increase of other income was primarily attributable to a $1.4 million net change in recognized foreign currency gains and losses. We recognized a net foreign currency exchange gain of $0.3 million during the year ended December 31, 2105 and a net foreign currency exchange loss of $1.1 million during the year ended December 31, 2014. The increase in other income was also a result of an increase in interest income of $0.8 million during the year ended December 31, 2015 as compared to the prior year.
Provision for Income Taxes
During the years ended December 31, 2015 and 2014, we recorded income tax provisions for income from continuing operations of $27.2 million and $48.6 million, respectively.
The effective tax rates for the respective periods are shown below:
Year Ended December 31, | |||||
2015 | 2014 | ||||
Federal provision | 35.0 | % | 35.0 | % | |
State provision(1) | 0.2 | % | 5.7 | % | |
International benefit(2) | (7.8 | )% | (3.8 | )% | |
Tax reserves(3) | (2.0 | )% | 0.0 | % | |
Permanent items(4) | 6.0 | % | 4.3 | % | |
Release of valuation allowance | (5.6 | )% | 0.0 | % | |
Other(5) | 1.9 | % | (6.9 | )% | |
Effective rate | 27.7 | % | 34.3 | % | |
________________________
(1) | Primarily relates to a beneficial settlement with a state tax authority. |
(2) | Relates primarily to the lower tax rate on the income attributable to international operations. |
(3) | Represents a release of reserves for a certain tax position. |
(4) | Represents a provision for nondeductible items, including a settlement with the CFPB in 2015. |
(5) | Includes the effect of discrete items, primarily relates to the recognition of tax benefit as a result of a favorable tax settlement with taxing authorities as discussed below. |
The effective tax rate for the year ended December 31, 2015 as compared to 2014, decreased as a result of proportionately more earnings realized in countries that have lower statutory tax rates than the U.S. federal rate. The income tax provision also decreased due to agreements reached with tax authorities, which generated benefits and the release of valuation allowances due to continual profitability of a subsidiary.
Our effective tax rate could fluctuate significantly on a quarterly basis and could be adversely affected to the extent earnings are lower than anticipated in countries that have lower statutory tax rates and higher than anticipated in countries that have higher statutory tax rates.
Non-GAAP Disclosure
In addition to the financial information prepared in conformity with Generally Accepted Accounting Principles (“GAAP”), we provide historical non-GAAP financial information. Management believes that the presentation of such non-GAAP financial information is meaningful and useful in understanding the activities and business metrics of our operations. Management believes that these non-GAAP financial measures reflect an additional way of viewing aspects of our business that, when viewed with our GAAP results, provide a more complete understanding of factors and trends affecting our business.
53
Management believes that the presentation of these measures provides investors with greater transparency and facilitates comparison of operating results across a broad spectrum of companies with varying capital structures, compensation strategies, derivative instruments, and amortization methods, which provide a more complete understanding of our financial performance, competitive position, and prospects for the future. Readers should consider the information in addition to, but not instead of, our financial statements prepared in accordance with GAAP. This non-GAAP financial information may be determined or calculated differently by other companies, limiting the usefulness of these measures for comparative purposes.
Adjusted Income From Continuing Operations Per Share. Management uses non-GAAP adjusted income from continuing operations attributable to Encore and adjusted income from continuing operations per share (which we also refer to from time to time as adjusted earnings per share), to assess operating performance, in order to highlight trends in our business that may not otherwise be apparent when relying on financial measures calculated in accordance with GAAP. Adjusted income from continuing operations attributable to Encore excludes non-cash interest and issuance cost amortization relating to our convertible notes, acquisition, integration and restructuring related expenses, settlement fees and related administrative expenses, amortization of certain acquired intangible assets and other charges or gains that are not indicative of ongoing operations.
The following table provides a reconciliation between income from continuing operations and diluted income from continuing operations per share attributable to Encore calculated in accordance with GAAP to adjusted income from continuing operations and adjusted income from continuing operations per share attributable to Encore, respectively. GAAP diluted earnings per share for the years ended December 31, 2015 and 2014, includes the effect of approximately 0.7 million, and 1.1 million, respectively, common shares that are issuable upon conversion of certain convertible senior notes because the average stock price during the respective periods exceeded the conversion price of these notes. However, as described in Note 10, “Debt—Encore Convertible Notes,” in the notes to our consolidated financial statements, we have certain hedging transactions in place that have the effect of increasing the effective conversion price of these notes. Accordingly, while these common shares are included in our diluted earnings per share, the hedge transactions will offset the impact of this dilution and no shares will be issued unless our stock price exceeds the effective conversion price, thereby creating a discrepancy between the accounting effect of those notes under GAAP and their economic impact. There was no dilutive effect relating to our convertible senior notes during the year ended December 31, 2016.
We have presented the following metrics both including and excluding the dilutive effect of these convertible senior notes to better illustrate the economic impact of those notes and the related hedging transactions to shareholders, with the GAAP item under the “Per Diluted Share-Accounting” and “Per Diluted Share-Economic” (non-GAAP) columns, respectively (in thousands, except per share data):
54
Year Ended December 31, | |||||||||||||||||||||||||||||||||||
2016 | 2015 | 2014 | |||||||||||||||||||||||||||||||||
$ | Per Diluted Share— Accounting | Per Diluted Share— Economic | $ | Per Diluted Share— Accounting | Per Diluted Share— Economic | $ | Per Diluted Share— Accounting | Per Diluted Share— Economic | |||||||||||||||||||||||||||
GAAP net income from continuing operations attributable to Encore, as reported | $ | 78,923 | $ | 3.05 | $ | 3.05 | $ | 68,522 | $ | 2.57 | $ | 2.64 | $ | 98,521 | $ | 3.58 | $ | 3.73 | |||||||||||||||||
Adjustments: | |||||||||||||||||||||||||||||||||||
Convertible notes non-cash interest and issuance cost amortization | 11,830 | 0.46 | 0.46 | 11,332 | 0.43 | 0.44 | 10,306 | 0.37 | 0.39 | ||||||||||||||||||||||||||
Acquisition, integration and restructuring related expenses(1) | 17,630 | 0.68 | 0.68 | 16,933 | 0.64 | 0.65 | 20,762 | 0.76 | 0.79 | ||||||||||||||||||||||||||
Gain on reversal of contingent consideration(2) | (8,111 | ) | (0.31 | ) | (0.31 | ) | — | — | — | — | — | — | |||||||||||||||||||||||
Settlement fees and related administrative expenses(3) | 6,299 | 0.24 | 0.24 | 63,019 | 2.36 | 2.43 | — | — | — | ||||||||||||||||||||||||||
Amortization of certain acquired intangible assets(4) | 2,593 | 0.10 | 0.10 | — | — | — | — | — | — | ||||||||||||||||||||||||||
Income tax effect of the adjustments(5) | (12,577 | ) | (0.49 | ) | (0.49 | ) | (28,514 | ) | (1.07 | ) | (1.11 | ) | (10,552 | ) | (0.38 | ) | (0.40 | ) | |||||||||||||||||
Adjustments attributable to noncontrolling interest(6) | (6,461 | ) | (0.25 | ) | (0.25 | ) | (5,273 | ) | (0.20 | ) | (0.20 | ) | (6,812 | ) | (0.25 | ) | (0.26 | ) | |||||||||||||||||
Adjusted income from continuing operations attributable to Encore | $ | 90,126 | $ | 3.48 | $ | 3.48 | $ | 126,019 | $ | 4.73 | $ | 4.85 | $ | 112,225 | $ | 4.08 | $ | 4.25 | |||||||||||||||||
(1) | Amount represents acquisition, integration and restructuring related expenses. We adjust for this amount because we believe these expenses are not indicative of ongoing operations; therefore adjusting for these expenses enhances comparability to prior periods, anticipated future periods, and our competitors’ results. |
(2) | Amount represents a gain recognized as a result of reversing a liability for contingent consideration that was established in October 2015 when we acquired a debt solution service provider in Europe. We have adjusted for this amount because we do not believe this is indicative of ongoing operations. Refer to Note 4 “Fair Value Measurement - Contingent Consideration” in the notes to our consolidated financial statements for further details. |
(3) | Amount represents litigation and government settlement fees and related administrative expenses. For the year ended December 31, 2016, amount consists of settlement and administrative fees related to certain TCPA settlements. For the year ended December 31, 2015, amount relates to the consent order with the CFPB that we entered into in September 2015. We believe these fees and expenses are not indicative of ongoing operations; therefore adjusting for these expenses enhances comparability to prior periods, anticipated future periods, and our competitors’ results. |
(4) | As we continue to acquire debt solution service providers around the world, the acquired intangible assets, such as trade names and customer relationships, have grown substantially, particularly in recent quarters. These intangible assets are valued at the time of the acquisition and amortized over their estimated lives. We believe that amortization of acquisition-related intangible assets, especially the amortization of an acquired company’s trade names and customer relationships, is the result of pre-acquisition activities. In addition, the amortization of these acquired intangibles is a non-cash static expense that is not affected by operations during any reporting period. As a result, the amortization of certain acquired intangible assets is excluded from our adjusted income from continuing operations attributable to Encore and adjusted income from continuing operations per share. |
(5) | Amount represents the total income tax effect of the adjustments, which is calculated based on the applicable marginal tax rate of the jurisdiction in which the portion of the adjustment occurred. |
(6) | Certain of the above pre-tax adjustments include expenses recognized by our partially-owned subsidiaries. This adjustment represents the portion of the non-GAAP adjustments that are attributable to noncontrolling interest. |
Adjusted EBITDA. Management utilizes adjusted EBITDA (defined as net income before discontinued operations, interest income and expense, taxes, depreciation and amortization, stock-based compensation expenses, acquisition, integration
55
and restructuring related expenses, settlement fees and related administrative expenses and other charges or gains that are not indicative of ongoing operations), in the evaluation of our operating performance. Adjusted EBITDA for the periods presented is as follows (in thousands):
Year Ended December 31, | |||||||||||
2016 | 2015 | 2014 | |||||||||
GAAP net income, as reported | $ | 16,817 | $ | 47,384 | $ | 98,278 | |||||
Adjustments: | |||||||||||
Loss (income) from discontinued operations, net of tax | 2,353 | 23,387 | (5,205 | ) | |||||||
Interest expense | 198,367 | 186,556 | 166,942 | ||||||||
Interest income(1) | (2,538 | ) | (1,664 | ) | (962 | ) | |||||
Provision for income taxes | 38,205 | 27,162 | 48,569 | ||||||||
Depreciation and amortization | 34,868 | 33,160 | 27,101 | ||||||||
Stock-based compensation expense | 12,627 | 22,008 | 17,181 | ||||||||
Acquisition, integration and restructuring related expenses(2) | 16,712 | 15,528 | 18,771 | ||||||||
Gain on reversal of contingent consideration(3) | (8,111 | ) | — | — | |||||||
Settlement fees and related administrative expenses(4) | 6,299 | 63,019 | — | ||||||||
Adjusted EBITDA | $ | 315,599 | $ | 416,540 | $ | 370,675 | |||||
Collections applied to principal balance(5) | $ | 738,989 | $ | 628,289 | $ | 614,665 | |||||
(1) | In the fourth quarter of 2016, we made a change to our presentation of adjusted EBITDA to adjust for interest income. In previous years we did not include interest income as an adjustment because it was immaterial. We have updated prior periods for comparability. |
(2) | Amount represents acquisition, integration and restructuring related expenses. We adjust for this amount because we believe these expenses are not indicative of ongoing operations; therefore adjusting for these expenses enhances comparability to prior periods, anticipated future periods, and our competitors’ results. |
(3) | Amount represents a gain recognized as a result of reversing a liability for contingent consideration that was established in October 2015 when we acquired a debt solution service provider in Europe. We have adjusted for this amount because we do not believe this is indicative of ongoing operations. Refer to Note 4 “Fair Value Measurement - Contingent Consideration” in the notes to our consolidated financial statements for further details. |
(4) | Amount represents litigation and government settlement fees and related administrative expenses. For the year ended December 31, 2016, amount consists of settlement and administrative fees related to certain TCPA settlements. For the year ended December 31, 2015, amount relates to the consent order with the CFPB that we entered into in September 2015. We believe these fees and expenses are not indicative of ongoing operations; therefore adjusting for these expenses enhances comparability to prior periods, anticipated future periods, and our competitors’ results. |
(5) | In our previous filings, amount was referred to as “Amount applied to principal on receivable portfolios.” Amount represents (a) gross collections from receivable portfolios less (b) revenue from receivable portfolios, net. Historically, we included this amount in our calculation of adjusted EBITDA. For transition purposes only, if we had included “collections applied to principal balance” in Adjusted EBITDA amounts would have been reported as: |
Year Ended December 31, | |||||||||||
2016 | 2015 | 2014 | |||||||||
Adjusted EBITDA (as reported above and as will be reported in future filings) | $ | 315,599 | $ | 416,540 | $ | 370,675 | |||||
Collections applied to principal balance | 738,989 | 628,289 | 614,665 | ||||||||
Adjusted EBITDA (using historical methods) | $ | 1,054,588 | $ | 1,044,829 | $ | 985,340 | |||||
Adjusted Operating Expenses. Management utilizes adjusted operating expenses in order to facilitate a comparison of approximate cash costs to cash collections for our portfolio purchasing and recovery business. Adjusted operating expenses for our portfolio purchasing and recovery business are calculated by starting with GAAP total operating expenses and backing out stock-based compensation expense, operating expenses related to non-portfolio purchasing and recovery business, acquisition, integration and restructuring related operating expenses, settlement fees and related administrative expenses and other charges or gains that are not indicative of ongoing operations. Adjusted operating expenses related to our portfolio purchasing and recovery business for the periods presented are as follows (in thousands):
56
Year Ended December 31, | |||||||||||
2016 | 2015 | 2014 | |||||||||
GAAP total operating expenses, as reported | $ | 787,744 | $ | 847,713 | $ | 734,958 | |||||
Adjustments: | |||||||||||
Stock-based compensation expense | (12,627 | ) | (22,008 | ) | (17,181 | ) | |||||
Operating expenses related to non-portfolio purchasing and recovery business(1) | (110,875 | ) | (88,548 | ) | (79,306 | ) | |||||
Acquisition, integration and restructuring related operating expenses(2) | (17,630 | ) | (15,528 | ) | (18,771 | ) | |||||
Gain on reversal of contingent consideration(3) | 8,111 | — | — | ||||||||
Settlement fees and related administrative expenses(4) | (6,299 | ) | (54,697 | ) | — | ||||||
Adjusted operating expenses related to portfolio purchasing and recovery business | $ | 648,424 | $ | 666,932 | $ | 619,700 | |||||
(1) | Operating expenses related to non-portfolio purchasing and recovery business include operating expenses from other operating segments that primarily engage in fee-based business, as well as corporate overhead not related to our portfolio purchasing and recovery business. |
(2) | Amount represents acquisition, integration and restructuring related operating expenses. We adjust for this amount because we believe these expenses are not indicative of ongoing operations; therefore adjusting for these expenses enhances comparability to prior periods, anticipated future periods, and our competitors’ results. |
(3) | Amount represents a gain recognized as a result of reversing a liability for contingent consideration that was established in October 2015 when we acquired a debt solution service provider in Europe. We have adjusted for this amount because we do not believe this is indicative of ongoing operations. Refer to Note 4 “Fair Value Measurement - Contingent Consideration” in the notes to our consolidated financial statements for further details. |
(4) | Amount represents litigation and government settlement fees and related administrative expenses. For the year ended December 31, 2016, amount consists of settlement and administrative fees related to certain TCPA settlements. For the year ended December 31, 2015, amount relates to the consent order with the CFPB that we entered into in September 2015. We believe these fees and expenses are not indicative of ongoing operations; therefore adjusting for these expenses enhances comparability to prior periods, anticipated future periods, and our competitors’ results. |
Supplemental Performance Data
The tables included in this supplemental performance data section include detail for purchases, collections and ERC by year of purchase. During any fiscal quarter in which we acquire an entity that has portfolio, the entire historical portfolio of the acquired company is aggregated into static pools for the quarter of acquisition based on common characteristics, resulting in pools for that quarter that may consist of several different vintages of portfolio. These quarterly pools are included in the tables in this section by year of purchase. For example, with the acquisition of Cabot in July 2013, all of Cabot’s historical portfolio to the date of the acquisition (which includes several years of historical purchases at various stages of maturity) is included in 2013 for Europe. Additional examples include, but are not limited to, the acquisition of Marlin in 2014 and the acquisition of dlc in 2015.
Our collection expectations are based on demographic data, account characteristics, and economic variables. Additional adjustments are made to account for qualitative factors that may affect the payment behavior of our consumers and servicing related adjustments to ensure our collection expectations are aligned with our operations. We continue to refine our process of forecasting collections both domestically and internationally with a focus on operational enhancements. As a result of this process, in the fourth quarter we identified additional ERC, most of which is on ZBA pool groups. Our collection expectations vary between types of portfolio and geographic location. For example, in the U.K., due to the higher concentration of payment plans, as compared to the U.S. and other locations in Europe, we expect to receive streams of collections over longer periods of time. As a result, past performance of pools in certain geographic locations or of certain types of portfolio are not necessarily a suitable indicator of future results in other locations or for other types of portfolio.
The supplemental performance data presented in this section is impacted by foreign currency translation, which represents the effect of translating financial results where the functional currency of our foreign subsidiary is different than our U.S. dollar reporting currency. For example, the strengthening of the U.S. dollar relative to other foreign currencies has an unfavorable reporting impact on our international purchases, collections, and ERC, and the weakening of the U.S. dollar relative to other foreign currencies has a favorable impact on our international purchases, collections, and ERC.
We utilize proprietary forecasting models to continuously evaluate the economic life of each pool.
During the quarter ended September 30, 2016, we revised the forecasting methodology we use to value and calculate IRRs on certain portfolios in Europe and extended the collection forecast from 120 months to 180 months. This change was made as a result of (1) our observation that older portfolios in Europe have consistently experienced cash collections beyond
57
120 months, (2) an expectation that regulatory changes in the United Kingdom resulting in a reduction in the number of highly discounted near term one-time settlements, an increase in the number of payment plans, and an increase in the length of existing payment plans will cause a lengthening of our collections curve, (3) an expectation that, as a result of a higher percentage of semi-performing account purchases in the United Kingdom in recent years, newer vintages will have a larger percentage of collections after 120 months and (4) our increased confidence in our ability to forecast future cash collections to 180 months. The increase in the collection forecast from 120 months to 180 months was applied effective July 1, 2016, to certain portfolios in Europe for which we could accurately forecast through such term. For portfolios in Europe that were not extended to 180 months, we will continue to include collection forecast to 120 months in calculating accretion revenue and in our estimated remaining collection disclosures. In the United States, we will continue to include collection forecast to 120 months in calculating accretion revenue. Expected collections beyond the 120 month collection forecast in the United States are included in our estimated remaining collection disclosures but are not included in the calculation of accretion revenue.
58
Cumulative Collections to Purchase Price Multiple
The following table summarizes our consumer and bankruptcy receivable purchases and related gross collections by year of purchase (in thousands, except multiples):
________________________
Year of Purchase | Purchase Price(1) | Cumulative Collections through December 31, 2016 | |||||||||||||||||||||||||||||||||||||||||||||||||||||
<2007 | 2007 | 2008 | 2009 | 2010 | 2011 | 2012 | 2013 | 2014 | 2015 | 2016 | Total(2) | CCM(3) | |||||||||||||||||||||||||||||||||||||||||||
United States: | |||||||||||||||||||||||||||||||||||||||||||||||||||||||
<2007 | $ | 719,081 | $ | 1,377,276 | $ | 286,676 | $ | 183,982 | $ | 114,648 | $ | 73,397 | $ | 52,137 | $ | 36,955 | $ | 28,242 | $ | 22,012 | $ | 18,835 | $ | 16,074 | $ | 2,210,234 | 3.1 | ||||||||||||||||||||||||||||
2007 | 204,063 | — | 68,048 | 145,272 | 111,117 | 70,572 | 44,035 | 29,619 | 20,812 | 14,431 | 12,002 | 9,240 | 525,148 | 2.6 | |||||||||||||||||||||||||||||||||||||||||
2008 | 227,752 | — | — | 69,049 | 165,164 | 127,799 | 87,850 | 59,507 | 41,773 | 29,776 | 23,247 | 18,563 | 622,728 | 2.7 | |||||||||||||||||||||||||||||||||||||||||
2009 | 252,984 | — | — | — | 96,529 | 206,773 | 164,605 | 111,569 | 80,443 | 58,345 | 42,960 | 30,150 | 791,374 | 3.1 | |||||||||||||||||||||||||||||||||||||||||
2010 | 357,367 | — | — | — | — | 125,853 | 288,788 | 220,686 | 156,806 | 111,993 | 83,578 | 55,650 | 1,043,354 | 2.9 | |||||||||||||||||||||||||||||||||||||||||
2011 | 385,274 | — | — | — | — | — | 123,596 | 301,949 | 226,521 | 155,180 | 112,906 | 77,256 | 997,408 | 2.6 | |||||||||||||||||||||||||||||||||||||||||
2012 | 549,035 | — | — | — | — | — | — | 187,721 | 350,134 | 259,252 | 176,914 | 113,067 | 1,087,088 | 2.0 | |||||||||||||||||||||||||||||||||||||||||
2013 | 552,433 | — | — | — | — | — | — | — | 230,051 | 397,646 | 298,068 | 203,386 | 1,129,151 | 2.0 | |||||||||||||||||||||||||||||||||||||||||
2014 | 519,136 | — | — | — | — | — | — | — | — | 144,178 | 307,814 | 216,357 | 668,349 | 1.3 | |||||||||||||||||||||||||||||||||||||||||
2015 | 501,300 | — | — | — | — | — | — | — | — | — | 105,610 | 231,101 | 336,711 | 0.7 | |||||||||||||||||||||||||||||||||||||||||
2016 | 559,421 | — | — | — | — | — | — | — | — | — | — | 110,876 | 110,876 | 0.2 | |||||||||||||||||||||||||||||||||||||||||
Subtotal | 4,827,846 | 1,377,276 | 354,724 | 398,303 | 487,458 | 604,394 | 761,011 | 948,006 | 1,134,782 | 1,192,813 | 1,181,934 | 1,081,720 | 9,522,421 | 2.0 | |||||||||||||||||||||||||||||||||||||||||
Europe: | |||||||||||||||||||||||||||||||||||||||||||||||||||||||
2013 | 619,079 | — | — | — | — | — | — | — | 134,259 | 249,307 | 212,129 | 165,610 | 761,305 | 1.2 | |||||||||||||||||||||||||||||||||||||||||
2014 | 630,343 | — | — | — | — | — | — | — | — | 135,549 | 198,127 | 156,665 | 490,341 | 0.8 | |||||||||||||||||||||||||||||||||||||||||
2015 | 423,352 | — | — | — | — | — | — | — | — | — | 65,870 | 127,084 | 192,954 | 0.5 | |||||||||||||||||||||||||||||||||||||||||
2016 | 259,485 | — | — | — | — | — | — | — | — | — | — | 44,641 | 44,641 | 0.2 | |||||||||||||||||||||||||||||||||||||||||
Subtotal | 1,932,259 | — | — | — | — | — | — | — | 134,259 | 384,856 | 476,126 | 494,000 | 1,489,241 | 0.8 | |||||||||||||||||||||||||||||||||||||||||
Other geographies: | |||||||||||||||||||||||||||||||||||||||||||||||||||||||
2012 | 6,706 | — | — | — | — | — | — | — | 3,848 | 2,561 | 1,208 | 542 | 8,159 | 1.2 | |||||||||||||||||||||||||||||||||||||||||
2013 | 29,568 | — | — | — | — | — | — | — | 6,617 | 17,615 | 10,334 | 4,606 | 39,172 | 1.3 | |||||||||||||||||||||||||||||||||||||||||
2014 | 86,989 | — | — | — | — | — | — | — | — | 9,652 | 16,062 | 18,403 | 44,117 | 0.5 | |||||||||||||||||||||||||||||||||||||||||
2015 | 91,290 | — | — | — | — | — | — | — | — | — | 15,061 | 57,064 | 72,125 | 0.8 | |||||||||||||||||||||||||||||||||||||||||
2016 | 79,890 | — | — | — | — | — | — | — | — | — | — | 29,269 | 29,269 | 0.4 | |||||||||||||||||||||||||||||||||||||||||
Subtotal | 294,443 | — | — | — | — | — | — | — | 10,465 | 29,828 | 42,665 | 109,884 | 192,842 | 0.7 | |||||||||||||||||||||||||||||||||||||||||
Total | $ | 7,054,548 | $ | 1,377,276 | $ | 354,724 | $ | 398,303 | $ | 487,458 | $ | 604,394 | $ | 761,011 | $ | 948,006 | $ | 1,279,506 | $ | 1,607,497 | $ | 1,700,725 | $ | 1,685,604 | $ | 11,204,504 | 1.6 | ||||||||||||||||||||||||||||
(1) | Adjusted for Put-Backs and Recalls. Recalls represent accounts that are recalled by the seller in accordance with the respective purchase agreement (“Recalls”). |
(2) | Cumulative collections from inception through December 31, 2016, excluding collections on behalf of others. |
(3) | Cumulative Collections Multiple (“CCM”) through December 31, 2016 refers to collections as a multiple of purchase price. |
59
Total Estimated Collections to Purchase Price Multiple
The following table summarizes our purchases, resulting historical gross collections, and estimated remaining gross collections for purchased consumer and bankruptcy receivables, by year of purchase (in thousands, except multiples):
Purchase Price(1) | Historical Collections(2) | Estimated Remaining Collections(3) | Total Estimated Gross Collections | Total Estimated Gross Collections to Purchase Price | ||||||||||||||
United States: | ||||||||||||||||||
<2007 | $ | 719,081 | $ | 2,210,234 | $ | 29,132 | $ | 2,239,366 | 3.1 | |||||||||
2007 | 204,063 | 525,148 | 21,999 | 547,147 | 2.7 | |||||||||||||
2008 | 227,752 | 622,728 | 47,822 | 670,550 | 2.9 | |||||||||||||
2009 | 252,984 | 791,374 | 73,155 | 864,529 | 3.4 | |||||||||||||
2010 | 357,367 | 1,043,354 | 108,431 | 1,151,785 | 3.2 | |||||||||||||
2011 | 385,274 | 997,408 | 147,782 | 1,145,190 | 3.0 | |||||||||||||
2012 | 549,035 | 1,087,088 | 195,173 | 1,282,261 | 2.3 | |||||||||||||
2013(4) | 552,433 | 1,129,151 | 357,628 | 1,486,779 | 2.7 | |||||||||||||
2014(4) | 519,136 | 668,349 | 432,089 | 1,100,438 | 2.1 | |||||||||||||
2015 | 501,300 | 336,711 | 551,667 | 888,378 | 1.8 | |||||||||||||
2016 | 559,421 | 110,876 | 917,194 | 1,028,070 | 1.8 | |||||||||||||
Subtotal | 4,827,846 | 9,522,421 | 2,882,072 | 12,404,493 | 2.6 | |||||||||||||
Europe: | ||||||||||||||||||
2013(4) | 619,079 | 761,305 | 804,903 | 1,566,208 | 2.5 | |||||||||||||
2014(4) | 630,343 | 490,341 | 756,966 | 1,247,307 | 2.0 | |||||||||||||
2015(4) | 423,352 | 192,954 | 542,850 | 735,804 | 1.7 | |||||||||||||
2016 | 259,485 | 44,641 | 502,918 | 547,559 | 2.1 | |||||||||||||
Subtotal | 1,932,259 | 1,489,241 | 2,607,637 | 4,096,878 | 2.1 | |||||||||||||
Other geographies: | ||||||||||||||||||
2012 | 6,706 | 8,159 | 1,931 | 10,090 | 1.5 | |||||||||||||
2013 | 29,568 | 39,172 | 3,844 | 43,016 | 1.5 | |||||||||||||
2014 | 86,989 | 44,117 | 109,871 | 153,988 | 1.8 | |||||||||||||
2015 | 91,290 | 72,125 | 120,528 | 192,653 | 2.1 | |||||||||||||
2016 | 79,890 | 29,269 | 114,434 | 143,703 | 1.8 | |||||||||||||
Subtotal | 294,443 | 192,842 | 350,608 | 543,450 | 1.8 | |||||||||||||
Total | $ | 7,054,548 | $ | 11,204,504 | $ | 5,840,317 | $ | 17,044,821 | 2.4 | |||||||||
(1) | Adjusted for Put-Backs and Recalls. |
(2) | Cumulative collections from inception through December 31, 2016, excluding collections on behalf of others. |
(3) | ERC for charged-off consumer receivables includes $74.2 million related to accounts that converted to bankruptcy after purchase. |
(4) | Includes portfolios acquired in connection with certain business combinations. |
60
Estimated Remaining Gross Collections by Year of Purchase
The following table summarizes our estimated remaining gross collections for purchased consumer and bankruptcy receivables by year of purchase (in thousands):
Estimated Remaining Gross Collections by Year of Purchase(1), (2) | |||||||||||||||||||||||||||||||||||||||||||
2017 | 2018 | 2019 | 2020 | 2021 | 2022 | 2023 | 2024 | 2025 | >2025 | Total | |||||||||||||||||||||||||||||||||
United States: | |||||||||||||||||||||||||||||||||||||||||||
<2007 | $ | 12,677 | $ | 9,892 | $ | 4,221 | $ | 1,933 | $ | 409 | $ | — | $ | — | $ | — | $ | — | $ | — | $ | 29,132 | |||||||||||||||||||||
2007 | 7,680 | 6,278 | 3,838 | 2,345 | 1,431 | 427 | — | — | — | — | 21,999 | ||||||||||||||||||||||||||||||||
2008 | 15,607 | 12,937 | 8,388 | 5,155 | 3,166 | 1,949 | 620 | — | — | — | 47,822 | ||||||||||||||||||||||||||||||||
2009 | 24,876 | 20,162 | 12,066 | 7,222 | 4,314 | 2,579 | 1,547 | 389 | — | — | 73,155 | ||||||||||||||||||||||||||||||||
2010 | 36,486 | 27,969 | 16,834 | 10,666 | 7,230 | 4,410 | 2,701 | 1,656 | 479 | — | 108,431 | ||||||||||||||||||||||||||||||||
2011 | 50,163 | 38,655 | 23,669 | 15,616 | 9,557 | 4,563 | 2,663 | 1,578 | 949 | 369 | 147,782 | ||||||||||||||||||||||||||||||||
2012 | 62,199 | 46,054 | 29,788 | 20,002 | 13,456 | 8,836 | 5,838 | 3,970 | 2,704 | 2,326 | 195,173 | ||||||||||||||||||||||||||||||||
2013(3) | 115,847 | 86,623 | 56,239 | 36,500 | 23,743 | 15,495 | 9,335 | 5,749 | 3,737 | 4,360 | 357,628 | ||||||||||||||||||||||||||||||||
2014(3) | 136,879 | 105,439 | 67,769 | 43,689 | 28,190 | 18,605 | 12,127 | 7,672 | 4,774 | 6,945 | 432,089 | ||||||||||||||||||||||||||||||||
2015 | 166,783 | 132,010 | 90,006 | 60,957 | 37,846 | 24,811 | 16,607 | 11,128 | 6,823 | 4,696 | 551,667 | ||||||||||||||||||||||||||||||||
2016 | 230,389 | 256,682 | 163,722 | 106,277 | 66,385 | 36,391 | 23,710 | 16,751 | 11,574 | 5,313 | 917,194 | ||||||||||||||||||||||||||||||||
Subtotal | 859,586 | 742,701 | 476,540 | 310,362 | 195,727 | 118,066 | 75,148 | 48,893 | 31,040 | 24,009 | 2,882,072 | ||||||||||||||||||||||||||||||||
Europe: | |||||||||||||||||||||||||||||||||||||||||||
2013(3) | 104,333 | 115,035 | 98,655 | 84,807 | 73,952 | 65,874 | 59,192 | 53,273 | 48,033 | 101,749 | 804,903 | ||||||||||||||||||||||||||||||||
2014(3) | 95,591 | 106,583 | 92,297 | 79,707 | 68,988 | 60,897 | 54,459 | 48,302 | 41,932 | 108,210 | 756,966 | ||||||||||||||||||||||||||||||||
2015(3) | 71,689 | 75,866 | 63,213 | 52,907 | 46,165 | 40,743 | 36,545 | 32,706 | 29,007 | 94,009 | 542,850 | ||||||||||||||||||||||||||||||||
2016 | 53,151 | 67,600 | 77,712 | 69,991 | 50,690 | 35,057 | 26,813 | 23,687 | 21,205 | 77,012 | 502,918 | ||||||||||||||||||||||||||||||||
Subtotal | 324,764 | 365,084 | 331,877 | 287,412 | 239,795 | 202,571 | 177,009 | 157,968 | 140,177 | 380,980 | 2,607,637 | ||||||||||||||||||||||||||||||||
Other geographies: | |||||||||||||||||||||||||||||||||||||||||||
2012 | 629 | 470 | 304 | 225 | 189 | 114 | — | — | — | — | 1,931 | ||||||||||||||||||||||||||||||||
2013 | 1,632 | 1,132 | 540 | 280 | 162 | 87 | 11 | — | — | — | 3,844 | ||||||||||||||||||||||||||||||||
2014 | 14,801 | 41,404 | 35,480 | 12,057 | 2,179 | 1,415 | 1,324 | 1,211 | — | — | 109,871 | ||||||||||||||||||||||||||||||||
2015 | 28,737 | 29,876 | 21,966 | 15,956 | 9,848 | 6,293 | 3,507 | 2,246 | 1,359 | 740 | 120,528 | ||||||||||||||||||||||||||||||||
2016 | 22,835 | 29,095 | 22,254 | 16,332 | 10,773 | 5,581 | 3,172 | 2,097 | 1,544 | 751 | 114,434 | ||||||||||||||||||||||||||||||||
Subtotal | 68,634 | 101,977 | 80,544 | 44,850 | 23,151 | 13,490 | 8,014 | 5,554 | 2,903 | 1,491 | 350,608 | ||||||||||||||||||||||||||||||||
Total | $ | 1,252,984 | $ | 1,209,762 | $ | 888,961 | $ | 642,624 | $ | 458,673 | $ | 334,127 | $ | 260,171 | $ | 212,415 | $ | 174,120 | $ | 406,480 | $ | 5,840,317 | |||||||||||||||||||||
(1) | ERC for ZBAs can extend beyond our collection forecasts. As part of our process to continually refine our forecasting of collections, in the fourth quarter, we identified approximately $167.1 million additional ERC for ZBAs. As of December 31, 2016, ERC for ZBAs include approximately $337.1 million for purchased consumer receivables in the United States. ERC for ZBAs for purchased consumer receivables in Europe and other geographies and purchased U.S. bankruptcy receivables were immaterial. |
(2) | ERC for purchased consumer receivables includes $74.2 million related to accounts that converted to bankruptcy after purchase. The collection forecast of each pool is generally estimated up to 120 months in the United States and up to 180 months in Europe. Expected collections beyond the 120 month collection forecast in the United States are included in ERC but are not included in the calculation of IRRs. |
(3) | Includes portfolios acquired in connection with certain business combinations. |
61
Unamortized Balances of Portfolios
The following table summarizes the remaining unamortized balances of our purchased receivable portfolios by year of purchase (in thousands, except percentages):
Unamortized Balance as of December 31, 2016 | Purchase Price(1) | Unamortized Balance as a Percentage of Purchase Price | Unamortized Balance as a Percentage of Total | ||||||||||
United States: | |||||||||||||
2007 | $ | 941 | $ | 204,063 | 0.5 | % | 0.1 | % | |||||
2008 | 3,631 | 227,752 | 1.6 | % | 0.3 | % | |||||||
2009 | — | 252,984 | 0.0 | % | 0.0 | % | |||||||
2010 | 807 | 345,396 | 0.2 | % | 0.1 | % | |||||||
2011 | 7,866 | 383,632 | 2.1 | % | 0.7 | % | |||||||
2012 | 38,886 | 549,035 | 7.1 | % | 3.4 | % | |||||||
2013(2) | 90,720 | 552,433 | 16.4 | % | 7.8 | % | |||||||
2014(2) | 187,083 | 519,136 | 36.0 | % | 16.2 | % | |||||||
2015 | 313,089 | 501,300 | 62.5 | % | 27.0 | % | |||||||
2016 | 515,260 | 559,421 | 92.1 | % | 44.5 | % | |||||||
Subtotal | 1,158,283 | 4,095,152 | 28.3 | % | 100.0 | % | |||||||
Europe: | |||||||||||||
2013(2) | 256,725 | 619,079 | 41.5 | % | 24.4 | % | |||||||
2014(2) | 308,568 | 630,343 | 49.0 | % | 29.4 | % | |||||||
2015(2) | 255,445 | 423,352 | 60.3 | % | 24.3 | % | |||||||
2016 | 230,225 | 259,485 | 88.7 | % | 21.9 | % | |||||||
Subtotal | 1,050,963 | 1,932,259 | 54.4 | % | 100.0 | % | |||||||
Other geographies: | |||||||||||||
2013 | 1,008 | 29,568 | 3.4 | % | 0.6 | % | |||||||
2014 | 56,691 | 86,989 | 65.2 | % | 32.7 | % | |||||||
2015 | 51,758 | 91,290 | 56.7 | % | 29.8 | % | |||||||
2016 | 64,106 | 79,890 | 80.2 | % | 36.9 | % | |||||||
Subtotal | 173,563 | 287,737 | 60.3 | % | 100.0 | % | |||||||
Total | $ | 2,382,809 | $ | 6,315,148 | 37.7 | % | 100.0 | % | |||||
(1) | Purchase price refers to the cash paid to a seller to acquire a portfolio less Put-Backs, Recalls, and other adjustments. |
(2) | Includes portfolios acquired in connection with certain business combinations. |
62
Estimated Future Amortization of Portfolios
As of December 31, 2016, we had $2.4 billion in investment in receivable portfolios. This balance will be amortized based upon current projections of cash collections in excess of revenue applied to the principal balance. The estimated amortization of the investment in receivable portfolios balance is as follows (in thousands):
Years Ending December 31, | United States | Europe | Other Geographies | Total Amortization | |||||||||||
2017 | $ | 264,593 | $ | 77,596 | $ | 7,754 | $ | 349,943 | |||||||
2018 | 318,420 | 139,548 | 51,890 | 509,858 | |||||||||||
2019 | 208,066 | 117,907 | 50,121 | 376,094 | |||||||||||
2020 | 140,151 | 97,707 | 28,829 | 266,687 | |||||||||||
2021 | 92,172 | 83,019 | 13,732 | 188,923 | |||||||||||
2022 | 56,372 | 74,256 | 10,365 | 140,993 | |||||||||||
2023 | 37,447 | 70,989 | 4,231 | 112,667 | |||||||||||
2024 | 23,651 | 67,450 | 3,149 | 94,250 | |||||||||||
2025 | 13,028 | 73,724 | 2,163 | 88,915 | |||||||||||
2026 | 4,383 | 64,735 | 1,329 | 70,447 | |||||||||||
2027 | — | 66,414 | — | 66,414 | |||||||||||
2028 | — | 65,960 | — | 65,960 | |||||||||||
2029 | — | 30,798 | — | 30,798 | |||||||||||
2030 | — | 15,981 | — | 15,981 | |||||||||||
2031 | — | 4,879 | — | 4,879 | |||||||||||
Total | $ | 1,158,283 | $ | 1,050,963 | $ | 173,563 | $ | 2,382,809 | |||||||
Headcount by Function by Geographic Location
The following table summarizes our headcount by function and by geographic location:
Headcount as of December 31, | |||||||||||||||||
2016 | 2015 | 2014 | |||||||||||||||
Domestic | International | Domestic(1) | International | Domestic(1) | International | ||||||||||||
General & Administrative | 894 | 2,151 | 944 | 2,198 | 1,010 | 1,628 | |||||||||||
Account Manager | 287 | 3,371 | 269 | 3,254 | 351 | 2,388 | |||||||||||
Total | 1,181 | 5,522 | 1,213 | 5,452 | 1,361 | 4,016 | |||||||||||
(1) | Headcount as of December 31, 2015 and 2014 includes 79 and 86 Propel employees, respectively. |
63
Purchases by Quarter
The following table summarizes the consumer receivable portfolios and bankruptcy receivables we purchased by quarter, and the respective purchase prices (in thousands):
Quarter | # of Accounts | Face Value | Purchase Price | |||||||
Q1 2014(1) | 1,104 | $ | 4,288,159 | $ | 467,565 | |||||
Q2 2014 | 1,210 | 3,075,343 | 225,762 | |||||||
Q3 2014(1) | 2,203 | 3,970,145 | 299,509 | |||||||
Q4 2014 | 859 | 2,422,128 | 258,524 | |||||||
Q1 2015 | 734 | 1,041,011 | 125,154 | |||||||
Q2 2015(1) | 2,970 | 5,544,885 | 418,780 | |||||||
Q3 2015 | 1,267 | 2,085,381 | 187,180 | |||||||
Q4 2015(1) | 2,363 | 4,068,252 | 292,608 | |||||||
Q1 2016 | 1,450 | 3,544,338 | 256,753 | |||||||
Q2 2016 | 946 | 2,841,527 | 233,116 | |||||||
Q3 2016 | 874 | 1,475,381 | 206,359 | |||||||
Q4 2016 | 1,159 | 1,943,775 | 210,491 | |||||||
________________________
(1) | Includes portfolios acquired in connection with certain business combinations. |
Liquidity and Capital Resources
Liquidity
The following table summarizes our cash flow activity, including the cash flows from discontinued operations, for the periods presented (in thousands):
Year Ended December 31, | |||||||||||
2016 | 2015 | 2014 | |||||||||
Net cash provided by operating activities | $ | 130,332 | $ | 114,425 | $ | 111,544 | |||||
Net cash used in investing activities | (168,789 | ) | (472,709 | ) | (755,197 | ) | |||||
Net cash provided by financing activities | 43,253 | 401,845 | 626,323 | ||||||||
Operating Cash Flows
Cash flows from operating activities represent the cash receipts and disbursements related to all of our activities other than investing and financing activities. Operating cash flows are derived by adjusting net income for non-cash operating items such as depreciation and amortization, allowance charges and stock-based compensation charges, and changes in operating assets and liabilities which reflect timing differences between the receipt and payment of cash associated with transactions and when they are recognized in results of operations.
Net cash provided by operating activities was $130.3 million, $114.4 million, and $111.5 million for the years ended December 31, 2016, 2015, and 2014, respectively.
Cash provided by operating activities during the year ended December 31, 2016 was primarily related to net income of $16.8 million, adjustments for discontinued operations, various non-cash add backs in operating activities, including portfolio allowance charges, and changes in operating assets and liabilities. Cash provided by operating activities during the year ended December 31, 2015 was primarily related to net income of $47.4 million, $23.4 million loss from discontinued operations, in addition to other non-cash add backs in operating activities and changes in operating assets and liabilities. Cash provided by operating activities during the year ended December 31, 2014 was primarily related to net income of $98.3 million and various non-cash add backs in operating activities and changes in operating assets and liabilities.
Investing Cash Flows
Net cash used in investing activities was $168.8 million, $472.7 million and $755.2 million for the years ended December 31, 2016, 2015 and 2014, respectively.
64
The cash flows used in investing activities during the year ended December 31, 2016 were primarily related to receivable portfolio purchases of $907.4 million, offset by collection proceeds applied to the principal of our receivable portfolios in the amount of $659.3 million and $106.0 million of proceeds from divestiture of Propel, net of cash divested. The cash flows used in investing activities during the year ended December 31, 2015 were primarily related to cash paid for acquisitions, net of cash acquired, of $276.6 million, receivable portfolio purchases (excluding the portfolios acquired from the acquisition of dlc of $216.0 million and from the acquisition of Baycorp of $60.3 million) of $749.8 million, offset by collection proceeds applied to the principal of our receivable portfolios in the amount of $635.9 million. The cash flows used in investing activities during the year ended December 31, 2014 were primarily related to cash paid for acquisitions, net of cash acquired, of $446.2 million, receivable portfolio purchases (excluding the portfolios acquired from the acquisition of Marlin of $208.5 million and from the acquisition of Atlantic of $105.4 million) of $863.0 million, offset by collection proceeds applied to the principal of our receivable portfolios in the amount of $634.0 million.
Financing Cash Flows
Net cash provided by financing activities was $43.3 million, $401.8 million and $626.3 million for the years ended December 31, 2016, 2015 and 2014, respectively.
The cash provided by financing activities during the year ended December 31, 2016 primarily reflects $586.0 million in borrowings under our credit facilities and $442.6 million of proceeds from the Cabot 2023 Notes (defined below), offset by $615.9 million in repayments of amounts outstanding under our credit facilities and $352.5 million in repayment of Cabot’s senior secured notes due 2019. The cash provided by financing activities during the year ended December 31, 2015 primarily reflects $1.1 billion in borrowings under our credit facilities and $332.7 million of proceeds from Cabot’s floating rate notes, offset by $898.1 million in repayments of amounts outstanding under our credit facilities and $33.2 million in repurchases of our common stock. The cash provided by financing activities during the year ended December 31, 2014 primarily reflects $1.3 billion in borrowings under our credit facilities, $288.6 million of proceeds from Cabot’s senior secured notes, $161.0 million of proceeds from the issuance of Encore’s convertible senior notes due 2021, and $134.0 million of proceeds from the issuance of Propel’s securitized notes, offset by $1.2 billion in repayments of amounts outstanding under our credit facilities and $33.6 million in purchases of convertible hedge instruments, including the payment for our warrant restrike transaction associated with Encore’s convertible notes due 2017.
Capital Resources
Historically, we have met our cash requirements by utilizing our cash flows from operations, bank borrowings, convertible debt offerings, and equity offerings. From time to time, depending on the capital markets, we consider additional financings to fund our operations and acquisitions. Our primary cash requirements have included the purchase of receivable portfolios, the acquisition of U.S. and international entities, operating expenses, the payment of interest and principal on borrowings, and the payment of income taxes.
On December 20, 2016, we amended our revolving credit facility and term loan facility pursuant to a Third Amended and Restated Credit Agreement (as amended, the “Restated Credit Agreement”). The Restated Credit Agreement includes a revolving credit facility of $781.7 million (the “Revolving Credit Facility”), a term loan facility of $166.4 million (the “Term Loan Facility”, and together with the Revolving Credit Facility, the “Senior Secured Credit Facilities”), and an accordion feature that allows us to increase the Revolving Credit Facility by an additional $250.0 million. Including the accordion feature, the maximum amount that can be borrowed under the Senior Secured Credit Facilities is approximately $1.2 billion. The Senior Secured Credit Facilities have a five-year maturity, expiring in December 2021, except with respect to (1) revolving commitments under the Revolving Credit Facility of $32.1 million and $207.8 million expiring in November 2017 and February 2019, respectively, and (2) three subtranches of the Term Loan Facility of $50.6 million $4.9 million and $22.6 million, expiring in February 2017, November 2017 and February 2019, respectively. As of December 31, 2016, we had $742.6 million outstanding and $203.7 million of availability under the Senior Secured Credit Facilities.
On October 6, 2016, Cabot Financial (Luxembourg) S.A. (“Cabot Financial”), an indirect subsidiary of Encore, issued £350 million (approximately $442.6 million) in aggregate principal amount of 7.50% Senior Secured Notes due 2023 (the “Cabot 2023 Notes”). The majority of the proceeds from the offering were used to redeem in full Cabot’s £265.0 million 10.375% senior secured notes due 2019 and partially repay amounts outstanding under the Cabot Credit Facility (defined below).
Through Cabot Financial (UK) Limited (“Cabot Financial UK”), an indirect subsidiary, we have a revolving credit facility of £250.0 million (the “Cabot Credit Facility”). The Cabot Credit Facility includes an uncommitted accordion facility which will allow the facility to be increased by an additional £50.0 million, subject to obtaining the requisite commitments and compliance with the terms of Cabot Financial UK’s other indebtedness. As of December 31, 2016, we had £27.0 million
65
(approximately $33.2 million) outstanding and £223.0 million (approximately $274.4 million) of availability under the Cabot Credit Facility.
Currently, all of our portfolio purchases are funded with cash from operations and borrowings under our Senior Secured Credit Facilities and our Cabot Credit Facility.
We are in compliance with all covenants under our financing arrangements. See Note 10, “Debt” to our consolidated financial statements for a further discussion of our debt.
Our cash and cash equivalents at December 31, 2016 consisted of $35.2 million held by U.S.-based entities and $114.6 million held by foreign entities. Most of our cash and cash equivalents held by foreign entities is indefinitely reinvested and may be subject to material tax effects if repatriated. However, we believe that our U.S. sources of cash and liquidity are sufficient to meet our business needs in the United States and do not expect that we will need to repatriate the funds.
In November and December 2012, we sold $115.0 million aggregate principal amount of 3.0% 2017 Convertible Notes in private placement transactions. These convertible notes will mature on November 27, 2017.
In 2010 and 2011 we entered into an aggregate of $75.0 million in senior secured notes with certain affiliates of Prudential Capital Group (the “Senior Secured Notes”). As of December 31, 2016, $11.3 million of the Senior Secured Notes were outstanding, with $10.3 million due in 2017 and $1.0 million due in 2018.
We believe that we have sufficient liquidity to fund our operations, including payments for the maturing debt discussed above, for at least the next twelve months, given our expectation of continued positive cash flows from operations, our cash and cash equivalents, our access to capital markets, and availability under our credit facilities. Our future cash needs will depend on our acquisitions of portfolios and businesses. The divestiture of Propel provided liquidity to deleverage our company and pay down our debt. Additionally, it is expected to improve our overall corporate return on invested capital and provide us additional liquidity for increased investment capital flexibility.
Future Contractual Cash Obligations
The following table summarizes our future contractual cash obligations as of December 31, 2016 (in thousands):
Payment Due By Period | |||||||||||||||||||
Contractual Obligations | Total | Less Than 1 Year | 1 – 3 Years | 3 – 5 Years | More Than 5 Years | ||||||||||||||
Principal payments on debt | $ | 2,653,052 | $ | 221,131 | $ | 323,220 | $ | 1,662,648 | $ | 446,053 | |||||||||
Estimated interest payments(1) | 670,085 | 146,193 | 290,553 | 176,822 | 56,517 | ||||||||||||||
Capital leases | 5,445 | 3,470 | 1,705 | 270 | — | ||||||||||||||
Operating leases | 61,824 | 17,347 | 21,315 | 11,960 | 11,202 | ||||||||||||||
Purchase commitments on receivable portfolios | 262,114 | 254,744 | 7,370 | — | — | ||||||||||||||
Preferred equity certificates(2) | 205,975 | — | — | — | 205,975 | ||||||||||||||
Total contractual cash obligations(3) | $ | 3,858,495 | $ | 642,885 | $ | 644,163 | $ | 1,851,700 | $ | 719,747 | |||||||||
________________________
(1) | Estimated interest payments are calculated based on outstanding principal amounts, applicable fixed interest rates or currently effective interest rates as of December 31, 2016 for variable rate debt, timing of scheduled payments and the term of the debt obligations. |
(2) | As of December 31, 2016, we carried a liability of approximately $206.0 million related to principal and accumulated interests for PECs issued in connection with the Cabot Acquisition. The PECs have a maturity date of May 2043, accrue interest at 12% per annum, and are held by Cabot’s noncontrolling interest holders. The future accrued interest is excluded from the table above due to uncertainty in determining the timing of the payment because the payment will only be satisfied in connection with the disposition of the noncontrolling interest. See Note 10, “Debt” to our consolidated financial statements for additional information on our PECs. |
(3) | We had approximately $21.2 million of liabilities and accrued interests related to uncertain tax positions at December 31, 2016. We are unable to reasonably estimate the timing of the cash settlement with the tax authorities due to the uncertainties related to these tax matters and, as a result, these obligations are not included in the table. See Note 13, “Income Taxes” to our consolidated financial statements for additional information on our uncertain tax positions. |
Off-Balance Sheet Arrangements
We do not have any off-balance sheet arrangements as defined by Item 303(a)(4) of Regulation S-K.
66
Critical Accounting Policies and Estimates
We prepare our financial statements, in conformity with GAAP, which requires management to make estimates and assumptions that affect the reported amounts of assets and liabilities and disclosure of contingent assets and liabilities at the date of the financial statements and the reported amounts of revenues and expenses during the reporting period. Note 1, “Ownership, Description of Business and Summary of Significant Accounting Policies” of the notes to consolidated financial statements describes the significant accounting policies and methods used in the preparation of our consolidated financial statements.
We base our estimates on past experience and other assumptions that we believe are reasonable under the circumstances, and we evaluate these estimates on an ongoing basis. Actual results may differ from these estimates and such differences may be material. We refer to accounting estimates of this type as critical accounting policies and estimates, which we discuss further below. We have reviewed our critical accounting policies and estimates with the audit committee of our board of directors.
Investment in Receivable Portfolios and Related Revenue. As permitted by the authoritative guidance for loans and debt securities acquired with deteriorated credit quality, static pools are established on a quarterly basis with accounts purchased during the quarter that have common risk characteristics. Discrete receivable portfolio purchases during a quarter are aggregated into pools based on these common risk characteristics. Once a static pool is established, the portfolios are permanently assigned to the pool. The discount (i.e., the difference between the cost of each static pool and the related aggregate contractual receivable balance) is not recorded because we expect to collect a relatively small percentage of each static pool’s contractual receivable balance. As a result, receivable portfolios are recorded at cost at the time of acquisition. The purchase cost of the portfolios includes certain fees paid to third parties incurred in connection with the direct acquisition of the receivable portfolios.
In compliance with the authoritative guidance, we account for our investments in consumer receivable portfolios using either the interest method or the cost recovery method. The interest method applies an IRR, to the cost basis of the pool, which remains unchanged throughout the life of the pool, unless there is an increase in subsequent expected cash flows. Subsequent increases in expected cash flows are generally recognized prospectively through an upward adjustment of the pool’s IRR over its remaining life. Subsequent decreases in expected cash flows do not change the IRR, but are recognized as an allowance to the cost basis of the pool, and are reflected in the consolidated statements of income as a reduction in revenue, with a corresponding valuation allowance, offsetting the investment in receivable portfolios in the consolidated statements of financial condition.
We account for each static pool as a unit for the economic life of the pool (similar to one loan) for recognition of revenue from receivable portfolios, for collections applied to the cost basis of receivable portfolios and for provision for loss or allowance. Revenue from receivable portfolios is accrued based on each pool’s IRR applied to each pool’s adjusted cost basis. The cost basis of each pool is increased by revenue earned and decreased by gross collections and portfolio allowances.
If the amount and timing of future cash collections on a pool of receivables are not reasonably estimable, we account for that pool using the cost recovery method. The accounts in these portfolios have different risk characteristics than those included in other portfolios acquired during the same quarter, or the necessary information was not available to estimate future cash flows and, accordingly, they were not aggregated with other portfolios. Under the cost recovery method of accounting, no revenue is recognized until the carrying value of a cost recovery portfolio has been fully recovered.
Deferred Court Costs. We pursue legal collection using a network of attorneys that specialize in collection matters and through our internal legal channel. We generally pursue collections through legal means only when we believe a consumer has sufficient assets to repay their indebtedness but has, to date, been unwilling to pay. In connection with our agreements with our contracted attorneys, we advance certain out-of-pocket court costs, or Deferred Court Costs. We capitalize these costs in the consolidated financial statements and provide a reserve for those costs that we believe will ultimately be uncollectible. We determine the reserve based on our analysis of court costs that have been advanced and recovered, or that we anticipate recovering. We write off any Deferred Court Cost not recovered within five years of placement. Collections received through litigation are first applied against related court costs with the balance applied to the debtors’ account.
Goodwill and Other Intangible Assets. Business combinations typically result in the recording of goodwill and other intangible assets. The excess of the purchase price over the fair value assigned to the tangible and identifiable intangible assets, liabilities assumed, and noncontrolling interest in the acquiree is recorded as goodwill.
Goodwill and indefinite-lived intangible assets are tested at the reporting unit level for impairment annually and in interim periods if certain events occur indicating that the carrying amounts may be impaired. Determining the number of reporting units and the fair value of a reporting unit requires us to make judgments and involves the use of significant estimates
67
and assumptions. We have five reporting units identified for goodwill impairment testing purposes. The annual goodwill testing date for these reporting units is October 1st.
We first assess qualitative factors to determine whether it is necessary to perform the two-step quantitative goodwill impairment test. The qualitative factors include economic environment, business climate, market capitalization, operating performance, competition, and other factors. We may proceed directly to the two-step quantitative test without performing the qualitative test.
The first step involves measuring the recoverability of goodwill at the reporting unit level by comparing the estimated fair value of the reporting unit in which the goodwill resides to its carrying value. The second step, if necessary, measures the amount of impairment, if any, by comparing the implied fair value of goodwill to its carrying value. We apply various valuation techniques to measure the fair value of each reporting unit, including the income approach and the market approach. For goodwill impairment analyses conducted at most of the reporting units, we use the income approach in determining fair value, specifically the discounted cash flow method, or DCF. In applying the DCF method, an identified level of future cash flow is estimated. Annual estimated cash flows and a terminal value are then discounted to their present value at an appropriate discount rate to obtain an indication of fair value. The discount rate utilized reflects estimates of required rates of return for investments that are seen as similar to an investment in the reporting unit. DCF analyses are based on management’s long-term financial projections and require significant judgments, therefore, for most of our reporting units where we have access to reliable market participant data, the market approach is conducted in addition to the income approach in determining the fair value. We use a guideline company method under the market approach to estimate the fair value of equity and market value of invested capital (“MVIC”). The guideline company approach relies on estimated remaining collections data or earnings before interest, tax, depreciation and amortization (“EBITDA”) for each of the selected guideline companies, which enables a direct comparison between the reporting unit and the selected peer group. We believe that the current methodology used in determining the fair value of our reporting units represent the best estimate. In addition, we compare the aggregate fair value of the reporting units to our overall market capitalization.
Due to the large allowance charge recorded during the third quarter of 2016, the carrying value at our Cabot reporting unit became negative at October 1, 2016. According to authoritative guidance, if the carrying amount of a reporting unit is zero or negative, the traditional step two of the impairment test should be performed to measure the amount of impairment loss, if any, when it is more likely than not that a goodwill impairment exists. In considering whether it is more likely than not that a goodwill impairment exists, an entity can perform a step zero qualitative analysis. We conducted a qualitative analysis and concluded that there was no indication that a goodwill impairment existed at this reporting unit. For our annual goodwill impairment tests performed at October 1, 2016 for the remaining four reporting units, the estimated fair value of each of these reporting units exceeded its respective carrying value. As a result, no impairment existed at any of these reporting units.
Significant judgments are required to estimate the fair value of reporting units including estimating future cash flows, determining appropriate discount rates, growth rates, comparable guideline companies and other assumptions. Future business conditions and/or activities could differ materially from the projections made by management, which in turn, could result in the need for impairment charges. We will perform additional impairment testing if events occur or circumstances change indicating that the carrying amounts may be impaired.
Redeemable Noncontrolling Interest. Some minority shareholders in certain of our subsidiaries have the right, at certain times, to require us to acquire their ownership interest in those entities at fair value and, in some cases, to force a sale of the subsidiary if we choose not to purchase their interests at fair value. The noncontrolling interest subject to these arrangements is included in temporary equity as redeemable noncontrolling interest, and is adjusted to its estimated redemption amount each reporting period with a corresponding adjustment to additional paid-in capital. Future reductions in the carrying amount are subject to a “floor” amount that is equal to the fair value of the redeemable noncontrolling interest at the time it was originally recorded. The recorded value of the redeemable noncontrolling interest cannot go below the floor. Adjustments to the carrying amount of redeemable noncontrolling interest are charged to retained earnings (or to additional paid-in capital if there are no retained earnings) and do not affect net income or comprehensive income in the consolidated financial statements.
Stock-Based Compensation. We record compensation costs related to our stock-based awards which include stock options, restricted stock awards, and restricted stock units. We measure stock-based compensation cost at the grant date based on the fair value of the award. Compensation cost for service-based awards is recognized ratably over the applicable vesting period. Compensation cost for performance-based awards is reassessed each period and recognized based upon the probability that the performance targets will be achieved. The amount of stock-based compensation expense recognized during a period is based on the portion of the awards that are ultimately expected to vest. We have certain share awards that include market conditions that affect vesting, the fair value of these shares is estimated using a lattice model. Compensation cost for these awards is not adjusted if the market condition is not met, as long as the requisite service is completed.
68
Income Taxes. We use the liability method of accounting for income taxes. When we prepare the consolidated financial statements, we estimate our income taxes based on the various jurisdictions where we conduct business. This requires us to estimate our current tax exposure and to assess temporary differences that result from differing treatments of certain items for tax and accounting purposes. Deferred income taxes are recognized based on the differences between the financial statement and income tax bases of assets and liabilities using enacted tax rates in effect for the year in which the differences are expected to reverse. We then assess the likelihood that our deferred tax assets will be realized. Valuation allowances are established, when necessary, to reduce deferred tax assets to the amount expected to be realized. When we establish a valuation allowance or increase this allowance in an accounting period, we record a corresponding tax expense in our statement of income. When we reduce our valuation allowance in an accounting period, we record a corresponding tax benefit in our statement of income. We include interest and penalties related to income taxes within our provision for income taxes. See Note 13, “Income Taxes” to our consolidated financial statements for further discussion of income taxes.
Recent Accounting Pronouncements
Information regarding recent accounting pronouncements and the impact of those pronouncements, if any, on our consolidated financial statements is provided in this Annual Report in “Note 1, Ownership, Description of Business, and Summary of Significant Accounting Policies” to our consolidated financial statements.
Item 7A—Quantitative and Qualitative Disclosures About Market Risk
We are exposed to economic risks from foreign currency exchange rates and interest rates. A portion of these risks is hedged, but the risks may affect our financial statements.
Foreign Currency Exchange Rates
We have operations in foreign countries, which expose us to foreign currency exchange rate fluctuations due to transactions denominated in foreign currencies. Our primary risk of loss due to foreign currency exchange rate risk is related to Euro to British Pound and Indian rupee to U.S. dollar exchange rates. We continuously evaluate and manage our foreign currency risk through the use of derivative financial instruments, including foreign currency forward contracts with financial counterparties where practicable. Such derivative instruments are viewed as risk management tools and are not used for speculative or trading purposes.
Beginning in 2016, we have currency exchange forward contracts to reduce the effects of currency exchange rate fluctuations between the British Pound and Euro. These derivative contracts generally mature within one to three months and are not designated as hedge instruments for accounting purposes. The gains or losses on these derivative contracts are recognized in other income or expense based on the changes in fair value.
As of December 31, 2016, we had outstanding foreign currency forward contracts that hedge our risk of foreign currency exchange between the British Pound and Euro with a net fair value liability position of approximately $0.9 million. The functional currency of the subsidiary that carries the hedge contracts is British Pound and the reporting currency is the U.S. dollar. We considered the historical trends in currency exchange rates and determined that it was reasonably possible that changes in exchange rates of 10% between the British Pound and the Euro and 10% between the British Pound and U.S. dollar could be experienced in the near term. If the Euro weakened by 10% against the British Pound and the U.S. dollar weakened by 10% against the British Pound at December 31, 2016, the result would have had an unfavorable effect to the fair value of the derivatives of approximately $11.6 million. If the Euro strengthened by 10% against the British Pound and the U.S. dollar strengthened by 10% against the British Pound at December 31, 2016, the result would have had a favorable effect to the fair value of the derivatives of approximately $14.1 million.
In addition, we have currency exchange forward contracts that hedge the forecasted monthly cash settlements resulting from the expenses incurred by our operations in India. These foreign currency forward contracts are designated as cash flow hedging instruments and qualify for hedge accounting treatment. Gains and losses arising from the effective portion of such contracts are recorded as a component of accumulated other comprehensive income (“OCI”) as gains and losses on derivative instruments, net of income taxes. The hedging gains and losses in OCI are subsequently reclassified into earnings in the same period in which the underlying transactions affect our earnings. If all or a portion of the forecasted transaction is cancelled, this would render all or a portion of the cash flow hedge ineffective and we would reclassify the ineffective portion of the hedge into earnings. We generally do not experience ineffectiveness of the hedge relationship and the accompanying consolidated financial statements do not include any such gains or losses.
As of December 31, 2016, our outstanding foreign currency forward contracts that hedge our risk of foreign currency exchange against the Indian rupee had a fair value asset position of $0.7 million. We considered the historical trends in
69
currency exchange rates and determined that it was reasonably possible that changes in exchange rates of 10% for the Indian rupee could be experienced in the near term. If the U.S. dollar weakened by 10% against the Indian rupee at December 31, 2016, the result would have had an unfavorable effect to the fair value of the derivatives of approximately $2.7 million. If the U.S. dollar strengthened by 10% against the Indian rupee at December 31, 2016 the result would have had a favorable effect to the fair value of the derivatives of approximately $3.3 million.
Interest Rates
We have variable-interest-bearing borrowings under our credit facilities that subject us to interest rate risk. We have, from time to time, utilized derivative financial instruments, including interest rate swap contracts and interest rate caps with financial counterparties to manage our interest rate risk. As of December 31, 2016, our subsidiary Baycorp had one interest rate swap agreement outstanding with a total notional amount of $17.5 million Australian dollars (approximately $12.6 million U.S. dollars). The interest rate swap instrument is designated as a cash flow hedge and accounted for using hedge accounting.
Our variable-interest-bearing debt is subject to the risk of interest rate fluctuations. Significant increases in future interest rates on our variable rate debt could lead to a material decrease in future earnings assuming all other factors remained constant. If the market interest rates for our variable rate agreements increase 10%, interest expense on such outstanding debt would increase by approximately $5.2 million, on an annualized basis. Conversely, if the market interest rates decreased an average of 10%, our interest expense on such outstanding debt would decrease by $5.2 million on an annualized basis.
Our analysis and methods used to assess and mitigate the risks discussed above should not be considered projections of future risks.
Item 8—Financial Statements and Supplementary Data
Our consolidated financial statements, the notes thereto and the Report of BDO USA, LLP, our Independent Registered Public Accounting Firm, are included in this Annual Report on Form 10-K on pages F-1 through F-42.
Item 9—Changes in and Disagreements With Accountants on Accounting and Financial Disclosure
None.
Item 9A—Controls and Procedures
Evaluation of Disclosure Controls and Procedures
As of the end of the period covered by this report, we carried out an evaluation, under the supervision and with the participation of our management, including our Chief Executive Officer and Chief Financial Officer, of the effectiveness of the design and operation of our disclosure controls and procedures, as defined in Exchange Act Rule 13a-15(e) and 15d-15(e). Based upon that evaluation, our Chief Executive Officer and Chief Financial Officer concluded that, as of the end of the period covered by this Annual Report on Form 10-K, our disclosure controls and procedures are effective in enabling us to record, process, summarize and report information required to be included in our periodic SEC filings within the required time period.
Management’s Report on Internal Control over Financial Reporting
The Company’s management, including our Chief Executive Officer and Chief Financial Officer, is responsible for establishing and maintaining adequate internal control over financial reporting (as such term is defined in Exchange Act Rule 13a-15(f) and 15d-15(f)) for Encore Capital Group, Inc. and its subsidiaries (the “Company”). The Company’s internal control system was designed to provide reasonable assurance to the Company’s management and Board of Directors regarding the preparation and fair presentation of published consolidated financial statements in accordance with accounting principles generally accepted in the United States of America.
Because of its inherent limitations, a system of internal control over financial reporting can provide only reasonable assurance and may not prevent or detect misstatements. Further, because of changing conditions, effectiveness of internal control over financial reporting may vary over time. The Company’s processes contain self-monitoring mechanisms and actions are taken to correct deficiencies as they are identified.
Management has assessed the effectiveness of Encore’s internal control over financial reporting as of December 31, 2016, based on the criteria for effective internal control described in Internal Control—Integrated Framework (2013) issued by the Committee of Sponsoring Organizations of the Treadway Commission. Based on its assessment, management concluded that the Company’s internal control over financial reporting was effective as of December 31, 2016.
70
BDO USA, LLP, the independent registered public accounting firm that audited the consolidated financial statements included in this Annual Report on Form 10-K, was engaged to attest to and report on the effectiveness of Encore’s internal control over financial reporting as of December 31, 2016, as stated in its report below.
71
Report of Independent Registered Public Accounting Firm
Board of Directors and Stockholders
Encore Capital Group, Inc.
San Diego, California
We have audited Encore Capital Group, Inc.’s internal control over financial reporting as of December 31, 2016, based on criteria established in Internal Control - Integrated Framework (2013) issued by the Committee of Sponsoring Organizations of the Treadway Commission (the COSO criteria). Encore Capital Group, Inc.’s management is responsible for maintaining effective internal control over financial reporting and for its assessment of the effectiveness of internal control over financial reporting, included in the accompanying Item 9A, Management’s Report on Internal Control over Financial Reporting. Our responsibility is to express an opinion on the company’s internal control over financial reporting based on our audit.
We conducted our audit in accordance with the standards of the Public Company Accounting Oversight Board (United States). Those standards require that we plan and perform the audit to obtain reasonable assurance about whether effective internal control over financial reporting was maintained in all material respects. Our audit included obtaining an understanding of internal control over financial reporting, assessing the risk that a material weakness exists, and testing and evaluating the design and operating effectiveness of internal control based on the assessed risk. Our audit also included performing such other procedures as we considered necessary in the circumstances. We believe that our audit provides a reasonable basis for our opinion.
A company’s internal control over financial reporting is a process designed to provide reasonable assurance regarding the reliability of financial reporting and the preparation of financial statements for external purposes in accordance with generally accepted accounting principles. A company’s internal control over financial reporting includes those policies and procedures that (1) pertain to the maintenance of records that, in reasonable detail, accurately and fairly reflect the transactions and dispositions of the assets of the company; (2) provide reasonable assurance that transactions are recorded as necessary to permit preparation of financial statements in accordance with generally accepted accounting principles, and that receipts and expenditures of the company are being made only in accordance with authorizations of management and directors of the company; and (3) provide reasonable assurance regarding prevention or timely detection of unauthorized acquisition, use, or disposition of the company’s assets that could have a material effect on the financial statements.
Because of its inherent limitations, internal control over financial reporting may not prevent or detect misstatements. Also, projections of any evaluation of effectiveness to future periods are subject to the risk that controls may become inadequate because of changes in conditions, or that the degree of compliance with the policies or procedures may deteriorate.
In our opinion, Encore Capital Group, Inc. maintained, in all material respects, effective internal control over financial reporting as of December 31, 2016, based on the COSO criteria.
We also have audited, in accordance with the standards of the Public Company Accounting Oversight Board (United States), the consolidated statements of financial condition of Encore Capital Group, Inc. as of December 31, 2016 and 2015, and the related consolidated statements of income, comprehensive income, equity, and cash flows for each of the three years in the period ended December 31, 2016 and our report dated February 23, 2017 expressed an unqualified opinion thereon.
/s/ BDO USA, LLP
Costa Mesa, California
February 23, 2017
72
Changes in Internal Control over Financial Reporting
There were no changes in our system of internal control over financial reporting (as defined in Rule 13a-15(f) and Rule 15d-15(f) under the Exchange Act) that occurred during the quarter ended December 31, 2016, that have materially affected, or are reasonably likely to materially affect, our internal control over financial reporting.
In the course of our ongoing preparations for management’s report on internal control over financial reporting as required by Section 404 of the Sarbanes-Oxley Act of 2002, we have identified areas in need of improvement and have taken remedial actions to strengthen the affected controls as appropriate. We make these and other changes, which do not have a material effect on our overall internal control over financial reporting, to enhance the effectiveness of our internal control over financial reporting.
Item 9B—Other Information
Retention Stock Awards and Revised Employee Letter
On February 21, 2017, in order to promote retention of the Company’s officers, the Compensation Committee of the Company’s Board of Directors approved and granted restricted stock awards (the “RSAs”) and restricted cash awards (the “Restricted Cash Awards” and collectively with the RSAs, the “Retention Awards”) pursuant to the Encore Capital Group, Inc. 2013 Incentive Compensation Plan to the following executive officers of the Company in the following amounts:
Name | RSAs (shares) | Restricted Cash | |||
Kenneth A. Vecchione, President and Chief Executive Officer | 23,633 | $ | 800,000 | ||
Jonathan Clark, Executive Vice President, Chief Financial Officer and Treasurer | 13,293 | $ | 450,000 | ||
Paul Grinberg, Group Executive, International and Corporate Development | 13,293 | $ | 450,000 | ||
Ashish Masih, President MCM | 11,816 | $ | 400,000 | ||
Gregory L. Call, Senior Vice President, General Counsel and Corporate Secretary | 9,403 | $ | 318,300 | ||
Subject to the recipient being continuously employed with the Company or any of its affiliates, the RSAs will time vest 50% on December 31, 2018 and 50% on December 31, 2019. Subject to (1) the recipient being continuously employed with the Company or any of its affiliates and (2) the Company achieving predetermined strategic objectives relating to developing new business, the Restricted Cash Awards vest in four equal installments on June 30, 2018, December 31, 2018, June 30, 2019 and December 31, 2019.
The foregoing description of the material provisions of the Retention Awards is a summary and does not purport to be complete and is qualified in its entirety by reference to the complete text of the form of the RSA Agreement and the form of Restricted Cash Award Agreement, copies of which are filed as Exhibits 10.105 and 10.106, respectively, to this Annual Report on Form 10-K and are incorporated herein by reference.
Amendment of Chief Executive Officer Employment Letter
On February 21, 2017, the Company entered into an amendment to the employment offer letter (“Offer Letter”), dated as of April 8, 2013, by and between the Company and Mr. Kenneth A. Vecchione in order to provide Mr. Vecchione certain accelerated vesting provisions consistent with those provided to other executive officers pursuant to the Company’s Executive Separation Plan. The foregoing description of the amendment to the Offer Letter is a summary and does not purport to be complete and is qualified in its entirety by reference to the complete text of the amendment to the Offer Letter, a copy of which is filed as Exhibit 10.107 to this Annual Report on Form 10-K and is incorporated herein by reference.
73
PART III
Item 10—Directors, Executive Officers and Corporate Governance
The information under the captions “Election of Directors,” “Executive Officers” and “Section 16(a) Beneficial Ownership Reporting Compliance,” appearing in the 2017 Proxy Statement to be filed no later than May 1, 2017, is hereby incorporated by reference.
Item 11—Executive Compensation
The information under the caption “Executive Compensation and Other Information,” appearing in the 2017 Proxy Statement to be filed no later than May 1, 2017, is hereby incorporated by reference.
Item 12—Security Ownership of Certain Beneficial Owners and Management and Related Stockholder Matters
The information under the captions “Security Ownership of Principal Stockholders and Management” and “Equity Compensation Plan Information,” appearing in the 2017 Proxy Statement to be filed no later than May 1, 2017, is hereby incorporated by reference.
Item 13—Certain Relationships and Related Transactions, and Director Independence
The information under the captions “Certain Relationships and Related Transactions” and “Election of Directors—Corporate Governance—Director Independence,” appearing in the 2017 Proxy Statement to be filed no later than May 1, 2017, is hereby incorporated by reference.
Item 14—Principal Accountant Fees and Services
The information under the caption “Independent Registered Public Accounting Firm,” appearing in the 2017 Proxy Statement to be filed no later than May 1, 2017, is hereby incorporated by reference.
74
PART IV
Item 15—Exhibits and Financial Statement Schedules
(a) Financial Statements.
The following consolidated financial statements of Encore Capital Group, Inc. are filed as part of this annual report on Form 10-K:
Page | |
Report of Independent Registered Public Accounting Firm | |
Consolidated Statements of Financial Condition at December 31, 2016 and 2015 | |
Consolidated Statements of Income for the years ended December 31, 2016, 2015 and 2014 | |
Consolidated Statements of Comprehensive Income for the years ended December 31, 2016, 2015 and 2014 | |
Consolidated Statements of Equity for the years ended December 31, 2016, 2015 and 2014 | |
Consolidated Statements of Cash Flows for the years ended December 31, 2016, 2015 and 2014 | |
Notes to Consolidated Financial Statements | |
(b) Exhibits.
Number | Description |
2.1 | Agreement and Plan of Merger dated March 6, 2013, by and among Encore Capital Group, Inc., Pinnacle Sub, Inc. and Asset Acceptance Capital Corp. (incorporated by reference to Exhibit 2.1 to the Company’s Current Report on Form 8-K filed on March 6, 2013) |
2.2 | Stock Purchase Agreement, dated August 1, 2014, by and among Encore Capital Group, Inc., the sellers party thereto, Atlantic Credit & Finance, Inc. and Richard Woolwine as the sellers’ representative (incorporated by reference to Exhibit 2.1 to the Company’s Quarterly Report on Form 10-Q filed on August 7, 2014) |
3.1 | Restated Certificate of Incorporation (incorporated by reference to Exhibit 3.1 to Amendment No. 2 to the Company’s Registration Statement on Form S-1/A filed on June 14, 1999, File No. 333-77483) |
3.2 | Certificate of Amendment to the Certificate of Incorporation (incorporated by reference to Exhibit 3.1 to the Company’s Current Report on Form 8-K filed on April 4, 2002) |
3.3 | Bylaws, as amended through February 8, 2011 (incorporated by reference to Exhibit 3.3 to the Company’s Annual Report on Form 10-K filed on February 14, 2011) |
4.1 | Form of Common Stock Certificate (incorporated by reference to Exhibit 4.7 to the Company’s Registration Statement on Form S-3 filed on December 21, 2009, File No. 333-163876) |
4.2* | Amended and Restated Senior Secured Note Purchase Agreement, dated February 10, 2011, by and among Encore Capital Group, Inc., The Prudential Insurance Company of America, Pruco Life Insurance Company, Prudential Retirement Insurance and Annuity Company and Prudential Annuities Life Assurance Corporation (incorporated by reference to Exhibit 4.1 to the Company’s Quarterly Report on Form 10-Q filed on April 27, 2011) |
4.3 | Form of 7.75% Senior Secured Note due 2017 (incorporated by reference to Exhibit 4.2 to the Company’s Quarterly Report on Form 10-Q filed on April 27, 2011) |
4.4 | Form of 7.375% Senior Secured Note due 2018 (incorporated by reference to Exhibit 4.3 to the Company’s Quarterly Report on Form 10-Q filed on April 27, 2011) |
75
Number | Description |
4.5 | Amendment No. 1, dated May 8, 2012, to Amended and Restated Senior Secured Note Purchase Agreement, dated February 10, 2011, by and among Encore Capital Group, Inc., The Prudential Insurance Company of America, Pruco Life Insurance Company, Prudential Retirement Insurance and Annuity Company and Prudential Annuities Life Assurance Corporation, and SunTrust Bank as collateral agent and administrative agent (incorporated by reference to Exhibit 4.1 to the Company’s Quarterly Report on Form 10-Q filed on May 9, 2012) |
4.6 | Indenture, dated November 27, 2012, between Encore Capital Group, Inc. and Union Bank, N.A., as trustee (incorporated by reference to Exhibit 4.1 to the Company’s Current Report on 8-K filed on December 3, 2012) |
4.7 | Indenture (including the form of the Note), dated as of June 24, 2013, by and among Encore Capital Group, Inc., Midland Credit Management, Inc., as guarantor, and Union Bank, N.A., as trustee (incorporated by reference to Exhibit 4.1 to the Company’s Current Report on Form 8-K filed on June 24, 2013) |
4.8 | Indenture (including the form of the Note), dated August 2, 2013, by and among Cabot Financial (Luxembourg) S.A., Cabot Credit Management Limited, Cabot Financial Limited and all material subsidiaries of Cabot Financial Limited, as guarantors, J.P. Morgan Europe Limited, as security agent, and Citibank, N.A., London Branch as trustee (incorporated by reference to Exhibit 4.1 to the Company’s Current Report on Form 8-K filed on August 6, 2013) |
4.9 | Indenture (including the form of the Note), dated September 20, 2012, by and among Cabot Financial (Luxembourg) S.A., Cabot Credit Management Limited, Cabot Financial Limited and all material subsidiaries of Cabot Financial Limited, as guarantors, J.P. Morgan Europe Limited, as security agent, and Citibank, N.A., London Branch as trustee (incorporated by reference to Exhibit 4.1 to the Company’s Quarterly Report on Form 10-Q filed on November 7, 2013) |
4.10 | First Supplemental Indenture, dated June 13, 2013, between Cabot Financial (Luxembourg) S.A. and Citibank, N.A., London Branch as trustee (incorporated by reference to Exhibit 4.2 to the Company’s Quarterly Report on Form 10-Q filed on November 7, 2013) |
4.11 | Indenture (including the form of the Note), dated July 25, 2013, by and among Marlin Intermediate Holdings plc, Marlin Financial Group Limited, Marlin Financial Intermediate Limited, certain subsidiaries of Marlin Financial Intermediate Limited, The Bank of New York Mellon, London Branch as trustee, paying agent, transfer agent and registrar, and Royal Bank of Scotland plc, as security agent (incorporated by reference to Exhibit 4.11 to the Company’s Annual Report on Form 10-K filed on February 25, 2014) |
4.12 | First Supplemental Indenture, dated February 19, 2014, by and among Marlin Intermediate Holdings plc, Marlin Financial Intermediate II Limited, Cabot Financial Limited the guarantors party thereto and the Bank of New York Mellon, as trustee (incorporated by reference to Exhibit 4.12 to the Company’s Annual Report on Form 10-K filed on February 25, 2014) |
4.13 | Indenture (including form of Note), dated as of March 11, 2014, by and between Encore Capital Group, Inc., Midland Credit Management, Inc., as guarantor, and Union Bank, N.A., as trustee (incorporated by reference to Exhibit 4.1 to the Company’s Current Report on Form 8-K filed on March 11, 2014) |
4.14 | Second Supplemental Indenture, dated March 14, 2014, by and among Cabot Financial (Luxembourg) S.A., Cabot Financial Limited, Cabot Credit Management Limited, as guarantor, and Citibank, N.A., London Branch, as trustee (filed with the Company’s Quarterly Report on Form 10-Q filed on May 8, 2014) |
4.15 | Second Supplemental Indenture, dated March 14, 2014, by and among Marlin Intermediate Holdings plc, Cabot Financial Limited, the subsidiary guarantors party thereto and the Bank of New York Mellon, London Branch, as trustee (filed with the Company’s Quarterly Report on Form 10-Q filed on May 8, 2014) |
76
Number | Description |
4.16 | Indenture (including form of Note), dated March 27, 2014, between Cabot Financial (Luxembourg) S.A., Cabot Credit Management Limited, Cabot Financial Limited, the subsidiary guarantors party thereto, J.P. Morgan Europe Limited, as security agent, Citibank, N.A., London Branch as trustee, principal paying agent and transfer agent and Citigroup Global Markets Deutschland AG, as registrar (incorporated by reference to Exhibit 4.1 to the Company’s Current Report on Form 8-K filed on March 28, 2014) |
4.17 | Indenture (including form of Note), dated May 6, 2014, by and between PFS Tax Lien Trust 2014-1 and Citibank, N.A., as trustee (filed with the Company’s Quarterly Report on Form 10-Q filed on May 8, 2014) |
4.18 | First Supplemental Indenture, dated March 14, 2014, by and among Cabot Financial (Luxembourg) S.A., Cabot Financial Limited, Cabot Credit Management Limited, as guarantor, and Citibank, N.A., London Branch, as trustee (incorporated by reference to Exhibit 4.1 to the Company’s Quarterly Report on Form 10-Q filed on August 7, 2014) |
4.19 | Third Supplemental Indenture, dated May 19, 2014, by and among Cabot Financial (Luxembourg) S.A., Cabot Financial Limited, Citibank, N.A., London Branch, as trustee, and the guarantors party thereto (incorporated by reference to Exhibit 4.1 of the Company’s Current Report on Form 8-K filed on May 20, 2014) |
4.20 | Second Supplemental Indenture, dated May 19, 2014, by and among Cabot Financial (Luxembourg) S.A., Cabot Financial Limited, Citibank, N.A., London Branch, as trustee, and the guarantors party thereto (incorporated by reference to Exhibit 4.2 of the Company’s Current Report on Form 8-K filed on May 20, 2014) |
4.21 | Third Supplemental Indenture, dated May 19, 2014, by and among Marlin Intermediate Holdings plc, Cabot Financial Limited, The Bank of New York Mellon, London Branch, as trustee, and the guarantors party thereto (incorporated by reference to Exhibit 4.3 of the Company’s Current Report on Form 8-K filed on May 20, 2014) |
4.22 | Fourth Supplemental Indenture, dated May 28, 2015, by and among Cabot Asset Purchases (Ireland) Limited, Cabot Financial (Ireland) Limited, Cabot Financial (Luxembourg) S.A., Cabot Credit Management Limited, Cabot Financial Limited and Citibank, N.A., London Branch, as trustee (incorporated by reference to Exhibit 4.22 to the Company’s Annual Report on Form 10-K filed on February 24, 2016) |
4.23 | Third Supplemental Indenture, dated May 28, 2015, by and among Cabot Asset Purchases (Ireland) Limited, Cabot Financial (Ireland) Limited, Cabot Financial (Luxembourg) S.A., Cabot Credit Management Limited, Cabot Financial Limited and Citibank, N.A., London Branch, as trustee (incorporated by reference to Exhibit 4.23 to the Company’s Annual Report on Form 10-K filed on February 24, 2016) |
4.24 | Fourth Supplemental Indenture, dated May 28, 2015, by and among Cabot Asset Purchases (Ireland) Limited, Cabot Financial (Ireland) Limited, Marlin Intermediate Holdings plc, Marlin Financial Group Limited, Marlin Financial Intermediate Limited, Marlin Financial Intermediate II Limited and The Bank of New York Mellon, London Branch, as trustee (incorporated by reference to Exhibit 4.24 to the Company’s Annual Report on Form 10-K filed on February 24, 2016) |
4.25 | Supplemental Indenture, dated May 28, 2015, by and among Cabot Asset Purchases (Ireland) Limited, Cabot Financial (Ireland) Limited, Cabot Financial (Luxembourg) S.A., Cabot Credit Management Limited, Cabot Financial Limited and Citibank, N.A., London Branch, as trustee (incorporated by reference to Exhibit 4.25 to the Company’s Annual Report on Form 10-K filed on February 24, 2016) |
4.26 | Fifth Supplemental Indenture, dated July 28, 2015, by and among Hillesden Securities Limited, Cabot Financial (Luxembourg) S.A., Cabot Credit Management Limited, Cabot Financial Limited and Citibank, N.A., London Branch, as trustee (incorporated by reference to Exhibit 4.26 to the Company’s Annual Report on Form 10-K filed on February 24, 2016) |
4.27 | Fourth Supplemental Indenture, dated July 28, 2015, by and among Hillesden Securities Limited, Cabot Financial (Luxembourg) S.A., Cabot Credit Management Limited, Cabot Financial Limited and Citibank, N.A., London Branch, as trustee (incorporated by reference to Exhibit 4.27 to the Company’s Annual Report on Form 10-K filed on February 24, 2016) |
77
Number | Description |
4.28 | Fifth Supplemental Indenture, dated July 28, 2015, by and among Hillesden Securities Limited, Marlin Intermediate Holdings plc, Marlin Financial Group Limited, Marlin Financial Intermediate Limited, Marlin Financial Intermediate II Limited and The Bank of New York Mellon, London Branch, as trustee (incorporated by reference to Exhibit 4.28 to the Company’s Annual Report on Form 10-K filed on February 24, 2016) |
4.29 | Second Supplemental Indenture, dated July 28, 2015, by and among Hillesden Securities Limited, Cabot Financial (Luxembourg) S.A., Cabot Credit Management Limited, Cabot Financial Limited and Citibank, N.A., London Branch, as trustee (incorporated by reference to Exhibit 4.29 to the Company’s Annual Report on Form 10-K filed on February 24, 2016) |
4.30 | Indenture, dated November 11, 2015, between Cabot Financial (Luxembourg) II S.A., Cabot Credit Management Limited, Cabot Financial Limited, the subsidiary guarantors party thereto, J.P. Morgan Europe Limited, as security agent, Citibank, N.A., London Branch as trustee, principal paying agent and transfer agent and Citigroup Global Markets Deutschland AG, as registrar (incorporated by reference to Exhibit 10.1 to the Company’s Current Report on Form 8-K filed on November 13, 2015) |
4.31 | Sixth Supplemental Indenture, dated November 11, 2015, by and among Cabot Financial (Luxembourg) II S.A., Cabot Financial (Treasury) Ireland, Cabot Financial (Luxembourg) S.A., Cabot Credit Management Limited, Cabot Financial Limited and Citibank, N.A., London Branch, as trustee (incorporated by reference to Exhibit 4.31 to the Company’s Annual Report on Form 10-K filed on February 24, 2016) |
4.32 | Fifth Supplemental Indenture, dated November 11, 2015, by and among Cabot Financial (Luxembourg) II S.A., Cabot Financial (Treasury) Ireland, Cabot Financial (Luxembourg) S.A., Cabot Credit Management Limited, Cabot Financial Limited and Citibank, N.A., London Branch, as trustee (incorporated by reference to Exhibit 4.32 to the Company’s Annual Report on Form 10-K filed on February 24, 2016) |
4.33 | Sixth Supplemental Indenture, dated November 11, 2015, by and among Cabot Financial (Luxembourg) II S.A., Cabot Financial (Treasury) Ireland, Marlin Intermediate Holdings PLC, Marlin Financial Group Limited, Marlin Financial Intermediate Limited, Marlin Financial Intermediate II Limited, and The Bank of New York Mellon, London Branch, as trustee (incorporated by reference to Exhibit 4.33 to the Company’s Annual Report on Form 10-K filed on February 24, 2016) |
4.34 | Third Supplemental Indenture, dated November 11, 2015, by and among Cabot Financial (Luxembourg) II S.A., Cabot Financial (Treasury) Ireland, Cabot Financial (Luxembourg) S.A., Cabot Credit Management Limited, Cabot Financial Limited and Citibank, N.A., London Branch, as trustee (incorporated by reference to Exhibit 4.34 to the Company’s Annual Report on Form 10-K filed on February 24, 2016) |
4.35 | Indenture, dated October 6, 2016, between Cabot Financial (Luxembourg) S.A., Cabot Credit Management Limited, Cabot Financial Limited, the subsidiary guarantors party thereto, J.P. Morgan Europe Limited, as security agent, Citibank, N.A., London Branch as trustee, principal paying agent and transfer agent and Citigroup Global Markets Deutschland AG, as registrar (incorporated by reference to Exhibit 4.1 to the Company’s Current Report on Form 8-K filed on October 7, 2016) |
10.1+ | Form of Indemnification Agreement (incorporated by reference to Exhibit 10.1 to the Company’s Current Report on Form 8-K filed on May 4, 2006) |
10.2+ | Severance protection letter agreement, dated March 11, 2009, between Encore Capital Group, Inc. and Paul Grinberg (incorporated by reference to Exhibit 10.2 to the Company’s Current Report on Form 8-K filed on March 13, 2009) |
10.3 | Lease Deed, dated April 22, 2009, between Midland Credit Management India Private Limited and R.S. Technologies Private Limited, for real property located in Gurgaon, India (incorporated by reference to Exhibit 10.4 to the Company’s Quarterly Report on Form 10-Q filed on April 29, 2009) |
10.4+ | Encore Capital Group, Inc. 2005 Stock Incentive Plan, as amended and restated (incorporated by reference to Exhibit 10.1 to the Company’s Current Report on Form 8-K filed on June 15, 2009) |
78
Number | Description |
10.5+ | Amended Form of Stock Option Agreement for awards under the Encore Capital Group, Inc. 2005 Stock Incentive Plan (incorporated by reference to Exhibit 10.3 to the Company’s Quarterly Report on Form 10-Q filed on July 30, 2009) |
10.6+ | Amended Form of Restricted Stock Unit Grant Notice and Agreement under the Encore Capital Group, Inc. 2005 Stock Incentive Plan (incorporated by reference to Exhibit 10.2 to the Company’s Quarterly Report on Form 10-Q filed on July 30, 2009) |
10.7 | Lease Deed, dated October 26, 2010, between Midland Credit Management India Private Limited and R.S. Technologies Private Limited, for real property located in Gurgaon, India (incorporated by reference to Exhibit 10.47 to the Company’s Annual Report on Form 10-K filed on February 14, 2011) |
10.8 | Lease Deed, dated March 4, 2011, between Midland Credit Management, Inc. and Teachers Insurance and Annuity Association of America for the Benefit of its Separate Real Estate Account for real property located in San Diego, California (the “San Diego Lease”) (incorporated by reference to Exhibit 10.49 to the Company’s Annual Report on Form 10-K filed on February 9, 2012) |
10.9 | Lease Guaranty, dated March 4, 2011, by Encore Capital Group, Inc., in favor of Teachers Insurance and Annuity Association of America for the Benefit of its Separate Real Estate Account in connection with the San Diego Lease (incorporated by reference to Exhibit 10.50 to the Company’s Annual Report on Form 10-K filed on February 9, 2012) |
10.10+ | Form of Restricted Stock Award Grant Notice and Agreement under the Encore Capital Group, Inc. 2005 Stock Incentive Plan (Executive) (incorporated by reference to Exhibit 10.2 to the Company’s Quarterly Report on Form 10-Q filed on November 1, 2012) |
10.11+ | Form of Non-Incentive Stock Option Agreement under the Encore Capital Group, Inc. 2005 Stock Incentive Plan (incorporated by reference to Exhibit 10.3 to the Company’s Quarterly Report on Form 10-Q filed on November 1, 2012) |
10.12 | Amended and Restated Credit Agreement, dated November 5, 2012, by and among Encore Capital Group, Inc., the several banks and other financial institutions and lenders from time to time party thereto and listed on the signature pages thereof, and SunTrust Bank, as administrative agent and collateral agent (incorporated by reference to Exhibit 10.1 to the Company’s Current Report on 8-K filed on November 7, 2012) |
10.13 | Second Amended and Restated Pledge and Security Agreement, dated November 5, 2012, by and among Encore Capital Group, Inc., certain of its subsidiaries and SunTrust Bank, as collateral agent (incorporated by reference to Exhibit 10.2 to the Company’s Current Report on 8-K filed on November 7, 2012) |
10.14 | Amended and Restated Guaranty, dated November 5, 2012, by and among certain subsidiaries of Encore Capital Group, Inc. and SunTrust Bank, as administrative agent (incorporated by reference to Exhibit 10.3 to the Company’s Current Report on 8-K filed on November 7, 2012) |
10.15 | Amended and Restated Intercreditor Agreement, dated November 5, 2012, by and among Encore Capital Group, Inc., certain of its subsidiaries, SunTrust Bank, as administrative agent for the lenders, and the holders of the Company’s 7.75% Senior Secured Notes due 2017 and 7.375% Senior Secured Notes due 2018 (incorporated by reference to Exhibit 10.4 to the Company’s Current Report on 8-K filed on November 7, 2012) |
10.16 | Amendment No. 2 to Note Purchase Agreement, dated November 5, 2012, by and among Encore Capital Group, Inc., the holders of the Company’s 7.75% Senior Secured Notes due 2017 and 7.375% Senior Secured Notes due 2018, and SunTrust Bank, as collateral agent and administrative agent (incorporated by reference to Exhibit 10.5 to the Company’s Current Report on 8-K filed on November 7, 2012) |
10.17 | Letter Agreement, dated November 20, 2012, between Deutsche Bank AG, London Branch and Encore Capital Group, Inc., regarding the Base Call Option Transaction (incorporated by reference to Exhibit 10.1 to the Company’s Current Report on 8-K filed on December 3, 2012) |
79
Number | Description |
10.18 | Letter Agreement, dated November 20, 2012, between RBC Capital Markets, LLC and Encore Capital Group, Inc., regarding the Base Call Option Transaction (incorporated by reference to Exhibit 10.2 to the Company’s Current Report on 8-K filed on December 3, 2012) |
10.19 | Letter Agreement, dated November 20, 2012, between Société Générale and Encore Capital Group, Inc., regarding the Base Call Option Transaction (incorporated by reference to Exhibit 10.3 to the Company’s Current Report on 8-K filed on December 3, 2012) |
10.20 | Letter Agreement, dated November 20, 2012, between Deutsche Bank AG, London Branch and Encore Capital Group, Inc., regarding the Base Warrant Transaction (incorporated by reference to Exhibit 10.4 to the Company’s Current Report on 8-K filed on December 3, 2012) |
10.21 | Letter Agreement, dated November 20, 2012, between RBC Capital Markets, LLC and Encore Capital Group, Inc., regarding the Base Warrant Transaction (incorporated by reference to Exhibit 10.5 to the Company’s Current Report on 8-K filed on December 3, 2012) |
10.22 | Letter Agreement, dated November 20, 2012, between Société Générale and Encore Capital Group, Inc., regarding the Base Warrant Transaction (incorporated by reference to Exhibit 10.6 to the Company’s Current Report on 8-K filed on December 3, 2012) |
10.23 | Letter Agreement, dated December 6, 2012, between Deutsche Bank AG, London Branch and Encore Capital Group, Inc., regarding the Additional Call Option Transaction (incorporated by reference to Exhibit 10.1 to the Company’s Current Report on 8-K filed on December 12, 2012) |
10.24 | Letter Agreement, dated December 6, 2012, between RBC Capital Markets, LLC and Encore Capital Group, Inc., regarding the Additional Call Option Transaction (incorporated by reference to Exhibit 10.2 to the Company’s Current Report on 8-K filed on December 12, 2012) |
10.25 | Letter Agreement, dated December 6, 2012, between Société Générale and Encore Capital Group, Inc., regarding the Additional Call Option Transaction (incorporated by reference to Exhibit 10.3 to the Company’s Current Report on 8-K filed on December 12, 2012) |
10.26 | Letter Agreement, dated December 6, 2012, between Deutsche Bank AG, London Branch and Encore Capital Group, Inc., regarding the Additional Warrant Transaction (incorporated by reference to Exhibit 10.4 to the Company’s Current Report on 8-K filed on December 12, 2012) |
10.27 | Letter Agreement, dated December 6, 2012, between RBC Capital Markets, LLC and Encore Capital Group, Inc., regarding the Additional Warrant Transaction (incorporated by reference to Exhibit 10.5 to the Company’s Current Report on 8-K filed on December 12, 2012) |
10.28 | Letter Agreement, dated December 6, 2012, between Société Générale and Encore Capital Group, Inc., regarding the Additional Warrant Transaction (incorporated by reference to Exhibit 10.6 to the Company’s Current Report on 8-K filed on December 12, 2012) |
10.29 | Incremental Facility Agreement, dated December 6, 2012, among Encore Capital Group, Inc., Barclays Bank PLC, SunTrust Bank and each of the guarantors party thereto (incorporated by reference to Exhibit 10.7 to the Company’s Current Report on 8-K filed on December 12, 2012) |
10.30+ | Amendment, dated January 9, 2013, to the Severance Protection Letter Agreement dated March 11, 2009 between Encore Capital Group, Inc. and Paul Grinberg (incorporated by reference to Exhibit 10.1 to the Company’s Current Report on Form 8-K filed on January 15, 2013) |
10.31+ | Letter Agreement, dated January 9, 2013, between Encore Capital Group, Inc. and Paul Grinberg (incorporated by reference to Exhibit 10.2 to the Company’s Current Report on Form 8-K filed on January 15, 2013) |
10.32+ | Employment offer letter, dated as of April 8, 2013, by and between Encore Capital Group, Inc. and Kenneth A. Vecchione (incorporated by reference to Exhibit 10.2 to the Company’s Current Report on Form 8-K filed on April 9, 2013) |
80
Number | Description |
10.33 | Amendment No. 1 and Limited Waiver, dated May 9, 2013, to Amended and Restated Credit Agreement, dated as of November 5, 2012, by and among Encore Capital Group, Inc., the several banks and other financial institutions and lenders from time to time party thereto and SunTrust Bank, as administrative agent and collateral agent (incorporated by reference to Exhibit 10.2 to the Company’s Quarterly Report on Form 10-Q filed on August 8, 2013) |
10.34 | Second Amended and Restated Senior Secured Note Purchase Agreement, dated May 9, 2013, by and among Encore Capital Group, Inc., The Prudential Insurance Company of America, Pruco Life Insurance Company, Prudential Retirement Insurance and Annuity Company and Prudential Annuities Life Assurance Corporation (incorporated by reference to Exhibit 10.3 to the Company’s Quarterly Report on Form 10-Q filed on August 8, 2013) |
10.35+ | Encore Capital Group, Inc. 2013 Incentive Compensation Plan (incorporated by reference to Appendix A of the Company’s definitive Proxy Statement on Schedule 14A filed on April 26, 2013) |
10.36+ | Form of Non-Incentive Stock Option Agreement under the Encore Capital Group, Inc. 2013 Incentive Compensation Plan (incorporated by reference to Exhibit 10.5 to the Company’s Quarterly Report on Form 10-Q filed on August 8, 2013) |
10.37+ | Form of Restricted Stock Award Grant Notice and Agreement (Executive) under the Encore Capital Group, Inc. 2013 Incentive Compensation Plan (incorporated by reference to Exhibit 10.6 to the Company’s Quarterly Report on Form 10-Q filed on August 8, 2013) |
10.38+ | Form of Restricted Stock Award Grant Notice and Agreement (Non-Executive) under the Encore Capital Group, Inc. 2013 Incentive Compensation Plan (incorporated by reference to Exhibit 10.7 to the Company’s Quarterly Report on Form 10-Q filed on August 8, 2013) |
10.39+ | Form of Restricted Stock Unit Grant Notice and Agreement (Executive) under the Encore Capital Group, Inc. 2013 Incentive Compensation Plan (incorporated by reference to Exhibit 10.8 to the Company’s Quarterly Report on Form 10-Q filed on August 8, 2013) |
10.40+ | Form of Performance Stock Grant Notice and Agreement under the Encore Capital Group, Inc. 2013 Incentive Compensation Plan (incorporated by reference to Exhibit 10.9 to the Company’s Quarterly Report on Form 10-Q filed on August 8, 2013) |
10.41+ | Form of Performance Stock Unit Grant Notice and Agreement under the Encore Capital Group, Inc. 2013 Incentive Compensation Plan (incorporated by reference to Exhibit 10.10 to the Company’s Quarterly Report on Form 10-Q filed on August 8, 2013) |
10.42+ | Form of Restricted Stock Unit Grant Notice and Agreement (Non-Employee Director) under the Encore Capital Group, Inc. 2013 Incentive Compensation Plan (incorporated by reference to Exhibit 10.11 to the Company’s Quarterly Report on Form 10-Q filed on August 8, 2013) |
10.43 | Incremental Facility Agreement, dated May 9, 2013, among Encore Capital Group, Inc., each of the banks and guarantors party thereto and SunTrust Bank, as administrative agent, issuing bank and swingline lender (incorporated by reference to Exhibit 10.12 to the Company’s Quarterly Report on Form 10-Q filed on August 8, 2013) |
10.44 | Securities Purchase Agreement, dated May 29, 2013, by and between Encore Capital Group, Inc. and JCF III Europe S.À R.L. (incorporated by reference to Exhibit 10.16 to the Company’s Quarterly Report on Form 10-Q filed on August 8, 2013) |
10.45 | Amendment No. 2, dated May 29, 2013, to Amended and Restated Credit Agreement, dated November 5, 2012, by and among Encore Capital Group, Inc., the guarantors identified therein, the lenders party thereto and SunTrust Bank, as administrative agent and collateral agent (incorporated by reference to Exhibit 10.17 to the Company’s Quarterly Report on Form 10-Q filed on August 8, 2013) |
81
Number | Description |
10.46 | Amendment No. 1, dated May 29, 2013, to Second Amended and Restated Senior Secured Note Purchase Agreement, dated May 9, 2013, by and between Encore Capital Group, Inc., The Prudential Insurance Company of America, Pruco Life Insurance Company, Prudential Retirement Insurance and Annuity Company and Prudential Annuities Life Assurance Corporations (incorporated by reference to Exhibit 10.18 to the Company’s Quarterly Report on Form 10-Q filed on August 8, 2013) |
10.47 | Letter Agreement, dated June 18, 2013, between Barclays Bank PLC and Encore Capital Group, Inc., regarding the Capped Call Transaction (incorporated by reference to Exhibit 10.1 to the Company’s Current Report on Form 8-K filed on June 24, 2013) |
10.48 | Letter Agreement, dated June 18, 2013, between Credit Suisse International and Encore Capital Group, Inc., regarding the Capped Call Transaction (incorporated by reference to Exhibit 10.2 to the Company’s Current Report on Form 8-K filed on June 24, 2013) |
10.49 | Letter Agreement, dated June 18, 2013, between Morgan Stanley & Co. International plc and Encore Capital Group, Inc., regarding the Capped Call Transaction (incorporated by reference to Exhibit 10.3 to the Company’s Current Report on Form 8-K filed on June 24, 2013) |
10.50 | Letter Agreement, dated June 18, 2013, between RBC Capital Markets, LLC and Encore Capital Group, Inc., regarding the Capped Call Transaction (incorporated by reference to Exhibit 10.4 to the Company’s Current Report on Form 8-K filed on June 24, 2013) |
10.51 | Amendment, dated July 1, 2013, to Securities Purchase Agreement, dated May 29, 2013, by and between Encore Capital Group, Inc. and JCF III Europe S.À R.L. (incorporated by reference to Exhibit 10.23 to the Company’s Quarterly Report on Form 10-Q filed on August 8, 2013) |
10.52* | Investors Agreement, dated July 1, 2013, by and between Encore Europe Holdings S.À R.L., JCF III Europe S.À R.L. and the other parties thereto (incorporated by reference to Exhibit 10.24 to the Company’s Quarterly Report on Form 10-Q/A filed on December 20, 2013) |
10.53 | Letter Agreement, dated July 18, 2013, between Barclays Bank PLC and Encore Capital Group, Inc., regarding the Capped Call Transaction (incorporated by reference to Exhibit 10.1 to the Company’s Current Report on Form 8-K filed on July 23, 2013) |
10.54 | Letter Agreement, dated July 18, 2013, between Credit Suisse International and Encore Capital Group, Inc., regarding the Capped Call Transaction (incorporated by reference to Exhibit 10.2 to the Company’s Current Report on Form 8-K filed on July 23, 2013) |
10.55 | Letter Agreement, dated July 18, 2013, between Morgan Stanley & Co. International plc and Encore Capital Group, Inc., regarding the Capped Call Transaction (incorporated by reference to Exhibit 10.3 to the Company’s Current Report on Form 8-K filed on July 23, 2013) |
10.56 | Letter Agreement, dated July 18, 2013, between RBC Capital Markets, LLC and Encore Capital Group, Inc., regarding the Capped Call Transaction (incorporated by reference to Exhibit 10.4 to the Company’s Current Report on Form 8-K filed on July 23, 2013) |
10.57 | Amended and Restated Senior Facilities Agreement, dated June 28, 2013, by and among Cabot Financial (UK) Limited, the several guarantors, banks and other financial institutions and lenders from time to time party thereto and J.P. Morgan Europe Limited as Agent and Security Agent (incorporated by reference to Exhibit 10.1 to the Company’s Quarterly Report on Form 10-Q filed on November 7, 2013) |
10.58 | Second Amendment to Securities Purchase Agreement, dated September 25, 2013, by and between Encore Europe Holdings S.À R.L. and JCF III Europe S.À R.L. (incorporated by reference to Exhibit 10.2 to the Company’s Quarterly Report on Form 10-Q filed on November 7, 2013) |
10.59 | Amendment to Letter Agreement, dated December 16, 2013, between Deutsche Bank AG, London Branch and Encore Capital Group, Inc., regarding the Warrant Transactions (incorporated by reference to Exhibit 10.77 to the Company’s Annual Report on Form 10-K filed February 25, 2014) |
82
Number | Description |
10.60 | Amendment to Letter Agreement, dated December 16, 2013, between RBC Capital Markets, LLC and Encore Capital Group, Inc., regarding the Warrant Transactions (incorporated by reference to Exhibit 10.78 to the Company’s Annual Report on Form 10-K filed February 25, 2014) |
10.61 | Amendment to Letter Agreement, dated December 16, 2013, between Société Générale and Encore Capital Group, Inc., regarding the Warrant Transactions (incorporated by reference to Exhibit 10.79 to the Company’s Annual Report on Form 10-K filed February 25, 2014) |
10.62 | Amendment No. 2, dated December 27, 2013, to the Credit Facility Loan Agreement, dated May 8, 2012, by and among Propel Financial Services, LLC, certain banks and Texas Capital Bank, National Association, as administrative agent (incorporated by reference to Exhibit 10.1 to the Company’s Current Report on Form 8-K filed on January 2, 2014) |
10.63 | Share Sale and Purchase Agreement, dated February 7, 2014, by and among Cabot Financial Holdings Group Limited, certain funds managed by Duke Street and certain individuals, including certain executive management of Marlin Financial Group Limited (incorporated by reference to Exhibit 10.82 to the Company’s Annual Report on Form 10-K filed on February 25, 2014) |
10.64+ | First Amendment to Encore Capital Group, Inc. 2013 Incentive Compensation Plan, dated February 20, 2014 (incorporated by reference to Exhibit 10.84 to the Company’s Annual Report on Form 10-K filed on February 25, 2014) |
10.65+ | Letter Agreement, dated February 24, 2014, between Encore Capital Group, Inc. and Paul Grinberg (incorporated by reference to Exhibit 10.1 to the Company’s Current Report on Form 8-K filed on February 24, 2014) |
10.66 | Second Amended and Restated Credit Agreement, dated February 25, 2014, by and among Encore Capital Group, Inc., the several banks and other financial institutions and lenders from time to time party thereto and listed on the signature pages thereof, and SunTrust Bank, as administrative agent and collateral agent (incorporated by reference to Exhibit 10.86 to the Company’s Annual Report on Form 10-K filed on February 25, 2014) |
10.67 | Amendment No. 2, dated February 25, 2014, to Second Amended and Restated Senior Secured Note Purchase Agreement, dated May 9, 2013, by and between Encore Capital Group, Inc., The Prudential Insurance Company of America, Pruco Life Insurance Company, Prudential Retirement Insurance and Annuity Company and Prudential Annuities Life Assurance Corporations (incorporated by reference to Exhibit 10.87 to the Company’s Annual Report on Form 10-K filed on February 25, 2014) |
10.68 | Amendment No. 1, dated February 25, 2014, to Amended and Restated Guaranty, dated November 5, 2012, by and among certain subsidiaries of Encore Capital Group, Inc. and SunTrust Bank, as administrative agent (incorporated by reference to Exhibit 10.88 to the Company’s Annual Report on Form 10-K filed on February 25, 2014) |
10.69 | Letter Agreement, dated March 5, 2014, between Citibank, N.A. and Encore Capital Group, Inc., regarding the Base Capped Call Transaction (incorporated by reference to Exhibit 10.1 to the Company’s Current Report on Form 8-K filed on March 11, 2014) |
10.70 | Letter Agreement, dated March 5, 2014, between Credit Suisse International and Encore Capital Group, Inc., regarding the Base Capped Call Transaction (incorporated by reference to Exhibit 10.2 to the Company’s Current Report on Form 8-K filed on March 11, 2014) |
10.71 | Letter Agreement, dated March 5, 2014, between Morgan Stanley & Co. LLC and Encore Capital Group, Inc., regarding the Base Capped Call Transaction (incorporated by reference to Exhibit 10.3 to the Company’s Current Report on Form 8-K filed on March 11, 2014) |
10.72 | Letter Agreement, dated March 5, 2014, between Société Générale and Encore Capital Group, Inc., regarding the Base Capped Call Transaction (incorporated by reference to Exhibit 10.4 to the Company’s Current Report on Form 8-K filed on March 11, 2014) |
10.73 | Letter Agreement, dated March 6, 2014, between Citibank, N.A. and Encore Capital Group, Inc., regarding the Additional Capped Call Transaction (incorporated by reference to Exhibit 10.5 to the Company’s Current Report on Form 8-K filed on March 11, 2014) |
83
Number | Description |
10.74 | Letter Agreement, dated March 6, 2014, between Credit Suisse International and Encore Capital Group, Inc., regarding the Additional Capped Call Transaction (incorporated by reference to Exhibit 10.6 to the Company’s Current Report on Form 8-K filed on March 11, 2014) |
10.75 | Letter Agreement, dated March 6, 2014, between Morgan Stanley & Co. LLC and Encore Capital Group, Inc., regarding the Additional Capped Call Transaction (incorporated by reference to Exhibit 10.7 to the Company’s Current Report on Form 8-K filed on March 11, 2014) |
10.76 | Letter Agreement, dated March 6, 2014, between Société Générale and Encore Capital Group, Inc., regarding the Additional Capped Call Transaction (incorporated by reference to Exhibit 10.8 to the Company’s Current Report on Form 8-K filed on March 11, 2014) |
10.77+ | Restricted Stock Award Grant Notice and Agreement, dated March 7, 2014, between Encore Capital Group, Inc. and Paul Grinberg (incorporated by reference to Exhibit 10.9 to the Company’s Quarterly Report on Form 10-Q filed on May 8, 2014) |
10.78+ | Restricted Stock Award Grant Notice and Agreement, dated April 15, 2013, between Encore Capital Group, Inc. and Kenneth A. Vecchione (incorporated by reference to Exhibit 10.10 to the Company’s Quarterly Report on Form 10-Q filed on May 8, 2014) |
10.79+ | Restricted Stock Award Grant Notice and Agreement, dated April 15, 2013, between Encore Capital Group, Inc. and Kenneth A. Vecchione (incorporated by reference to Exhibit 10.11 to the Company’s Quarterly Report on Form 10-Q filed on May 8, 2014) |
10.80+ | Performance Stock Grant Notice and Agreement, dated June 4, 2013, between Encore Capital Group, Inc. and Kenneth A. Vecchione (incorporated by reference to Exhibit 10.12 to the Company’s Quarterly Report on Form 10-Q filed on May 8, 2014) |
10.81 | Amendment No. 1 to Second Amended and Restated Credit Agreement, dated August 1, 2014, by and among Encore Capital Group, Inc., the several banks and other financial institutions and lenders from time to time party thereto and listed on the signature pages thereof, and SunTrust Bank, as administrative agent and collateral agent (incorporated by reference to Exhibit 10.1 to the Company’s Quarterly Report on Form 10-Q filed on August 7, 2014) |
10.82 | Amendment No. 3, dated August 1, 2014, to Second Amended and Restated Senior Secured Note Purchase Agreement, dated May 9, 2013, by and between Encore Capital Group, Inc., The Prudential Insurance Company of America, Pruco Life Insurance Company, Prudential Retirement Insurance and Annuity Company and Prudential Annuities Life Assurance Corporations (incorporated by reference to Exhibit 10.2 to the Company’s Quarterly Report on Form 10-Q filed on August 7, 2014) |
10.83+ | Form of Performance Award Agreement (incorporated by reference to Exhibit 10.1 to the Company’s Quarterly Report on Form 10-Q filed on November 6, 2014) |
10.84+ | Encore Capital Group, Inc. Executive Separation Plan (incorporated by reference to Exhibit 10.2 to the Company’s Quarterly Report on Form 10-Q filed on November 6, 2014) |
10.85+ | Employment offer letter dated October 9, 2014 by and between Encore Capital Group, Inc. and Jonathan Clark (incorporated by reference to Exhibit 10.1 to the Company’s Current Report on Form 8-K filed on February 26, 2015) |
10.86 | Amendment Agreement, dated February 5, 2015, for Cabot Financial (UK) Limited, as Parent, with J.P. Morgan Europe Limited, as Agent, relating to a Senior Facilities Agreement originally dated September 20, 2012 (incorporated by reference to Exhibit 10.1 to the Company’s Quarterly Report on Form 10-Q filed on May 7, 2015) |
10.87 | Amendment No. 1 to Limited Guarantee, dated April 3, 2015, by Encore Capital Group, Inc., in favor of Wells Fargo Bank, N.A. (incorporated by reference to Exhibit 10.1 to the Company’s Quarterly Report on Form 10-Q filed on August 10, 2015) |
84
Number | Description |
10.88 | Credit Facility Loan Agreement, dated May 8, 2015, by and among Texas Capital Bank, National Association, as administrative agent, certain banks and Propel Financial Services, LLC (incorporated by reference to Exhibit 10.3 to the Company’s Quarterly Report on Form 10-Q filed on August 10, 2015) |
10.89 | Amendment No. 2 to Second Amended and Restated Credit Agreement, dated July 9, 2015, by and among Encore Capital Group, Inc., the several banks and other financial institutions and lenders from time to time party thereto and listed on the signature pages thereof, and SunTrust Bank, as administrative agent and collateral agent (incorporated by reference to Exhibit 10.4 to the Company’s Quarterly Report on Form 10-Q filed on August 10, 2015) |
10.90 | Amendment No. 4, dated July 9, 2015, to Second Amended and Restated Senior Secured Note Purchase Agreement, dated May 9, 2013, by and between Encore Capital Group, Inc., The Prudential Insurance Company of America, Pruco Life Insurance Company, Prudential Retirement Insurance and Annuity Company and Prudential Annuities Life Assurance Corporations (incorporated by reference to Exhibit 10.5 to the Company’s Quarterly Report on Form 10-Q filed on August 10, 2015) |
10.91 | Amended and Restated Senior Facilities Agreement, dated November 11, 2015, by and among Cabot Financial (UK) Limited, the several guarantors, banks and other financial institutions and lenders from time to time party thereto and J.P. Morgan Europe Limited as Agent and Security Agent (incorporated by reference to Exhibit 10.1 to the Company’s Current Report on Form 8-K filed on November 13, 2015) |
10.92 | Incremental Facility Agreement, dated November 19, 2015, by and among Encore Capital Group, Inc., Credit Suisse AG, Northwest Bank, SunTrust Bank, and each of the guarantors, party thereto (incorporated by reference to Exhibit 10.104 to the Company’s Annual Report on Form 10-K filed on February 24, 2016) |
10.93+ | Form of Performance Stock Grant Notice and Agreement (TSR) under the Encore Capital Group, Inc. 2013 Incentive Compensation Plan (incorporated by reference to Exhibit 10.1 to the Company’s Current Report on Form 10-Q filed on May 10, 2016) |
10.94+ | Form of Restricted Stock Award Grant Notice and Agreement (Executive - Umbrella) under the Encore Capital Group, Inc. 2013 Incentive Compensation Plan (incorporated by reference to Exhibit 10.2 to the Company’s Current Report on Form 10-Q filed on May 10, 2016) |
10.95+ | Form of Performance Stock Grant Notice and Agreement under the Encore Capital Group, Inc. 2013 Incentive Compensation Plan (incorporated by reference to Exhibit 10.3 to the Company’s Current Report on Form 10-Q filed on May 10, 2016) |
10.96 | Amendment No. 3 to Second Amended and Restated Credit Agreement, dated March 24, 2016, by and among Encore Capital Group, Inc., the several banks and other financial institutions and lenders from time to time party thereto and listed on the signature pages thereof, and SunTrust Bank, as administrative agent and collateral agent (incorporated by reference to Exhibit 10.4 to the Company’s Current Report on Form 10-Q filed on May 10, 2016) |
10.97 | Amendment No. 5, dated March 24, 2016, to Second Amended and Restated Senior Secured Note Purchase Agreement, dated May 9, 2013, by and between Encore Capital Group, Inc., The Prudential Insurance Company of America, Pruco Life Insurance Company, Prudential Retirement Insurance and Annuity Company and Prudential Annuities Life Assurance Corporations (incorporated by reference to Exhibit 10.5 to the Company’s Current Report on Form 10-Q filed on May 10, 2016) |
10.98+ | Non-Employee Director Compensation Program Guidelines, effective June 1, 2016 (incorporated by reference to Exhibit 10.1 to the Company’s Current Report on Form 10-Q filed on August 4, 2016) |
10.99+ | Non-Employee Director Deferred Stock Compensation Plan (incorporated by reference to Exhibit 10.2 to the Company’s Current Report on Form 10-Q filed on August 4, 2016) |
85
Number | Description |
10.100 | Amendment Letter, dated June 6, 2016, related to the Amended and Restated Senior Facilities Agreement, dated November 11, 2015, by and among Cabot Financial (UK) Limited, the several guarantors, banks and other financial institutions and lenders from time to time party thereto and J.P. Morgan Europe Limited as Agent and Security Agent (incorporated by reference to Exhibit 10.3 to the Company’s Current Report on Form 10-Q filed on August 4, 2016) |
10.101+ | First Amendment to Non-Employee Director Deferred Stock Compensation Plan, dated August 6, 2016 (incorporated by reference to Exhibit 10.3 to the Company’s Current Report on Form 10-Q filed on November 9, 2016) |
10.102 | Amended and Restated Senior Facilities Agreement, dated October 6, 2016, by and among Cabot Financial (UK) Limited, the several guarantors, banks and other financial institutions and lenders from time to time party thereto and J.P. Morgan Europe Limited as Agent and Security Agent (incorporated by reference to Exhibit 10.1 to the Company’s Current Report on Form 8-K filed on October 7, 2016) |
10.103 | Third Amended and Restated Credit Agreement, dated December 20, 2016, by and among Encore Capital Group, Inc., the several banks and other financial institutions and lenders from time to time party thereto and listed on the signature pages thereof, and SunTrust Bank, as administrative agent and collateral agent (incorporated by reference to Exhibit 10.1 to the Company’s Current Report on Form 8-K filed on December 27, 2016) |
10.104 | Amendment No. 6, dated December 20, 2016, to Second Amended and Restated Senior Secured Note Purchase Agreement, dated May 9, 2013, by and between Encore Capital Group, Inc., The Prudential Insurance Company of America, Pruco Life Insurance Company, Prudential Retirement Insurance and Annuity Company and Prudential Annuities Life Assurance Corporation (incorporated by reference to Exhibit 10.2 to the Company’s Current Report on Form 8-K filed on December 27, 2016) |
10.105+ | Form of Restricted Stock Award Grant Notice and Agreement (Retention) under the Encore Capital Group, Inc. 2013 Incentive Compensation Plan (filed herewith) |
10.106+ | Form of Restricted Cash Award Grant Notice and Agreement (Retention) under the Encore Capital Group, Inc. 2013 Incentive Compensation Plan (filed herewith) |
10.107+ | Amendment, dated February 21, 2017, to the employment offer letter, dated as of April 8, 2013, by and between Encore Capital Group, Inc. and Kenneth A. Vecchione (filed herewith) |
10.108+ | Form of Performance Stock Option Agreement under the Encore Capital Group, Inc. 2013 Incentive Compensation Plan (filed herewith) |
21 | List of Subsidiaries (filed herewith) |
23 | Consent of Independent Registered Public Accounting Firm, BDO USA, LLP, dated February 23, 2017 (filed herewith) |
31.1 | Certification of the Principal Executive Officer pursuant to Rule 13a-14(a) or 15d-14(a) under the Securities Exchange Act of 1934 (filed herewith) |
31.2 | Certification of the Principal Financial Officer pursuant to Rule 13a-14(a) or 15d-14(a) under the Securities Exchange Act of 1934 (filed herewith) |
32.1 | Certifications of Chief Executive Officer and Chief Financial Officer pursuant to 18 U.S.C. Section 1350, as adopted pursuant to Section 906 of the Sarbanes-Oxley Act of 2002 (furnished herewith) |
101.INS | XBRL Instance Document (filed herewith) |
101.SCH | XBRL Taxonomy Extension Schema Document (filed herewith) |
101.CAL | XBRL Taxonomy Extension Calculation Linkbase Document (filed herewith) |
86
Number | Description |
101.DEF | XBRL Taxonomy Extension Definition Linkbase Document (filed herewith) |
101.LAB | XBRL Taxonomy Extension Label Linkbase Document (filed herewith) |
101.PRE | XBRL Taxonomy Extension Presentation Linkbase Document (filed herewith) |
* | The asterisk denotes that confidential portions of this exhibit have been omitted in reliance on Rule 24b-2 of the Securities Exchange Act of 1934. The confidential portions have been submitted separately to the Securities and Exchange Commission. |
+ | Management contract or compensatory plan or arrangement. |
87
SIGNATURES
Pursuant to the requirements of Section 13 or 15(d) of the Securities Exchange Act of 1934, the registrant has duly caused this report to be signed on its behalf by the undersigned, thereunto duly authorized.
ENCORE CAPITAL GROUP, INC., a Delaware corporation | ||
By: | /s/ KENNETH A. VECCHIONE | |
Kenneth A. Vecchione | ||
President and Chief Executive Officer | ||
Date: February 23, 2017
Pursuant to the requirements of the Securities Exchange Act of 1934, this report has been signed by the following persons on behalf of the registrant and in the capacities and on the dates indicated.
Name and Signature | Title | Date | ||
/s/ KENNETH A. VECCHIONE | President and Chief Executive Officer and Director (Principal Executive Officer) | February 23, 2017 | ||
Kenneth A. Vecchione | ||||
/s/ JONATHAN C. CLARK | Executive Vice President, Chief Financial Officer and Treasurer (Principal Financial and Accounting Officer) | February 23, 2017 | ||
Jonathan C. Clark | ||||
/s/ ASHWINI GUPTA | Director | February 23, 2017 | ||
Ashwini Gupta | ||||
/s/ WENDY HANNAM | Director | February 23, 2017 | ||
Wendy Hannam | ||||
/s/ WILLEM MESDAG | Director | February 23, 2017 | ||
Willem Mesdag | ||||
/s/ MICHAEL P. MONACO | Director | February 23, 2017 | ||
Michael P. Monaco | ||||
/s/ LAURA OLLE | Director | February 23, 2017 | ||
Laura Olle | ||||
/s/ FRANCIS E. QUINLAN | Director | February 23, 2017 | ||
Francis E. Quinlan | ||||
/s/ NORMAN R. SORENSEN | Director | February 23, 2017 | ||
Norman R. Sorensen | ||||
/s/ RICHARD J. SREDNICKI | Director | February 23, 2017 | ||
Richard J. Srednicki | ||||
88
ENCORE CAPITAL GROUP, INC.
INDEX TO CONSOLIDATED FINANCIAL STATEMENTS
Page | |
Report of Independent Registered Public Accounting Firm | |
Consolidated Statements of Financial Condition at December 31, 2016 and 2015 | |
Consolidated Statements of Income for the years ended December 31, 2016, 2015 and 2014 | |
Consolidated Statements of Comprehensive Income for the years ended December 31, 2016, 2015 and 2014 | |
Consolidated Statements of Equity for the years ended December 31, 2016, 2015 and 2014 | |
Consolidated Statements of Cash Flows for the years ended December 31, 2016, 2015 and 2014 | |
Notes to Consolidated Financial Statements | |
Report of Independent Registered Public Accounting Firm
Board of Directors and Stockholders
Encore Capital Group, Inc.
San Diego, California
We have audited the accompanying consolidated statements of financial condition of Encore Capital Group, Inc. (“Company”) as of December 31, 2016 and 2015 and the related consolidated statements of income, comprehensive income, equity, and cash flows for each of the three years in the period ended December 31, 2016. These financial statements are the responsibility of the Company’s management. Our responsibility is to express an opinion on these financial statements based on our audits.
We conducted our audits in accordance with the standards of the Public Company Accounting Oversight Board (United States). Those standards require that we plan and perform the audit to obtain reasonable assurance about whether the financial statements are free of material misstatement. An audit includes examining, on a test basis, evidence supporting the amounts and disclosures in the financial statements, assessing the accounting principles used and significant estimates made by management, as well as evaluating the overall financial statement presentation. We believe that our audits provide a reasonable basis for our opinion.
In our opinion, the consolidated financial statements referred to above present fairly, in all material respects, the financial position of Encore Capital Group, Inc. at December 31, 2016 and 2015, and the results of its operations and its cash flows for each of the three years in the period ended December 31, 2016, in conformity with accounting principles generally accepted in the United States of America.
As discussed in Note 1 to the consolidated financial statements, the Company changed its method of accounting for debt issuance costs as of January 1, 2016 due to the retrospective adoption of Accounting Standards Update No. 2015-03, Interest - Imputation of Interest (Subtopic 835-30): Simplifying the Presentation of Debt Issuance Costs.
We also have audited, in accordance with the standards of the Public Company Accounting Oversight Board (United States), Encore Capital Group, Inc.’s internal control over financial reporting as of December 31, 2016, based on criteria established in Internal Control - Integrated Framework (2013) issued by the Committee of Sponsoring Organizations of the Treadway Commission (COSO) and our report dated February 23, 2017, expressed an unqualified opinion thereon.
/s/ BDO USA, LLP
Costa Mesa, California
February 23, 2017
F-1
ENCORE CAPITAL GROUP, INC.
Consolidated Statements of Financial Condition
(In Thousands, Except Par Value Amounts)
December 31, 2016 | December 31, 2015 | ||||||
Assets | |||||||
Cash and cash equivalents | $ | 149,765 | $ | 123,993 | |||
Investment in receivable portfolios, net | 2,382,809 | 2,440,669 | |||||
Property and equipment, net | 72,257 | 72,546 | |||||
Deferred court costs, net | 65,187 | 75,239 | |||||
Other assets | 215,447 | 148,762 | |||||
Goodwill | 785,032 | 924,847 | |||||
Assets associated with discontinued operations | — | 388,763 | |||||
Total assets | $ | 3,670,497 | $ | 4,174,819 | |||
Liabilities and equity | |||||||
Liabilities: | |||||||
Accounts payable and accrued liabilities | $ | 234,398 | $ | 290,608 | |||
Debt | 2,805,983 | 2,944,063 | |||||
Other liabilities | 29,601 | 59,226 | |||||
Liabilities associated with discontinued operations | — | 232,434 | |||||
Total liabilities | 3,069,982 | 3,526,331 | |||||
Commitments and contingencies | |||||||
Redeemable noncontrolling interest | 45,755 | 38,624 | |||||
Redeemable equity component of convertible senior notes | 2,995 | 6,126 | |||||
Equity: | |||||||
Convertible preferred stock, $.01 par value, 5,000 shares authorized, no shares issued and outstanding | — | — | |||||
Common stock, $.01 par value, 50,000 shares authorized, 25,593 shares and 25,288 shares issued and outstanding as of December 31, 2016 and December 31, 2015, respectively | 256 | 253 | |||||
Additional paid-in capital | 103,392 | 110,533 | |||||
Accumulated earnings | 560,567 | 543,489 | |||||
Accumulated other comprehensive loss | (104,911 | ) | (57,822 | ) | |||
Total Encore Capital Group, Inc. stockholders’ equity | 559,304 | 596,453 | |||||
Noncontrolling interest | (7,539 | ) | 7,285 | ||||
Total equity | 551,765 | 603,738 | |||||
Total liabilities, redeemable equity and equity | $ | 3,670,497 | $ | 4,174,819 | |||
The following table includes assets that can only be used to settle the liabilities of the Company’s consolidated variable interest entities (“VIEs”) and the creditors of the VIEs have no recourse to the Company. These assets and liabilities are included in the consolidated statements of financial condition above. See Note 11, “Variable Interest Entities” for additional information on the Company’s VIEs.
December 31, 2016 | December 31, 2015 | ||||||
Assets | |||||||
Cash and cash equivalents | $ | 55,823 | $ | 50,483 | |||
Investment in receivable portfolios, net | 972,841 | 1,197,513 | |||||
Property and equipment, net | 19,284 | 19,767 | |||||
Deferred court costs, net | 22,760 | 33,296 | |||||
Other assets | 79,767 | 31,679 | |||||
Goodwill | 584,868 | 706,812 | |||||
Liabilities | |||||||
Accounts payable and accrued liabilities | $ | 99,689 | $ | 142,375 | |||
Debt | 1,514,799 | 1,665,009 | |||||
Other liabilities | 1,921 | 839 | |||||
See accompanying notes to consolidated financial statements
F-2
ENCORE CAPITAL GROUP, INC.
Consolidated Statements of Income
(In Thousands, Except Per Share Amounts)
Year Ended December 31, | |||||||||||
2016 | 2015 | 2014 | |||||||||
Revenues | |||||||||||
Revenue from receivable portfolios, net | $ | 946,615 | $ | 1,072,436 | $ | 992,832 | |||||
Other revenues | 82,643 | 57,531 | 50,597 | ||||||||
Total revenues | 1,029,258 | 1,129,967 | 1,043,429 | ||||||||
Operating expenses | |||||||||||
Salaries and employee benefits | 281,097 | 262,281 | 238,942 | ||||||||
Cost of legal collections | 200,855 | 229,847 | 205,661 | ||||||||
Other operating expenses | 100,737 | 93,210 | 89,934 | ||||||||
Collection agency commissions | 36,141 | 37,858 | 33,343 | ||||||||
General and administrative expenses | 134,046 | 191,357 | 139,977 | ||||||||
Depreciation and amortization | 34,868 | 33,160 | 27,101 | ||||||||
Total operating expenses | 787,744 | 847,713 | 734,958 | ||||||||
Income from operations | 241,514 | 282,254 | 308,471 | ||||||||
Other (expense) income | |||||||||||
Interest expense | (198,367 | ) | (186,556 | ) | (166,942 | ) | |||||
Other income | 14,228 | 2,235 | 113 | ||||||||
Total other expense | (184,139 | ) | (184,321 | ) | (166,829 | ) | |||||
Income from continuing operations before income taxes | 57,375 | 97,933 | 141,642 | ||||||||
Provision for income taxes | (38,205 | ) | (27,162 | ) | (48,569 | ) | |||||
Income from continuing operations | 19,170 | 70,771 | 93,073 | ||||||||
(Loss) income from discontinued operations, net of tax | (2,353 | ) | (23,387 | ) | 5,205 | ||||||
Net income | 16,817 | 47,384 | 98,278 | ||||||||
Net loss (income) attributable to noncontrolling interest | 59,753 | (2,249 | ) | 5,448 | |||||||
Net income attributable to Encore Capital Group, Inc. stockholders | $ | 76,570 | $ | 45,135 | $ | 103,726 | |||||
Amounts attributable to Encore Capital Group, Inc.: | |||||||||||
Income from continuing operations | $ | 78,923 | $ | 68,522 | $ | 98,521 | |||||
(Loss) income from discontinued operations, net of tax | (2,353 | ) | (23,387 | ) | 5,205 | ||||||
Net income | $ | 76,570 | $ | 45,135 | $ | 103,726 | |||||
Earnings (loss) per share attributable to Encore Capital Group, Inc.: | |||||||||||
Basic earnings (loss) per share from: | |||||||||||
Continuing operations | $ | 3.07 | $ | 2.66 | $ | 3.81 | |||||
Discontinued operations | $ | (0.09 | ) | $ | (0.91 | ) | $ | 0.20 | |||
Net basic earnings per share | $ | 2.98 | $ | 1.75 | $ | 4.01 | |||||
Diluted earnings (loss) per share from: | |||||||||||
Continuing operations | $ | 3.05 | $ | 2.57 | $ | 3.58 | |||||
Discontinued operations | $ | (0.09 | ) | $ | (0.88 | ) | $ | 0.19 | |||
Net diluted earnings per share | $ | 2.96 | $ | 1.69 | $ | 3.77 | |||||
Weighted average shares outstanding: | |||||||||||
Basic | 25,713 | 25,722 | 25,853 | ||||||||
Diluted | 25,909 | 26,647 | 27,495 | ||||||||
See accompanying notes to consolidated financial statements
F-3
ENCORE CAPITAL GROUP, INC.
Consolidated Statements of Comprehensive Income
(In Thousands)
Year Ended December 31, | |||||||||||
2016 | 2015 | 2014 | |||||||||
Net income | $ | 16,817 | $ | 47,384 | $ | 98,278 | |||||
Other comprehensive income (loss), net of tax: | |||||||||||
Change in unrealized gains/losses on derivative instruments: | |||||||||||
Unrealized gain (loss) on derivative instruments | 407 | (1,527 | ) | 3,048 | |||||||
Income tax effect | (87 | ) | (151 | ) | (708 | ) | |||||
Unrealized gain (loss) on derivative instruments, net of tax | 320 | (1,678 | ) | 2,340 | |||||||
Change in foreign currency translation: | |||||||||||
Unrealized loss on foreign currency translation | (67,943 | ) | (57,144 | ) | (10,562 | ) | |||||
Income tax effect | 361 | (1,468 | ) | (1,774 | ) | ||||||
Unrealized loss on foreign currency translation, net of tax | (67,582 | ) | (58,612 | ) | (12,336 | ) | |||||
Other comprehensive loss, net of tax | (67,262 | ) | (60,290 | ) | (9,996 | ) | |||||
Comprehensive (loss) income | (50,445 | ) | (12,906 | ) | 88,282 | ||||||
Comprehensive loss (income) attributable to noncontrolling interest: | |||||||||||
Net loss (income) | 59,753 | (2,249 | ) | 5,448 | |||||||
Unrealized loss on foreign currency translation | 20,173 | 3,390 | 3,879 | ||||||||
Comprehensive loss attributable to noncontrolling interest | 79,926 | 1,141 | 9,327 | ||||||||
Comprehensive income (loss) attributable to Encore Capital Group, Inc. stockholders | $ | 29,481 | $ | (11,765 | ) | $ | 97,609 | ||||
See accompanying notes to consolidated financial statements
F-4
ENCORE CAPITAL GROUP, INC.
Consolidated Statements of Equity
(In Thousands)
Common Stock | Additional Paid-In Capital | Accumulated Earnings | Accumulated Other Comprehensive Income (Loss) | Noncontrolling Interest | Total Equity | |||||||||||||||||||||
Shares | Par | |||||||||||||||||||||||||
Balance at December 31, 2013 | 25,457 | $ | 255 | $ | 171,819 | $ | 394,628 | $ | 5,195 | $ | 4,010 | $ | 575,907 | |||||||||||||
Net income (loss) | — | — | — | 103,726 | — | (935 | ) | 102,791 | ||||||||||||||||||
Other comprehensive (loss) gain, net of tax | — | — | — | — | (6,117 | ) | 14 | (6,103 | ) | |||||||||||||||||
Initial noncontrolling interest related to business combinations | — | — | — | — | — | 892 | 892 | |||||||||||||||||||
Change in fair value of redeemable noncontrolling interest | — | — | (5,730 | ) | — | — | — | (5,730 | ) | |||||||||||||||||
Exercise of stock options and issuance of share-based awards, net of shares withheld for employee taxes | 737 | 7 | (15,496 | ) | — | — | — | (15,489 | ) | |||||||||||||||||
Repurchase of common stock | (400 | ) | (4 | ) | (16,811 | ) | — | — | — | (16,815 | ) | |||||||||||||||
Stock-based compensation | — | — | 17,181 | — | — | — | 17,181 | |||||||||||||||||||
Tax benefit related to stock-based compensation | — | — | 11,580 | — | — | — | 11,580 | |||||||||||||||||||
Issuance of convertible notes, net of hedge transactions | — | — | (28,160 | ) | — | — | — | (28,160 | ) | |||||||||||||||||
Reclassification of redeemable equity component of convertible senior notes | — | — | (9,073 | ) | — | — | — | (9,073 | ) | |||||||||||||||||
Balance at December 31, 2014 | 25,794 | 258 | 125,310 | 498,354 | (922 | ) | 3,981 | 626,981 | ||||||||||||||||||
Net income | — | — | — | 45,135 | — | 878 | 46,013 | |||||||||||||||||||
Other comprehensive loss, net of tax | — | — | — | — | (56,900 | ) | — | (56,900 | ) | |||||||||||||||||
Initial noncontrolling interest related to business combinations | — | — | — | — | — | 2,426 | 2,426 | |||||||||||||||||||
Change in fair value of redeemable noncontrolling interest | — | — | (2,349 | ) | — | — | — | (2,349 | ) | |||||||||||||||||
Exercise of stock options and issuance of share-based awards, net of shares withheld for employee taxes | 333 | 3 | (5,321 | ) | — | — | — | (5,318 | ) | |||||||||||||||||
Repurchase of common stock | (839 | ) | (8 | ) | (33,177 | ) | — | — | — | (33,185 | ) | |||||||||||||||
Stock-based compensation | — | — | 22,008 | — | — | — | 22,008 | |||||||||||||||||||
Tax benefit related to stock-based compensation | — | — | 1,251 | — | — | — | 1,251 | |||||||||||||||||||
Reclassification of redeemable equity component of convertible senior notes | — | — | 2,948 | — | — | — | 2,948 | |||||||||||||||||||
Other | — | — | (137 | ) | — | — | — | (137 | ) | |||||||||||||||||
Balance at December 31, 2015 | 25,288 | 253 | 110,533 | 543,489 | (57,822 | ) | 7,285 | 603,738 | ||||||||||||||||||
Net income (loss) | — | — | — | 76,570 | — | (11,922 | ) | 64,648 | ||||||||||||||||||
Other comprehensive loss, net of tax | — | — | — | — | (47,089 | ) | (3,677 | ) | (50,766 | ) | ||||||||||||||||
Initial noncontrolling interest related to business combinations | — | — | — | — | — | 775 | 775 | |||||||||||||||||||
Change in fair value of redeemable noncontrolling interest | — | — | (14,702 | ) | (59,492 | ) | — | — | (74,194 | ) | ||||||||||||||||
Exercise of stock options and issuance of share-based awards, net of shares withheld for employee taxes | 305 | 3 | (4,481 | ) | — | — | — | (4,478 | ) | |||||||||||||||||
Stock-based compensation | — | — | 12,627 | — | — | — | 12,627 | |||||||||||||||||||
Tax benefit related to stock-based compensation | — | — | (2,324 | ) | — | — | — | (2,324 | ) | |||||||||||||||||
Reclassification of redeemable equity component of convertible senior notes | — | — | 3,130 | — | — | — | 3,130 | |||||||||||||||||||
Other | — | — | (1,391 | ) | — | — | — | (1,391 | ) | |||||||||||||||||
Balance at December 31, 2016 | 25,593 | $ | 256 | $ | 103,392 | $ | 560,567 | $ | (104,911 | ) | $ | (7,539 | ) | $ | 551,765 | |||||||||||
See accompanying notes to consolidated financial statements
F-5
ENCORE CAPITAL GROUP, INC.
Consolidated Statements of Cash Flows
(In Thousands)
See accompanying notes to consolidated financial statements
Year Ended December 31, | |||||||||||
2016 | 2015 | 2014 | |||||||||
Operating activities: | |||||||||||
Net income | $ | 16,817 | $ | 47,384 | $ | 98,278 | |||||
Adjustments to reconcile net income to net cash provided by operating activities: | |||||||||||
Loss (income) from discontinued operations, net of income taxes | 2,353 | 23,387 | (6,816 | ) | |||||||
Depreciation and amortization | 34,868 | 33,160 | 27,100 | ||||||||
Other non-cash expense, net | 30,623 | 35,104 | 27,660 | ||||||||
Stock-based compensation expense | 12,627 | 22,008 | 17,181 | ||||||||
Gain on derivative instruments, net | (7,816 | ) | — | — | |||||||
Deferred income taxes | (52,905 | ) | (16,665 | ) | (48,078 | ) | |||||
Excess tax benefit from stock-based payment arrangements | — | (1,724 | ) | (11,928 | ) | ||||||
Provision for (reversal of) allowances on receivable portfolios, net | 84,177 | (6,763 | ) | (17,407 | ) | ||||||
Changes in operating assets and liabilities | |||||||||||
Deferred court costs and other assets | (20,364 | ) | (33,430 | ) | (11,282 | ) | |||||
Prepaid income tax and income taxes payable | 25,417 | (29,504 | ) | 22,180 | |||||||
Accounts payable, accrued liabilities and other liabilities | 2,439 | 43,135 | 9,832 | ||||||||
Net cash provided by operating activities from continuing operations | 128,236 | 116,092 | 106,720 | ||||||||
Net cash provided by (used in) operating activities from discontinued operations | 2,096 | (1,667 | ) | 4,824 | |||||||
Net cash provided by operating activities | 130,332 | 114,425 | 111,544 | ||||||||
Investing activities: | |||||||||||
Cash paid for acquisitions, net of cash acquired | (675 | ) | (276,575 | ) | (446,165 | ) | |||||
Proceeds from divestiture of business, net of cash divested | 106,041 | — | — | ||||||||
Purchases of assets held for sale | (19,874 | ) | — | — | |||||||
Purchases of receivable portfolios, net of put-backs | (907,413 | ) | (749,760 | ) | (862,997 | ) | |||||
Collections applied to investment in receivable portfolios, net | 659,321 | 635,899 | 633,960 | ||||||||
Purchases of property and equipment | (31,668 | ) | (28,624 | ) | (23,084 | ) | |||||
Proceeds from derivative instruments, net | 8,800 | — | — | ||||||||
Other, net | 1,994 | (1,233 | ) | (5,102 | ) | ||||||
Net cash used in investing activities from continuing operations | (183,474 | ) | (420,293 | ) | (703,388 | ) | |||||
Net cash provided by (used in) used in investing activities from discontinued operations | 14,685 | (52,416 | ) | (51,809 | ) | ||||||
Net cash used in investing activities | (168,789 | ) | (472,709 | ) | (755,197 | ) | |||||
Financing activities: | |||||||||||
Payment of loan costs | (32,338 | ) | (17,995 | ) | (20,101 | ) | |||||
Proceeds from credit facilities | 586,016 | 1,084,393 | 1,343,417 | ||||||||
Repayment of credit facilities | (615,857 | ) | (898,086 | ) | (1,184,244 | ) | |||||
Proceeds from senior secured notes | 442,610 | 332,693 | 288,645 | ||||||||
Repayment of senior secured notes | (352,549 | ) | (15,000 | ) | (15,000 | ) | |||||
Proceeds from issuance of convertible senior notes | — | — | 161,000 | ||||||||
Proceeds from issuance of securitized notes | — | — | 134,000 | ||||||||
Repayment of securitized notes | (935 | ) | (44,251 | ) | (29,753 | ) | |||||
Purchases of convertible hedge instruments | — | — | (33,576 | ) | |||||||
Repurchase of common stock | — | (33,185 | ) | (16,815 | ) | ||||||
Taxes paid related to net share settlement of equity awards | (4,829 | ) | (6,289 | ) | (20,324 | ) | |||||
Excess tax benefit from stock-based payment arrangements | — | 1,724 | 11,928 | ||||||||
Proceeds from other debt | 36,172 | — | — | ||||||||
Other, net | (15,037 | ) | (2,159 | ) | 7,146 | ||||||
Net cash provided by financing activities | 43,253 | 401,845 | 626,323 | ||||||||
Net increase (decrease) in cash and cash equivalents | 4,796 | 43,561 | (17,330 | ) | |||||||
Effect of exchange rate changes on cash and cash equivalents | (8,624 | ) | (14,131 | ) | 15,280 | ||||||
Cash and cash equivalents, beginning of period | 153,593 | 124,163 | 126,213 | ||||||||
Cash and cash equivalents, end of period | 149,765 | 153,593 | 124,163 | ||||||||
Cash and cash equivalents of discontinued operations, end of period | — | 29,600 | 32,644 | ||||||||
Cash and cash equivalents of continuing operations, end of period | $ | 149,765 | $ | 123,993 | $ | 91,519 | |||||
Supplemental disclosures of cash flow information: | |||||||||||
Cash paid for interest | $ | 147,899 | $ | 151,946 | $ | 95,034 | |||||
Cash paid for income taxes, net | 60,071 | 84,101 | 69,948 | ||||||||
Supplemental schedule of non-cash investing and financing activities: | |||||||||||
Fixed assets acquired through capital lease | $ | 55 | $ | 2,220 | $ | 8,341 | |||||
F-6
ENCORE CAPITAL GROUP, INC.
Notes to Consolidated Financial Statements
Note 1: Ownership, Description of Business, and Summary of Significant Accounting Policies
Encore Capital Group, Inc. (“Encore”), through its subsidiaries (collectively with Encore, the “Company”), is an international specialty finance company providing debt recovery solutions and other related services for consumers across a broad range of financial assets. The Company purchases portfolios of defaulted consumer receivables at deep discounts to face value and manages them by working with individuals as they repay their obligations and work toward financial recovery. Defaulted receivables are consumers’ unpaid financial commitments to credit originators, including banks, credit unions, consumer finance companies, commercial retailers, and telecommunication companies. Defaulted receivables may also include receivables subject to bankruptcy proceedings.
Basis of Consolidation
The consolidated financial statements have been prepared in conformity with accounting principles generally accepted in the United States of America (“GAAP”), and reflect the accounts and operations of the Company and those of its subsidiaries in which the Company has a controlling financial interest. The Company also consolidates VIEs, for which it is the primary beneficiary. The primary beneficiary has both (a) the power to direct the activities of the VIE that most significantly affect the entity’s economic performance and (b) either the obligation to absorb losses or the right to receive benefits. Refer to Note 11, “Variable Interest Entities” for further details. All intercompany transactions and balances have been eliminated in consolidation.
Translation of Foreign Currencies
The financial statements of certain of the Company’s foreign subsidiaries are measured using their local currency as the functional currency. Assets and liabilities of foreign operations are translated into U.S. dollars using period-end exchange rates, and revenues and expenses are translated into U.S. dollars using average exchange rates in effect during each period. The resulting translation adjustments are recorded as a component of other comprehensive income or loss. Equity accounts are translated at historical rates, except for the change in retained earnings during the year which is the result of the income statement translation process. Intercompany transaction gains or losses at each period end arising from subsequent measurement of balances for which settlement is not planned or anticipated in the foreseeable future are included as translation adjustments and recorded within other comprehensive income or loss. Transaction gains and losses are included in other income or expense.
Reclassifications
Certain immaterial reclassifications have been made to the consolidated financial statements to conform to the current year’s presentation. For the years ended December 31, 2015 and 2014, the Company revised its statements of comprehensive income. The comprehensive loss attributable to Encore increased by $3.4 million for the year ended December 31, 2015, and the comprehensive income attributable to Encore decreased by $3.5 million for the years ended December 31, 2014. These revisions were not material. There were no revisions to the statements of financial condition, income, equity or cash flows.
Change in Accounting Principle
In April 2015, the Financial Accounting Standards Board (the “FASB”) issued Accounting Standards Update (“ASU”) No. 2015-03, Interest—Imputation of Interest (Subtopic 835-30): Simplifying the Presentation of Debt Issuance Cost (“ASU 2015-03”). ASU 2015-03 requires that debt issuance costs related to a recognized debt liability be presented in the balance sheet as a direct deduction from the carrying amount of that debt liability, consistent with debt discounts. ASU 2015-03 was effective beginning January 1, 2016, with early adoption permitted. The update requires retrospective application and represents a change in accounting principle. The Company adopted ASU 2015-03 in the first quarter of 2016 and the retrospective application of this change in accounting principle on the consolidated balance sheet as of December 31, 2015 reclassified debt issuance costs of $41.7 million, which were previously presented as other assets, as a reduction to the carrying value of the debt by the same amount. The adoption did not have an impact on the Company's condensed consolidated statements of income or statements of cash flows in any period.
Recent Accounting Pronouncements
Other than the adoption of ASU 2015-03 as discussed in the “Change in Accounting Principle” section above, there have been no new accounting pronouncements made effective during year ended December 31, 2016 that have significance, or potential significance, to the Company’s consolidated financial statements.
F-7
Recent Accounting Pronouncements Not Yet Effective
In January 2017, the FASB issued ASU 2017-04, Intangibles - Goodwill and Other (Topic 350). The amendments in this update simplify the test for goodwill impairment by eliminating Step 2 from the impairment test, which required the entity to perform procedures to determine the fair value at the impairment testing date of its assets and liabilities following the procedure that would be required in determining fair value of assets acquired and liabilities assumed in a business combination. The amendments in this update are effective for public companies for annual or any interim goodwill impairments tests in fiscal years beginning after December 15, 2019. Early adoption is permitted for interim or annual goodwill impairment tests performed on testing dates after January 1, 2017. The Company is evaluating the impact of adopting this guidance on its consolidated financial statements as well as whether to adopt the new guidance early.
In January 2017, the FASB issued ASU 2017-01, Business Combinations (Topic 805); Clarifying the Definition of a Business. The amendments in this update clarify the definition of a business to help companies evaluate whether transactions should be accounted for as acquisitions or disposals of assets or businesses. The amendments in this update are effective for public companies for annual periods beginning after December 15, 2017, including interim periods within those periods. The Company is evaluating the impact of adopting this guidance on its consolidated financial statements.
In August 2016, the FASB issued ASU 2016-15, Statement of Cash Flows (Topic 230): Classification of Certain Cash Receipts and Cash Payments (“ASU 2016-15”). The FASB issued ASU 2016-15 to decrease the diversity in practice in how certain cash receipts and cash payments are presented and classified in the statement of cash flows. The amendments in this update provide guidance on eight specific cash flow issues. ASU 2016-15 is effective for reporting periods beginning after December 15, 2017, with early adoption permitted, provided that all of the amendments are adopted in the same period. The guidance requires application using a retrospective transition method. The Company is currently evaluating the impact of this accounting standard update on its consolidated financial statements as well as whether to adopt the new guidance early.
In June 2016, the FASB issued ASU No. 2016-13, Financial Instruments - Credit Losses (Topic 326): Measurement of Credit Losses on Financial Instruments (“ASU 2016-13”). ASU 2016-13 applies a current expected credit loss model which is a new impairment model based on expected losses rather than incurred losses. Under this model, an entity would recognize an impairment allowance equal to its current estimate of all contractual cash flows that the entity does not expect to collect from financial assets measured at amortized cost. The estimate of expected credit losses should consider historical information, current information, as well as reasonable and supportable forecasts, including estimates of prepayments. The expected credit losses, and subsequent adjustments to such losses, will be recorded through an allowance account that is deducted from the amortized cost basis of the financial asset, with the net carrying value of the financial asset presented on the consolidated balance sheet at the amount expected to be collected. ASU 2016-13 eliminates the current accounting model for loans and debt securities acquired with deteriorated credit quality under ASC 310-30, which provides authoritative guidance for the accounting of the Company’s investment in receivable portfolios. Under this new standard, entities will gross up the initial amortized cost for the purchased financial assets with credit deterioration (“PCD assets”), the initial amortized cost will be the sum of (1) the purchase price and (2) the estimate of credit losses as of the date of acquisition. After initial recognition of PCD assets and the related allowance, any change in estimated cash flows (favorable or unfavorable) will be immediately recognized in the income statement because the yield on PCD assets is locked. ASU 2016-13 is effective for reporting periods beginning after December 15, 2019 with early adoption permitted for reporting periods beginning after December 15, 2018. The Company is in the process of determining the effects the adoption will have on its consolidated financial statements as well as whether to adopt the new guidance early.
In March 2016, the FASB issued ASU No. 2016-09, Compensation - Stock Compensation (Topic 718): Improvements to Employee Share-Based Payment Accounting (“ASU 2016-09”). ASU 2016-09 simplifies several aspects of the accounting for share-based payment transactions, including the income tax consequences, classification of awards as either equity or liabilities, and classification on the statement of cash flows. For public entities, ASU 2016-09 is effective for fiscal years beginning after December 15, 2016, and interim periods within those fiscal years. Early adoption is permitted. Upon adoption of this standard, excess tax benefits and tax deficiencies will be recognized as income tax expense, and the tax effects of exercised or vested awards will be treated as discrete items in the period in which they occur. As such, implementation of this standard could create volatility in and entity’s effective income tax rate on a quarter by quarter basis. The volatility in the effective income tax rate is due primarily to fluctuations in the stock price and the timing of stock option exercises and vesting of restricted share grants. The standard also requires excess tax benefits to be presented as an operating activity on the statement of cash flows rather than as a financing activity. An entity may elect to apply the change in presentation in the statement of cash flows either prospectively or retrospectively to all periods presented. Further, the amendments allow the entities to make an accounting policy election to either estimate forfeitures or recognize forfeitures as they occur. If an election is made, the change to recognize forfeitures as they occur must be adopted using a modified retrospective approach with a cumulative effect adjustment recorded to opening retained earnings.
F-8
ASU 2016-09 became effective for the Company on January 1, 2017. The Company will apply the change in presentation in the statement of cash flows retrospectively for all periods presented after adoption date. The Company believes that the new standard may cause volatility in its effective tax rates and earnings per share due to the tax effects related to share-based payments being recorded to the income statement. The volatility in future periods will depend on the Company’s stock price at the awards’ vest dates and the number of awards that vest in each period. The Company will not elect an accounting policy change to record forfeitures as they occur and will continue to estimate forfeitures at each period.
In February 2016, the FASB issued ASU 2016-02, Leases (Topic 842) (“ASU 2016-02”). ASU 2016-02 changes accounting for leases and requires lessees to recognize the assets and liabilities arising from all leases, including those classified as operating leases under previous accounting guidance, on the balance sheet and requires disclosure of key information about leasing arrangements to increase transparency and comparability among organizations. The new guidance must be adopted using the modified retrospective approach and will be effective for the Company starting in the first quarter of fiscal year 2019. Early adoption is permitted. The Company is in the process of determining the effects the adoption will have on its consolidated financial statements as well as whether to adopt the new guidance early.
In May 2014, the FASB issued ASU 2014-09, Revenue from Contracts with Customers (Topic 606) (“ASU 2014-09”). The objective of ASU 2014-09 is to establish a single comprehensive model for entities to use in accounting for revenue arising from contracts with customers and will supersede most of the existing revenue recognition guidance, including industry-specific guidance. The core principle is that an entity should recognize revenue to depict the transfer of promised goods or services to customers in an amount that reflects the consideration to which the entity expects to be entitled in exchange for those goods or services. In applying ASU 2014-09, companies will perform a five-step analysis of transactions to determine when and how revenue is recognized. ASU 2014-09 applies to all contracts with customers except those that are within the scope of other topics in the FASB’s ASC. ASU 2014-09 is effective for annual reporting periods (including interim periods within that reporting period) beginning after December 15, 2016 and shall be applied using either a full retrospective or modified retrospective approach. Early application is not permitted. In August 2015, FASB issued ASU 2015-14, which defers the effective date of ASU 2014-09 for all public companies for all annual periods beginning after December 15, 2017 with early adoption permitted only as of annual reporting periods beginning after December 31, 2016, including interim periods within the reporting period. In March 2016, the FASB issued ASU 2016-08 as an amendment to ASU 2014-09, the amendment clarifies how to identify the unit of accounting for the principal versus agent evaluation, how to apply the control principle to certain types of arrangements, such as service transaction, and reframed the indicators in the guidance to focus on evidence that an entity is acting as a principal rather than as an agent. The Company is evaluating its implementation approach and the potential impacts of Topic 606 on its existing revenue recognition policies and procedures. The revenue recognition guidance of this new standard applies to the Company’s fee-based income generated from its international subsidiaries that provide portfolio management services. The Company does not expect the adoption of this standard will have a material impact on its consolidated financial statements.
With the exception of the updated standards discussed above, there have been no new accounting pronouncements not yet effective that have significance, or potential significance, to the Company’s consolidated financial statements.
Use of Estimates
The preparation of financial statements, in conformity with GAAP, requires management to make estimates and assumptions that affect the reported amounts of assets and liabilities and disclosure of contingent assets and liabilities at the date of the financial statements and the reported amounts of revenues and expenses during the reporting period. Actual results could materially differ from those estimates.
Cash and Cash Equivalents
Cash and cash equivalents consist of highly liquid investments with maturities of three months or less at the date of purchase. The Company invests its excess cash in bank deposits and money market instruments, which are afforded the highest ratings by nationally recognized rating firms. The carrying amounts reported in the consolidated statements of financial condition for cash and cash equivalents approximate their fair value.
Investment in Receivable Portfolios
In accordance with the authoritative guidance for loans and debt securities acquired with deteriorated credit quality, discrete receivable portfolio purchases during the same fiscal quarter are aggregated into pools based on common risk characteristics. Common risk characteristics include risk ratings (e.g. FICO or similar scores), financial asset type, collateral type, size, interest rate, date of origination, term, and geographic location. The Company’s static pools are typically grouped into credit card, purchased consumer bankruptcy, and mortgage portfolios. The Company further groups these static pools by geographic region or location. Portfolios acquired in business combinations are also grouped into these pools. During any fiscal quarter in which the Company has an acquisition of an entity that has portfolio, the entire historical portfolio of the acquired
F-9
company is aggregated into the pool groups for that quarter, based on common characteristics, resulting in pools for that quarter that may consist of several different vintages of portfolio. Once a static pool is established, the portfolios are permanently assigned to the pool. The discount (i.e., the difference between the cost of each static pool and the related aggregate contractual receivable balance) is not recorded because the Company expects to collect a relatively small percentage of each static pool’s contractual receivable balance. As a result, receivable portfolios are recorded at cost at the time of acquisition. The purchase cost of the portfolios includes certain fees paid to third parties incurred in connection with the direct acquisition of the receivable portfolios.
In compliance with the authoritative guidance, the Company accounts for its investments in consumer receivable portfolios using either the interest method or the cost recovery method. The interest method applies an internal rate of return (“IRR”) to the cost basis of the pool, which remains unchanged throughout the life of the pool, unless there is an increase in subsequent expected cash flows. Subsequent increases in expected cash flows are generally recognized prospectively through an upward adjustment of the pool’s IRR over its remaining life. Subsequent decreases in expected cash flows do not change the IRR, but are recognized as an allowance to the cost basis of the pool, and are reflected in the consolidated statements of income as a reduction in revenue, with a corresponding valuation allowance, offsetting the investment in receivable portfolios in the consolidated statements of financial condition. With gross collections being discounted at monthly IRRs, when collections are lower in the near term, even if substantially higher collections are expected later in the collection curve, an allowance charge could result.
The Company accounts for each static pool as a unit for the economic life of the pool (similar to one loan) for recognition of revenue from receivable portfolios, for collections applied to the cost basis of receivable portfolios and for provision for loss or allowance. Revenue from receivable portfolios is accrued based on each pool’s IRR applied to each pool’s adjusted cost basis. The cost basis of each pool is increased by revenue earned and decreased by gross collections and portfolio allowances.
If the amount and timing of future cash collections on a pool of receivables are not reasonably estimable, the Company accounts for such portfolios on the cost recovery method (“Cost Recovery Portfolios”). The accounts in these portfolios have different risk characteristics than those included in other portfolios acquired during the same quarter, or the necessary information was not available to estimate future cash flows and, accordingly, they were not aggregated with other portfolios. See Note 6, “Investment in Receivable Portfolios, Net” for further discussion of investment in receivable portfolios.
Fee-based Income
Certain of the Company’s international subsidiaries earn fee-based income by providing portfolio management services to credit originators for non-performing loans. The Company recognizes fee-based income in accordance with the authoritative guidance for revenue recognition, specifically principal agent considerations. The revenue recognition guidance requires an analysis to be completed to determine if certain revenues should be reported gross or reported net of their related operating expense. This analysis includes an assessment of who retains credit risk, controls vendor selection, establishes pricing and remains the primary obligor on the transaction. The Company considers each of these factors to determine the correct method of recognizing fee-based income. Fee-based income is included in “Other Revenues” in the Company’s consolidated statements of income.
Goodwill and Other Intangible Assets
Goodwill represents the excess of purchase price over the value assigned to the tangible and identifiable intangible assets, liabilities assumed, and noncontrolling interest of businesses acquired. Acquired intangible assets other than goodwill are amortized over their useful lives unless the lives are determined to be indefinite. In accordance with authoritative guidance on goodwill and other intangible assets, goodwill and other indefinite-lived intangible assets are tested at the reporting unit level annually for impairment and in interim periods if certain events occur indicating the fair value of a reporting unit may be below its carrying value. See Note 16, “Goodwill and Identifiable Intangible Assets” for further discussion of the Company’s goodwill and other intangible assets.
F-10
Property and Equipment
Property and equipment are recorded at cost, less accumulated depreciation and amortization. The provision for depreciation and amortization is computed using the straight-line method over the estimated useful lives of the assets as follows:
Fixed Asset Category | Estimated Useful Life | |
Leasehold improvements | Lesser of lease term, including periods covered by renewal options, or useful life | |
Furniture, fixtures and equipment | 5 to 10 years | |
Computer hardware and software | 3 to 10 years | |
Maintenance and repairs are charged to expense in the year incurred. Expenditures for major renewals that extend the useful lives of fixed assets are capitalized and depreciated over the useful lives of such assets.
Deferred Court Costs
The Company pursues legal collections using a network of attorneys that specialize in collection matters and through its internal legal channel. The Company generally pursues collections through legal means only when it believes a consumer has sufficient assets to repay their indebtedness but has, to date, been unwilling to pay. In order to pursue legal collections the Company is required to pay certain upfront costs to the applicable courts that are recoverable from the consumer (“Deferred Court Costs”). The Company capitalizes Deferred Court Costs in its consolidated financial statements and provides a reserve for those costs that it believes will ultimately be uncollectible. The Company determines the reserve based on an estimated court cost recovery rate established based on its analysis of historical court costs recovery data. The Company estimates deferral periods for Deferred Court Costs based on jurisdiction and nature of litigation and writes off any Deferred Court Costs not recovered within the respective deferral period. Collections received from debtors are first applied against related court costs with the balance applied to the debtors’ account balance. See Note 7, “Deferred Court Costs, Net” for further discussion.
Income Taxes
The Company uses the liability method of accounting for income taxes in accordance with the authoritative guidance for Income Taxes. When the Company prepares its consolidated financial statements, it estimates income taxes based on the various jurisdictions and countries where it conducts business. This requires the Company to estimate current tax exposure and to assess temporary differences that result from differing treatments of certain items for tax and accounting purposes. Deferred income taxes are recognized based on the differences between the financial statement and income tax bases of assets and liabilities using enacted tax rates in effect for the year in which the differences are expected to reverse. The Company then assesses the likelihood that deferred tax assets will be realized. Valuation allowances are established, when necessary, to reduce deferred tax assets to the amount expected to be realized. When the Company establishes a valuation allowance or increases this allowance in an accounting period, it records a corresponding tax expense in the consolidated statement of income. The Company includes interest and penalties related to income taxes within its provision for income taxes. The Company uses the income forecasting methodology to recognize the income and expenses of the portfolios with the exception of a certain recently acquired subsidiary, which uses the cost recovery methodology. See Note 13, “Income Taxes” for further discussion.
Management must make significant judgments to determine the provision for income taxes, deferred tax assets and liabilities, and any valuation allowance to be recorded against deferred tax assets.
Stock-Based Compensation
The Company determines stock-based compensation expense for all share-based payment awards based on the measurement date fair value. The Company has certain share awards that include market conditions that affect vesting, the fair value of these shares is estimated using a lattice model. Compensation cost is not adjusted if the market condition is not met, as long as the requisite service is provided. For share awards that require service and performance conditions, the Company recognizes compensation cost only for those awards expected to meet the service and performance vesting conditions over the requisite service period of the award. Forfeiture rates are estimated based on the Company’s historical experience. See Note 12, “Stock-Based Compensation” for further discussion.
Derivative Instruments and Hedging Activities
The Company recognizes all derivative financial instruments in its consolidated financial statements at fair value. Changes in the fair value of derivative instruments are recorded in earnings unless hedge accounting criteria are met. The Company designates certain foreign currency exchange contracts and interest rate swap agreements as cash flow hedges. The effective portion of the changes in fair value of these cash flow hedges is recorded each period, net of tax, in accumulated other
F-11
comprehensive income or loss until the related hedged transaction occurs. Any ineffective portion of the changes in fair value of these cash flow hedges is recorded in earnings. In the event the hedged cash flow does not occur, or it becomes probable that it will not occur, the Company would reclassify the amount of any gain or loss on the related cash flow hedge to income or expense at that time. See Note 5, “Derivatives and Hedging Instruments” for further discussion.
Redeemable Noncontrolling Interest
Some minority shareholders in certain subsidiaries of the Company have the right, at certain times, to require the Company to acquire their ownership interest in those entities at fair value, and in some cases, to force a sale of the subsidiary if the Company chooses not to purchase their interests at fair value. The noncontrolling interest subject to these arrangements is included in temporary equity as redeemable noncontrolling interest, and is adjusted to its estimated redemption amount each reporting period with a corresponding adjustment to additional paid-in capital. Future reductions in the carrying amount are subject to a “floor” amount that is equal to the fair value of the redeemable noncontrolling interest at the time it was originally recorded. The recorded value of the redeemable noncontrolling interest cannot go below the floor level. These adjustments do not affect the calculation of earnings per share.
Earnings Per Share
Basic earnings per share is calculated by dividing net earnings attributable to Encore by the weighted average number of shares of common stock outstanding during the period. Diluted earnings per share is calculated on the basis of the weighted average number of shares of common stock plus the effect of dilutive potential common shares outstanding during the period using the treasury stock method. Dilutive potential common shares include outstanding stock options, restricted stock, and the dilutive effect of the convertible senior notes.
On April 24, 2014, the Company’s Board of Directors approved a $50.0 million share repurchase program. In May 2014, the Company repurchased 400,000 shares of its common stock for approximately $16.8 million. In May 2015, the Company repurchased 839,295 shares of common stock for approximately $33.2 million, which represented the remaining amount allowed under this share repurchase program. The Company’s practice is to retire the shares repurchased.
On August 12, 2015, the Company’s Board of Directors approved a new $50.0 million share repurchase program. Repurchases under this program are expected to be made with cash on hand and may be made from time to time, subject to market conditions and other factors, in the open market, through private transactions, block transactions, or other methods as determined by the Company’s management and Board of Directors, and in accordance with market conditions, other corporate considerations, and applicable regulatory requirements. The program does not obligate the Company to acquire any particular amount of common stock, and it may be modified or suspended at any time at the Company’s discretion.
A reconciliation of shares used in calculating earnings per basic and diluted shares follows (in thousands):
Year Ended December 31, | ||||||||
2016 | 2015 | 2014 | ||||||
Weighted average common shares outstanding—basic | 25,713 | 25,722 | 25,853 | |||||
Dilutive effect of stock-based awards | 196 | 253 | 556 | |||||
Dilutive effect of convertible senior notes | — | 672 | 1,082 | |||||
Dilutive effect of warrants | — | — | 4 | |||||
Weighted average common shares outstanding—diluted | 25,909 | 26,647 | 27,495 | |||||
Anti-dilutive employee stock options outstanding were zero or negligible during the periods presented above.
The Company has the following convertible senior notes outstanding: $115.0 million convertible senior notes due 2017 at a conversion price equivalent to approximately $31.56 per share of the Company’s common stock (the “2017 Convertible Notes”), $172.5 million convertible senior notes due 2020 at a conversion price equivalent to approximately $45.72 per share of the Company’s common stock (the “2020 Convertible Notes”), and $161.0 million convertible senior notes due 2021 at a conversion price equivalent to approximately $59.39 per share of the Company’s common stock (the “2021 Convertible Notes”).
In the event of conversion, the 2017 Convertible Notes are convertible into cash up to the aggregate principal amount and permit the excess conversion premium to be settled in cash or shares of the Company’s common stock. For the 2020 Convertible Notes and 2021 Convertible Notes, the Company has the option to pay cash, issue shares of common stock or any combination thereof for the aggregate amount due upon conversion. The Company’s intent is to settle the principal amount of the 2020 and 2021 Convertible Notes in cash upon conversion. As a result, upon conversion of all the convertible senior notes,
F-12
only the amounts payable in excess of the principal amounts are considered in diluted earnings per share under the treasury stock method. Diluted earnings per share during the periods presented above included the effect of the common shares issuable upon conversion of certain of the convertible senior notes because the average stock price exceeded the conversion price of these notes. However, as described in Note 10, “Debt-Encore Convertible Notes,” the Company entered into certain hedge transactions that have the effect of increasing the effective conversion price of the 2017 Convertible Notes to $60.00, the 2020 Convertible Notes to $61.55, and the 2021 Convertible Notes to $83.14. On January 2, 2014 the 2017 Convertible Notes became convertible as certain conditions for conversion were met in the immediately preceding calendar quarter as defined in the applicable indenture. However, none of the 2017 Convertible Notes have been converted.
Note 2: Discontinued Operations
On March 31, 2016, the Company completed its previously announced divestiture of its membership interests in Propel Acquisition LLC (“Propel”) pursuant to the Securities Purchase Agreement (the “Purchase Agreement”), dated February 19, 2016, among the Company and certain funds affiliated with Prophet Capital Asset Management LP. Pursuant to the Purchase Agreement, the application of the purchase price formula resulted in cash consideration paid to the Company at closing of $144.4 million (net proceeds were $106.0 million after divestiture of $38.4 million in cash), subject to customary post-closing adjustments. The purchase price was finalized in January 2017.
During the three months ended March 31, 2016, the Company recognized a loss of $3.0 million related to the sale of Propel, this loss was reduced to $1.7 million based on the true-up adjustments recorded in the fourth quarter of 2016 subsequent to the sale. Propel represented the Company’s entire tax lien business reportable segment. Propel’s operations are presented as discontinued operations in the Company’s consolidated statements of income. Certain immaterial costs that may be eliminated as a result of the sale remained in continuing operations.
The following table presents the results of the discontinued operations during the periods presented (in thousands):
Year Ended December 31, | |||||||||||
2016 | 2015 | 2014 | |||||||||
Revenue | $ | 4,950 | $ | 31,605 | $ | 29,361 | |||||
Salaries and employee benefits | (3,074 | ) | (8,053 | ) | (7,304 | ) | |||||
Other operating expenses | (1,366 | ) | (4,972 | ) | (3,926 | ) | |||||
General and administrative expenses | (1,551 | ) | (5,470 | ) | (9,059 | ) | |||||
Depreciation and amortization | (127 | ) | (785 | ) | (849 | ) | |||||
Impairment charge for goodwill and identifiable intangible assets | — | (49,277 | ) | — | |||||||
(Loss) income from discontinued operations, before income taxes | (1,168 | ) | (36,952 | ) | 8,223 | ||||||
Loss on sale of discontinued operations, before income taxes | (1,679 | ) | — | — | |||||||
Total (loss) income on discontinued operations, before income taxes | (2,847 | ) | (36,952 | ) | 8,223 | ||||||
Income tax benefit (provision) | 494 | 13,565 | (3,018 | ) | |||||||
Total (loss) income from discontinued operations, net of tax | $ | (2,353 | ) | $ | (23,387 | ) | $ | 5,205 | |||
Note 3: Business Combinations
dlc Acquisition
On June 1, 2015, Encore’s U.K.-based subsidiary, Cabot Credit Management Limited and its subsidiaries (collectively, “Cabot”) acquired Hillesden Securities Ltd and its subsidiaries (“dlc”), a U.K.-based acquirer and collector of non-performing unsecured consumer debt for approximately £180.6 million (approximately $274.7 million), (the “dlc Acquisition”).
The dlc Acquisition was accounted for using the acquisition method of accounting and, accordingly, the tangible and intangible assets acquired and liabilities assumed were recorded at their estimated fair values as of the date of the acquisition. Fair value measurements have been applied based on assumptions that market participants would use in the pricing of the respective assets and liabilities.
F-13
The components of the purchase price allocation for the dlc Acquisition were as follows (in thousands):
Purchase price: | |||
Cash paid at acquisition | $ | 268,391 | |
Deferred consideration | 6,306 | ||
Total purchase price | $ | 274,697 | |
Allocation of purchase price: | |||
Cash | $ | 30,518 | |
Investment in receivable portfolios | 215,988 | ||
Deferred court costs | 760 | ||
Property and equipment | 1,327 | ||
Other assets | 2,384 | ||
Liabilities assumed | (46,435 | ) | |
Identifiable intangible assets | 3,669 | ||
Goodwill | 66,486 | ||
Total net assets acquired | $ | 274,697 | |
The goodwill recognized is primarily attributable to synergies that are expected to be achieved by combining dlc and Cabot's existing contingent collections operations. The entire goodwill of $66.5 million related to the dlc Acquisition is not deductible for income tax purposes.
Total acquisition and integration costs related to the dlc Acquisition were approximately $2.8 million for the year ended December 31, 2015, and have been expensed in the accompanying consolidated statements of income within general and administrative expenses. The amount of revenue and net income attributable to Encore included in the Company’s consolidated statement of income for the year ended December 31, 2015 related to dlc was $27.5 million and $6.3 million, respectively.
Pro forma financial information for the dlc Acquisition has not been included as the computation of such information is impracticable and too onerous due to the complexities of a hypothetical calculation because dlc’s revenue recognition methodology prior to the dlc Acquisition was significantly different from GAAP.
Other Acquisitions
In addition to the dlc Acquisition discussed above, the Company, through its subsidiaries, completed certain other acquisitions in 2016 and 2015. These acquisitions were immaterial to the Company’s financial statements individually and in the aggregate.
Note 4: Fair Value Measurements
The authoritative guidance for fair value measurements defines fair value as the price that would be received upon sale of an asset or the price paid to transfer a liability, in an orderly transaction between market participants at the measurement date (i.e., the “exit price”). The guidance utilizes a fair value hierarchy that prioritizes the inputs used in valuation techniques to measure fair value into three broad levels. The following is a brief description of each level:
• | Level 1: Observable inputs such as quoted prices (unadjusted) in active markets for identical assets or liabilities. |
• | Level 2: Inputs other than quoted prices that are observable for the asset or liability, either directly or indirectly. These include quoted prices for similar assets or liabilities in active markets and quoted prices for identical or similar assets or liabilities in markets that are not active. |
• | Level 3: Unobservable inputs, including inputs that reflect the reporting entity’s own assumptions. |
F-14
Financial Instruments Required To Be Carried At Fair Value
Financial assets and liabilities measured at fair value on a recurring basis are summarized below (in thousands):
Fair Value Measurements as of December 31, 2016 | |||||||||||||||
Level 1 | Level 2 | Level 3 | Total | ||||||||||||
Assets | |||||||||||||||
Foreign currency exchange contracts | $ | — | $ | 1,122 | $ | — | $ | 1,122 | |||||||
Liabilities | |||||||||||||||
Foreign currency exchange contracts | — | (1,360 | ) | — | (1,360 | ) | |||||||||
Interest rate swap agreements | — | (131 | ) | — | (131 | ) | |||||||||
Contingent consideration | — | — | (2,531 | ) | (2,531 | ) | |||||||||
Temporary Equity | |||||||||||||||
Redeemable noncontrolling interest | — | — | (45,755 | ) | (45,755 | ) | |||||||||
Fair Value Measurements as of December 31, 2015 | |||||||||||||||
Level 1 | Level 2 | Level 3 | Total | ||||||||||||
Assets | |||||||||||||||
Foreign currency exchange contracts | $ | — | $ | 718 | $ | — | $ | 718 | |||||||
Liabilities | |||||||||||||||
Foreign currency exchange contracts | — | (601 | ) | — | (601 | ) | |||||||||
Interest rate swap agreements | — | (352 | ) | — | (352 | ) | |||||||||
Contingent consideration | — | — | (10,403 | ) | (10,403 | ) | |||||||||
Temporary Equity | |||||||||||||||
Redeemable noncontrolling interest | — | — | (38,624 | ) | (38,624 | ) | |||||||||
Derivative Contracts:
The Company uses derivative instruments to manage its exposure to fluctuations in interest rates and foreign currency exchange rates. Fair values of these derivative instruments are estimated using industry standard valuation models. These models project future cash flows and discount the future amounts to a present value using market-based observable inputs, including interest rate curves, foreign currency exchange rates, and forward and spot prices for currencies.
Contingent consideration:
In October 2015, the Company, through its subsidiaries, acquired two debt solution service providers in Europe. According to the terms of the purchase agreements, the sellers could earn additional earn-out payments in cash based on each acquired entities’ respective subsequent operating performance. The Company recorded the acquisition-date fair values of these contingent liabilities, based on the likelihood of contingent earn-out payments, as part of the consideration transferred. The earn-out payments are subsequently remeasured to fair value at each reporting date. During the review of the earn-out analysis in the fourth quarter of 2016, the Company determined that, based on the actual and forecasted operating performance at one of the acquired entities, there would be no future earn-out payment to the sellers, as a result, the entire liability for the contingent consideration of $8.1 million relating to the acquisition of this entity was reversed during the year ended December 31, 2016. As of December 31, 2016, the fair value of the contingent consideration for the other acquired entity was approximately $2.5 million.
F-15
The following table provides a roll-forward of the fair value of contingent consideration for the years ended December 31, 2016 and 2015 (in thousands):
Amount | |||
Balance at December 31, 2014 | $ | — | |
Issuance of contingent consideration in connection with acquisition | 10,587 | ||
Change in fair value of contingent consideration | 132 | ||
Effect of foreign currency translation | (316 | ) | |
Balance at December 31, 2015 | 10,403 | ||
Change in fair value of contingent consideration | (7,602 | ) | |
Effect of foreign currency translation | (270 | ) | |
Balance at December 31, 2016 | $ | 2,531 | |
Redeemable Noncontrolling Interest:
Some minority shareholders in certain subsidiaries of the Company have the right, at certain times, to require the Company to acquire their ownership interest in those entities at fair value and, in some cases, to force a sale of the subsidiary if the Company chooses not to purchase their interests at fair value. The noncontrolling interest subject to these arrangements is included in temporary equity as redeemable noncontrolling interest, and is adjusted to its estimated redemption amount each reporting period with a corresponding adjustment to additional paid-in capital. Future reductions in the carrying amount are subject to a “floor” amount that is equal to the fair value of the redeemable noncontrolling interest at the time it was originally recorded. The recorded value of the redeemable noncontrolling interest cannot go below the floor level. Adjustments to the carrying amount of redeemable noncontrolling interest are charged to retained earnings (or to additional paid-in capital if there are no retained earnings) and do not affect net income or comprehensive income in the consolidated financial statements.
The components of the change in the redeemable noncontrolling interest for the years ended December 31, 2016, 2015 and 2014 are presented in the following table (in thousands):
Amount | |||
Balance at December 31, 2013 | $ | 26,564 | |
Addition to redeemable noncontrolling interest | 4,997 | ||
Net loss attributable to redeemable noncontrolling interest | (4,513 | ) | |
Adjustment of the redeemable noncontrolling interest to fair value | 5,730 | ||
Effect of foreign currency translation attributable to redeemable noncontrolling interest | (3,893 | ) | |
Balance at December 31, 2014 | 28,885 | ||
Addition to redeemable noncontrolling interest | 9,409 | ||
Net income attributable to redeemable noncontrolling interest | 1,371 | ||
Adjustment of the redeemable noncontrolling interest to fair value | 2,349 | ||
Effect of foreign currency translation attributable to redeemable noncontrolling interest | (3,390 | ) | |
Balance at December 31, 2015 | 38,624 | ||
Addition to redeemable noncontrolling interest | 826 | ||
Redemption of redeemable noncontrolling interest | (3,562 | ) | |
Net loss attributable to redeemable noncontrolling interest | (47,831 | ) | |
Adjustment of the redeemable noncontrolling interest to fair value | 74,194 | ||
Effect of foreign currency translation attributable to redeemable noncontrolling interest | (16,496 | ) | |
Balance at December 31, 2016 | $ | 45,755 | |
Financial Instruments Not Required To Be Carried At Fair Value
Investment in Receivable Portfolios:
The Company records its investment in receivable portfolios at cost, which represents a significant discount from the contractual receivable balances due. The Company computes the fair value of its investment in receivable portfolios using
F-16
Level 3 inputs by discounting the estimated future cash flows generated by its proprietary forecasting models. The key inputs include the estimated future gross cash flow, average cost to collect, and discount rate. In accordance with authoritative guidance related to fair value measurements, the Company estimates the average cost to collect and discount rates based on its estimate of what a market participant might use in valuing these portfolios. The determination of such inputs requires significant judgment, including assessing the assumed market participant’s cost structure, its determination of whether to include fixed costs in its valuation, its collection strategies, and determining the appropriate weighted average cost of capital. The Company evaluates the use of these key inputs on an ongoing basis and refines the data as it continues to obtain better information from market participants in the debt recovery and purchasing business.
In the Company’s current analysis, the estimated blended market participant cost to collect and discount rate is approximately 50.3% and 10.5%, respectively, for U.S. portfolios, approximately 29.9% and 12.0%, respectively, for Europe portfolios and approximately 32.8% and 11.0%, respectively for other geographies. Using this method, the fair value of investment in receivable portfolios was approximately $2,446.6 million and $2,473.8 million as of December 31, 2016 and 2015, respectively, as compared to the carrying value of $2,382.8 million and $2,440.7 million as of December 31, 2016 and 2015, respectively. A 100 basis point fluctuation in the cost to collect and discount rate used would result in an increase or decrease in the fair value of U.S., European and other geographies portfolios by approximately $43.8 million, $52.0 million and $6.4 million, respectively, as of December 31, 2016. This fair value calculation does not represent, and should not be construed to represent, the underlying value of the Company or the amount which could be realized if its investment in receivable portfolios were sold.
Deferred Court Costs:
The Company capitalizes deferred court costs and provides a reserve for those costs that it believes will ultimately be uncollectible. The carrying value of net deferred court costs approximates fair value.
Debt:
The majority of Encore and its subsidiaries’ borrowings are carried at historical amounts, adjusted for additional borrowings less principal repayments, which approximate fair value. These borrowings include Encore’s senior secured notes and borrowings under its revolving credit and term loan facilities, Cabot’s senior secured notes and borrowings under its revolving credit facility, and other borrowing under revolving credit facilities at certain of the Company’s other subsidiaries.
Encore’s convertible senior notes are carried at historical cost, adjusted for the debt discount. The carrying value of the convertible senior notes was $416.5 million and $406.6 million, as of December 31, 2016 and 2015, respectively. The fair value estimate for these convertible senior notes, which incorporates quoted market prices using Level 2 inputs, was approximately $431.7 million and $372.2 million as of December 31, 2016 and 2015, respectively.
Cabot’s senior secured notes are carried at historical cost, adjusted for debt discount and debt premium. The carrying value of Cabot’s senior secured notes was $1,295.7 million and $1,144.2 million, as of December 31, 2016 and 2015, respectively. The fair value estimate for these senior notes, which incorporates quoted market prices using Level 2 inputs, was $1,312.7 million and $1,403.5 million as of December 31, 2016 and 2015, respectively.
The Company’s preferred equity certificates are legal obligations to the noncontrolling shareholders of certain subsidiaries. They are carried at the face amount, plus any accrued interest. The Company determined that the carrying value of these preferred equity certificates approximated fair value as of December 31, 2016 and 2015.
Note 5: Derivatives and Hedging Instruments
The Company may periodically enter into derivative financial instruments to manage risks related to interest rates and foreign currency. Certain of the Company’s derivative financial instruments qualify for hedge accounting treatment under the authoritative guidance for derivatives and hedging.
F-17
The following table summarizes the fair value of derivative instruments as recorded in the Company’s consolidated statements of financial condition (in thousands):
December 31, 2016 | December 31, 2015 | ||||||||||
Balance Sheet Location | Fair Value | Balance Sheet Location | Fair Value | ||||||||
Derivatives designated as hedging instruments: | |||||||||||
Foreign currency exchange contracts | Other assets | $ | 707 | Other assets | $ | 718 | |||||
Foreign currency exchange contracts | Other liabilities | (51 | ) | Other liabilities | (601 | ) | |||||
Interest rate swap agreements | Other liabilities | (131 | ) | Other liabilities | — | ||||||
Derivatives not designated as hedging instruments: | |||||||||||
Foreign currency exchange contracts | Other assets | 415 | Other assets | — | |||||||
Foreign currency exchange contracts | Other liabilities | (1,309 | ) | Other liabilities | — | ||||||
Interest rate swap agreements | Other liabilities | — | Other liabilities | (352 | ) | ||||||
Derivatives Designated as Hedging Instruments
The Company has operations in foreign countries, which expose the Company to foreign currency exchange rate fluctuations due to transactions denominated in foreign currencies. To mitigate a portion of this risk, the Company enters into derivative financial instruments, principally foreign currency forward contracts with financial counterparties. The Company adjusts the level and use of derivatives as soon as practicable after learning that an exposure has changed and reviews all exposures and derivative positions on an ongoing basis.
Certain of the foreign currency forward contracts are designated as cash flow hedging instruments and qualify for hedge accounting treatment. Gains and losses arising from the effective portion of such contracts are recorded as a component of accumulated other comprehensive income (“OCI”) as gains and losses on derivative instruments, net of income taxes. The hedging gains and losses in OCI are subsequently reclassified into earnings in the same period in which the underlying transactions affect the Company’s earnings. If all or a portion of the forecasted transaction is cancelled, this would render all or a portion of the cash flow hedge ineffective and the Company would reclassify the ineffective portion of the hedge into earnings. The Company generally does not experience ineffectiveness of the hedge relationship and the accompanying consolidated financial statements do not include any such gains or losses.
As of December 31, 2016, the total notional amount of the forward contracts that are designated as cash flow hedging instruments was $29.4 million. All of these outstanding contracts qualified for hedge accounting treatment. The Company estimates that approximately $0.2 million of net derivative gain included in OCI will be reclassified into earnings within the next 12 months. No gains or losses were reclassified from OCI into earnings as a result of forecasted transactions that failed to occur during the years ended December 31, 2016, 2015, or 2014.
The Company may periodically enter into interest rate swap agreements, to reduce its exposure to fluctuations in interest rates on variable interest rate debt and their impact on earnings and cash flows. As of December 31, 2016, Baycorp had one interest rate swap agreement outstanding with a total notional amount of $17.5 million Australian dollars (approximately $12.6 million U.S. dollars). The interest rate swap instrument is designated as cash flow hedge and accounted for using hedge accounting.
F-18
The following table summarizes the effects of derivatives in cash flow hedging relationships designated as hedging instruments on the Company’s consolidated statements of income for the years ended December 31, 2016 and 2015 (in thousands):
Gain or (Loss) Recognized in OCI- Effective Portion | Location of Gain or (Loss) Reclassified from OCI into Income - Effective Portion | Gain or (Loss) Reclassified from OCI into Income - Effective Portion | Location of Gain or (Loss) Recognized - Ineffective Portion and Amount Excluded from Effectiveness Testing | Amount of Gain or (Loss) Recognized - Ineffective Portion and Amount Excluded from Effectiveness Testing | |||||||||||||||||||||||
2016 | 2015 | 2016 | 2015 | 2016 | 2015 | ||||||||||||||||||||||
Foreign currency exchange contracts | $ | 1,404 | $ | (248 | ) | Salaries and employee benefits | $ | 755 | $ | (472 | ) | Other (expense) income | $ | — | $ | — | |||||||||||
Foreign currency exchange contracts | (5 | ) | 88 | General and administrative expenses | 105 | (74 | ) | Other (expense) income | — | — | |||||||||||||||||
Interest rate swap agreements | (131 | ) | — | Interest expense | — | — | Other (expense) income | — | — | ||||||||||||||||||
Derivatives Not Designated as Hedging Instruments
In 2016, Encore and its Cabot subsidiary collectively began entering into currency exchange forward contracts to reduce the effects of currency exchange rate fluctuations between the British Pound and Euro. These derivative contracts generally mature within one to three months and are not designated as hedge instruments for accounting purposes. The Company continues to monitor the level of exposure of the foreign currency exchange risk and may enter into additional short-term forward contracts on an ongoing basis. The gains or losses on these derivative contracts are recognized in other income or expense based on the changes in fair value. Before the effect of income tax and noncontrolling interest, the net gain on these derivative contracts recognized in the Company’s consolidated statements of income was $8.2 million and zero during the years ended December 31, 2016 and 2015, respectively.
The following table summarizes the effects of derivatives in cash flow hedging relationships not designated as hedging instruments on the Company’s consolidated statements of income for the years ended December 31, 2016 and 2015 (in thousands):
Derivatives Not Designated as Hedging Instruments | Location of Gain or (Loss) Recognized in income on Derivative | Amount of Gain or (Loss) Recognized in Income on Derivative | ||||||||
2016 | 2015 | |||||||||
Foreign currency exchange contracts(1) | Other income (expense) | $ | 8,248 | $ | — | |||||
Interest rate swap agreements | Interest expense | 144 | 92 | |||||||
________________________
(1) | After the effect of income tax and noncontrolling interest, the net impact of the derivative contracts to consolidated net income from continuing income attributable to Encore was a gain of $1.3 million and zero during the years ended December 31, 2016 and 2015, respectively. |
Note 6: Investment in Receivable Portfolios, Net
In accordance with the authoritative guidance for loans and debt securities acquired with deteriorated credit quality, discrete receivable portfolio purchases during the same fiscal quarter are aggregated into pools based on common risk characteristics. Common risk characteristics include risk ratings (e.g. FICO or similar scores), financial asset type, collateral type, size, interest rate, date of origination, term, and geographic location. The Company’s static pools are typically grouped into credit card, purchased consumer bankruptcy, and mortgage portfolios. The Company further groups these static pools by geographic region or location. Portfolios acquired in business combinations are also grouped into these pools. During any fiscal quarter in which the Company has an acquisition of an entity that has portfolio, the entire historical portfolio of the acquired company is aggregated into the pool groups for that quarter, based on common characteristics, resulting in pools for that quarter
F-19
that may consist of several different vintages of portfolio. Once a static pool is established, the portfolios are permanently assigned to the pool. The discount (i.e., the difference between the cost of each static pool and the related aggregate contractual receivable balance) is not recorded because the Company expects to collect a relatively small percentage of each static pool’s contractual receivable balance. As a result, receivable portfolios are recorded at cost at the time of acquisition. The purchase cost of the portfolios includes certain fees paid to third parties incurred in connection with the direct acquisition of the receivable portfolios.
In compliance with the authoritative guidance, the Company accounts for its investments in receivable portfolios using either the interest method or the cost recovery method. The interest method applies an IRR to the cost basis of the pool, which remains unchanged throughout the life of the pool, unless there is an increase in subsequent expected cash flows. Subsequent increases in expected cash flows are recognized prospectively through an upward adjustment of the pool’s IRR over its remaining life. Subsequent decreases in expected cash flows do not change the IRR, but are recognized as an allowance to the cost basis of the pool, and are reflected in the consolidated statements of income as a reduction in revenue, with a corresponding valuation allowance, offsetting the investment in receivable portfolios in the consolidated statements of financial condition. With gross collections being discounted at monthly IRRs, when collections are lower in the near term, even if substantially higher collections are expected later in the collection curve, an allowance charge could result.
The Company utilizes its proprietary forecasting models to continuously evaluate the economic life of each pool. During the quarter ended September 30, 2016, the Company revised the forecasting methodology it uses to value and calculate IRRs on certain portfolios in Europe by extending the collection forecast from 120 months to 180 months. This change was made as a result of (1) the Company having observed that older portfolios in Europe have consistently experienced cash collections beyond 120 months, (2) an expectation that regulatory changes in the United Kingdom resulting in a reduction in the number of highly discounted near term one-time settlements, an increase in the number of payment plans, and an increase in the length of existing payment plans will cause a lengthening of the collections curve, (3) an expectation that, as a result of a higher percentage of semi-performing account purchases in the United Kingdom in recent years, newer vintages will have a larger percentage of collections after 120 months and (4) the Company’s increased confidence in its ability to forecast future cash collections to 180 months. The increase in the collection forecast 120 months to 180 months was applied effective July 1, 2016 to certain portfolios in Europe for which the Company could accurately forecast through such term. In addition, during the three months ended September 30, 2016, the Company recorded allowance charges of approximately $94.0 million resulting from delays or shortfalls in near term collections against the forecasts for certain pools in Europe. These changes in forecasted future cash flows resulted in an increase in the aggregate total estimated remaining collections for the receivable portfolios of approximately $296.5 million as of September 30, 2016. The increase in the collection forecast from 120 months to 180 months had the effect of reducing the allowance charges by approximately $13.2 million. For portfolios in Europe that were not extended to 180 months, the Company will continue to include collection forecasts to 120 months in calculating accretion revenue and in its estimated remaining collection disclosures. In the United States, the Company will continue to include collection forecasts to 120 months in calculating accretion revenue. Expected collections beyond the 120 month collection forecast in the United States are included in its estimated remaining collection disclosures but are not included in the calculation of accretion revenue.
The Company accounts for each static pool as a unit for the economic life of the pool (similar to one loan) for recognition of revenue from receivable portfolios, for collections applied to the cost basis of receivable portfolios, and for provision for loss or allowance. Revenue from receivable portfolios is accrued based on each pool’s IRR applied to each pool’s adjusted cost basis. The cost basis of each pool is increased by revenue earned and portfolio allowance reversals and decreased by gross collections and portfolio allowances.
If the amount and timing of future cash collections on a pool of receivables are not reasonably estimable, the Company accounts for such portfolios on the cost recovery method as Cost Recovery Portfolios. The accounts in these portfolios have different risk characteristics than those included in other portfolios acquired during the same quarter, or the necessary information was not available to estimate future cash flows and, accordingly, they were not aggregated with other portfolios. Under the cost recovery method of accounting, no revenue is recognized until the carrying value of a Cost Recovery Portfolio has been fully recovered.
Accretable yield represents the amount of revenue the Company expects to generate over the remaining life of its existing investment in receivable portfolios based on estimated future cash flows. Total accretable yield is the difference between future estimated collections and the current carrying value of a portfolio. All estimated cash flows on portfolios where the cost basis has been fully recovered are classified as zero basis cash flows.
F-20
The following table summarizes the Company’s accretable yield and an estimate of zero basis future cash flows at the beginning and end of the period presented (in thousands):
Accretable Yield | Estimate of Zero Basis Cash Flows | Total | |||||||||
Balance at December 31, 2014 | $ | 2,993,321 | $ | 66,392 | $ | 3,059,713 | |||||
Revenue recognized, net | (964,225 | ) | (108,211 | ) | (1,072,436 | ) | |||||
Net additions on existing portfolios | 263,713 | 266,252 | 529,965 | ||||||||
Additions for current purchases, net | 846,632 | — | 846,632 | ||||||||
Effect of foreign currency translation | (91,801 | ) | (1,402 | ) | (93,203 | ) | |||||
Balance at December 31, 2015 | 3,047,640 | 223,031 | 3,270,671 | ||||||||
Revenue recognized, net | (801,736 | ) | (144,879 | ) | (946,615 | ) | |||||
Net additions on existing portfolios | 441,632 | 287,116 | 728,748 | ||||||||
Additions for current purchases, net | 861,698 | — | 861,698 | ||||||||
Effect of foreign currency translation | (457,230 | ) | 236 | (456,994 | ) | ||||||
Balance at December 31, 2016 | $ | 3,092,004 | $ | 365,504 | $ | 3,457,508 | |||||
During the year ended December 31, 2016, the Company purchased receivable portfolios with a face value of $9.8 billion for $0.9 billion, or a purchase cost of 9.2% of face value. The estimated future collections at acquisition for all portfolios purchased during the year amounted to $1.7 billion.
During the year ended December 31, 2015, the Company purchased receivable portfolios with a face value of $12.7 billion for $1.0 billion, or a purchase cost of 8.0% of face value. Purchases of charged-off credit card portfolios include $216.0 million of receivables acquired in connection with the dlc Acquisition and $60.3 million acquired in connection with the acquisition of Baycorp. The estimated future collections at acquisition for all portfolios purchased during the year amounted to $1.8 billion.
All collections realized after the net book value of a portfolio has been fully recovered (“Zero Basis Portfolios”) are recorded as revenue (“Zero Basis Revenue”). During the years ended December 31, 2016, 2015, and 2014, Zero Basis Revenue was approximately $138.1 million, $96.4 million, and $22.3 million, respectively.
The following tables summarize the changes in the balance of the investment in receivable portfolios during the following periods (in thousands, except percentages):
Year Ended December 31, 2016 | |||||||||||||||
Accrual Basis Portfolios | Cost Recovery Portfolios | Zero Basis Portfolios | Total | ||||||||||||
Balance, beginning of period | $ | 2,436,054 | $ | 4,615 | $ | — | $ | 2,440,669 | |||||||
Purchases of receivable portfolios | 906,719 | — | — | 906,719 | |||||||||||
Transfer of portfolios | (13,076 | ) | 13,076 | — | — | ||||||||||
Gross collections(1) | (1,538,663 | ) | (2,102 | ) | (144,839 | ) | (1,685,604 | ) | |||||||
Put-backs and Recalls(2) | (27,561 | ) | (1,019 | ) | (33 | ) | (28,613 | ) | |||||||
Foreign currency adjustments | (196,842 | ) | (127 | ) | (8 | ) | (196,977 | ) | |||||||
Revenue recognized | 892,732 | — | 138,060 | 1,030,792 | |||||||||||
Portfolio (allowance) reversals, net | (90,997 | ) | — | 6,820 | (84,177 | ) | |||||||||
Balance, end of period | $ | 2,368,366 | $ | 14,443 | $ | — | $ | 2,382,809 | |||||||
Revenue as a percentage of collections(3) | 58.0 | % | 0.0 | % | 95.3 | % | 61.2 | % | |||||||
________________________
(1) | Does not include amounts collected on behalf of others. |
(2) | Put-backs represent accounts that are returned to the seller in accordance with the respective purchase agreement (“Put-Backs”). Recalls represent accounts that are recalled by the seller in accordance with the respective purchase agreement (“Recalls”). |
(3) | Revenue as a percentage of collections excludes the effects of net portfolio allowances or net portfolio allowance reversals. |
F-21
Year Ended December 31, 2015 | |||||||||||||||
Accrual Basis Portfolios | Cost Recovery Portfolios | Zero Basis Portfolios | Total | ||||||||||||
Balance, beginning of period | $ | 2,131,084 | $ | 12,476 | $ | — | $ | 2,143,560 | |||||||
Purchases of receivable portfolios | 1,023,722 | — | — | 1,023,722 | |||||||||||
Gross collections(1) | (1,587,525 | ) | (5,237 | ) | (107,963 | ) | (1,700,725 | ) | |||||||
Put-backs and Recalls(2) | (13,009 | ) | (20 | ) | (268 | ) | (13,297 | ) | |||||||
Foreign currency adjustments | (82,443 | ) | (2,604 | ) | 20 | (85,027 | ) | ||||||||
Revenue recognized | 969,227 | — | 96,446 | 1,065,673 | |||||||||||
Portfolio (allowance) reversals, net | (5,002 | ) | — | 11,765 | 6,763 | ||||||||||
Balance, end of period | $ | 2,436,054 | $ | 4,615 | $ | — | $ | 2,440,669 | |||||||
Revenue as a percentage of collections(3) | 61.1 | % | 0.0 | % | 89.3 | % | 62.7 | % | |||||||
Year Ended December 31, 2014 | |||||||||||||||
Accrual Basis Portfolios | Cost Recovery Portfolios | Zero Basis Portfolios | Total | ||||||||||||
Balance, beginning of period | $ | 1,585,587 | $ | 4,662 | $ | — | $ | 1,590,249 | |||||||
Purchases of receivable portfolios | 1,249,651 | 1,709 | — | 1,251,360 | |||||||||||
Transfer of portfolios | (18,682 | ) | 18,682 | — | — | ||||||||||
Gross collections(1) | (1,563,996 | ) | (9,010 | ) | (34,491 | ) | (1,607,497 | ) | |||||||
Put-backs and Recalls(2) | (15,164 | ) | (536 | ) | (9 | ) | (15,709 | ) | |||||||
Foreign currency adjustments | (64,644 | ) | (3,031 | ) | — | (67,675 | ) | ||||||||
Revenue recognized | 953,154 | — | 22,271 | 975,425 | |||||||||||
Portfolio allowance reversals, net | 5,178 | — | 12,229 | 17,407 | |||||||||||
Balance, end of period | $ | 2,131,084 | $ | 12,476 | $ | — | $ | 2,143,560 | |||||||
Revenue as a percentage of collections(3) | 60.9 | % | 0.0 | % | 64.6 | % | 60.7 | % | |||||||
________________________
(1) | Does not include amounts collected on behalf of others. |
(2) | Put-backs represent accounts that are returned to the seller in accordance with the respective purchase agreement (“Put-Backs”). Recalls represent accounts that are recalled by the seller in accordance with the respective purchase agreement (“Recalls”). |
(3) | Revenue as a percentage of collections excludes the effects of net portfolio allowances or net portfolio allowance reversals. |
The following table summarizes the change in the valuation allowance for investment in receivable portfolios during the periods presented (in thousands):
Valuation Allowance | |||
Balance at December 31, 2013 | $ | 93,080 | |
Reversal of prior allowances | (17,407 | ) | |
Balance at December 31, 2014 | 75,673 | ||
Provision for portfolio allowances | 8,322 | ||
Reversal of prior allowances | (15,085 | ) | |
Allowance charged off to investment in receivable portfolios | (8,322 | ) | |
Balance at December 31, 2015 | 60,588 | ||
Provision for portfolio allowances | 94,011 | ||
Reversal of prior allowances | (9,834 | ) | |
Balance at December 31, 2016 | $ | 144,765 | |
Note 7: Deferred Court Costs, Net
The Company pursues legal collections using a network of attorneys that specialize in collection matters and through its internal legal channel. The Company generally pursues collections through legal means only when it believes a consumer has
F-22
sufficient assets to repay their indebtedness but has, to date, been unwilling to pay. In order to pursue legal collections the Company is required to pay certain upfront costs to the applicable courts that are recoverable from the consumer (“Deferred Court Costs”).
The Company capitalizes Deferred Court Costs in its consolidated financial statements and provides a reserve for those costs that it believes will ultimately be uncollectible. The Company determines the reserve based on an estimated court cost recovery rate established based on its analysis of historical court costs recovery data. Based on recent trends of historical court costs recovery data, the Company noted a decrease in the estimated court cost recovery rate in the United Kingdom. Based on the revised estimated court cost recovery rate, the Company recorded an additional court costs reserve of approximately $11.3 million during the three months ended September 30, 2016. The Company estimates deferral periods for Deferred Court Costs based on jurisdiction and nature of litigation and writes off any Deferred Court Costs not recovered within the respective deferral period. Collections received from debtors are first applied against related court costs with the balance applied to the debtors’ account balance.
Deferred Court Costs for the deferral period consist of the following as of the dates presented (in thousands):
December 31, 2016 | December 31, 2015 | ||||||
Court costs advanced | $ | 654,356 | $ | 636,922 | |||
Court costs recovered | (261,243 | ) | (242,899 | ) | |||
Court costs reserve | (327,926 | ) | (318,784 | ) | |||
Deferred court costs | $ | 65,187 | $ | 75,239 | |||
A roll forward of the Company’s court cost reserve is as follows (in thousands):
December 31, 2016 | December 31, 2015 | December 31, 2014 | |||||||||
Balance at beginning of period | $ | (318,784 | ) | $ | (279,572 | ) | $ | (210,889 | ) | ||
Provision for court costs | (67,850 | ) | (82,593 | ) | (69,062 | ) | |||||
Net down of reserve after deferral period | 53,527 | 42,745 | — | ||||||||
Effect of foreign currency translation | 5,181 | 636 | 379 | ||||||||
Balance at end of period | $ | (327,926 | ) | $ | (318,784 | ) | $ | (279,572 | ) | ||
Note 8: Property and Equipment, Net
Property and equipment consist of the following, as of the dates presented (in thousands):
December 31, 2016 | December 31, 2015 | ||||||
Furniture, fixtures and equipment | $ | 19,230 | $ | 21,754 | |||
Computer equipment and software | 138,232 | 125,967 | |||||
Telecommunications equipment | 4,442 | 4,030 | |||||
Leasehold improvements | 17,493 | 19,058 | |||||
Other | 1,923 | 1,693 | |||||
181,320 | 172,502 | ||||||
Less: accumulated depreciation and amortization | (109,063 | ) | (99,956 | ) | |||
$ | 72,257 | $ | 72,546 | ||||
Depreciation and amortization expense for continuing operations was $27.7 million, $28.5 million, and $23.9 million for the years ended December 31, 2016, 2015, and 2014, respectively.
F-23
Note 9: Other Assets
Other assets consist of the following (in thousands):
December 31, 2016 | December 31, 2015 | ||||||
Deferred tax assets | $ | 51,077 | $ | 12,695 | |||
Identifiable intangible assets, net | 28,243 | 15,712 | |||||
Assets held for sale | 21,147 | 911 | |||||
Other financial receivables | 18,732 | 11,275 | |||||
Prepaid expenses | 18,036 | 21,872 | |||||
Service fee receivables | 15,156 | 13,708 | |||||
Receivable from seller | 5,388 | 8,605 | |||||
Security deposits | 2,781 | 2,368 | |||||
Derivative instruments | 1,122 | 718 | |||||
Prepaid income taxes | 649 | 25,839 | |||||
Other | 53,116 | 35,059 | |||||
Total | $ | 215,447 | $ | 148,762 | |||
Note 10: Debt
The Company is in compliance with all covenants under its financing arrangements. The components of the Company’s consolidated debt and capital lease obligations were as follows (in thousands):
December 31, 2016 | December 31, 2015 | ||||||
Encore revolving credit facility | $ | 578,000 | $ | 627,000 | |||
Encore term loan facility | 164,615 | 143,078 | |||||
Encore senior secured notes | 11,320 | 28,750 | |||||
Encore convertible notes | 448,500 | 448,500 | |||||
Less: Debt discount | (31,968 | ) | (41,867 | ) | |||
Cabot senior secured notes | 1,280,241 | 1,360,000 | |||||
Add: Debt premium | 17,686 | 53,440 | |||||
Less: Debt discount | (2,200 | ) | (3,184 | ) | |||
Cabot senior revolving credit facility | 33,218 | 54,089 | |||||
Preferred equity certificates | 205,975 | 221,516 | |||||
Other credit facilities | 74,551 | 49,895 | |||||
Other | 62,608 | 33,447 | |||||
Capital lease obligations | 5,091 | 11,054 | |||||
2,847,637 | 2,985,718 | ||||||
Less: debt issuance costs, net of amortization | (41,654 | ) | (41,655 | ) | |||
Total | $ | 2,805,983 | $ | 2,944,063 | |||
F-24
Encore Revolving Credit Facility and Term Loan Facility
On December 20, 2016, the Company amended its revolving credit facility and term loan facility pursuant to a Third Amended and Restated Credit Agreement (the “Restated Credit Agreement”). The Restated Credit Agreement includes a revolving credit facility of $781.7 million (the “Revolving Credit Facility”), a term loan facility of $166.4 million (the “Term Loan Facility”, and together with the Revolving Credit Facility, the “Senior Secured Credit Facilities”), and an accordion feature that allows the Company to increase the Senior Secured Credit Facilities by an additional $250.0 million. Including the accordion feature, the maximum amount that can be borrowed under the Restated Credit Agreement is approximately $1.2 billion. The Senior Secured Credit Facilities have a five year maturity expiring in December 2021, except with respect to (1) revolving commitments under the Revolving Credit Facility of $32.1 million and $207.8 million expiring in November 2017 and February 2019, respectively, and (2) three subtranches of the Term Loan Facility of $50.6 million, $4.9 million and $22.6 million, expiring in February 2017, November 2017 and February 2019, respectively.
Provisions of the Restated Credit Agreement include, but are not limited to:
• | Revolving Credit Facility commitments of (1) $541.8 million that expire in December 2021, (2) $207.8 million that expire in February 2019 and (3) $32.1 million that expire in November 2017, in each case with interest at a floating rate equal to, at the Company’s option, either: (a) reserve adjusted London Interbank Offered Rate (“LIBOR”), plus a spread that ranges from 250 to 300 basis points depending on the cash flow leverage ratio of Encore and its restricted subsidiaries; or (b) alternate base rate, plus a spread that ranges from 150 to 200 basis points, depending on the cash flow leverage ratio of Encore and its restricted subsidiaries. “Alternate base rate,” as defined in the Restated Credit Agreement, means the highest of (i) the per annum rate which the administrative agent publicly announces from time to time as its prime lending rate, (ii) the federal funds effective rate from time to time, plus 0.5% per annum, (iii) reserved adjusted LIBOR determined on a daily basis for a one month interest period, plus 1.0% per annum and (iv) zero; |
• | An $88.3 million term loan maturing in December 2021, with interest at a floating rate equal to, at the Company’s option, either: (1) reserve adjusted LIBOR, plus a spread that ranges from 250 to 300 basis points, depending on the cash flow leverage ratio of Encore and its restricted subsidiaries; or (2) alternate base rate, plus a spread that ranges from 150 to 200 basis points, depending on the cash flow leverage ratio of Encore and its restricted subsidiaries. Principal amortizes $4.4 million in each of 2017 and 2018, $6.6 million in each of 2019 and 2020, and $8.8 million in 2021 with the remaining principal due at the end of the term; |
• | A $22.6 million term loan maturing in February 2019, with interest at a floating rate equal to, at the Company’s option, either: (1) reserve adjusted LIBOR, plus a spread that ranges from 250 to 300 basis points, depending on the cash flow leverage ratio of Encore and its restricted subsidiaries; or (2) alternate base rate, plus a spread that ranges from 150 to 200 basis points, depending on the cash flow leverage ratio of Encore and its restricted subsidiaries. Principal amortizes $4.4 million in each of 2017 and 2018 with the remaining principal due at the end of the term; |
• | A $4.9 million term loan maturing in November 2017, with interest at a floating rate equal to, at the Company’s option, either: (1) reserve adjusted LIBOR, plus a spread that ranges from 250 to 300 basis points, depending on the cash flow leverage ratio of Encore and its restricted subsidiaries; or (2) alternate base rate, plus a spread that ranges from 150 to 200 basis points, depending on the cash flow leverage ratio of Encore and its restricted subsidiaries. Principal amortizes $0.5 million in 2017 with the remaining principal due at the end of the term; |
• | A $50.6 million term loan maturing in February 2017, with interest at a floating rate equal to, at the Company’s option, either: (1) reserve adjusted LIBOR, plus a spread that ranges from 200 to 250 basis points, depending on the cash flow leverage ratio of Encore and its restricted subsidiaries; or (2) alternate base rate, plus a spread that ranges from 100 to 150 basis points, depending on the cash flow leverage ratio of Encore and its restricted subsidiaries; |
• | A borrowing base under the Revolving Credit Facility equal to 35% of all eligible non-bankruptcy estimated remaining collections plus 55% of eligible estimated remaining collections for consumer receivables subject to bankruptcy; |
• | A maximum cash flow leverage ratio permitted of 3.00:1.00; |
• | A maximum cash flow first-lien leverage ratio of 2.00:1.00; |
• | The allowance of indebtedness in the form of senior secured notes not to exceed $150.0 million; |
• | The allowance of additional unsecured or subordinated indebtedness not to exceed $1.1 billion, including junior lien indebtedness not to exceed $400.0 million; |
F-25
• | Restrictions and covenants, which limit the payment of dividends and the incurrence of additional indebtedness and liens, among other limitations; |
• | Repurchases of up to $150.0 million of Encore’s common stock after July 9, 2015, subject to compliance with certain covenants and available borrowing capacity; |
• | A change of control definition, that excludes acquisitions of stock by Red Mountain Capital Partners LLC, JCF FPK I, LP and their respective affiliates of up to 50% of the outstanding shares of Encore’s voting stock; |
• | Events of default which, upon occurrence, may permit the lenders to terminate the facility and declare all amounts outstanding to be immediately due and payable; |
• | A pre-approved acquisition limit of $225.0 million per fiscal year; |
• | A basket to allow for investments not to exceed the greater of (1) 200% of the consolidated net worth of Encore and its restricted subsidiaries; and (2) an unlimited amount such that after giving effect to the making of any investment, the cash flow leverage ratio is less than 1.25:1:00; |
• | A basket to allow for investments in persons organized under the laws of Canada in the amount of $50.0 million; |
• | A requirement that Encore and its restricted subsidiaries, for the four-month period ending February 2019, have sufficient cash or availability under the Revolving Credit Facility (excluding availability under revolving commitments expiring in February 2019) to satisfy any amounts due under the revolving commitments that expire in February 2019 and the sub-tranche of the Term Loan Facility that expires in February 2019; |
• | Collateralization by all assets of the Company, other than the assets of certain foreign subsidiaries and all unrestricted subsidiaries as defined in the Restated Credit Agreement. |
At December 31, 2016, the outstanding balance under the Restated Credit Agreement was $742.6 million, which bore a weighted average interest rate of 3.56% and 3.17% for the years ended December 31, 2016 and 2015, respectively. Available capacity under the Restated Credit Agreement, subject to borrowing base and applicable debt covenants, was $203.7 million as of December 31, 2016.
Encore Senior Secured Notes
In 2010 and 2011 Encore entered into an aggregate of $75.0 million in senior secured notes with certain affiliates of Prudential Capital Group (the “Senior Secured Notes”). $25.0 million of the Senior Secured Notes bear an annual interest rate of 7.375%, mature in 2018 and require quarterly principal payments of $1.25 million. Prior to May 2013, these notes required quarterly payments of interest only. The remaining $50.0 million of Senior Secured Notes bear an annual interest rate of 7.75%, mature in 2017 and require quarterly principal payments of $2.5 million. Prior to December 2012 these notes required quarterly interest only payments. As of December 31, 2016, $5.1 million of the 7.375% Senior Secured Notes and $6.2 million of the 7.75% Senior Secured Notes, for an aggregate of $11.3 million, remained outstanding.
The Senior Secured Notes are guaranteed in full by certain of Encore’s subsidiaries. The Senior Secured Notes are pari passu with, and are collateralized by the same collateral as the Senior Secured Credit Facilities. The Senior Secured Notes may be accelerated and become automatically and immediately due and payable upon certain events of default, including certain events related to insolvency, bankruptcy, or liquidation. Additionally, the Senior Secured Notes may be accelerated at the election of the holder or holders of a majority in principal amount of the Senior Secured Notes upon certain events of default by Encore, including the breach of affirmative covenants regarding guarantors, collateral, most favored lender treatment, minimum revolving credit facility commitment or the breach of any negative covenant. If Encore prepays the Senior Secured Notes at any time for any reason, payment will be at the higher of par or the present value of the remaining scheduled payments of principal and interest on the portion being prepaid. The discount rate used to determine the present value is 50 basis points over the then current Treasury Rate corresponding to the remaining average life of the Senior Secured Notes. The covenants are substantially similar to those in the Restated Credit Agreement. Prudential Capital Group and the administrative agent for the lenders of the Restated Credit Agreement have an intercreditor agreement related to their pro rata rights to the collateral, actionable default, powers and duties and remedies, among other topics. The terms of the purchase agreement for the Senior Secured Notes have been amended in connection with amendments to the Restated Credit Agreement in order to align certain provisions between the two agreements.
Encore Convertible Notes
In November and December 2012, Encore sold $115.0 million aggregate principal amount of 3.0% 2017 Convertible Notes that mature on November 27, 2017 in private placement transactions. In June and July 2013, Encore sold $172.5 million
F-26
aggregate principal amount of 3.0% 2020 Convertible Notes that mature on July 1, 2020 in private placement transactions. In March 2014, Encore sold $161.0 million aggregate principal amount of 2.875% 2021 Convertible Notes that mature on March 15, 2021 in private placement transactions. The interest on these unsecured convertible senior notes (collectively, the “Convertible Notes”), is payable semi-annually.
Prior to the close of business on the business day immediately preceding their respective conversion date (listed below), holders may convert their Convertible Notes under certain circumstances set forth in the applicable Convertible Notes indentures. On or after their respective conversion dates until the close of business on the scheduled trading day immediately preceding their respective maturity date, holders may convert their Convertible Notes at any time. Certain key terms related to the convertible features for each of the Convertible Notes as of year ended December 31, 2016 are listed below.
2017 Convertible Notes | 2020 Convertible Notes | 2021 Convertible Notes | |||||||||
Initial conversion price | $ | 31.56 | $ | 45.72 | $ | 59.39 | |||||
Closing stock price at date of issuance | $ | 25.66 | $ | 33.35 | $ | 47.51 | |||||
Closing stock price date | November 27, 2012 | June 24, 2013 | March 5, 2014 | ||||||||
Conversion rate (shares per $1,000 principal amount) | 31.6832 | 21.8718 | 16.8386 | ||||||||
Conversion date(1) | May 27, 2017 | January 1, 2020 | September 15, 2020 | ||||||||
_______________________
(1) | The 2017 Convertible Notes became convertible on January 2, 2014, as certain early conversion events were satisfied. Refer to “Conversion and Earnings Per Share Impact” section below for further details. |
In the event of conversion, the 2017 Convertible Notes are convertible into cash up to the aggregate principal amount of the notes. The excess conversion premium may be settled in cash or shares of the Company’s common stock at the discretion of the Company. In the event of conversion, holders of the Company’s 2020 and 2021 Convertible Notes will receive cash, shares of the Company’s common stock or a combination of cash and shares of the Company’s common stock, at the Company’s election. The Company’s current intent is to settle conversions through combination settlement (i.e., convertible into cash up to the aggregate principal amount, and shares of the Company’s common stock or a combination of cash and shares of the Company’s common stock, at the Company’s election, for the remainder). As a result, and in accordance with authoritative guidance related to derivatives and hedging and earnings per share, only the conversion spread is included in the diluted earnings per share calculation, if dilutive. Under such method, the settlement of the conversion spread has a dilutive effect when, during any quarter, the average share price of the Company’s common stock exceeds the initial conversion prices listed in the above table.
Authoritative guidance related to debt with conversion and other options requires that issuers of convertible debt instruments that, upon conversion, may be settled fully or partially in cash, must separately account for the liability and equity components in a manner that will reflect the entity’s nonconvertible debt borrowing rate when interest cost is recognized in subsequent periods. Additionally, debt issuance costs are required to be allocated in proportion to the allocation of the liability and equity components and accounted for as debt issuance costs and equity issuance costs, respectively.
The debt and equity components, the issuance costs related to the equity component, the stated interest rate, and the effective interest rate for each of the Convertible Notes are listed below (in thousands, except percentages):
2017 Convertible Notes | 2020 Convertible Notes | 2021 Convertible Notes | |||||||||
Debt component | $ | 100,298 | $ | 140,247 | $ | 143,645 | |||||
Equity component | $ | 14,702 | $ | 32,253 | $ | 17,355 | |||||
Equity issuance cost | $ | 788 | $ | 1,106 | $ | 581 | |||||
Stated interest rate | 3.000 | % | 3.000 | % | 2.875 | % | |||||
Effective interest rate | 6.000 | % | 6.350 | % | 4.700 | % | |||||
F-27
The balances of the liability and equity components of all of the Convertible Notes outstanding were as follows (in thousands):
December 31, 2016 | December 31, 2015 | ||||||
Liability component—principal amount | $ | 448,500 | $ | 448,500 | |||
Unamortized debt discount | (31,968 | ) | (41,867 | ) | |||
Liability component—net carrying amount | $ | 416,532 | $ | 406,633 | |||
Equity component | $ | 61,314 | $ | 58,184 | |||
The debt discount is being amortized into interest expense over the remaining life of the convertible notes using the effective interest rates. Interest expense related to the convertible notes was as follows (in thousands):
Year ended December 31, | |||||||
2016 | 2015 | ||||||
Interest expense—stated coupon rate | $ | 13,263 | $ | 13,245 | |||
Interest expense—amortization of debt discount | 9,900 | 9,335 | |||||
Total interest expense—convertible notes | $ | 23,163 | $ | 22,580 | |||
Convertible Notes Hedge Transactions
In order to reduce the risk related to the potential dilution and/or the potential cash payments the Company may be required to make in the event that the market price of the Company’s common stock becomes greater than the conversion prices of the Convertible Notes, the Company maintains a hedge program that increases the effective conversion price for each of the Convertible Notes. All of the hedge instruments related to the Convertible Notes have been determined to be indexed to the Company’s own stock and meet the criteria for equity classification. In accordance with authoritative guidance, the Company recorded the cost of the hedge instruments as a reduction in additional paid-in capital, and will not recognize subsequent changes in fair value of these financial instruments in its consolidated financial statements.
The details of the hedge program for each of the Convertible Notes are listed below (in thousands, except conversion price):
2017 Convertible Notes | 2020 Convertible Notes | 2021 Convertible Notes | |||||||||
Cost of the hedge transaction(s) | $ | 50,595 | $ | 18,113 | $ | 19,545 | |||||
Initial conversion price | $ | 31.56 | $ | 45.72 | $ | 59.39 | |||||
Effective conversion price | $ | 60.00 | $ | 61.55 | $ | 83.14 | |||||
Conversion and Earnings Per Share Impact
During the quarter ending December 31, 2013, the closing price of the Company’s common stock exceeded 130% of the conversion price of the 2017 Convertible Notes for more than 20 trading days during a 30 consecutive trading day period, thereby satisfying one of the early conversion events. As a result, the 2017 Convertible Notes became convertible on demand effective January 2, 2014, and the holders were notified that they could elect to submit their 2017 Convertible Notes for conversion. The carrying value of the 2017 Convertible Notes continues to be reported as debt as the Company intends to draw on the Revolving Credit Facility or use cash on hand to settle the principal amount of any such conversions in cash. No gain or loss was recognized when the debt became convertible. The estimated fair value of the 2017 Convertible Notes was approximately $127.0 million as of December 31, 2016. In addition, upon becoming convertible, a portion of the equity component that was recorded at the time of the issuance of the 2017 Convertible Notes was considered redeemable and that portion of the equity was reclassified to temporary equity in the Company’s consolidated statements of financial condition. Such amount was determined based on the cash consideration to be paid upon conversion and the carrying amount of the debt. Upon conversion, the holders of the 2017 Convertible Notes will be paid in cash for the principal amount. The excess conversion premium may be settled in cash or shares of the Company’s common stock at the discretion of the Company. As a result, the Company reclassified $3.0 million of the equity component to temporary equity as of December 31, 2016. If a conversion event takes place, this temporary equity balance will be recalculated based on the difference between the 2017 Convertible Notes principal and the debt carrying value. If the 2017 Convertible Notes are settled, an amount equal to the fair value of the liability component, immediately prior to the settlement, will be deducted from the fair value of the total settlement
F-28
consideration transferred and allocated to the liability component. Any difference between the amount allocated to the liability and the net carrying amount of the 2017 Convertible Notes (including any unamortized debt issue costs and discount) will be recognized in earnings as a gain or loss on debt extinguishment. Any remaining consideration is allocated to the reacquisition of the equity component and will be recognized as a reduction in stockholders’ equity.
None of the 2017 Convertible Notes have been converted since they became convertible.
Cabot Senior Secured Notes
On September 20, 2012, Cabot Financial (Luxembourg) S.A. (“Cabot Financial”), an indirect subsidiary of Encore, issued £265.0 million (approximately $438.4 million) in aggregate principal amount of 10.375% Senior Secured Notes due 2019 (the “Cabot 2019 Notes”). Interest on the Cabot 2019 Notes is payable semi-annually, in arrears, on April 1 and October 1 of each year. On October 6, 2016, the Cabot 2019 Notes were redeemed in full using the proceeds from the issuance of Senior Secured Notes due 2023 (the “Cabot 2023 Notes”) as discussed below. A call premium of £13.7 million (approximately $17.4 million) was paid in connection with the redemption of the Cabot 2019 Notes. Since the Cabot 2019 Notes carried a premium of approximately £15.2 million (approximately $19.2 million) at the time of redemption, Cabot recognized a gain of approximately £1.4 million (approximately $1.8 million) on this transaction. The gain is included in other income in the Company’s consolidated statements of income for the year ended December 31, 2016.
On August 2, 2013, Cabot Financial issued £100 million (approximately $151.7 million) in aggregate principal amount of 8.375% Senior Secured Notes due 2020 (the “Cabot 2020 Notes”). Interest on the Cabot 2020 Notes is payable semi-annually, in arrears, on February 1 and August 1 of each year.
On March 27, 2014, Cabot Financial issued £175.0 million (approximately $291.8 million) in aggregate principal amount of 6.500% Senior Secured Notes due 2021 (the “Cabot 2021 Notes”). Interest on the Cabot 2021 Notes is payable semi-annually, in arrears, on April 1 and October 1 of each year.
On October 6, 2016, Cabot Financial issued £350.0 million (approximately $442.6 million) in aggregate principal amount of 7.500% Cabot 2023 Notes (together with the Cabot 2019 Notes, the Cabot 2020 Notes and the Cabot 2021 Notes, the “Cabot Notes”). Interest on the Cabot 2023 Notes is payable semi-annually, in arrears, on April 1 and October 1 of each year. The Cabot 2023 Notes were issued at a price equal to 100% of their face value. The proceeds from the offering were used to (1) redeem in full the Cabot 2019 Notes plus a call premium of £13.7 million (approximately $17.4 million), (2) partially repay amounts outstanding under Cabot’s revolving credit facility, (3) pay accrued interest on the Cabot 2019 Notes, and (4) pay fees and expenses in relation to the offering of the Cabot 2023 Notes.
The Cabot Notes are fully and unconditionally guaranteed on a senior secured basis by the following indirect subsidiaries of the Company: Cabot Credit Management Limited (“CCM”), Cabot Financial Limited, and all material subsidiaries of Cabot Financial Limited (other than Cabot Financial and Marlin Intermediate Holdings plc). The Cabot Notes are secured by a first ranking security interest in all the outstanding shares of Cabot Financial and the guarantors (other than CCM and Marlin Midway Limited) and substantially all the assets of Cabot Financial and the guarantors (other than CCM). Subject to the Intercreditor Agreement described below under “Cabot Senior Revolving Credit Facility”, the guarantees provided in respect of the Cabot Notes are pari passu with each such guarantee given in respect of the Cabot Floating Rate Notes, Marlin Bonds and the Cabot Credit Facility described below.
On November 11, 2015, Cabot Financial (Luxembourg) II S.A. (“Cabot Financial II”), an indirect subsidiary of Encore, issued €310.0 million (approximately $332.2 million) in aggregate principal amount of Senior Secured Floating Rate Notes due 2021 (the “Cabot Floating Rate Notes”). The Cabot Floating Rate Notes were issued at a 1%, or €3.1 million (approximately $3.4 million), original issue discount, which is being amortized over the life of the notes and included as interest expense in the Company’s consolidated statements of income. The Cabot Floating Rate Notes bear interest at a rate equal to three-month EURIBOR plus 5.875% per annum, reset quarterly. Interest on the Cabot Floating Rate Notes is payable quarterly in arrears on February 15, May 15, August 15 and November 15 of each year, beginning on February 15, 2016. The Cabot Floating Rate Notes will mature on November 15, 2021.
The Cabot Floating Rate Notes are fully and unconditionally guaranteed on a senior secured basis by the following indirect subsidiaries of the Company: CCM, Cabot Financial Limited and all material subsidiaries of Cabot Financial Limited (other than Cabot Financial II and Marlin Intermediate Holdings plc). The Cabot Floating Rate Notes are secured by a first-ranking security interest in all the outstanding shares of Cabot Financial II and the guarantors (other than CCM and Marlin Midway Limited) and substantially all the assets of Cabot Financial II and the guarantors (other than CCM).
On July 25, 2013, Marlin Intermediate Holdings plc (“Marlin”), an indirect, a subsidiary of Marlin, issued £150.0 million (approximately $246.5 million) in aggregate principal amount of 10.5% Senior Secured Notes due 2020 (the “Marlin Bonds”).
F-29
Interest on the Marlin Bonds is payable semi-annually, in arrears, on February 1 and August 1 of each year. Cabot assumed the Marlin Bonds as a result of the Acquisition of Marlin. The carrying value of the Marlin Bonds was adjusted to approximately $284.2 million to reflect the fair value of the Marlin Bonds at the time of acquisition.
The Marlin Bonds are fully and unconditionally guaranteed on a senior secured basis by Cabot Financial Limited and each of Cabot Financial Limited’s material subsidiaries other than Marlin Intermediate Holdings plc, each of which is an indirect subsidiary of the Company. Subject to the Intercreditor Agreement described below under “-Cabot Senior Revolving Credit Facility”, the guarantees provided in respect of the Marlin Bonds are pari passu with each such guarantee given in respect of the Cabot Notes, the Cabot Floating Rate Notes and the Cabot Credit Facility.
Interest expense related to the Cabot Notes, Cabot Floating Rate Notes, and Marlin Bonds was as follows (in thousands):
Year ended December 31, | |||||||
2016 | 2015 | ||||||
Interest expense—stated coupon rate | $ | 105,606 | $ | 98,988 | |||
Interest income—accretion of debt premium | (8,951 | ) | (10,747 | ) | |||
Interest expense—amortization of debt discount | 620 | 75 | |||||
Total interest expense—Cabot senior secured notes | $ | 97,275 | $ | 88,316 | |||
At December 31, 2016, the outstanding balance on the Cabot Notes, Cabot Floating Rate Notes, and Marlin Bonds was $1.3 billion.
Cabot Senior Revolving Credit Facility
On September 20, 2012, Cabot Financial (UK) Limited (“Cabot Financial UK”) entered into an agreement for a senior committed revolving credit facility of £50.0 million (approximately $82.7 million) (the “Cabot Credit Agreement”). Since such date there have been a number of amendments made, including, but not limited to, increases in the lenders’ total commitments thereunder. On October 6, 2016, Cabot Financial UK amended and restated its existing senior secured revolving credit facility agreement to, among other things, increase the total committed amount of the facility to £250.0 million (approximately $316.2 million), extend the termination date to September 24, 2019 and decrease the interest rate from LIBOR (or EURIBOR for any loan drawn in euro) plus 3.5% to LIBOR (or EURIBOR for any loan drawn in euro) plus 3.25% (as amended and restated, the “Cabot Credit Facility”). The Cabot Credit Facility also includes an uncommitted accordion provision which will allow the facility to be increased by an additional £50.0 million, subject to obtaining the requisite commitments and compliance with the terms of Cabot Financial UK’s other indebtedness, among other conditions precedent.
The Cabot Credit Facility expires in September 2019, and includes the following key provisions:
• | Interest at LIBOR (or EURIBOR for any loan drawn in euro) plus 3.25%; |
• | A restrictive covenant that limits the loan to value ratio to 0.75 in the event that the Cabot Credit Facility is more than 20% utilized; |
• | A restrictive covenant that limits the super senior loan (i.e. the Cabot Credit Facility and any super priority hedging liabilities) to value ratio to 0.25 in the event that the Cabot Credit Facility is more than 20% utilized; |
• | Additional restrictions and covenants which limit, among other things, the payment of dividends and the incurrence of additional indebtedness and liens; and |
• | Events of default which, upon occurrence, may permit the lenders to terminate the Cabot Credit Facility and declare all amounts outstanding to be immediately due and payable. |
The Cabot Credit Facility is unconditionally guaranteed by the following indirect subsidiaries of the Company: CCM, Cabot Financial Limited, and all material subsidiaries of Cabot Financial Limited. The Cabot Credit Facility is secured by first ranking security interests in all the outstanding shares of Cabot Financial UK and the guarantors (other than CCM) and substantially all the assets of Cabot Financial UK and the guarantors (other than CCM). Pursuant to the terms of intercreditor agreements entered into with respect to the relative positions of the Cabot Notes, the Cabot Floating Rate Notes, the Marlin Bonds and the Cabot Credit Facility, any liabilities in respect of obligations under the Cabot Credit Facility that are secured by assets that also secure the Cabot Notes, the Cabot Floating Rate Notes and the Marlin Bonds will receive priority with respect to any proceeds received upon any enforcement action over any such assets.
F-30
At December 31, 2016, the outstanding borrowings under the Cabot Credit Facility were approximately $33.2 million. The weighted average interest rate was 3.95% and 3.86% for the years ended December 31, 2016 and 2015, respectively.
Preferred Equity Certificates
On July 1, 2013, the Company, through its wholly owned subsidiary Encore Europe Holdings, S.a.r.l. (“Encore Europe”), completed the acquisition of Cabot (the “Cabot Acquisition”) by acquiring 50.1% of the equity interest in Janus Holdings S.a.r.l. (“Janus Holdings”). Encore Europe purchased from J.C. Flowers & Co. LLC (“J.C. Flowers”): (i) E Bridge preferred equity certificates issued by Janus Holdings, with a face value of £10,218,574 (approximately $15.5 million) (and any accrued interest thereof) (the “E Bridge PECs”), (ii) E preferred equity certificates issued by Janus Holdings with a face value of £96,729,661 (approximately $147.1 million) (and any accrued interest thereof) (the “E PECs”), (iii) 3,498,563 E shares of Janus Holdings (the “E Shares”), and (iv) 100 A shares of Cabot Holdings S.a.r.l. (“Cabot Holdings”), the direct subsidiary of Janus Holdings, for an aggregate purchase price of approximately £115.1 million (approximately $175.0 million). The E Bridge PECs, E PECs, and E Shares represent 50.1% of all of the issued and outstanding equity and debt securities of Janus Holdings. The remaining 49.9% of Janus Holdings’ equity and debt securities are owned by J.C. Flowers and include: (a) J Bridge PECs with a face value of £10,177,781 (approximately $15.5 million), (b) J preferred equity certificates with a face value of £96,343,515 (approximately $146.5 million) (the “J PECs”), (c) 3,484,597 J shares of Janus Holdings (the “J Shares”), and (d) 100 A shares of Cabot Holdings. All of the PECs accrue interest at 12% per annum. Since PECs are legal form debt, the J Bridge PECs, J PECs and any accrued interests thereof are classified as liabilities and are included in debt in the Company’s accompanying consolidated statements of financial condition. In addition, certain other minority owners hold PECs at the Cabot Holdings level (the “Management PECs”). These PECs are also included in debt in the Company’s accompanying consolidated statements of financial condition. The E Bridge PECs and E PECs held by the Company, and their related interest eliminate in consolidation and therefore are not included in debt in the Company’s consolidated statements of financial condition. The J Bridge PECs, J PECs, and the Management PECs do not require the payment of cash interest expense as they have characteristics similar to equity with a preferred return. The ultimate payment of the accumulated interest would be satisfied only in connection with the disposition of the noncontrolling interest of J.C. Flowers and management.
On June 20, 2014, Encore Europe converted all of its E Bridge PECs into E Shares and E PECs, and J.C. Flowers converted all of its J Bridge PECs into J Shares and J PECs, in proportion to the number of E Shares and E PECs, or J Shares and J PECs, as applicable, outstanding on the closing date of the Cabot Acquisition.
As of December 31, 2016, the outstanding balance of the PECs, including accrued interest, was approximately $206.0 million.
Capital Lease Obligations
The Company has capital lease obligations primarily for computer equipment. As of December 31, 2016, the Company’s combined obligations for capital leases were approximately $5.1 million. These capital lease obligations require monthly, quarterly or annual payments through 2020 and have implicit interest rates that range from zero to approximately 11.1%.
Maturity Schedule
The aggregate amounts of the Company’s debt, including PECs, accrued interests on PECs, and capital lease obligations, maturing in each of the next five years and thereafter are as follows (in thousands):
2017 | $ | 224,394 | |
2018 | 18,760 | ||
2019 | 306,032 | ||
2020 | 887,084 | ||
2021 | 775,821 | ||
Thereafter | 652,028 | ||
Total | $ | 2,864,119 | |
Note 11: Variable Interest Entities
A VIE is defined as a legal entity whose equity owners do not have sufficient equity at risk, or, as a group, the holders of the equity investment at risk lack any of the following three characteristics: decision-making rights, the obligation to absorb losses, or the right to receive the expected residual returns of the entity. The primary beneficiary is identified as the variable interest holder that has both the power to direct the activities of the VIE that most significantly affect the entity’s economic
F-31
performance and the obligation to absorb expected losses or the right to receive benefits from the entity that could potentially be significant to the VIE.
The Company’s VIEs include its subsidiary Janus Holdings and other immaterial special purpose entities that were created to purchase receivable portfolios in certain geographies.
Prior to March 31, 2016, the Company’s VIEs included its subsidiary Janus Holdings and its special purpose entity used for the Propel securitization. On March 31, 2016, the Company completed the divestiture of 100% of its membership interests in Propel. Since Propel is the primary beneficiary of the VIE used for securitization, subsequent to the sale of Propel, the Company no longer consolidates this VIE.
Janus Holdings is the indirect parent company of Cabot. The Company has determined that Janus Holdings is a VIE and the Company is the primary beneficiary of the VIE. The key activities that affect Cabot’s economic performance include, but are not limited to, operational budgets and purchasing decisions. Through its control of the board of directors of Janus Holdings, the Company controls the key operating activities at Cabot.
Assets recognized as a result of consolidating these VIEs do not represent additional assets that could be used to satisfy claims against the Company’s general assets. Conversely, liabilities recognized as a result of consolidating these VIEs do not represent additional claims on the Company’s general assets; rather, they represent claims against the specific assets of the VIE.
The Company evaluates its relationships with its VIE on an ongoing basis to ensure that it continues to be the primary beneficiary.
Note 12: Stock-Based Compensation
In April 2013, Encore’s Board of Directors (the “Board”) approved the Encore Capital Group, Inc. 2013 Incentive Compensation Plan (as amended, the “2013 Plan”), which was then approved by the Company’s stockholders on June 5, 2013. The 2013 Plan superseded the Company’s 2005 Stock Incentive Plan (“2005 Plan”). Board members, employees, and consultants of Encore and its subsidiaries and affiliates are eligible to receive awards under the 2013 Plan. Subject to certain adjustments, the Company may grant awards for an aggregate of 2,500,000 shares of the Company’s common stock under the 2013 Plan. Any shares subject to awards made under the 2013 Plan that terminate by expiration, forfeiture, cancellation, payment of exercise price, payment of withholding tax obligation or otherwise without the issuance of such shares shall again be available for issuance or payment of awards under the 2013 Plan. The 2013 Plan provides for the grant of incentive stock options, nonqualified stock options, stock appreciation rights, restricted stock, restricted stock units, dividend equivalent rights, cash awards, performance-based awards and any other types of awards not inconsistent with the 2013 Plan. The awards under the 2013 Plan consist of compensation subject to authoritative guidance for stock-based compensation.
In accordance with authoritative guidance for stock-based compensation, compensation expense is recognized only for those shares expected to vest, based on the Company’s historical experience and future expectations. Total compensation expense during the years ended December 31, 2016, 2015, and 2014 was $12.6 million, $22.0 million, and $17.2 million, respectively.
The Company’s stock-based compensation arrangements are described below:
Stock Options
The 2013 Plan permits the granting of stock options. No options have been awarded under the 2013 Plan. Under the 2005 Plan, option awards were generally granted with an exercise price equal to the market price of the Company’s stock at the date of issuance. They generally vest over three to five years of continuous service, and have ten-year contractual terms.
The Company uses the Black-Scholes option-pricing model to determine the fair-value of stock-based awards. All options are amortized ratably over the requisite service periods of the awards, which are generally the vesting periods.
The fair value for options granted is estimated at the date of grant using a Black-Scholes option-pricing model. There were no options granted during the years ended December 31, 2016, 2015, or 2014. As of December 31, 2016, all outstanding stock options have been fully vested and all related compensation expenses have been fully recognized.
F-32
A summary of the Company’s stock option activity as of December 31, 2016, and changes during the year then ended, is presented below:
Number of Shares | Option Price Per Share | Weighted Average Exercise Price | Aggregate Intrinsic Value (in thousands) | |||||||||
Outstanding at December 31, 2015 | 118,879 | $2.89 –$24.65 | $ | 16.23 | ||||||||
Exercised | (15,333 | ) | 22.17 –24.65 | 22.87 | ||||||||
Outstanding at December 31, 2016 | 103,546 | $2.89 –$22.17 | $ | 15.24 | $ | 1,388 | ||||||
Exercisable at December 31, 2016 | 103,546 | $2.89 –$22.17 | $ | 15.24 | $ | 1,388 | ||||||
The total intrinsic value of options exercised during the year ended December 31, 2016 was negligible. The total intrinsic value of options exercised during the years ended December 31, 2015 and 2014 was $1.2 million and $29.6 million, respectively. As of December 31, 2016, the weighted-average remaining contractual life of options outstanding and options exercisable was 3.4 years.
Non-Vested Shares
The Company’s 2013 Plan (and previously, the 2005 Plan), permits restricted stock units, restricted stock awards, and performance share awards. The fair value of non-vested shares with service condition and/or performance condition that affect vesting is equal to the closing sale price of the Company’s common stock on the date of issuance. Compensation cost is recognized only for the awards that ultimately vest. The Company has certain share awards that include market conditions that affect vesting, the fair value of these shares is estimated using a lattice model. Compensation cost is not adjusted if the market condition is not met, as long as the requisite service is provided. For the majority of non-vested shares, shares are issued on the vesting dates net of the amount of shares needed to satisfy minimal statutory tax withholding requirements. The tax obligations are then paid by the Company on behalf of the employees.
A summary of the status of the Company’s restricted stock units and restricted stock awards as of December 31, 2016, and changes during the year then ended, is presented below:
Non-Vested Shares | Weighted Average Grant Date Fair Value | |||||
Non-vested at December 31, 2015 | 1,304,271 | $ | 38.71 | |||
Awarded | 712,841 | $ | 27.16 | |||
Vested | (513,073 | ) | $ | 39.93 | ||
Cancelled/forfeited | (163,664 | ) | $ | 38.57 | ||
Non-vested at December 31, 2016 | 1,340,375 | $ | 32.11 | |||
Unrecognized compensation cost related to non-vested shares as of December 31, 2016, was $14.2 million. The weighted-average remaining expense period, based on the unamortized value of these outstanding non-vested shares, was approximately 1.8 years. The fair value of restricted stock units and restricted stock awards vested for the years ended December 31, 2016, 2015, and 2014 was $12.5 million, $16.5 million, and $20.2 million, respectively.
Note 13: Income Taxes
The Company recorded income tax provisions for continuing operations of $38.2 million, $27.2 million, and $48.6 million, during the years ended December 31, 2016, 2015 and 2014, respectively.
F-33
The effective tax rates for the respective periods are shown below:
Year Ended December 31, | ||||||||
2016 | 2015 | 2014 | ||||||
Federal provision | 35.0 | % | 35.0 | % | 35.0 | % | ||
State provision(1) | 2.3 | % | 0.2 | % | 8.7 | % | ||
International benefit(2) | (3.6 | )% | (7.8 | )% | (3.0 | )% | ||
Tax reserves(3) | (3.2 | )% | (2.0 | )% | (3.8 | )% | ||
Permanent items(4) | 14.7 | % | 6.0 | % | 4.3 | % | ||
Increase (decrease) in valuation allowance(5) | 20.7 | % | (5.6 | )% | 0.0 | % | ||
Other(6) | 0.7 | % | 1.9 | % | (6.9 | )% | ||
Effective rate | 66.6 | % | 27.7 | % | 34.3 | % | ||
________________________
(1) | Change from 2014 to 2015 relates primarily to a beneficial settlement with a state tax authority. |
(2) | Relates primarily to the lower tax rate on the income attributable to international operations. |
(3) | Represent release of reserves taken for certain tax positions. |
(4) | Represents a provision for nondeductible items, including overall foreign loss in 2016 and a settlement with the Consumer Finance Protection Bureau (“CFPB”) in 2015. The Company incurred a $10.0 million civil monetary penalty related to a settlement with the CFPB during the year ended December 31, 2015, which is not deductible for income tax purposes. |
(5) | Valuation allowance increased in 2016 due to a foreign subsidiary’s cumulative operating loss. |
(6) | Includes the effect of discrete items, primarily relates to the recognition of tax benefit as a result of a favorable tax settlement with taxing authorities as discussed below. |
The pretax income (loss) from continuing operations consisted of the following (in thousands):
Year Ended December 31, | |||||||||||
2016 | 2015 | 2014 | |||||||||
Domestic | $ | 112,483 | $ | 59,056 | $ | 120,461 | |||||
Foreign | (55,108 | ) | 38,877 | 21,181 | |||||||
$ | 57,375 | $ | 97,933 | $ | 141,642 | ||||||
The income tax provisions for continuing operations consisted of the following (in thousands):
Year Ended December 31, | |||||||||||
2016 | 2015 | 2014 | |||||||||
Current expense: | |||||||||||
Federal | $ | 58,816 | $ | 38,831 | $ | 68,142 | |||||
State | 1,173 | 363 | 7,538 | ||||||||
Foreign | 10,364 | 7,124 | 3,752 | ||||||||
70,353 | 46,318 | 79,432 | |||||||||
Deferred (benefit) expense: | |||||||||||
Federal | (22,951 | ) | (18,755 | ) | (34,479 | ) | |||||
State | 25 | (610 | ) | 2,698 | |||||||
Foreign | (9,222 | ) | 209 | 918 | |||||||
(32,148 | ) | (19,156 | ) | (30,863 | ) | ||||||
$ | 38,205 | $ | 27,162 | $ | 48,569 | ||||||
F-34
The differences between the total income tax expense and the income tax expense computed using the applicable federal income tax rate of 35.0% per annum were as follows (in thousands):
Year Ended December 31, | |||||||||||
2016 | 2015 | 2014 | |||||||||
Computed “expected” Federal income tax expense | $ | 20,081 | $ | 34,277 | $ | 49,578 | |||||
(Decrease) increase in income taxes resulting from: | |||||||||||
State income taxes, net | 1,331 | 637 | 7,975 | ||||||||
Foreign non-taxed income, rate differential | (2,076 | ) | (7,609 | ) | (5,453 | ) | |||||
Other adjustments, net | 18,869 | (143 | ) | (3,531 | ) | ||||||
$ | 38,205 | $ | 27,162 | $ | 48,569 | ||||||
The Company’s subsidiary in Costa Rica is operating under a 100% tax holiday through December 31, 2018 and a 50% tax holiday for the subsequent four years. The impact of the tax holiday in Costa Rica for the year ended December 31, 2016 was immaterial.
The Company has not provided for U.S. income taxes or foreign withholding taxes on the undistributed earnings from continuing operations of its subsidiaries operating outside of the United States. Undistributed net income of these subsidiaries as of December 31, 2016, were approximately $86.2 million. Such undistributed earnings are considered permanently reinvested. The Company does not provide deferred taxes on translation adjustments on unremitted earnings under the indefinite reversal exception. Determination of the amount of unrecognized deferred tax liability related to these earnings is not practicable due the complexities of a hypothetical calculation.
The components of deferred tax assets and liabilities consisted of the following (in thousands):
December 31, 2016 | December 31, 2015 | ||||||
Deferred tax assets: | |||||||
Stock-based compensation expense | $ | 7,549 | $ | 1,301 | |||
Accrued expenses | 19,868 | 7,220 | |||||
Differences in income recognition related to receivable portfolios | 45,419 | 33,652 | |||||
State and international operating losses | 26,386 | 15,234 | |||||
Difference in basis of depreciable assets | 3,427 | 3,069 | |||||
Capitalized legal fees—international | 171 | 4,143 | |||||
Cumulative translation adjustment | 715 | 958 | |||||
Tax benefit of uncertain tax positions | 677 | 1,349 | |||||
Difference in basis of bond and loan costs | 3,007 | 9,480 | |||||
Other | 1,077 | 2,372 | |||||
Valuation allowance | (18,892 | ) | (4,517 | ) | |||
89,404 | 74,261 | ||||||
Deferred tax liabilities: | |||||||
State taxes | (377 | ) | (707 | ) | |||
Deferred court costs | (19,860 | ) | (25,277 | ) | |||
Difference in basis of amortizable assets | (16,488 | ) | (11,044 | ) | |||
Difference in basis of depreciable assets | (7,705 | ) | (8,932 | ) | |||
Differences in income recognition related to receivable portfolios | — | (17,432 | ) | ||||
Deferred debt cancellation income | (1,313 | ) | (1,957 | ) | |||
Other | (242 | ) | (46 | ) | |||
(45,985 | ) | (65,395 | ) | ||||
Net deferred tax asset(1) | $ | 43,419 | $ | 8,866 | |||
F-35
(1) | The Company operates in multiple jurisdictions. In accordance with authoritative guidance relating to income taxes, deferred tax assets and liabilities are netted for each tax-paying component of the Company within a particular tax jurisdiction, and presented as a single amount in the statement of financial condition. |
Certain of the Company’s foreign subsidiaries have net operating loss carry forwards in the amount of approximately $87.9 million, which can be carried forward indefinitely. One of the Company’s domestic subsidiaries has a net operating loss carry forward in the approximate amount of $1.6 million which will begin to expire in 2024 unless previously utilized. Certain of the Company’s domestic subsidiaries have state net operating loss carry forwards in the amount of approximately $8.3 million, which will generally begin to expire in 2026.
Valuation allowances are recognized on deferred tax assets if the Company believes that it is more likely than not that some or all of the deferred tax assets will not be realized. The Company believes the majority of the deferred tax assets will be realized due to the reversal of certain significant temporary differences and anticipated future taxable income from operations. As of December 31, 2016, valuation allowance increased to $18.9 million, as compared to $4.5 million as of December 31, 2015. The increase in the valuation allowance was primarily related to the recording of a valuation allowance at one of the Company’s foreign subsidiaries that has incurred cumulative operating loss during the year ended December 31, 2016. The Company believes that it is more likely than not that the net operating loss carryforwards will not be realized at this jurisdiction, therefore, the Company has recorded a valuation allowance against the previously established deferred tax assets.
A reconciliation of the beginning and ending amount of the Company’s unrecognized tax benefit is as follows (in thousands):
Amount | |||
Balance at December 31, 2013 | $ | 71,273 | |
Increases related to current and prior year tax positions | 34,356 | ||
Decreases related to settlements with taxing authorities | (67,204 | ) | |
Balance at December 31, 2014 | 38,425 | ||
Increases related to prior year tax positions | 5,835 | ||
Increases related to current year tax positions | 11,882 | ||
Decreases related to prior year tax positions | (8,193 | ) | |
Balance at December 31, 2015 | 47,949 | ||
Increases related to prior year tax positions | 2,505 | ||
Increases related to current year tax positions | 1,259 | ||
Decreases related to settlements with taxing authorities | (31,111 | ) | |
Decreases related to prior year tax positions | (1,657 | ) | |
Balance at December 31, 2016 | $ | 18,945 | |
The Company had gross unrecognized tax benefits, inclusive of penalties and interest, of $21.2 million, $58.5 million and $44.4 million at December 31, 2016, 2015, and 2014 respectively. At December 31, 2016, 2015 and 2014, there were $7.1 million, $14.9 million and $12.7 million, respectively, of unrecognized tax benefits that if recognized, would result in a net tax benefit. During the year ended December 31, 2016, the decrease in the Company’s gross unrecognized tax benefit was primarily related to the settlement with tax authorities for unrecognized tax benefits associated with amortization of receivable portfolios. During the year ended December 31, 2015, the increase in the Company’s gross unrecognized tax benefit was primarily associated with certain business combinations. During the year ended December 31, 2014, the decrease in total gross unrecognized tax benefits was due to a favorable tax settlement in November 2014 with taxing authorities related to a previously uncertain tax position. The result of the settlement was a reduction in the unrecognized tax benefit offset by an increase in current taxes payable and deferred tax liabilities. Additionally, the Company recorded a net tax benefit as a result of the settlement of approximately $7.5 million. The uncertain tax benefit is included in “Other liabilities” in the Company’s consolidated statements of financial condition.
The Company believes that an adequate provision has been made for any adjustments that may result from tax examinations. However, it is reasonably possible that certain changes may occur within the next 12 months, which could significantly increase or decrease the balance of the Company’s gross unrecognized tax benefits.
The Company recognizes interest and penalties related to unrecognized tax benefits in its tax expense. The Company recognized expense of approximately $0.5 million, $0.3 million and $1.3 million in interest and penalties during the years
F-36
ended December 31, 2016, 2015 and 2014, respectively. Interest and penalties accrued as of December 31, 2016 and 2015 were $2.2 million and $0.5 million, respectively.
The Company files U.S. federal, state, and foreign income tax returns in jurisdictions with varying statutes of limitations. The 2013 through 2016 tax years remain subject to examination by federal taxing authorities, 2012 through 2016 tax years generally remain subject to examination by state tax authorities, and the 2013 through 2016 tax years remain subject to examination by foreign tax authorities. Tax years from 2008 forward remain open at certain of the Company’s subsidiaries for adjustment for federal and state tax purposes.
Note 14: Commitments and Contingencies
Litigation and Regulatory
The Company is involved in disputes, legal actions, regulatory investigations, inquiries, and other actions from time to time in the ordinary course of business. The Company, along with others in its industry, is routinely subject to legal actions based on the Fair Debt Collection Practices Act (“FDCPA”), comparable state statutes, the Telephone Consumer Protection Act (“TCPA”), state and federal unfair competition statutes, and common law causes of action. The violations of law investigated or alleged in these actions often include claims that the Company lacks specified licenses to conduct its business, attempts to collect debts on which the statute of limitations has run, has made inaccurate or unsupported assertions of fact in support of its collection actions and/or has acted improperly in connection with its efforts to contact consumers. Such litigation and regulatory actions could involve potential compensatory or punitive damage claims, fines, sanctions, injunctive relief, or changes in business practices. Many continue on for some length of time and involve substantial investigation, litigation, negotiation, and other expense and effort before a result is achieved, and during the process the Company often cannot determine the substance or timing of any eventual outcome.
On May 19, 2008, an action captioned Brent v. Midland Credit Management, Inc. et. al was filed in the United States District Court for the Northern District of Ohio Western Division, in which the plaintiff filed a class action counter-claim against two of the Company’s subsidiaries (the “Midland Defendants”). The complaint alleged that the Midland Defendants’ business practices violated consumers’ rights under the FDCPA and the Ohio Consumer Sales Practices Act. The Company has vigorously denied the claims asserted against it in these matters, but has agreed to a proposed settlement to avoid the burden and expense of continued litigation. Subject to court approval, settlement awards to eligible class members, as well as fees and costs, will be paid from a settlement fund of approximately $5.2 million, which has already been paid by the Company and its insurer. If the number of class members who make claims exceeds a certain level, the total settlement could increase to an amount not to exceed $5.7 million. On October 14, 2014, the district court issued an order granting final approval of the parties’ revised agreed upon settlement of this lawsuit. That order was appealed by an objector to the settlement and on July 7, 2016, the United States Court of Appeals for the Sixth Circuit affirmed the district court’s October 14, 2014 ruling.
On November 2, 2010 and December 17, 2010, two national class actions entitled Robinson v. Midland Funding LLC and Tovar v. Midland Credit Management, respectively, were filed in the United States District Court for the Southern District of California. The complaints allege that certain of the Company’s subsidiaries violated the TCPA by calling consumers’ cellular phones without their prior express consent. The complaints seek monetary damages under the TCPA, injunctive relief, and other relief, including attorney fees. On May 10, 2011 and May 11, 2011 two class actions entitled Scardina v. Midland Credit Management, Inc., Midland Funding LLC and Encore Capital Group, Inc. and Martin v. Midland Funding, LLC, respectively, were filed in the United States District Court for the Northern District of Illinois. The complaints allege on behalf of a putative class of Illinois consumers that certain of the Company’s subsidiaries violated the TCPA by calling consumers’ cellular phones without their prior express consent. The complaints seek monetary damages under the TCPA, injunctive relief, and other relief, including attorney fees. On July 28, 2011, the Company filed a motion to transfer the Scardina and Martin cases to the United States District Court for the Southern District of California to be consolidated with the Tovar and Robinson cases. On October 11, 2011, the United States Judicial Panel on Multidistrict Litigation granted the Company’s motion to transfer. All four of these cases, along with a number of additional cases brought against the Company that allege violations of the TCPA, are now pending in the United States District Court for the Southern District of California in a multidistrict litigation titled In re Midland Credit Management Inc. Telephone Consumer Protection Act Litigation. The lead plaintiffs filed an amended consolidated complaint on July 11, 2012. The Company has vigorously denied the claims asserted against it in these matters, but has agreed to a proposed class settlement to avoid the burden and expense of continued litigation. The proposed class settlement is intended to resolve all cases involved in multi-district litigation, and all claims against the Company for alleged violations of the TCPA that occurred before August 31, 2014, other than those of persons who exclude themselves from class settlement. The settlement agreement requires the Company to contribute $2.0 million to a settlement fund, to be disbursed among eligible class members, and to set aside $13.0 million in debt forgiveness to be allocated among eligible class members. In addition, the settlement agreement provides that the Company will pay plaintiffs’ attorney fees in an amount of $2.4 million,
F-37
and for the costs associated with administering the class relief. On November 30, 2016, the court granted final approval of the settlement.
On September 9, 2015, the Company entered into a consent order (the “Consent Order”) with the CFPB in which it settled allegations arising from its practices between 2011 and 2015. The Consent Order includes obligations on the Company to, among other things: (1) follow certain specified operational requirements, substantially all of which are already part of the Company’s current operations; (2) submit to the CFPB for review a comprehensive plan designed to ensure that its debt collection practices comply with all applicable federal consumer financial laws and the terms of the Consent Order; (3) pay redress to certain specified groups of consumers; and (4) pay a civil monetary penalty. The Company will continue to cooperate and engage with the CFPB and work to ensure compliance with the Consent Order. In addition, the Company is subject to ancillary state attorney general investigations related to similar debt collection practices.
The Company incurred a one-time, after-tax charge of approximately $43 million in the third quarter of 2015. The Company believes this charge will cover all related impacts of the Consent Order, including civil monetary penalties, restitution, any such ancillary state regulatory matters, legal expenses and portfolio allowance charges on several pool groups due to the impact on the Company’s current estimated remaining collections related to its existing receivable portfolios. The Company anticipates that after this one-time charge, any future earnings impact will be immaterial.
In certain legal proceedings, the Company may have recourse to insurance or third party contractual indemnities to cover all or portions of its litigation expenses, judgments, or settlements. In accordance with authoritative guidance, the Company records loss contingencies in its financial statements only for matters in which losses are probable and can be reasonably estimated. Where a range of loss can be reasonably estimated with no best estimate in the range, the Company records the minimum estimated liability. The Company continuously assesses the potential liability related to its pending litigation and regulatory matters and revises its estimates when additional information becomes available. As of December 31, 2016, other than reserves related to the CFPB Consent Order, ancillary state regulatory matters and the TCPA settlement fund discussed above, the Company has no material reserves for legal matters. Additionally, based on the current status of litigation and regulatory matters, either the estimate of exposure is immaterial to the Company’s financial statements or an estimate cannot yet be determined. The Company’s legal costs are recorded to expense as incurred.
Leases
The Company leases office facilities in the United States, Europe, and other geographies. The leases are structured as operating leases, and the Company incurred related rent expense in the amounts of $20.3 million, $19.4 million, and $23.0 million during the years ended December 31, 2016, 2015, and 2014, respectively.
The Company has capital lease obligations primarily for certain computer equipment. Refer to Note 10, “Debt—Capital Lease Obligations” for additional information on the Company’s capital leases. Amortization of assets under capital leases is included in depreciation and amortization expense.
Future minimum lease payments under lease obligations consist of the following for the years ending December 31, (in thousands):
Capital Leases | Operating Leases | Total | |||||||||
2017 | $ | 3,470 | $ | 17,347 | $ | 20,817 | |||||
2018 | 1,227 | 13,033 | 14,260 | ||||||||
2019 | 478 | 8,282 | 8,760 | ||||||||
2020 | 270 | 6,361 | 6,631 | ||||||||
2021 | — | 5,599 | 5,599 | ||||||||
Thereafter | — | 11,202 | 11,202 | ||||||||
Total minimal leases payments | 5,445 | $ | 61,824 | $ | 67,269 | ||||||
Less: Interest | (354 | ) | |||||||||
Present value of minimal lease payments | $ | 5,091 | |||||||||
Purchase Commitments
In the normal course of business, the Company enters into forward flow purchase agreements and other purchase commitment agreements. As of December 31, 2016, the Company has entered into agreements to purchase receivable portfolios with a face value of approximately $1.9 billion for a purchase price of approximately $262.1 million. Most purchase commitments do not extend past one year.
F-38
Guarantees
Encore’s Certificate of Incorporation and indemnification agreements between the Company and its officers and directors provide that the Company will indemnify and hold harmless its officers and directors for certain events or occurrences arising as a result of the officer or director serving in such capacity. The Company has also agreed to indemnify certain third parties under certain circumstances pursuant to the terms of certain underwriting agreements, registration rights agreements, credit facilities, portfolio purchase and sale agreements, and other agreements entered into by the Company in the ordinary course of business. The maximum potential amount of future payments the Company could be required to make under these indemnification agreements is unlimited. The Company believes the estimated fair value of these indemnification agreements is minimal and, as of December 31, 2016, has no liabilities recorded for these agreements.
Note 15: Segment Information
The Company conducts business through several operating segments that meet the aggregation criteria under authoritative guidance related to segment reporting. The Company’s management relies on internal management reporting processes that provide segment revenue, segment operating income, and segment asset information in order to make financial decisions and allocate resources. Prior to the first quarter 2016 the Company had determined that it had two reportable segments: portfolio purchasing and recovery and tax lien business. As discussed in Note 2, “Discontinued Operations,” on March 31, 2016, the Company completed the divestiture of its membership interests in Propel, which comprised the entire tax lien business segment. Propel’s operations are presented as discontinued operations in the Company’s consolidated statements of income. Beginning in the first quarter 2016, the Company has one reportable segment, portfolio purchasing and recovery.
The following tables present information about geographic areas in which the Company operates (in thousands):
Year Ended December 31, | |||||||||||
2016 | 2015 | 2014 | |||||||||
Revenues(1): | |||||||||||
United States | $ | 669,636 | $ | 709,405 | $ | 723,247 | |||||
International | |||||||||||
Europe(2) | 270,411 | 376,055 | 295,173 | ||||||||
Other geographies | 89,211 | 44,507 | 25,009 | ||||||||
Total | $ | 1,029,258 | $ | 1,129,967 | $ | 1,043,429 | |||||
________________________
(1) | Revenues are attributed to countries based on location of customer. |
(2) | Based on the financial information that is used to produce the general-purpose financial statements, providing further geographic information is impracticable. |
December 31, 2016 | December 31, 2015 | ||||||
Long-lived assets(1): | |||||||
United States | $ | 39,126 | $ | 38,921 | |||
International | |||||||
United Kingdom | 20,860 | 20,795 | |||||
Other foreign countries | 12,271 | 12,830 | |||||
33,131 | 33,625 | ||||||
Total | $ | 72,257 | $ | 72,546 | |||
________________________
(1) | Long-lived assets consists of property and equipment, net. |
F-39
Note 16: Goodwill and Identifiable Intangible Assets
In accordance with authoritative guidance, goodwill is tested for impairment at the reporting unit level annually and in interim periods if certain events occur that indicate that the fair value of a reporting unit may be below its carrying value. Determining the number of reporting units and the fair value of a reporting unit requires the Company to make judgments and involves the use of significant estimates and assumptions. The Company has five reporting units for goodwill impairment testing purposes. The annual goodwill testing date for these reporting units is October 1st.
The Company first assesses qualitative factors to determine whether it is necessary to perform the two-step quantitative goodwill impairment test. The qualitative factors include economic environment, business climate, market capitalization, operating performance, competition, and other factors. The Company may proceed directly to the two-step quantitative test without performing the qualitative test.
The first step involves measuring the recoverability of goodwill at the reporting unit level by comparing the estimated fair value of the reporting unit in which the goodwill resides to its carrying value. The second step, if necessary, measures the amount of impairment, if any, by comparing the implied fair value of goodwill to its carrying value. The Company applies various valuation techniques to measure the fair value of each reporting unit, including the income approach and the market approach. For goodwill impairment analyses conducted at most of the reporting units, the Company uses the income approach in determining fair value, specifically the discounted cash flow method, or DCF. In applying the DCF method, an identified level of future cash flow is estimated. Annual estimated cash flows and a terminal value are then discounted to their present value at an appropriate discount rate to obtain an indication of fair value. The discount rate utilized reflects estimates of required rates of return for investments that are seen as similar to an investment in the reporting unit. DCF analyses are based on management’s long-term financial projections and require significant judgments, therefore, for most of the Company’s reporting units where the Company has access to reliable market participant data, the market approach is conducted in addition to the income approach in determining the fair value. The Company uses a guideline company method under the market approach to estimate the fair value of equity and the market value of invested capital (“MVIC”). The guideline company approach relies on estimated remaining collections data or the earnings before interest, tax, depreciation and amortization (“EBITDA”) for each of the selected guideline companies, which enables a direct comparison between the reporting unit and the selected peer group. The Company believes that the current methodology used in determining the fair value at its reporting units represent its best estimates. In addition, the Company compares the aggregate fair value of the reporting units to its overall market capitalization.
Due to the large allowance charge recorded during the third quarter of 2016, the carrying value at the Company’s Cabot reporting unit became negative at October 1, 2016. According to authoritative guidance, if the carrying amount of a reporting unit is zero or negative, the traditional step two of the impairment test should be performed to measure the amount of impairment loss, if any, when it is more likely than not that a goodwill impairment exists. In considering whether it is more likely than not that a goodwill impairment exists, an entity can perform a step zero qualitative analysis. The Company conducted a qualitative analysis and concluded that there was no indication that a goodwill impairment existed at this reporting unit. For the Company’s annual goodwill impairment tests performed at October 1, 2016 for the remaining four reporting units, the estimated fair value of each of these reporting units exceeded its respective carrying value. As a result, no impairment existed at any of these reporting units.
Management continues to evaluate and monitor all key factors impacting the carrying value of the Company’s recorded goodwill and long-lived assets. Further adverse changes in the Company’s actual or expected operating results, market capitalization, business climate, economic factors or other negative events that may be outside the control of management could result in a material non-cash impairment charge in the future.
F-40
The Company’s goodwill is attributable to reporting units included in its portfolio purchasing and recovery segment. The following table summarizes the activity in the Company’s goodwill balance, as follows (in thousands):
Total | |||
Balance, December 31, 2015 | $ | 924,847 | |
Goodwill acquired | 623 | ||
Goodwill adjustment(1) | (20,674 | ) | |
Effect of foreign currency translation | (119,764 | ) | |
Balance, December 31, 2016 | $ | 785,032 | |
(1) | Represent adjustments made to preliminary purchase price allocations as a result of obtaining fair value of intangible assets acquired and finalizing certain established deferred income tax associated with prior year business combinations. |
The Company’s acquired intangible assets are summarized as follows (in thousands):
As of December 31, 2016 | As of December 31, 2015 | ||||||||||||||||||||||
Gross Carrying Amount | Accumulated Amortization | Net Carrying Amount | Gross Carrying Amount | Accumulated Amortization | Net Carrying Amount | ||||||||||||||||||
Customer relationships | $ | 21,200 | $ | (3,220 | ) | $ | 17,980 | $ | 5,356 | $ | (903 | ) | $ | 4,453 | |||||||||
Developed technologies | 6,497 | (3,891 | ) | 2,606 | 8,141 | (3,793 | ) | 4,348 | |||||||||||||||
Trade name and other | 12,566 | (4,909 | ) | 7,657 | 10,324 | (3,413 | ) | 6,911 | |||||||||||||||
Total intangible assets | $ | 40,263 | $ | (12,020 | ) | $ | 28,243 | $ | 23,821 | $ | (8,109 | ) | $ | 15,712 | |||||||||
The weighted-average useful lives of intangible assets at the time of acquisition were as follows:
Weighted-Average Useful Lives | |
Customer relationships | 10 |
Developed technologies | 5 |
Trade name and other | 8 |
The amortization expense for intangible assets that are subject to amortization was $7.2 million, $5.0 million, and $3.6 million for the years ended December 31, 2016, 2015, and 2014, respectively. Estimated future amortization expense related to finite-lived intangible assets at December 31, 2016 is as follows (in thousands):
2017 | $ | 5,417 | |
2018 | 4,442 | ||
2019 | 3,109 | ||
2020 | 2,972 | ||
2021 | 2,849 | ||
Thereafter | 9,454 | ||
Total | $ | 28,243 | |
F-41
Note 17: Quarterly Information (Unaudited)
The following table summarizes quarterly financial data for the periods presented (in thousands, except per share amounts):
Three Months Ended | |||||||||||||||
March 31 | June 30 | September 30 | December 31 | ||||||||||||
2016 | |||||||||||||||
Gross collections | $ | 447,805 | $ | 434,100 | $ | 406,961 | $ | 396,738 | |||||||
Revenues | 289,017 | 289,442 | 179,415 | 271,384 | |||||||||||
Total operating expenses | 205,513 | 197,695 | 200,597 | 183,939 | |||||||||||
Income (loss) from continuing operations | 29,789 | 30,833 | (51,946 | ) | 10,494 | ||||||||||
Net income (loss) | 26,607 | 30,833 | (51,946 | ) | 11,323 | ||||||||||
Amounts attributable to Encore Capital Group, Inc.: | |||||||||||||||
Income from (loss) continuing operations | 28,876 | 29,588 | (1,524 | ) | 21,983 | ||||||||||
Net income (loss) attributable to Encore Capital Group, Inc. stockholders | 25,694 | 29,588 | (1,524 | ) | 22,812 | ||||||||||
Earnings (loss) per share attributable to Encore Capital Group, Inc.: | |||||||||||||||
From continuing operations: | |||||||||||||||
Basic | $ | 1.13 | $ | 1.15 | $ | (0.06 | ) | $ | 0.85 | ||||||
Diluted | 1.12 | 1.14 | (0.06 | ) | 0.85 | ||||||||||
From net income: | |||||||||||||||
Basic | $ | 1.01 | $ | 1.15 | $ | (0.06 | ) | $ | 0.88 | ||||||
Diluted | 0.99 | 1.14 | (0.06 | ) | 0.88 | ||||||||||
2015 | |||||||||||||||
Gross collections | $ | 425,071 | $ | 437,324 | $ | 421,753 | $ | 416,577 | |||||||
Revenues | 277,782 | 282,662 | 278,914 | 290,609 | |||||||||||
Total operating expenses | 194,895 | 198,362 | 248,185 | 206,271 | |||||||||||
Income (loss) from continuing operations | 28,087 | 23,524 | (11,650 | ) | 30,810 | ||||||||||
Net income (loss) | 29,967 | 25,185 | (9,364 | ) | 1,596 | ||||||||||
Amounts attributable to Encore Capital Group, Inc.: | |||||||||||||||
Income (loss) from continuing operations | 27,545 | 25,996 | (13,245 | ) | 28,226 | ||||||||||
Net income (loss) | 1,880 | 1,661 | 2,286 | (29,214 | ) | ||||||||||
Earnings (loss) per share attributable to Encore Capital Group, Inc.: | |||||||||||||||
From continuing operations: | |||||||||||||||
Basic | $ | 1.06 | $ | 1.00 | $ | (0.52 | ) | $ | 1.11 | ||||||
Diluted | 1.01 | 0.97 | (0.52 | ) | 1.08 | ||||||||||
From net income: | |||||||||||||||
Basic | $ | 1.13 | $ | 1.07 | $ | (0.43 | ) | $ | (0.04 | ) | |||||
Diluted | 1.08 | 1.03 | (0.43 | ) | (0.04 | ) | |||||||||
F-42