Attached files
| file | filename |
|---|---|
| 8-K - 8-K - HD Supply Holdings, Inc. | a15-22306_18k.htm |
Exhibit 99.1
Goldman Sachs 2015 Industrial Conference November 4th, 2015

Disclaimers Forward-Looking Statements This presentation includes “forward-looking statements” within the meaning of Section 27A of the Securities Act and Section 21E of the Exchange Act. Forward-looking statements are subject to known and unknown risks and uncertainties, many of which may be beyond our control. We caution you that the forward-looking information presented herein is not a guarantee of future events, and that actual events may differ materially from those made in or suggested by the forward-looking information contained in this presentation. In addition, forward-looking statements generally can be identified by the use of forward-looking terminology such as “may,” “plan,” “seek,” “comfortable with,” “will,” “expect,” “intend,” “estimate,” “anticipate,” “believe” or “continue” or the negative thereof or variations thereon or similar terminology. A number of important factors could cause actual events to differ materially from those contained in or implied by the forward-looking statements, including those factors discussed in our filings with the U.S. Securities & Exchange Commission (the “SEC”), including our annual report on Form 10-K, for the year ended February 1, 2015, which can be found at the SEC’s website www.sec.gov. Any forward-looking information presented herein is made only as of the date of this presentation, and we do not undertake any obligation to update or revise any forward-looking information to reflect changes in assumptions, the occurrence of unanticipated events, or otherwise. Non-GAAP Financial Measures HD Supply supplements its reporting net income (loss) with non-GAAP measurements, including Adjusted EBITDA, Adjusted net income (loss) and Adjusted net income (loss) per share. This supplemental information should not be considered in isolation or as a substitute for the GAAP measurements. Additional information regarding Adjusted EBITDA, Adjusted net income (loss) and Adjusted net income (loss) per share referred to in this presentation is included at the end of this presentation under “Reconciliation of Non-GAAP Measures.”
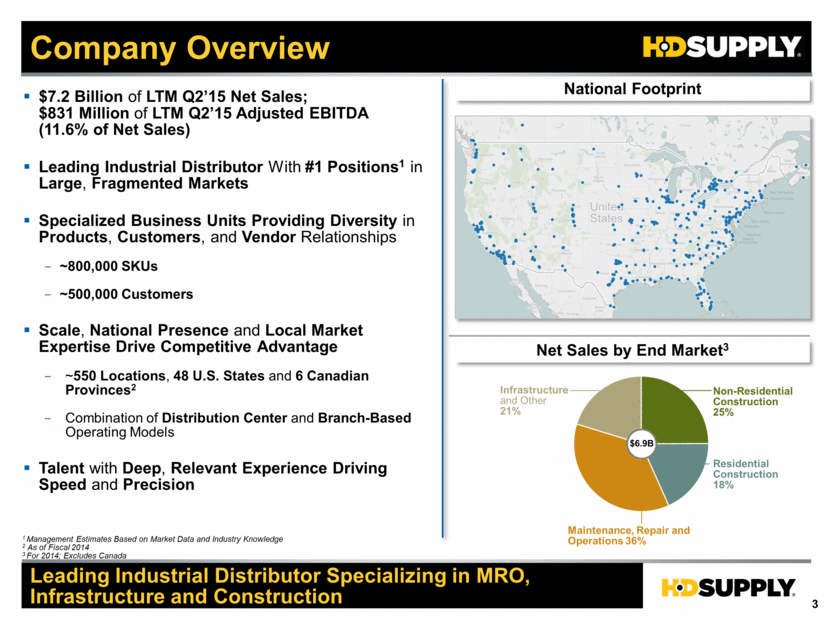
Company Overview Leading Industrial Distributor Specializing in MRO, Infrastructure and Construction $7.2 Billion of LTM Q2’15 Net Sales; $831 Million of LTM Q2’15 Adjusted EBITDA (11.6% of Net Sales) Leading Industrial Distributor With #1 Positions1 in Large, Fragmented Markets Specialized Business Units Providing Diversity in Products, Customers, and Vendor Relationships ~800,000 SKUs ~500,000 Customers Scale, National Presence and Local Market Expertise Drive Competitive Advantage ~550 Locations, 48 U.S. States and 6 Canadian Provinces2 Combination of Distribution Center and Branch-Based Operating Models Talent with Deep, Relevant Experience Driving Speed and Precision National Footprint Net Sales by End Market3 Maintenance, Repair and Operations 36% Residential Construction 18% Non-Residential Construction 25% Infrastructure and Other 21% $6.9B 1 Management Estimates Based on Market Data and Industry Knowledge 2 As of Fiscal 2014 3 For 2014; Excludes Canada
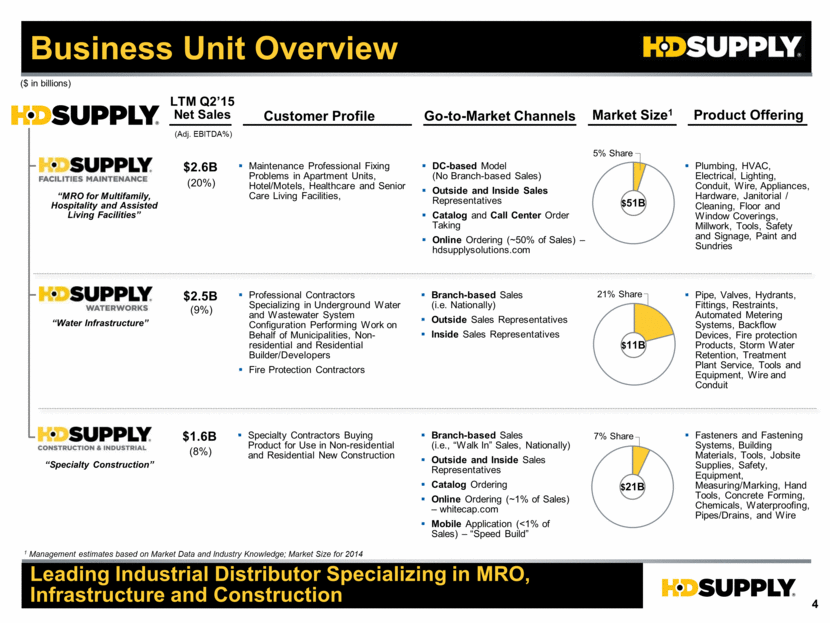
Leading Industrial Distributor Specializing in MRO, Infrastructure and Construction Business Unit Overview Product Offering Customer Profile LTM Q2’15 Net Sales ($ in billions) (Adj. EBITDA%) Market Size1 “MRO for Multifamily, Hospitality and Assisted Living Facilities” Maintenance Professional Fixing Problems in Apartment Units, Hotel/Motels, Healthcare and Senior Care Living Facilities, $2.6B (20%) $51B 5% Share “Water Infrastructure” Professional Contractors Specializing in Underground Water and Wastewater System Configuration Performing Work on Behalf of Municipalities, Non-residential and Residential Builder/Developers Fire Protection Contractors $2.5B (9%) $11B 21% Share “Specialty Construction” Specialty Contractors Buying Product for Use in Non-residential and Residential New Construction $1.6B (8%) $21B 7% Share 1 Management estimates based on Market Data and Industry Knowledge; Market Size for 2014 Go-to-Market Channels DC-based Model (No Branch-based Sales) Outside and Inside Sales Representatives Catalog and Call Center Order Taking Online Ordering (~50% of Sales) – hdsupplysolutions.com Branch-based Sales (i.e. Nationally) Outside Sales Representatives Inside Sales Representatives Branch-based Sales (i.e., “Walk In” Sales, Nationally) Outside and Inside Sales Representatives Catalog Ordering Online Ordering (~1% of Sales) – whitecap.com Mobile Application (<1% of Sales) – “Speed Build” Plumbing, HVAC, Electrical, Lighting, Conduit, Wire, Appliances, Hardware, Janitorial / Cleaning, Floor and Window Coverings, Millwork, Tools, Safety and Signage, Paint and Sundries Pipe, Valves, Hydrants, Fittings, Restraints, Automated Metering Systems, Backflow Devices, Fire protection Products, Storm Water Retention, Treatment Plant Service, Tools and Equipment, Wire and Conduit Fasteners and Fastening Systems, Building Materials, Tools, Jobsite Supplies, Safety, Equipment, Measuring/Marking, Hand Tools, Concrete Forming, Chemicals, Waterproofing, Pipes/Drains, and Wire
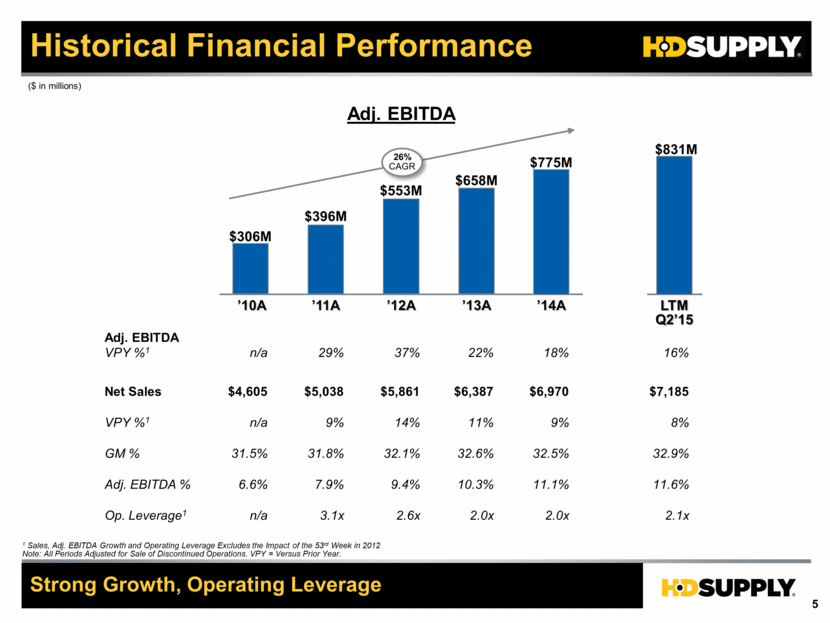
Historical Financial Performance Strong Growth, Operating Leverage ($ in millions) 1 Sales, Adj. EBITDA Growth and Operating Leverage Excludes the Impact of the 53rd Week in 2012 Note: All Periods Adjusted for Sale of Discontinued Operations. VPY = Versus Prior Year. Adj. EBITDA Net Sales GM % Adj. EBITDA % VPY %1 VPY %1 ’10A 31.5% $306M 6.6% $4,605 n/a n/a 31.8% ’11A $396M 7.9% $5,038 29% 9% ’12A 32.1% $553M 9.4% $5,861 37% 14% ’13A 32.6% $658M 10.3% $6,387 22% 11% 26% CAGR LTM Q2’15 32.9% $831M 11.6% $7,185 16% 8% Adj. EBITDA ’14A 32.5% $775M 11.1% $6,970 18% 9% 3.1x n/a 2.6x 2.0x 2.0x 2.1x Op. Leverage1
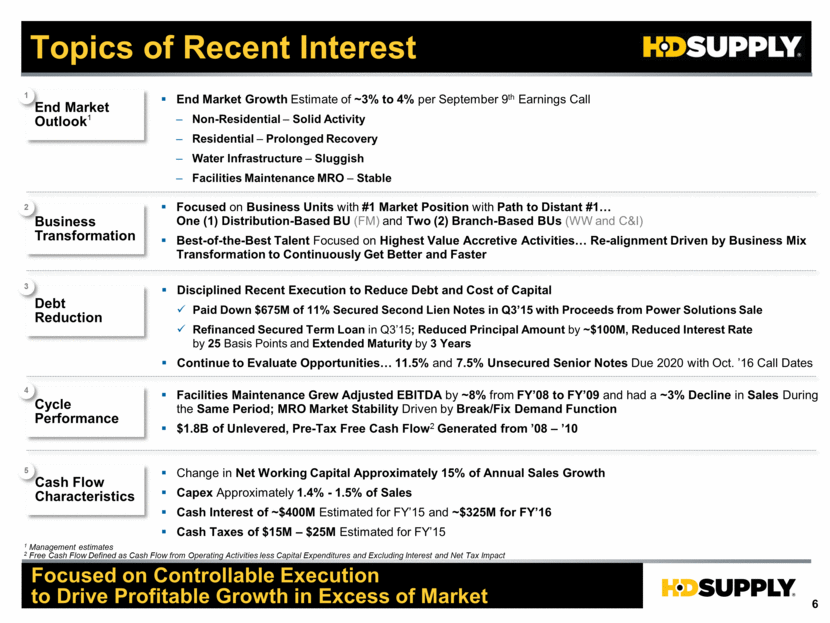
Cycle Performance Topics of Recent Interest Focused on Controllable Execution to Drive Profitable Growth in Excess of Market End Market Outlook1 Cash Flow Characteristics End Market Growth Estimate of ~3% to 4% per September 9th Earnings Call Non-Residential – Solid Activity Residential – Prolonged Recovery Water Infrastructure – Sluggish Facilities Maintenance MRO – Stable Debt Reduction Disciplined Recent Execution to Reduce Debt and Cost of Capital Paid Down $675M of 11% Secured Second Lien Notes in Q3’15 with Proceeds from Power Solutions Sale Refinanced Secured Term Loan in Q3’15; Reduced Principal Amount by ~$100M, Reduced Interest Rate by 25 Basis Points and Extended Maturity by 3 Years Continue to Evaluate Opportunities 11.5% and 7.5% Unsecured Senior Notes Due 2020 with Oct. ’16 Call Dates Focused on Business Units with #1 Market Position with Path to Distant #1 One (1) Distribution-Based BU (FM) and Two (2) Branch-Based BUs (WW and C&I) Best-of-the-Best Talent Focused on Highest Value Accretive Activities Re-alignment Driven by Business Mix Transformation to Continuously Get Better and Faster Business Transformation 1 2 Change in Net Working Capital Approximately 15% of Annual Sales Growth Capex Approximately 1.4% - 1.5% of Sales Cash Interest of ~$400M Estimated for FY’15 and ~$325M for FY’16 Cash Taxes of $15M – $25M Estimated for FY’15 4 5 3 1 Management estimates 2 Free Cash Flow Defined as Cash Flow from Operating Activities less Capital Expenditures and Excluding Interest and Net Tax Impact Facilities Maintenance Grew Adjusted EBITDA by ~8% from FY’08 to FY’09 and had a ~3% Decline in Sales During the Same Period; MRO Market Stability Driven by Break/Fix Demand Function $1.8B of Unlevered, Pre-Tax Free Cash Flow2 Generated from ’08 – ’10
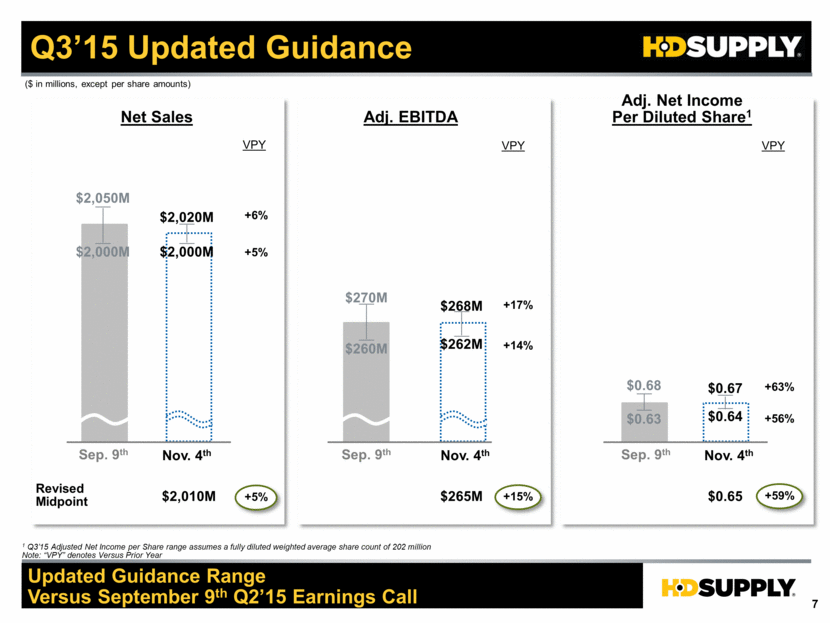
+17% +14% +5% Q3’15 Updated Guidance Updated Guidance Range Versus September 9th Q2’15 Earnings Call $2,000M $268M $262M VPY Nov. 4th Net Sales Adj. EBITDA Adj. Net Income Per Diluted Share1 VPY 1 Q3’15 Adjusted Net Income per Share range assumes a fully diluted weighted average share count of 202 million Note: “VPY” denotes Versus Prior Year $0.67 $0.64 VPY ($ in millions, except per share amounts) . . . . +63% +56% Revised Midpoint $265M +15% $0.65 +59% +6% $2,050M Sep. 9th $2,010M $2,000M $2,020M $270M $260M +5% $0.68 $0.63 Sep. 9th Sep. 9th Nov. 4th Nov. 4th
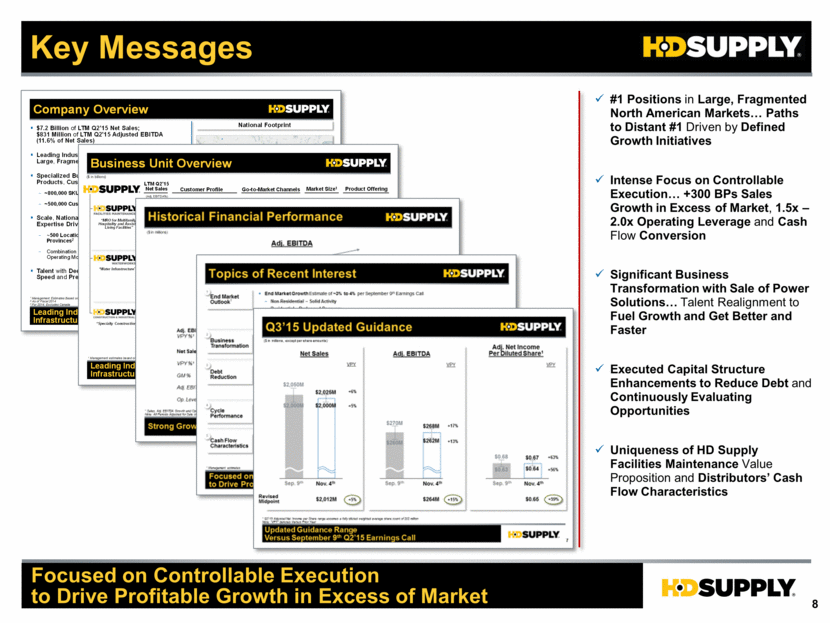
Key Messages #1 Positions in Large, Fragmented North American Markets Paths to Distant #1 Driven by Defined Growth Initiatives Intense Focus on Controllable Execution +300 BPs Sales Growth in Excess of Market, 1.5x – 2.0x Operating Leverage and Cash Flow Conversion Significant Business Transformation with Sale of Power Solutions Talent Realignment to Fuel Growth and Get Better and Faster Executed Capital Structure Enhancements to Reduce Debt and Continuously Evaluating Opportunities Uniqueness of HD Supply Facilities Maintenance Value Proposition and Distributors’ Cash Flow Characteristics Focused on Controllable Execution to Drive Profitable Growth in Excess of Market 3 Company Overview Leading Industrial Distributor Specializing in MRO , Infrastructure and Construction § $7.2 Billion of LTM Q2’15 Net Sales; $831 Million of LTM Q2’15 Adjusted EBITDA (11.6% of Net Sales) § Leading Industrial Distributor With #1 Positions 1 in Large , Fragmented Markets § Specialized Business Units Providing Diversity in Products , Customers , and Vendor Relationships - ~800,000 SKUs - ~500,000 Customers § Scale , National Presence and Local Market Expertise Drive Competitive Advantage - ~ 500 Locations , 48 U.S. States and 6 Canadian Provinces 2 - Combination of Distribution Center and Branch - Based Operating Models § Talent with Deep , Relevant Experience Driving Speed and Precision National Footprint Net Sales by End Market 3 Maintenance, Repair and Operations 36% Residential Construction 18% Non - Residential Construction 25% Infrastructure and Other 21% $6.9B 1 Management Estimates Based on Market Data and Industry Knowledge 2 As of Fiscal 2014 3 For 2014; Excludes Canada 4 Leading Industrial Distributor Specializing in MRO, Infrastructure and Construction Business Unit Overview Product Offering Customer Profile LTM Q2’15 Net Sales ($ in billions ) (Adj. EBITDA%) Market Size 1 “MRO for Multifamily, Hospitality and Assisted Living Facilities” § Maintenance Professional Fixing Problems in Apartment Units, Hotel/Motels, Healthcare and Senior Care Living Facilities, $2.6B (20%) $ 51B 5% Share “Water Infrastructure ” § Professional Contractors Specializing in Underground Water and Wastewater System Configuration Performing Work on Behalf of Municipalities, Non - residential and Residential Builder/Developers § Fire Protection Contractors $2.5B ( 9 %) $ 11B 21% Share “Specialty Construction” § Specialty Contractors Buying Product for Use in Non - residential and Residential New Construction $1.6B (8%) $ 21B 7% Share 1 Management estimates based on Market Data and Industry Knowledge; Market Size for 2014 Go - to - Market Channels § DC - based Model ( No Branch - based Sales) § Outside and Inside Sales Representatives § Catalog and Call Center Order Taking § Online Ordering (~50% of Sales) – hdsupplysolutions.com § Branch - based Sales ( i.e. Nationally ) § Outside Sales Representatives § Inside Sales Representatives § Branch - based Sales ( i.e ., “Walk In” Sales, Nationally) § Outside and Inside Sales Representatives § Catalog Ordering § Online Ordering (~1% of Sales) – whitecap.com § Mobile Application (<1% of Sales) – “ Speed Build ” § Plumbing , HVAC , Electrical , Lighting, Conduit , Wire , Appliances , Hardware , Janitorial / Cleaning , Floor and Window Coverings , Millwork, Tools, Safety and Signage , Paint and Sundries § Pipe, Valves , Hydrants, Fittings, Restraints, Automated Metering Systems, Backflow Devices, Fire protection Products, Storm Water Retention, Treatment Plant Service, Tools and Equipment, Wire and Conduit § Fasteners and Fastening Systems, Building Materials, Tools, Jobsite Supplies, Safety, Equipment, Measuring/Marking, Hand Tools, Concrete Forming, Chemicals, Waterproofing, Pipes/Drains, and Wire
Appendix
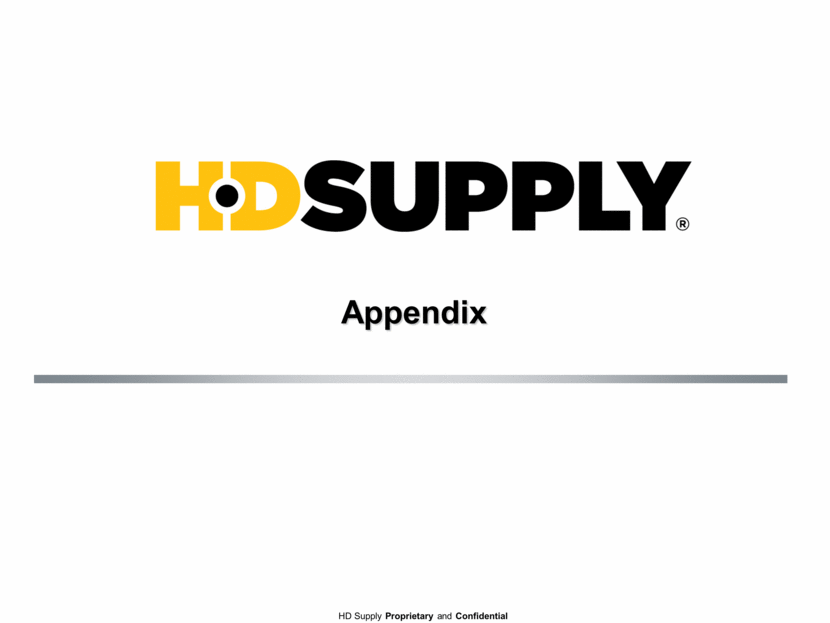
Liquidity and Capital Structure Q2’15 Debt Balances Sec. ABL Sec. Term Loan6 Sec. 1st Lien Notes Sec. 2nd Lien Notes Unsec. Sr. Notes Unsec. Sr. Notes $132 1,250 675 1,000 1,275 6/28/18 6/28/18 12/15/21 4/15/20 7/15/20 7/15/20 Gross Debt Less Cash Net Debt $5,110 169 $5,279 Facility Balance3 Maturity 1 In 2014, we experienced an “ownership change” as defined in Section 382 of the Internal Revenue Code of 1985, as amended. For a discussion of the risk of a change of control on our tax net operating losses, see the risk factor entitled “Our NOL carryforwards could be limited if we experience an ownership change as defined in the Internal Revenue Code” in our Form 10-K for the fiscal year ended February 1, 2015 2 Excludes a tax gain of $189 million related to the February 19, 2015 approval and finalization of the IRS audit of fiscal years 2007 and 2008 3 Net of original issue discount 4 Represents the stated rate of interest, without including the effect of discounts or premiums 5 Subject to applicable redemption price terms 6 Term Loan Amendment effective August 13, 2015 Enhance Capital Structure Opportunistically to Drive Free Cash Flow Momentum ($ in millions, unless otherwise noted) 1.69% 4.00% 5.25% 11.0% 11.5% 7.5% Interest Rate4 947 n/a now 12/15/17 4/15/16 10/15/16 10/15/16 Soft Call Date5 $5.1B Net Debt at the End of Q2’15 Recent Rating Agencies Upgrades Favorable Tax Asset with Significant Gross Federal Net Operating Loss Carryforwards of $2.1B ~$900M Tax-affected Amount of Federal and State NOLs1 Cash Taxes: $6M in Q2’15 ~$5M Estimated for Q3’15 $15M – $25M Estimated for FY’15 GAAP Taxes: $13M in Q2’15 ~$10M Estimated for Q3’152 $35M – $40M Estimated for FY’152 $19M of Capital Expenditures in Q2’15 $850 3.75% 08/13/21 2/13/16 $4,507 $4,338
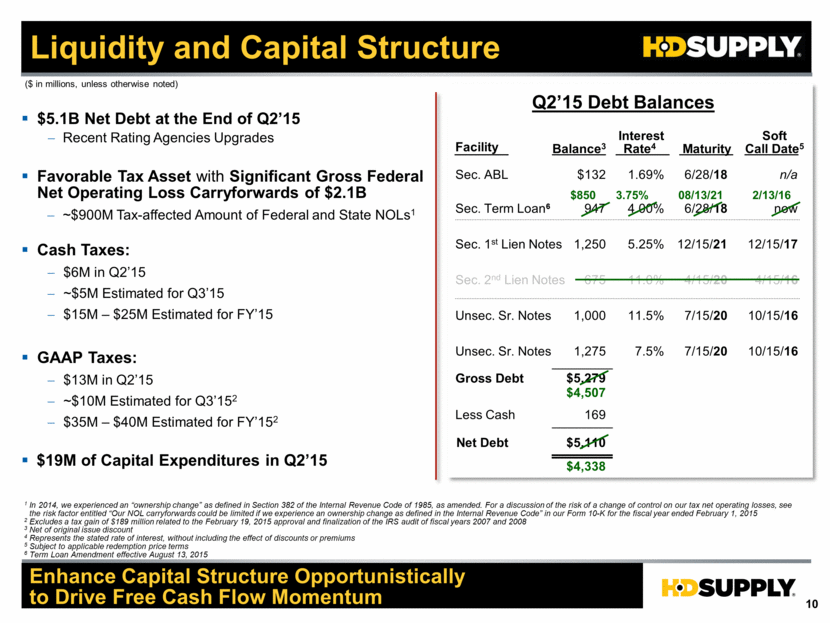
Illustrative Adjusted EPS Calculation Adjusted EBITDA Adjusted Net Income per Diluted Share Adjusted Net Income = = Diluted Shares Outstanding2 ÷ Illustrative TBD TBD TBD ~202M FY’15 $155M $0.03 $7M ~200M Q4’14 ($ in millions, except per share items) ~201 Q1’15 TBD TBD TBD ~202 Q4’15 Estimates ~202 Q2’15 TBD TBD TBD ~202 Q3’15 Depreciation and Amortization1 ( - ) ($30M) (29) (~30) ($110M – $120M) (30) (~30) Amortization of Acquired Intangibles ( + ) ~$15M $4M 4 ~4 3 ~4 Interest Expense (GAAP) ( - ) ($115M) ~($397M) Cash Income Taxes ( - ) ($15M – $25M) ($2M) Stock-based Compensation ( - ) ($5M) (106) (~85) (106) (~100) (3) (~5) (6) (~5) 1 Includes Amounts Recorded Within Cost of Sales 2 Assumes Paydown of 11% Senior Secured 2nd Lien Notes 3 Excludes taxes due on Power Solutions Sale 4 Weighted Average Diluted Shares Outstanding Based on Management Estimates Note: These objectives are forward-looking, are subject to significant business, economic, regulatory and competitive uncertainties and contingencies, many of which are beyond the control of the Company and its management, and are based upon assumptions with respect to future decisions, which are subject to change. Actual results will vary and those variations may be material. For discussion of some of the important factors that could cause these variations, please consult the “Risk Factors” section of our Form 10-K for the year ended February 1, 2015. Nothing in this presentation should be regarded as a representation by any person that these objectives will be achieved and the Company undertakes no duty to update its objectives. Actual (5) (~4) (5) (~4) (~$18M) $188M $0.25 $50M $113M $0.56 $258M
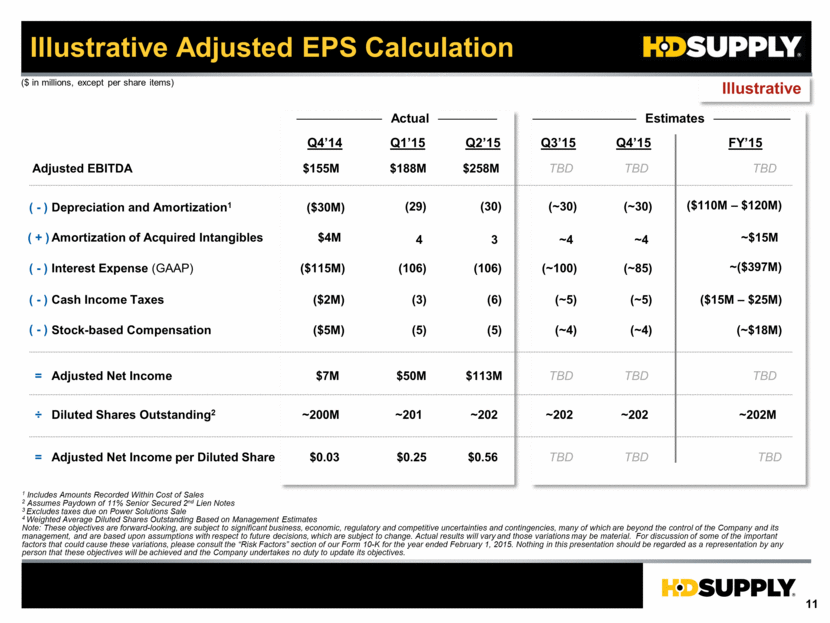
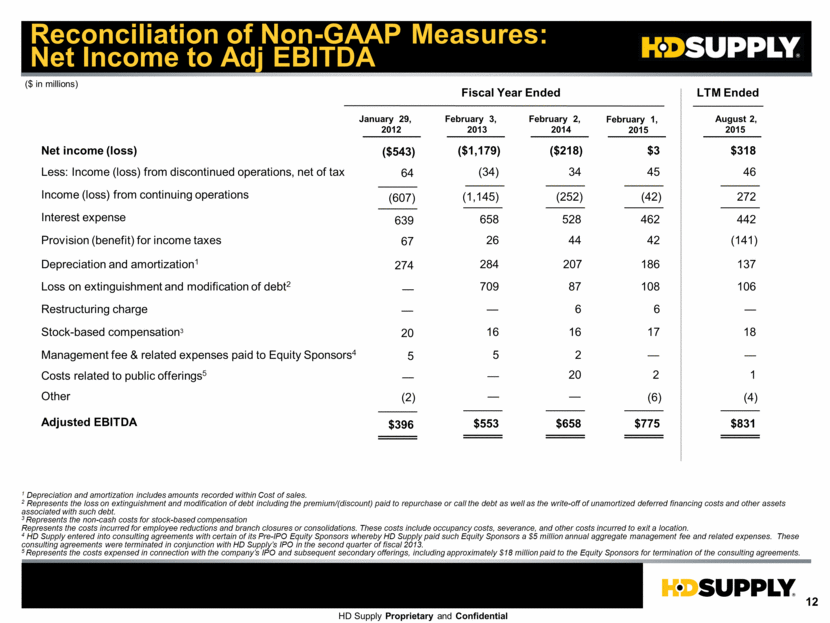
Reconciliation of Non-GAAP Measures: Net Income to Adj EBITDA 1 Depreciation and amortization includes amounts recorded within Cost of sales. 2 Represents the loss on extinguishment and modification of debt including the premium/(discount) paid to repurchase or call the debt as well as the write-off of unamortized deferred financing costs and other assets associated with such debt. 3 Represents the non-cash costs for stock-based compensation Represents the costs incurred for employee reductions and branch closures or consolidations. These costs include occupancy costs, severance, and other costs incurred to exit a location. 4 HD Supply entered into consulting agreements with certain of its Pre-IPO Equity Sponsors whereby HD Supply paid such Equity Sponsors a $5 million annual aggregate management fee and related expenses. These consulting agreements were terminated in conjunction with HD Supply’s IPO in the second quarter of fiscal 2013. 5 Represents the costs expensed in connection with the company’s IPO and subsequent secondary offerings, including approximately $18 million paid to the Equity Sponsors for termination of the consulting agreements. Net income (loss) Less: Income (loss) from discontinued operations, net of tax Income (loss) from continuing operations Interest expense Provision (benefit) for income taxes Depreciation and amortization1 Loss on extinguishment and modification of debt2 Restructuring charge Stock-based compensation3 Management fee & related expenses paid to Equity Sponsors4 Costs related to public offerings5 Other Adjusted EBITDA ($ in millions) Fiscal Year Ended August 2, 2015 $318 46 272 442 (141) 137 106 — 18 — $831 LTM Ended February 3, 2013 ($218) 34 (252) 528 44 207 6 16 2 20 $658 January 29, 2012 ($1,179) (34) (1,145) 658 26 284 709 16 — $553 5 February 2, 2014 $3 45 (42) 462 42 186 108 17 $775 1 (6) February 1, 2015 (4) 87 6 — — — — ($543) 64 (607) 639 67 274 20 — $396 5 — — (2) 2
