Attached files
| file | filename |
|---|---|
| EX-99.1 - EX-99.1 - NEWFIELD EXPLORATION CO /DE/ | a15-22185_1ex99d1.htm |
| 8-K - 8-K - NEWFIELD EXPLORATION CO /DE/ | a15-22185_18k.htm |
Exhibit 99.2
November 3, 2015 @NFX – 3Q15 Update
2 Table of Contents 3Q15 Highlights 3 YTD Capital Investments 4 YTD Domestic Production & Expenses 5 3Q15 Production by Area 6 Anadarko Basin 7 Recent Well Results 8 Guidance 9 Derivative Position Summaries 11 Forward Looking Statements 18
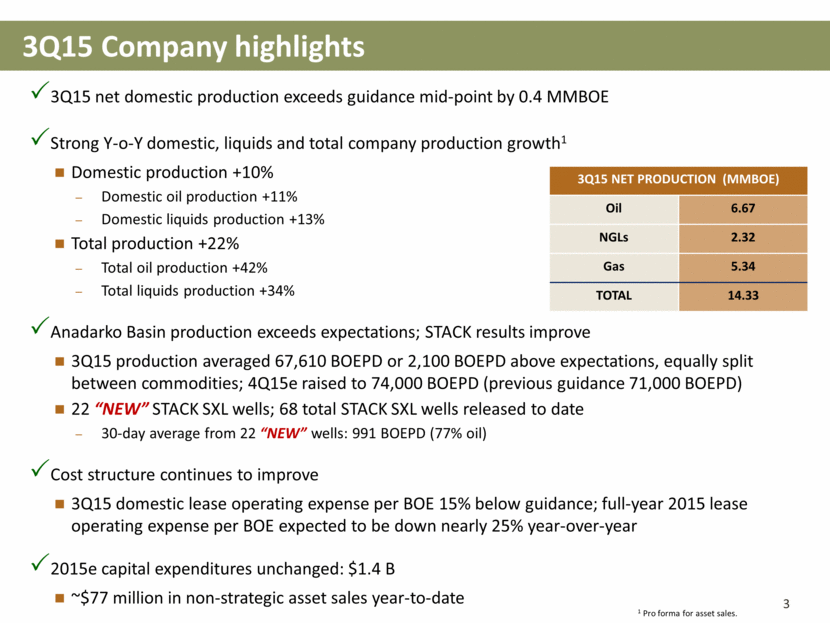
3Q15 net domestic production exceeds guidance mid-point by 0.4 MMBOE Strong Y-o-Y domestic, liquids and total company production growth1 Domestic production +10% Domestic oil production +11% Domestic liquids production +13% Total production +22% Total oil production +42% Total liquids production +34% Anadarko Basin production exceeds expectations; STACK results improve 3Q15 production averaged 67,610 BOEPD or 2,100 BOEPD above expectations, equally split between commodities; 4Q15e raised to 74,000 BOEPD (previous guidance 71,000 BOEPD) 22 “NEW” STACK SXL wells; 68 total STACK SXL wells released to date 30-day average from 22 “NEW” wells: 991 BOEPD (77% oil) Cost structure continues to improve 3Q15 domestic lease operating expense per BOE 15% below guidance; full-year 2015 lease operating expense per BOE expected to be down nearly 25% year-over-year 2015e capital expenditures unchanged: $1.4 B ~$77 million in non-strategic asset sales year-to-date 3Q15 Company highlights 3 3Q15 NET PRODUCTION (MMBOE) Oil 6.67 NGLs 2.32 Gas 5.34 TOTAL 14.33 1 Pro forma for asset sales.
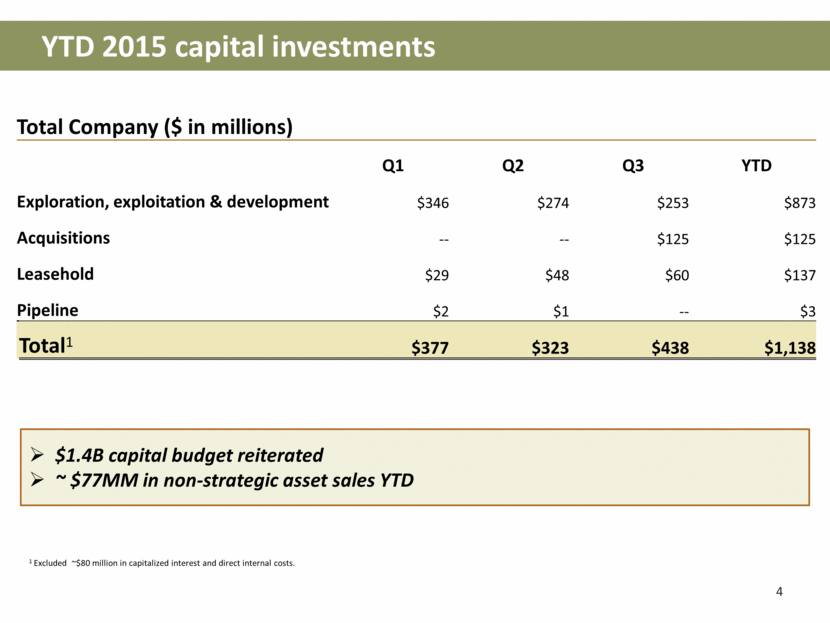
YTD 2015 capital investments 4 Total Company ($ in millions) Q1 Q2 Q3 YTD Exploration, exploitation & development $346 $274 $253 $873 Acquisitions -- -- $125 $125 Leasehold $29 $48 $60 $137 Pipeline $2 $1 -- $3 Total1 $377 $323 $438 $1,138 $1.4B capital budget reiterated ~ $77MM in non-strategic asset sales YTD 1 Excluded ~$80 million in capitalized interest and direct internal costs.
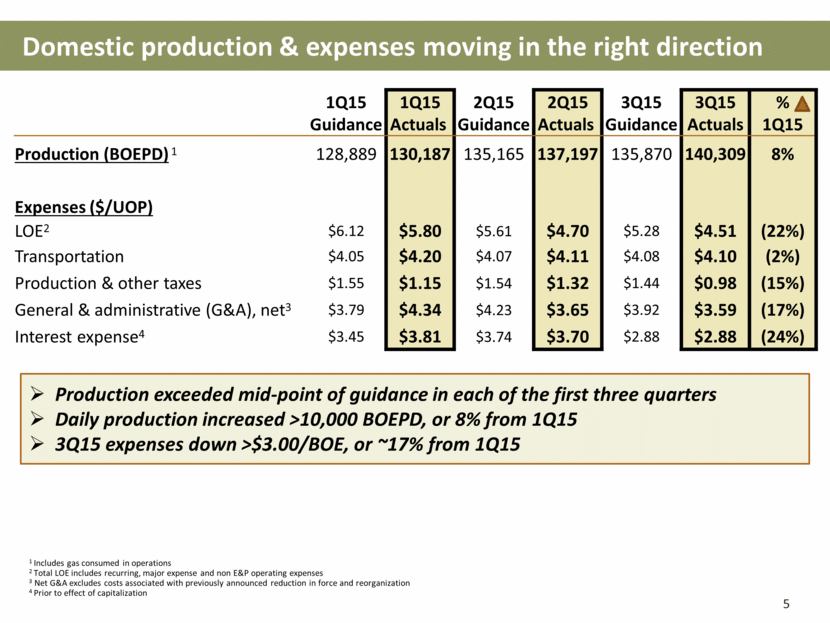
Domestic production & expenses moving in the right direction 1Q15 Guidance 1Q15 Actuals 2Q15 Guidance 2Q15 Actuals 3Q15 Guidance 3Q15 Actuals % 1Q15 Production (BOEPD) 1 128,889 130,187 135,165 137,197 135,870 140,309 8% Expenses ($/UOP) LOE2 $6.12 $5.80 $5.61 $4.70 $5.28 $4.51 (22%) Transportation $4.05 $4.20 $4.07 $4.11 $4.08 $4.10 (2%) Production & other taxes $1.55 $1.15 $1.54 $1.32 $1.44 $0.98 (15%) General & administrative (G&A), net3 $3.79 $4.34 $4.23 $3.65 $3.92 $3.59 (17%) Interest expense4 $3.45 $3.81 $3.74 $3.70 $2.88 $2.88 (24%) 1 Includes gas consumed in operations 2 Total LOE includes recurring, major expense and non E&P operating expenses 3 Net G&A excludes costs associated with previously announced reduction in force and reorganization 4 Prior to effect of capitalization 5 Production exceeded mid-point of guidance in each of the first three quarters Daily production increased >10,000 BOEPD, or 8% from 1Q15 3Q15 expenses down >$3.00/BOE, or ~17% from 1Q15
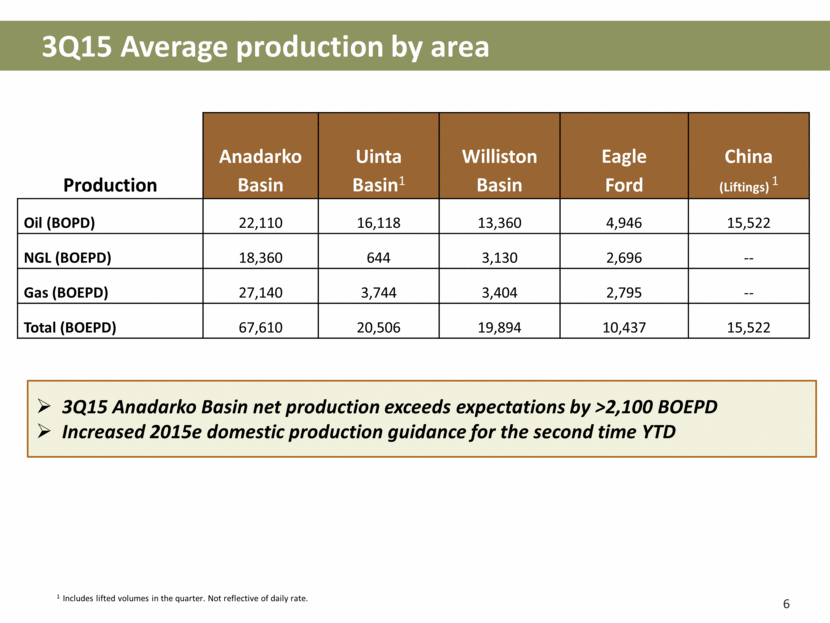
3Q15 Average production by area Production Anadarko Basin Uinta Basin1 Williston Basin Eagle Ford China (Liftings) 1 Oil (BOPD) 22,110 16,118 13,360 4,946 15,522 NGL (BOEPD) 18,360 644 3,130 2,696 -- Gas (BOEPD) 27,140 3,744 3,404 2,795 -- Total (BOEPD) 67,610 20,506 19,894 10,437 15,522 6 1 Includes lifted volumes in the quarter. Not reflective of daily rate. 3Q15 Anadarko Basin net production exceeds expectations by >2,100 BOEPD Increased 2015e domestic production guidance for the second time YTD
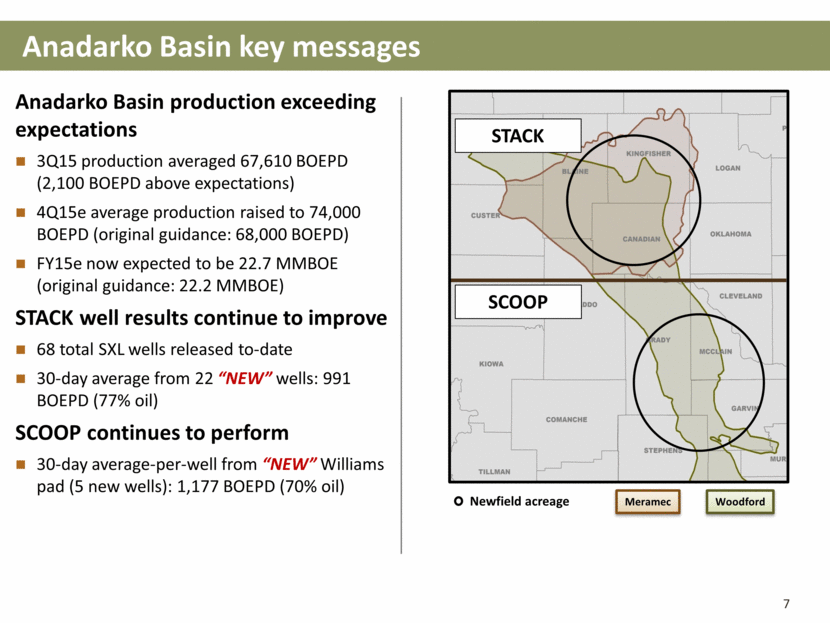
Anadarko Basin key messages Newfield acreage Meramec Woodford STACK SCOOP Anadarko Basin production exceeding expectations 3Q15 production averaged 67,610 BOEPD (2,100 BOEPD above expectations) 4Q15e average production raised to 74,000 BOEPD (original guidance: 68,000 BOEPD) FY15e now expected to be 22.7 MMBOE (original guidance: 22.2 MMBOE) STACK well results continue to improve 68 total SXL wells released to-date 30-day average from 22 “NEW” wells: 991 BOEPD (77% oil) SCOOP continues to perform 30-day average-per-well from “NEW” Williams pad (5 new wells): 1,177 BOEPD (70% oil)
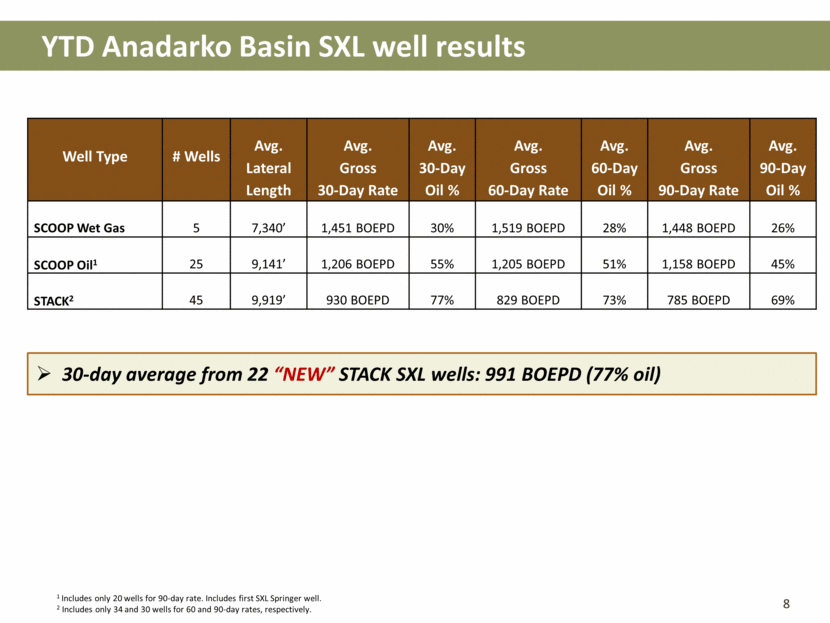
YTD Anadarko Basin SXL well results Well Type # Wells Avg. Lateral Length Avg. Gross 30-Day Rate Avg. 30-Day Oil % Avg. Gross 60-Day Rate Avg. 60-Day Oil % Avg. Gross 90-Day Rate Avg. 90-Day Oil % SCOOP Wet Gas 5 7,340’ 1,451 BOEPD 30% 1,519 BOEPD 28% 1,448 BOEPD 26% SCOOP Oil1 25 9,141’ 1,206 BOEPD 55% 1,205 BOEPD 51% 1,158 BOEPD 45% STACK2 45 9,919’ 930 BOEPD 77% 829 BOEPD 73% 785 BOEPD 69% 8 30-day average from 22 “NEW” STACK SXL wells: 991 BOEPD (77% oil) 1 Includes only 20 wells for 90-day rate. Includes first SXL Springer well. 2 Includes only 34 and 30 wells for 60 and 90-day rates, respectively.
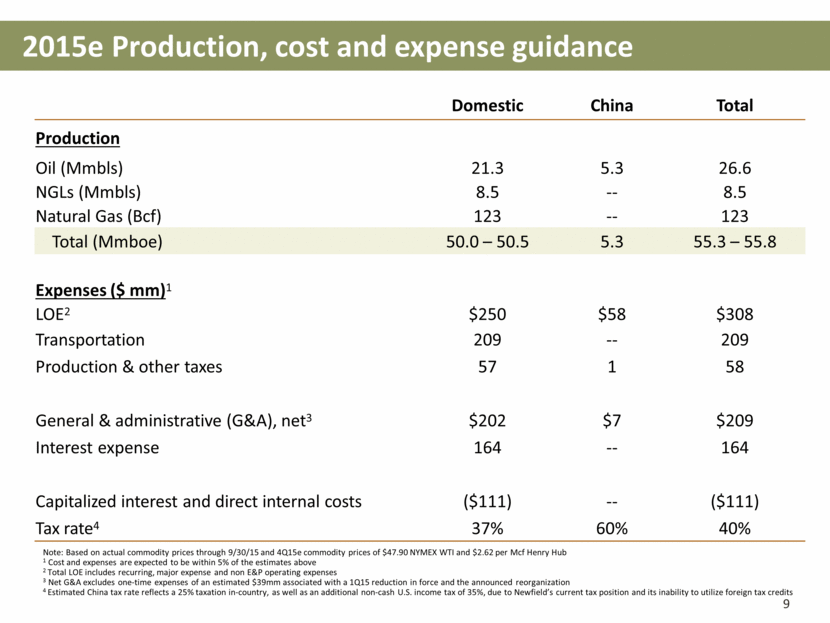
2015e Production, cost and expense guidance Domestic China Total Production Oil (Mmbls) 21.3 5.3 26.6 NGLs (Mmbls) 8.5 -- 8.5 Natural Gas (Bcf) 123 -- 123 Total (Mmboe) 50.0 – 50.5 5.3 55.3 – 55.8 Expenses ($ mm)1 LOE2 $250 $58 $308 Transportation 209 -- 209 Production & other taxes 57 1 58 General & administrative (G&A), net3 $202 $7 $209 Interest expense 164 -- 164 Capitalized interest and direct internal costs ($111) -- ($111) Tax rate4 37% 60% 40% Note: Based on actual commodity prices through 9/30/15 and 4Q15e commodity prices of $47.90 NYMEX WTI and $2.62 per Mcf Henry Hub 1 Cost and expenses are expected to be within 5% of the estimates above 2 Total LOE includes recurring, major expense and non E&P operating expenses 3 Net G&A excludes one-time expenses of an estimated $39mm associated with a 1Q15 reduction in force and the announced reorganization 4 Estimated China tax rate reflects a 25% taxation in-country, as well as an additional non-cash U.S. income tax of 35%, due to Newfield’s current tax position and its inability to utilize foreign tax credits
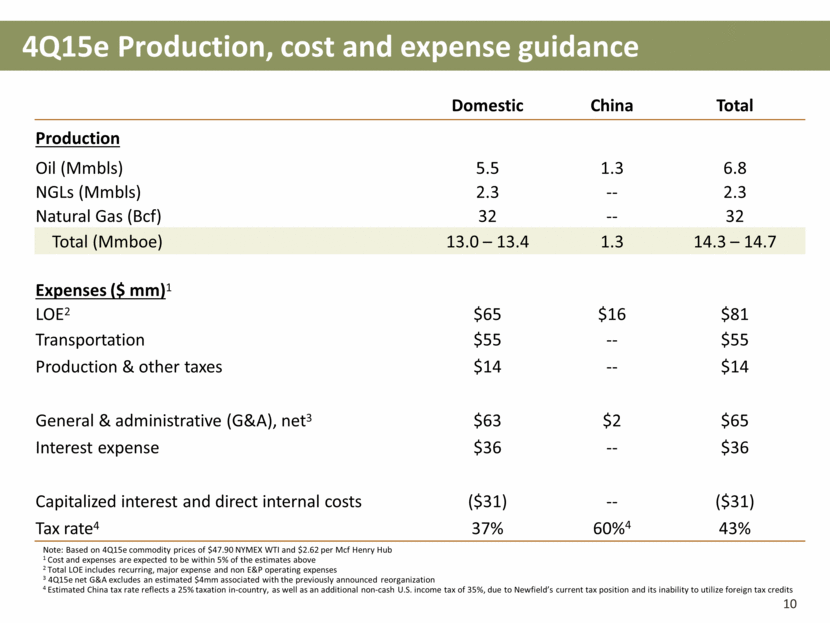
4Q15e Production, cost and expense guidance Domestic China Total Production Oil (Mmbls) 5.5 1.3 6.8 NGLs (Mmbls) 2.3 -- 2.3 Natural Gas (Bcf) 32 -- 32 Total (Mmboe) 13.0 – 13.4 1.3 14.3 – 14.7 Expenses ($ mm)1 LOE2 $65 $16 $81 Transportation $55 -- $55 Production & other taxes $14 -- $14 General & administrative (G&A), net3 $63 $2 $65 Interest expense $36 -- $36 Capitalized interest and direct internal costs ($31) -- ($31) Tax rate4 37% 60%4 43% Note: Based on 4Q15e commodity prices of $47.90 NYMEX WTI and $2.62 per Mcf Henry Hub 1 Cost and expenses are expected to be within 5% of the estimates above 2 Total LOE includes recurring, major expense and non E&P operating expenses 3 4Q15e net G&A excludes an estimated $4mm associated with the previously announced reorganization 4 Estimated China tax rate reflects a 25% taxation in-country, as well as an additional non-cash U.S. income tax of 35%, due to Newfield’s current tax position and its inability to utilize foreign tax credits 10
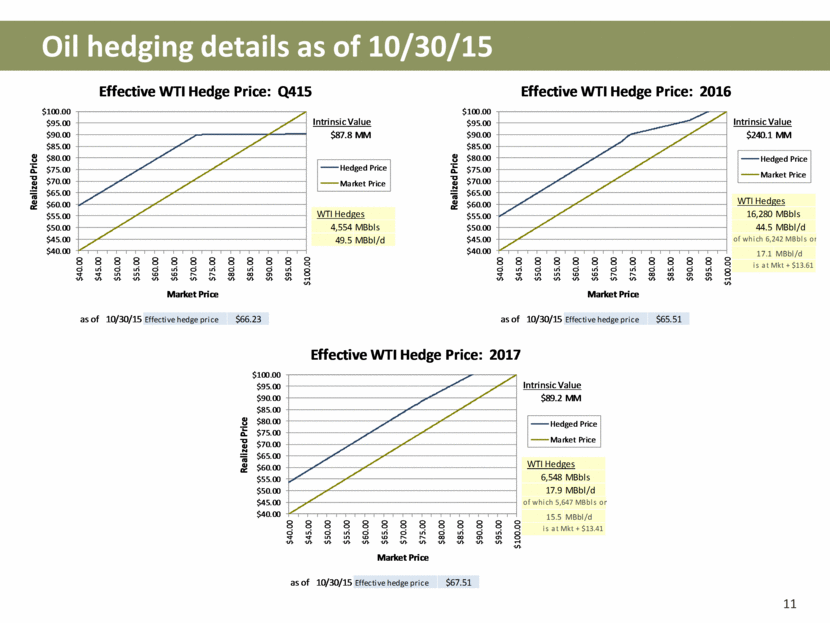
Oil hedging details as of 10/30/15 11 Intrinsic Value Intrinsic Value $87.8 MM $240.1 MM WTI Hedges WTI Hedges 16,280 MBbls 4,554 MBbls 44.5 MBbl/d 49.5 MBbl/d of which 6,242 MBbls or 17.1 MBbl/d is at Mkt + $13.61 as of 10/30/15 Effective hedge price $66.23 as of 10/30/15 Effective hedge price $65.51 Intrinsic Value $89.2 MM WTI Hedges 6,548 MBbls 17.9 MBbl/d of which 5,647 MBbls or 15.5 MBbl/d is at Mkt + $13.41 as of 10/30/15 Effective hedge price $67.51 $40.00 $45.00 $50.00 $55.00 $60.00 $65.00 $70.00 $75.00 $80.00 $85.00 $90.00 $95.00 $100.00 $40.00 $45.00 $50.00 $55.00 $60.00 $65.00 $70.00 $75.00 $80.00 $85.00 $90.00 $95.00 $100.00 Realized Price Market Price Effective WTI Hedge Price: Q415 Hedged Price Market Price $40.00 $45.00 $50.00 $55.00 $60.00 $65.00 $70.00 $75.00 $80.00 $85.00 $90.00 $95.00 $100.00 $40.00 $45.00 $50.00 $55.00 $60.00 $65.00 $70.00 $75.00 $80.00 $85.00 $90.00 $95.00 $100.00 Realized Price Market Price Effective WTI Hedge Price: 2016 Hedged Price Market Price $40.00 $45.00 $50.00 $55.00 $60.00 $65.00 $70.00 $75.00 $80.00 $85.00 $90.00 $95.00 $100.00 $40.00 $45.00 $50.00 $55.00 $60.00 $65.00 $70.00 $75.00 $80.00 $85.00 $90.00 $95.00 $100.00 Realized Price Market Price Effective WTI Hedge Price: 2017 Hedged Price Market Price
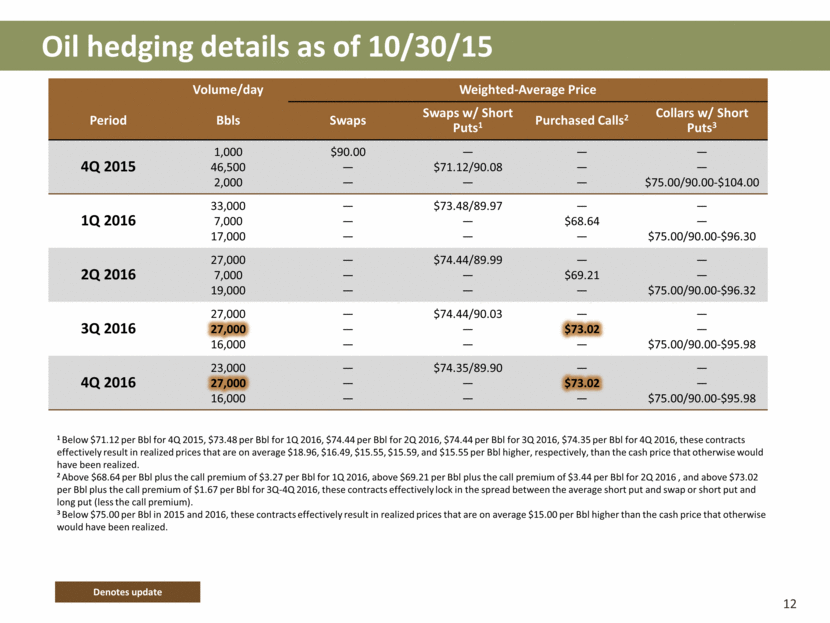
Volume/day Weighted-Average Price Period Bbls Swaps Swaps w/ Short Puts1 Purchased Calls2 Collars w/ Short Puts3 4Q 2015 1,000 46,500 2,000 $90.00 — — — $71.12/90.08 — — — — — — $75.00/90.00-$104.00 1Q 2016 33,000 7,000 17,000 — — — $73.48/89.97 — — — $68.64 — — — $75.00/90.00-$96.30 2Q 2016 27,000 7,000 19,000 — — — $74.44/89.99 — — — $69.21 — — — $75.00/90.00-$96.32 3Q 2016 27,000 27,000 16,000 — — — $74.44/90.03 — — — $73.02 — — — $75.00/90.00-$95.98 4Q 2016 23,000 27,000 16,000 — — — $74.35/89.90 — — — $73.02 — — — $75.00/90.00-$95.98 Oil hedging details as of 10/30/15 Denotes update 12 1 Below $71.12 per Bbl for 4Q 2015, $73.48 per Bbl for 1Q 2016, $74.44 per Bbl for 2Q 2016, $74.44 per Bbl for 3Q 2016, $74.35 per Bbl for 4Q 2016, these contracts effectively result in realized prices that are on average $18.96, $16.49, $15.55, $15.59, and $15.55 per Bbl higher, respectively, than the cash price that otherwise would have been realized. 2 Above $68.64 per Bbl plus the call premium of $3.27 per Bbl for 1Q 2016, above $69.21 per Bbl plus the call premium of $3.44 per Bbl for 2Q 2016 , and above $73.02 per Bbl plus the call premium of $1.67 per Bbl for 3Q-4Q 2016, these contracts effectively lock in the spread between the average short put and swap or short put and long put (less the call premium). 3 Below $75.00 per Bbl in 2015 and 2016, these contracts effectively result in realized prices that are on average $15.00 per Bbl higher than the cash price that otherwise would have been realized.
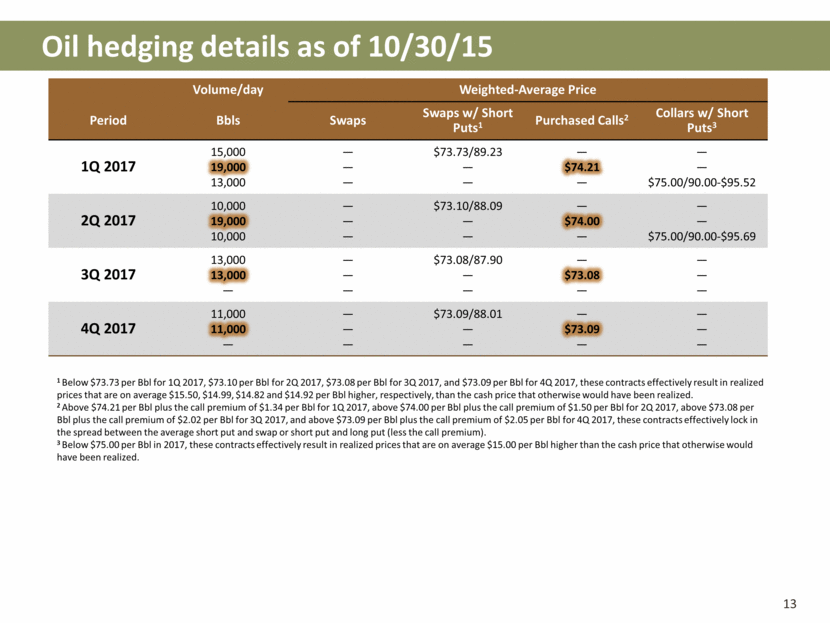
Oil hedging details as of 10/30/15 Volume/day Weighted-Average Price Period Bbls Swaps Swaps w/ Short Puts1 Purchased Calls2 Collars w/ Short Puts3 1Q 2017 15,000 19,000 13,000 — — — $73.73/89.23 — — — $74.21 — — — $75.00/90.00-$95.52 2Q 2017 10,000 19,000 10,000 — — — $73.10/88.09 — — — $74.00 — — — $75.00/90.00-$95.69 3Q 2017 13,000 13,000 — — — — $73.08/87.90 — — — $73.08 — — — — 4Q 2017 11,000 11,000 — — — — $73.09/88.01 — — — $73.09 — — — — 1 Below $73.73 per Bbl for 1Q 2017, $73.10 per Bbl for 2Q 2017, $73.08 per Bbl for 3Q 2017, and $73.09 per Bbl for 4Q 2017, these contracts effectively result in realized prices that are on average $15.50, $14.99, $14.82 and $14.92 per Bbl higher, respectively, than the cash price that otherwise would have been realized. 2 Above $74.21 per Bbl plus the call premium of $1.34 per Bbl for 1Q 2017, above $74.00 per Bbl plus the call premium of $1.50 per Bbl for 2Q 2017, above $73.08 per Bbl plus the call premium of $2.02 per Bbl for 3Q 2017, and above $73.09 per Bbl plus the call premium of $2.05 per Bbl for 4Q 2017, these contracts effectively lock in the spread between the average short put and swap or short put and long put (less the call premium). 3 Below $75.00 per Bbl in 2017, these contracts effectively result in realized prices that are on average $15.00 per Bbl higher than the cash price that otherwise would have been realized. 13
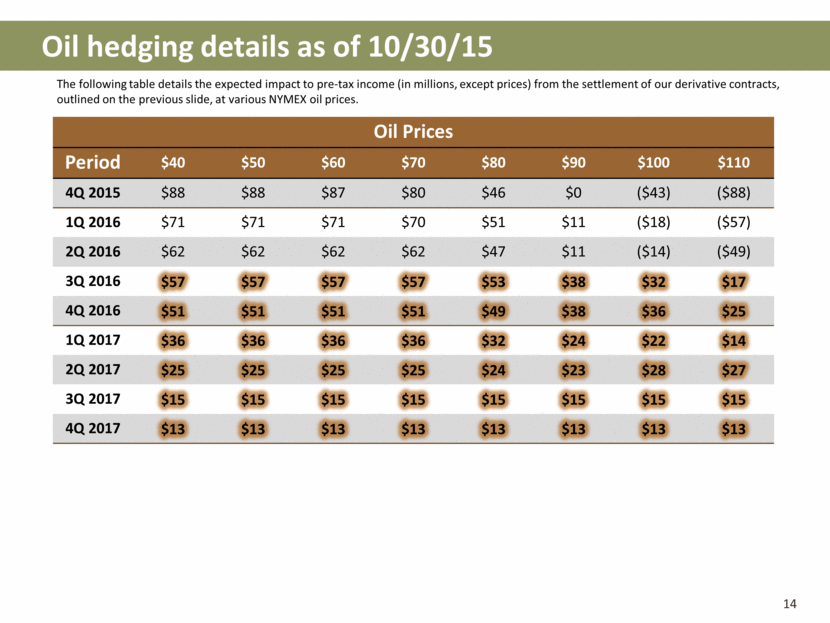
Oil hedging details as of 10/30/15 Oil Prices Period $40 $50 $60 $70 $80 $90 $100 $110 4Q 2015 $88 $88 $87 $80 $46 $0 ($43) ($88) 1Q 2016 $71 $71 $71 $70 $51 $11 ($18) ($57) 2Q 2016 $62 $62 $62 $62 $47 $11 ($14) ($49) 3Q 2016 $57 $57 $57 $57 $53 $38 $32 $17 4Q 2016 $51 $51 $51 $51 $49 $38 $36 $25 1Q 2017 $36 $36 $36 $36 $32 $24 $22 $14 2Q 2017 $25 $25 $25 $25 $24 $23 $28 $27 3Q 2017 $15 $15 $15 $15 $15 $15 $15 $15 4Q 2017 $13 $13 $13 $13 $13 $13 $13 $13 The following table details the expected impact to pre-tax income (in millions, except prices) from the settlement of our derivative contracts, outlined on the previous slide, at various NYMEX oil prices. 14
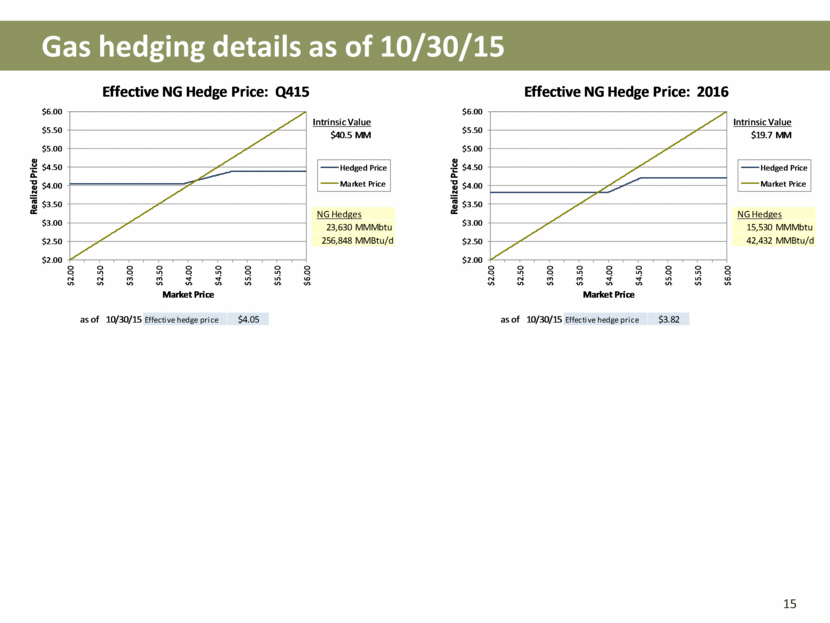
Gas hedging details as of 10/30/15 15 Intrinsic Value Intrinsic Value $40.5 MM $19.7 MM NG Hedges NG Hedges 23,630 MMMbtu 15,530 MMMbtu 256,848 MMBtu/d 42,432 MMBtu/d as of 10/30/15 Effective hedge price $4.05 as of 10/30/15 Effective hedge price $3.82 $2.00 $2.50 $3.00 $3.50 $4.00 $4.50 $5.00 $5.50 $6.00 $2.00 $2.50 $3.00 $3.50 $4.00 $4.50 $5.00 $5.50 $6.00 Realized Price Market Price Effective NG Hedge Price: Q415 Hedged Price Market Price $2.00 $2.50 $3.00 $3.50 $4.00 $4.50 $5.00 $5.50 $6.00 $2.00 $2.50 $3.00 $3.50 $4.00 $4.50 $5.00 $5.50 $6.00 Realized Price Market Price Effective NG Hedge Price: 2016 Hedged Price Market Price
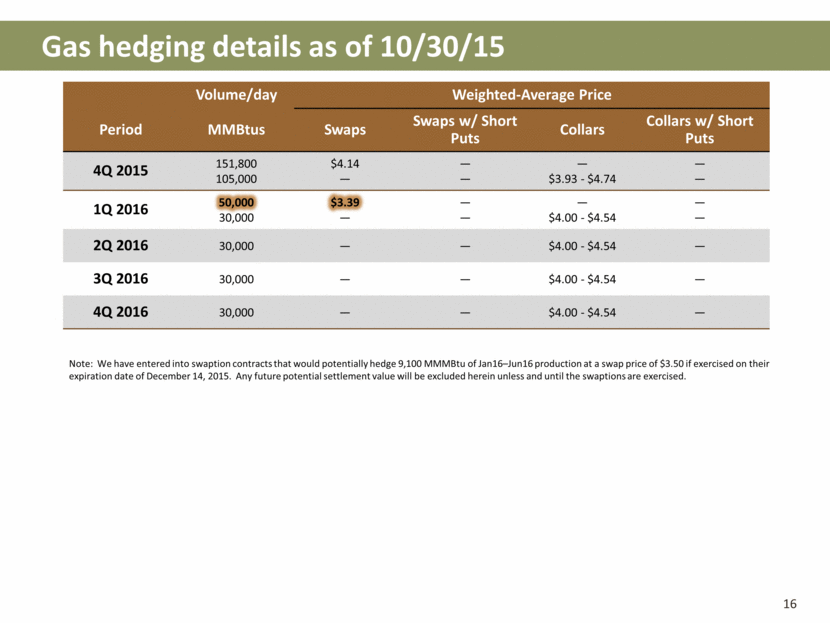
Gas hedging details as of 10/30/15 Volume/day Weighted-Average Price Period MMBtus Swaps Swaps w/ Short Puts Collars Collars w/ Short Puts 4Q 2015 151,800 105,000 $4.14 — — — — $3.93 - $4.74 — — 1Q 2016 50,000 30,000 $3.39 — — — — $4.00 - $4.54 — — 2Q 2016 30,000 — — $4.00 - $4.54 — 3Q 2016 30,000 — — $4.00 - $4.54 — 4Q 2016 30,000 — — $4.00 - $4.54 — Note: We have entered into swaption contracts that would potentially hedge 9,100 MMMBtu of Jan16–Jun16 production at a swap price of $3.50 if exercised on their expiration date of December 14, 2015. Any future potential settlement value will be excluded herein unless and until the swaptions are exercised. 16
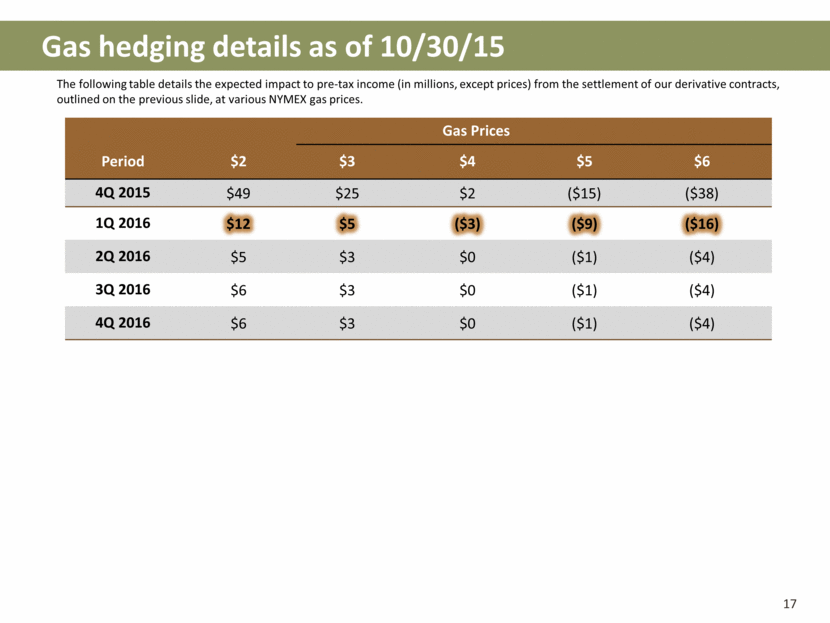
Gas hedging details as of 10/30/15 Gas Prices Period $2 $3 $4 $5 $6 4Q 2015 $49 $25 $2 ($15) ($38) 1Q 2016 $12 $5 ($3) ($9) ($16) 2Q 2016 $5 $3 $0 ($1) ($4) 3Q 2016 $6 $3 $0 ($1) ($4) 4Q 2016 $6 $3 $0 ($1) ($4) The following table details the expected impact to pre-tax income (in millions, except prices) from the settlement of our derivative contracts, outlined on the previous slide, at various NYMEX gas prices. 17
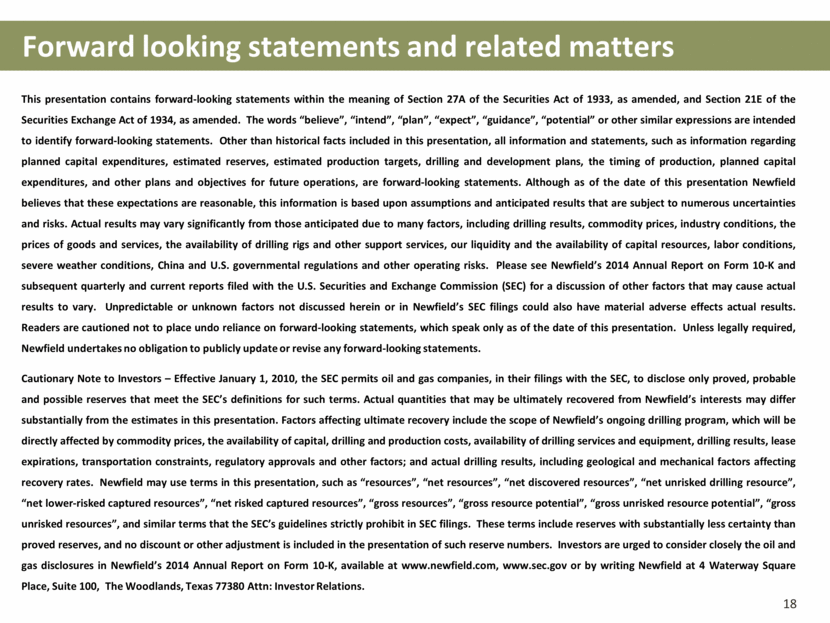
Forward looking statements and related matters 18 This presentation contains forward-looking statements within the meaning of Section 27A of the Securities Act of 1933, as amended, and Section 21E of the Securities Exchange Act of 1934, as amended. The words “believe”, “intend”, “plan”, “expect”, “guidance”, “potential” or other similar expressions are intended to identify forward-looking statements. Other than historical facts included in this presentation, all information and statements, such as information regarding planned capital expenditures, estimated reserves, estimated production targets, drilling and development plans, the timing of production, planned capital expenditures, and other plans and objectives for future operations, are forward-looking statements. Although as of the date of this presentation Newfield believes that these expectations are reasonable, this information is based upon assumptions and anticipated results that are subject to numerous uncertainties and risks. Actual results may vary significantly from those anticipated due to many factors, including drilling results, commodity prices, industry conditions, the prices of goods and services, the availability of drilling rigs and other support services, our liquidity and the availability of capital resources, labor conditions, severe weather conditions, China and U.S. governmental regulations and other operating risks. Please see Newfield’s 2014 Annual Report on Form 10-K and subsequent quarterly and current reports filed with the U.S. Securities and Exchange Commission (SEC) for a discussion of other factors that may cause actual results to vary. Unpredictable or unknown factors not discussed herein or in Newfield’s SEC filings could also have material adverse effects actual results. Readers are cautioned not to place undo reliance on forward-looking statements, which speak only as of the date of this presentation. Unless legally required, Newfield undertakes no obligation to publicly update or revise any forward-looking statements. Cautionary Note to Investors – Effective January 1, 2010, the SEC permits oil and gas companies, in their filings with the SEC, to disclose only proved, probable and possible reserves that meet the SEC’s definitions for such terms. Actual quantities that may be ultimately recovered from Newfield’s interests may differ substantially from the estimates in this presentation. Factors affecting ultimate recovery include the scope of Newfield’s ongoing drilling program, which will be directly affected by commodity prices, the availability of capital, drilling and production costs, availability of drilling services and equipment, drilling results, lease expirations, transportation constraints, regulatory approvals and other factors; and actual drilling results, including geological and mechanical factors affecting recovery rates. Newfield may use terms in this presentation, such as “resources”, “net resources”, “net discovered resources”, “net unrisked drilling resource”, “net lower-risked captured resources”, “net risked captured resources”, “gross resources”, “gross resource potential”, “gross unrisked resource potential”, “gross unrisked resources”, and similar terms that the SEC’s guidelines strictly prohibit in SEC filings. These terms include reserves with substantially less certainty than proved reserves, and no discount or other adjustment is included in the presentation of such reserve numbers. Investors are urged to consider closely the oil and gas disclosures in Newfield’s 2014 Annual Report on Form 10-K, available at www.newfield.com, www.sec.gov or by writing Newfield at 4 Waterway Square Place, Suite 100, The Woodlands, Texas 77380 Attn: Investor Relations.
