Attached files
| file | filename |
|---|---|
| 8-K - 8-K - EPIQ SYSTEMS INC | d61472d8k.htm |
| EX-99.1 - EX-99.1 - EPIQ SYSTEMS INC | d61472dex991.htm |
Third Quarter 2015 Earnings Conference Call November 3, 2015 NASDAQ: EPIQ www.epiqsystems.com Exhibit 99.2
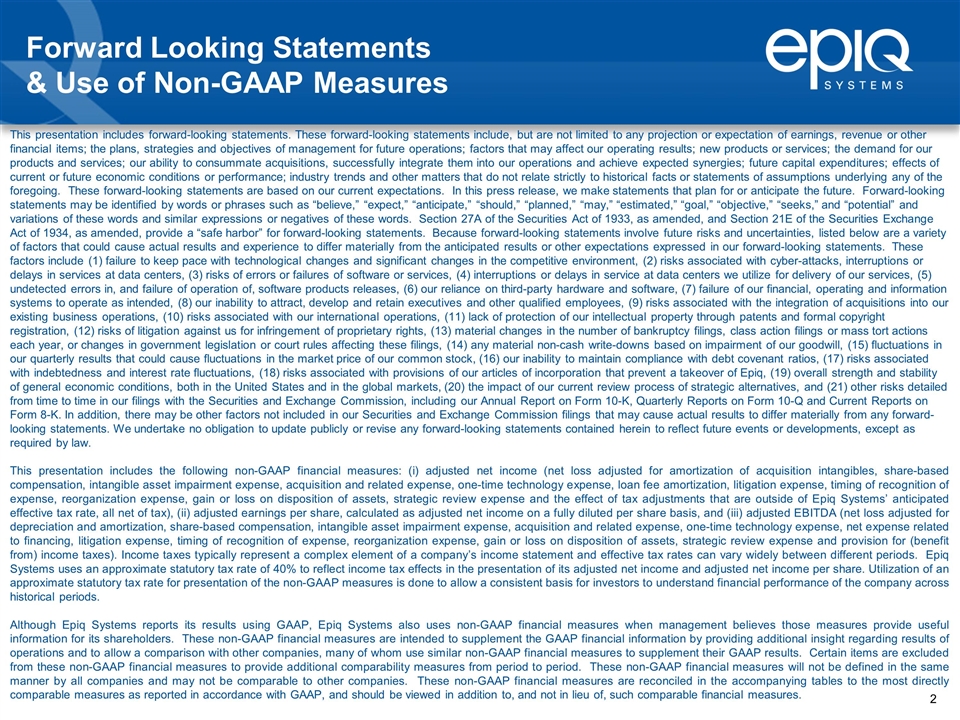
Forward Looking Statements & Use of Non-GAAP Measures This presentation includes forward-looking statements. These forward-looking statements include, but are not limited to any projection or expectation of earnings, revenue or other financial items; the plans, strategies and objectives of management for future operations; factors that may affect our operating results; new products or services; the demand for our products and services; our ability to consummate acquisitions, successfully integrate them into our operations and achieve expected synergies; future capital expenditures; effects of current or future economic conditions or performance; industry trends and other matters that do not relate strictly to historical facts or statements of assumptions underlying any of the foregoing. These forward-looking statements are based on our current expectations. In this press release, we make statements that plan for or anticipate the future. Forward-looking statements may be identified by words or phrases such as “believe,” “expect,” “anticipate,” “should,” “planned,” “may,” “estimated,” “goal,” “objective,” “seeks,” and “potential” and variations of these words and similar expressions or negatives of these words. Section 27A of the Securities Act of 1933, as amended, and Section 21E of the Securities Exchange Act of 1934, as amended, provide a “safe harbor” for forward-looking statements. Because forward-looking statements involve future risks and uncertainties, listed below are a variety of factors that could cause actual results and experience to differ materially from the anticipated results or other expectations expressed in our forward-looking statements. These factors include (1) failure to keep pace with technological changes and significant changes in the competitive environment, (2) risks associated with cyber-attacks, interruptions or delays in services at data centers, (3) risks of errors or failures of software or services, (4) interruptions or delays in service at data centers we utilize for delivery of our services, (5) undetected errors in, and failure of operation of, software products releases, (6) our reliance on third-party hardware and software, (7) failure of our financial, operating and information systems to operate as intended, (8) our inability to attract, develop and retain executives and other qualified employees, (9) risks associated with the integration of acquisitions into our existing business operations, (10) risks associated with our international operations, (11) lack of protection of our intellectual property through patents and formal copyright registration, (12) risks of litigation against us for infringement of proprietary rights, (13) material changes in the number of bankruptcy filings, class action filings or mass tort actions each year, or changes in government legislation or court rules affecting these filings, (14) any material non-cash write-downs based on impairment of our goodwill, (15) fluctuations in our quarterly results that could cause fluctuations in the market price of our common stock, (16) our inability to maintain compliance with debt covenant ratios, (17) risks associated with indebtedness and interest rate fluctuations, (18) risks associated with provisions of our articles of incorporation that prevent a takeover of Epiq, (19) overall strength and stability of general economic conditions, both in the United States and in the global markets, (20) the impact of our current review process of strategic alternatives, and (21) other risks detailed from time to time in our filings with the Securities and Exchange Commission, including our Annual Report on Form 10-K, Quarterly Reports on Form 10-Q and Current Reports on Form 8-K. In addition, there may be other factors not included in our Securities and Exchange Commission filings that may cause actual results to differ materially from any forward-looking statements. We undertake no obligation to update publicly or revise any forward-looking statements contained herein to reflect future events or developments, except as required by law. This presentation includes the following non-GAAP financial measures: (i) adjusted net income (net loss adjusted for amortization of acquisition intangibles, share-based compensation, intangible asset impairment expense, acquisition and related expense, one-time technology expense, loan fee amortization, litigation expense, timing of recognition of expense, reorganization expense, gain or loss on disposition of assets, strategic review expense and the effect of tax adjustments that are outside of Epiq Systems’ anticipated effective tax rate, all net of tax), (ii) adjusted earnings per share, calculated as adjusted net income on a fully diluted per share basis, and (iii) adjusted EBITDA (net loss adjusted for depreciation and amortization, share-based compensation, intangible asset impairment expense, acquisition and related expense, one-time technology expense, net expense related to financing, litigation expense, timing of recognition of expense, reorganization expense, gain or loss on disposition of assets, strategic review expense and provision for (benefit from) income taxes). Income taxes typically represent a complex element of a company’s income statement and effective tax rates can vary widely between different periods. Epiq Systems uses an approximate statutory tax rate of 40% to reflect income tax effects in the presentation of its adjusted net income and adjusted net income per share. Utilization of an approximate statutory tax rate for presentation of the non-GAAP measures is done to allow a consistent basis for investors to understand financial performance of the company across historical periods. Although Epiq Systems reports its results using GAAP, Epiq Systems also uses non-GAAP financial measures when management believes those measures provide useful information for its shareholders. These non-GAAP financial measures are intended to supplement the GAAP financial information by providing additional insight regarding results of operations and to allow a comparison with other companies, many of whom use similar non-GAAP financial measures to supplement their GAAP results. Certain items are excluded from these non-GAAP financial measures to provide additional comparability measures from period to period. These non-GAAP financial measures will not be defined in the same manner by all companies and may not be comparable to other companies. These non-GAAP financial measures are reconciled in the accompanying tables to the most directly comparable measures as reported in accordance with GAAP, and should be viewed in addition to, and not in lieu of, such comparable financial measures.
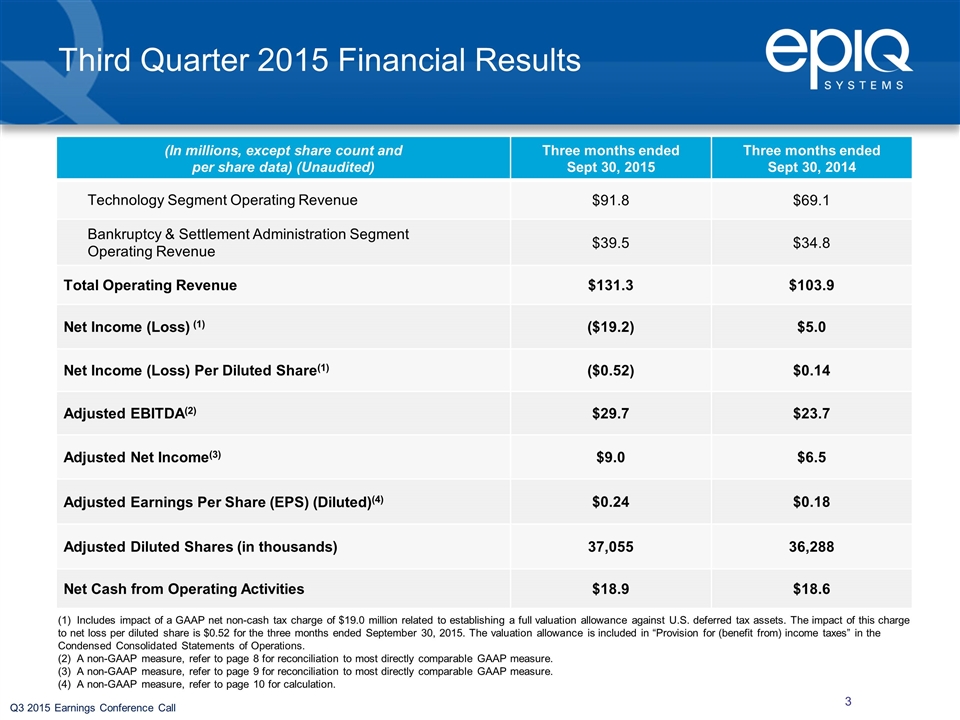
Q3 2015 Earnings Conference Call (1) Includes impact of a GAAP net non-cash tax charge of $19.0 million related to establishing a full valuation allowance against U.S. deferred tax assets. The impact of this charge to net loss per diluted share is $0.52 for the three months ended September 30, 2015. The valuation allowance is included in “Provision for (benefit from) income taxes” in the Condensed Consolidated Statements of Operations. (2) A non-GAAP measure, refer to page 8 for reconciliation to most directly comparable GAAP measure. (3) A non-GAAP measure, refer to page 9 for reconciliation to most directly comparable GAAP measure. (4) A non-GAAP measure, refer to page 10 for calculation. Third Quarter 2015 Financial Results (In millions, except share count and per share data) (Unaudited) Three months ended Sept 30, 2015 Three months ended Sept 30, 2014 Technology Segment Operating Revenue $91.8 $69.1 Bankruptcy & Settlement Administration Segment Operating Revenue $39.5 $34.8 Total Operating Revenue $131.3 $103.9 Net Income (Loss) (1) ($19.2) $5.0 Net Income (Loss) Per Diluted Share(1) ($0.52) $0.14 Adjusted EBITDA(2) $29.7 $23.7 Adjusted Net Income(3) $9.0 $6.5 Adjusted Earnings Per Share (EPS) (Diluted)(4) $0.24 $0.18 Adjusted Diluted Shares (in thousands) 37,055 36,288 Net Cash from Operating Activities $18.9 $18.6
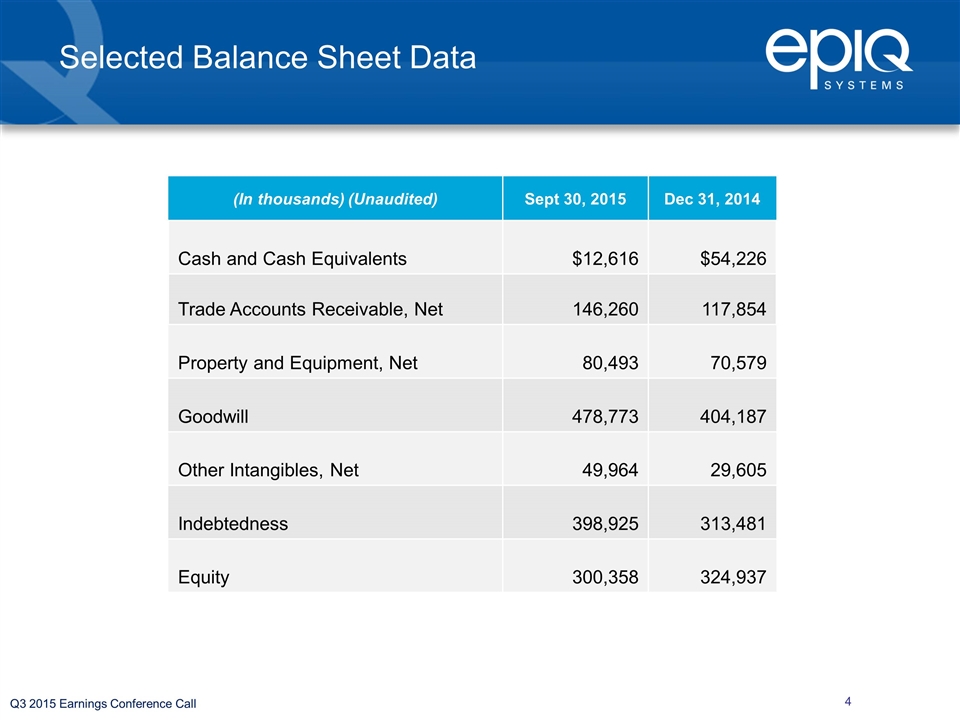
Q3 2015 Earnings Conference Call (In thousands) (Unaudited) Sept 30, 2015 Dec 31, 2014 Cash and Cash Equivalents $12,616 $54,226 Trade Accounts Receivable, Net 146,260 117,854 Property and Equipment, Net 80,493 70,579 Goodwill 478,773 404,187 Other Intangibles, Net 49,964 29,605 Indebtedness 398,925 313,481 Equity 300,358 324,937 Selected Balance Sheet Data
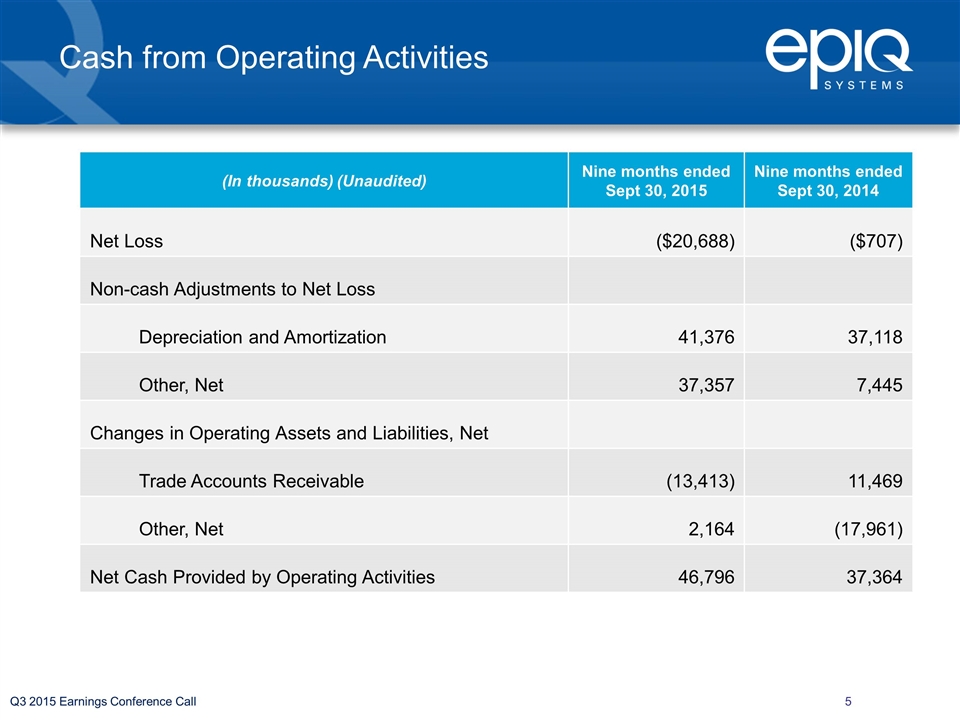
Q3 2015 Earnings Conference Call (In thousands) (Unaudited) Nine months ended Sept 30, 2015 Nine months ended Sept 30, 2014 Net Loss ($20,688) ($707) Non-cash Adjustments to Net Loss Depreciation and Amortization 41,376 37,118 Other, Net 37,357 7,445 Changes in Operating Assets and Liabilities, Net Trade Accounts Receivable (13,413) 11,469 Other, Net 2,164 (17,961) Net Cash Provided by Operating Activities 46,796 37,364 Cash from Operating Activities
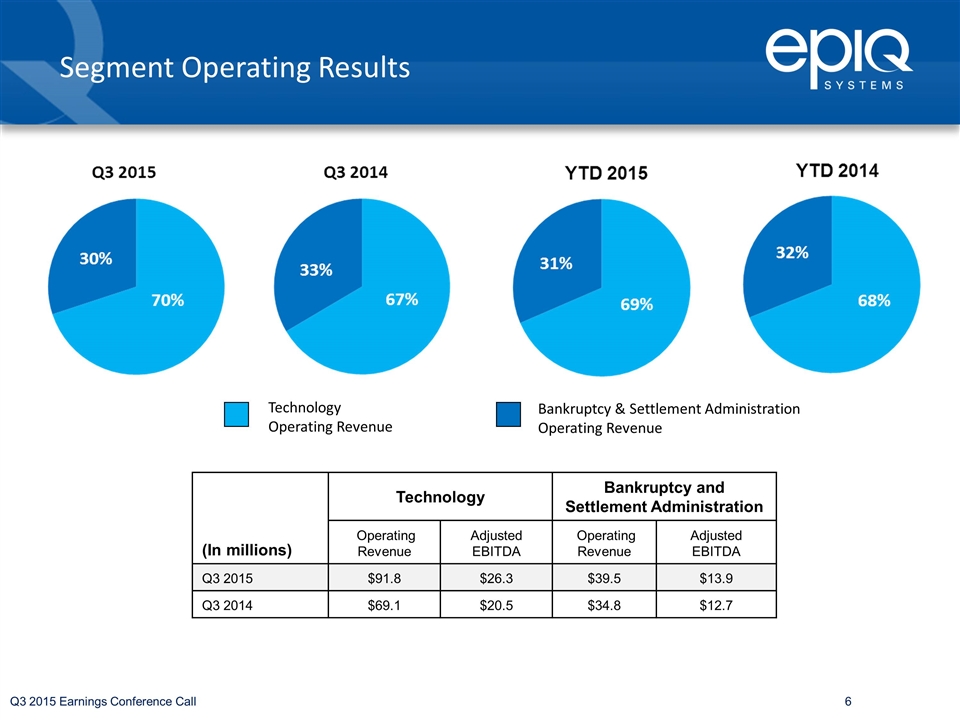
Q3 2015 Earnings Conference Call Segment Operating Results Technology Operating Revenue Bankruptcy & Settlement Administration Operating Revenue (In millions) Technology Bankruptcy and Settlement Administration Operating Revenue Adjusted EBITDA Operating Revenue Adjusted EBITDA Q3 2015 $91.8 $26.3 $39.5 $13.9 Q3 2014 $69.1 $20.5 $34.8 $12.7 6
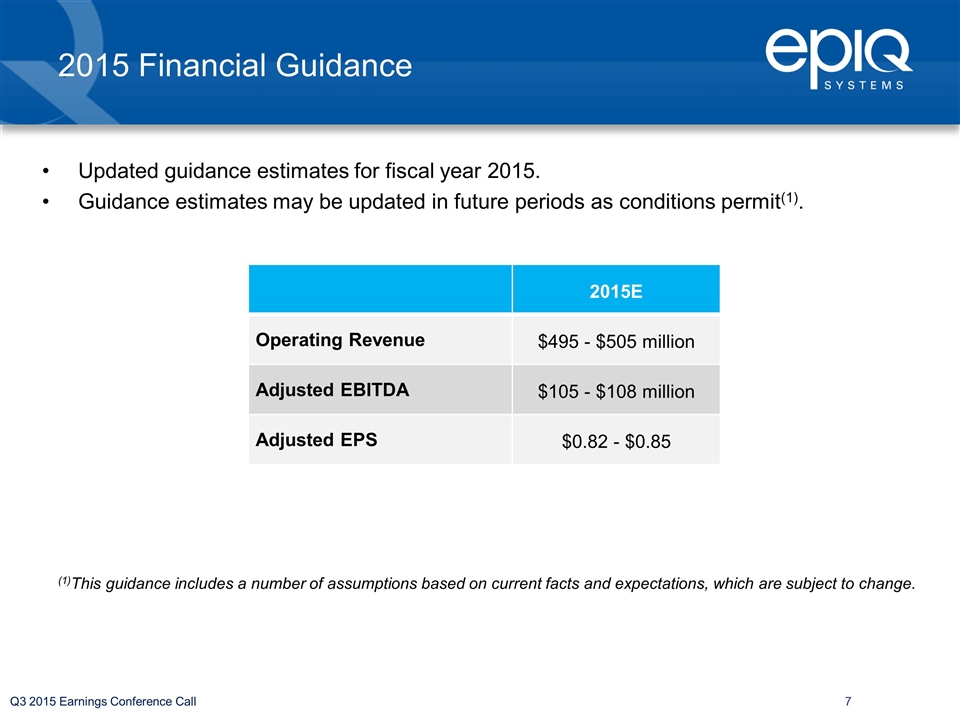
2015 Financial Guidance Updated guidance estimates for fiscal year 2015. Guidance estimates may be updated in future periods as conditions permit(1). 2015E Operating Revenue $495 - $505 million Adjusted EBITDA $105 - $108 million Adjusted EPS $0.82 - $0.85 (1)This guidance includes a number of assumptions based on current facts and expectations, which are subject to change. Q3 2015 Earnings Conference Call
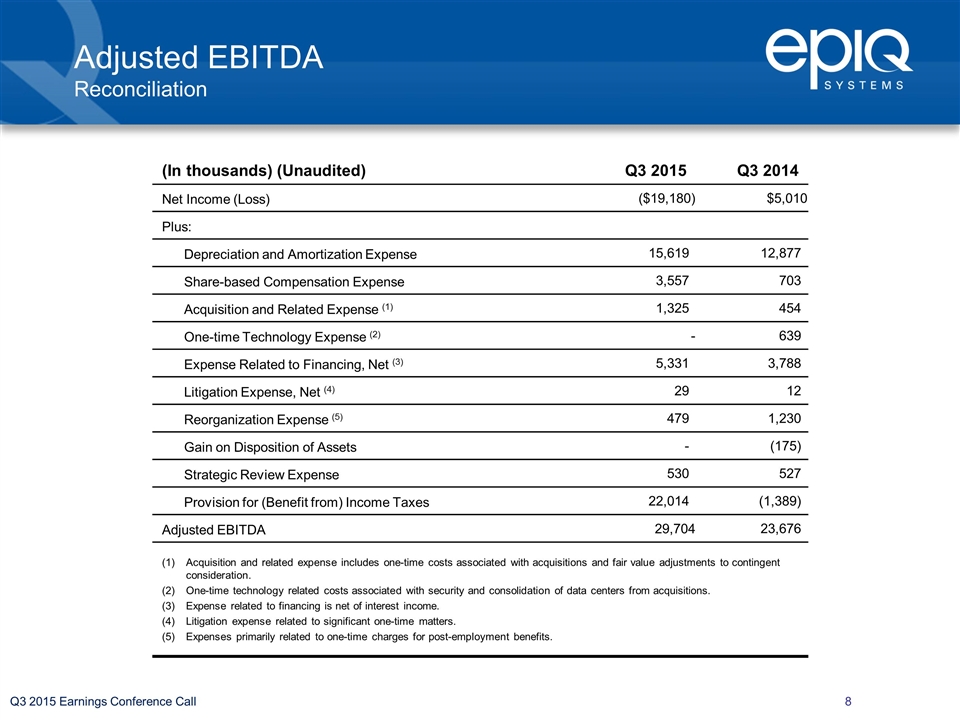
Q3 2015 Earnings Conference Call (In thousands) (Unaudited) Q3 2015 Q3 2014 Net Income (Loss) ($19,180) $5,010 Plus: Depreciation and Amortization Expense 15,619 12,877 Share-based Compensation Expense 3,557 703 Acquisition and Related Expense (1) 1,325 454 One-time Technology Expense (2) - 639 Expense Related to Financing, Net (3) 5,331 3,788 Litigation Expense, Net (4) 29 12 Reorganization Expense (5) 479 1,230 Gain on Disposition of Assets - (175) Strategic Review Expense 530 527 Provision for (Benefit from) Income Taxes 22,014 (1,389) Adjusted EBITDA 29,704 23,676 Acquisition and related expense includes one-time costs associated with acquisitions and fair value adjustments to contingent consideration. One-time technology related costs associated with security and consolidation of data centers from acquisitions. Expense related to financing is net of interest income. Litigation expense related to significant one-time matters. Expenses primarily related to one-time charges for post-employment benefits. Adjusted EBITDA Reconciliation
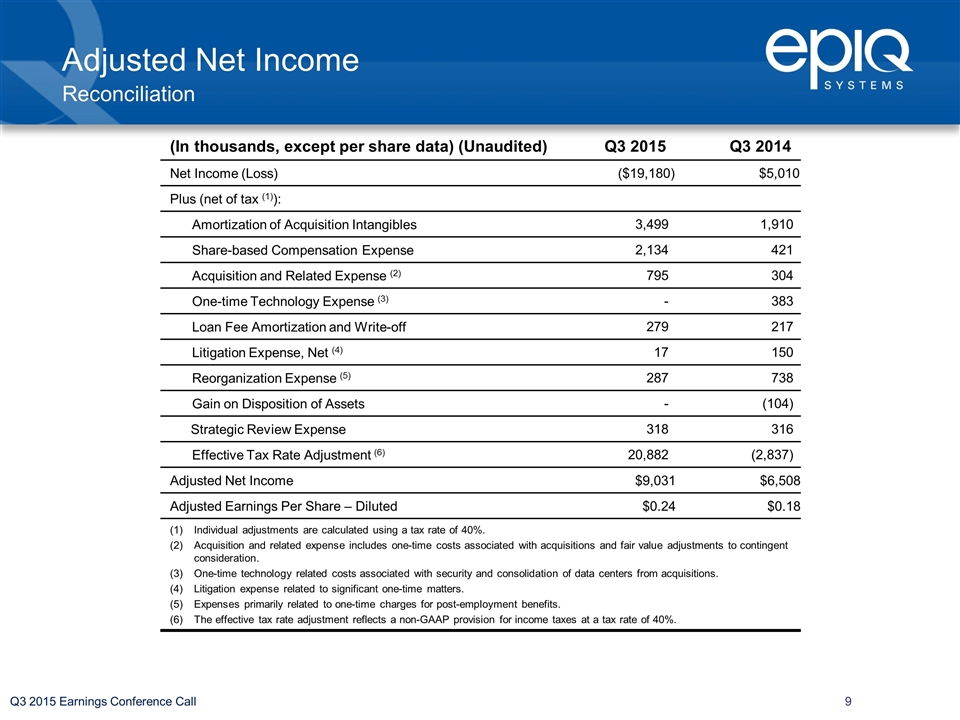
Q3 2015 Earnings Conference Call (In thousands, except per share data) (Unaudited) Q3 2015 Q3 2014 Net Income (Loss) ($19,180) $5,010 Plus (net of tax (1)): Amortization of Acquisition Intangibles 3,499 1,910 Share-based CompensationExpense 2,134 421 Acquisition and Related Expense (2) 795 304 One-time Technology Expense (3) - 383 Loan Fee Amortization and Write-off 279 217 Litigation Expense, Net (4) 17 150 Reorganization Expense (5) 287 738 Gain on Disposition of Assets - (104) Strategic Review Expense 318 316 Effective Tax Rate Adjustment (6) 20,882 (2,837) Adjusted Net Income $9,031 $6,508 Adjusted Earnings Per Share – Diluted $0.24 $0.18 Individual adjustments are calculated using a tax rate of 40%. Acquisition and related expense includes one-time costs associated with acquisitions and fair value adjustments to contingent consideration. One-time technology related costs associated with security and consolidation of data centers from acquisitions. Litigation expense related to significant one-time matters. Expenses primarily related to one-time charges for post-employment benefits. The effective tax rate adjustment reflects a non-GAAP provision for income taxes at a tax rate of 40%. Adjusted Net Income Reconciliation
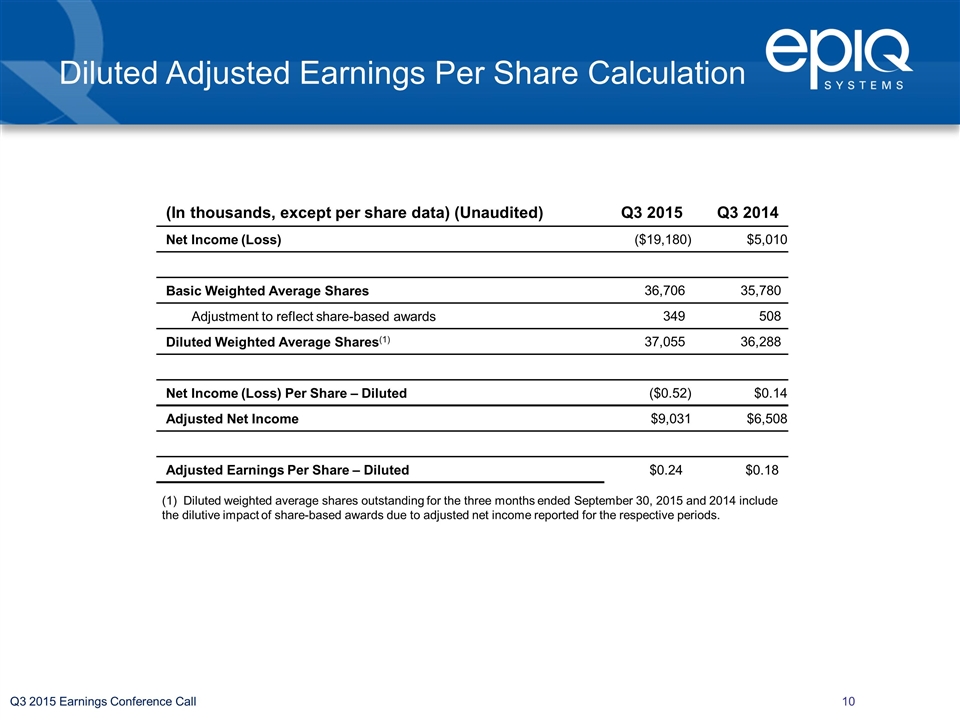
Q3 2015 Earnings Conference Call (In thousands, except per share data) (Unaudited) Q3 2015 Q3 2014 Net Income (Loss) ($19,180) $5,010 Basic Weighted Average Shares 36,706 35,780 Adjustment to reflect share-based awards 349 508 Diluted Weighted Average Shares(1) 37,055 36,288 Net Income (Loss) Per Share – Diluted ($0.52) $0.14 Adjusted Net Income $9,031 $6,508 Adjusted Earnings Per Share – Diluted $0.24 $0.18 Diluted Adjusted Earnings Per Share Calculation (1) Diluted weighted average shares outstanding for the three months ended September 30, 2015 and 2014 include the dilutive impact of share-based awards due to adjusted net income reported for the respective periods.
Investor Contacts Kelly Bailey Epiq Systems (913) 621-9500 IR@epiqsystems.com Chris Eddy Catalyst Global (212) 924-9800 epiq@catalyst-ir.com NASDAQ: EPIQ www.epiqsystems.com
