Attached files
| file | filename |
|---|---|
| 8-K - SHENANDOAH TELECOMMUNICATIONS COMPANY 8-K 10-30-2015 - SHENANDOAH TELECOMMUNICATIONS CO/VA/ | form8k.htm |

October 30, 2015 3Q 2015Earnings Conference Call
Safe Harbor Statement This presentation includes “forward-looking statements” within the meaning of Section 27A of the Securities Act and Section 21E of the Securities Exchange Act of 1934, as amended, regarding, among other things, our business strategy, our prospects and our financial position. These statements can be identified by the use of forward-looking terminology such as “believes,” “estimates,” “expects,” “intends,” “may,” “will,” “should,” “could,” or “anticipates” or the negative or other variation of these similar words, or by discussions of strategy or risks and uncertainties. These statements are based on current expectations of future events. If underlying assumptions prove inaccurate or unknown risks or uncertainties materialize, actual results could vary materially from the Company’s expectations and projections. Important factors that could cause actual results to differ materially from such forward-looking statements include, without limitation, risks related to the following: Increasing competition in the communications industry; andA complex and uncertain regulatory environment.A further list and description of these risks, uncertainties and other factors can be found in the Company’s SEC filings which are available online at www.sec.gov, www.shentel.com or on request from the Company. The Company does not undertake to update any forward-looking statements as a result of new information or future events or developments.
Use of Non-GAAP Financial Measures Included in this presentation are certain non-GAAP financial measures that are not determined in accordance with US generally accepted accounting principles. These financial performance measures are not indicative of cash provided or used by operating activities and exclude the effects of certain operating, capital and financing costs and may differ from comparable information provided by other companies, and they should not be considered in isolation, as an alternative to, or more meaningful than measures of financial performance determined in accordance with US generally accepted accounting principles. These financial performance measures are commonly used in the industry and are presented because Shentel believes they provide relevant and useful information to investors. Shentel utilizes these financial performance measures to assess its ability to meet future capital expenditure and working capital requirements, to incur indebtedness if necessary, return investment to shareholders and to fund continued growth. Shentel also uses these financial performance measures to evaluate the performance of its businesses and for budget planning purposes.

Chris FrenchPresident and CEO
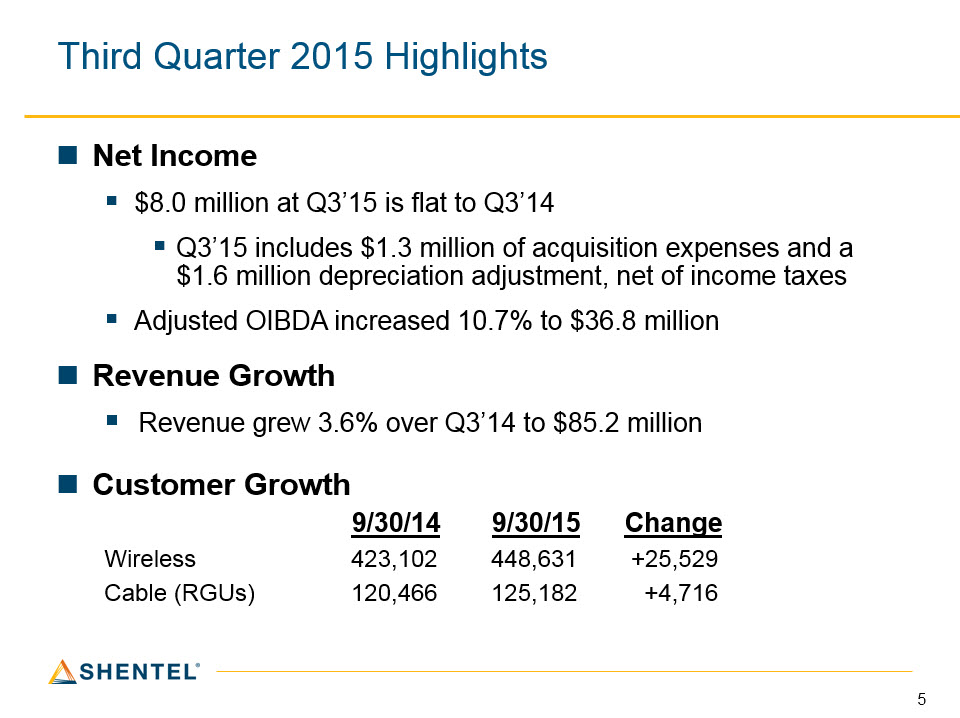
Third Quarter 2015 Highlights Net Income $8.0 million at Q3’15 is flat to Q3’14Q3’15 includes $1.3 million of acquisition expenses and a $1.6 million depreciation adjustment, net of income taxesAdjusted OIBDA increased 10.7% to $36.8 millionRevenue Growth Revenue grew 3.6% over Q3’14 to $85.2 millionCustomer Growth 9/30/14 9/30/15 ChangeWireless 423,102 448,631 +25,529Cable (RGUs) 120,466 125,182 +4,716
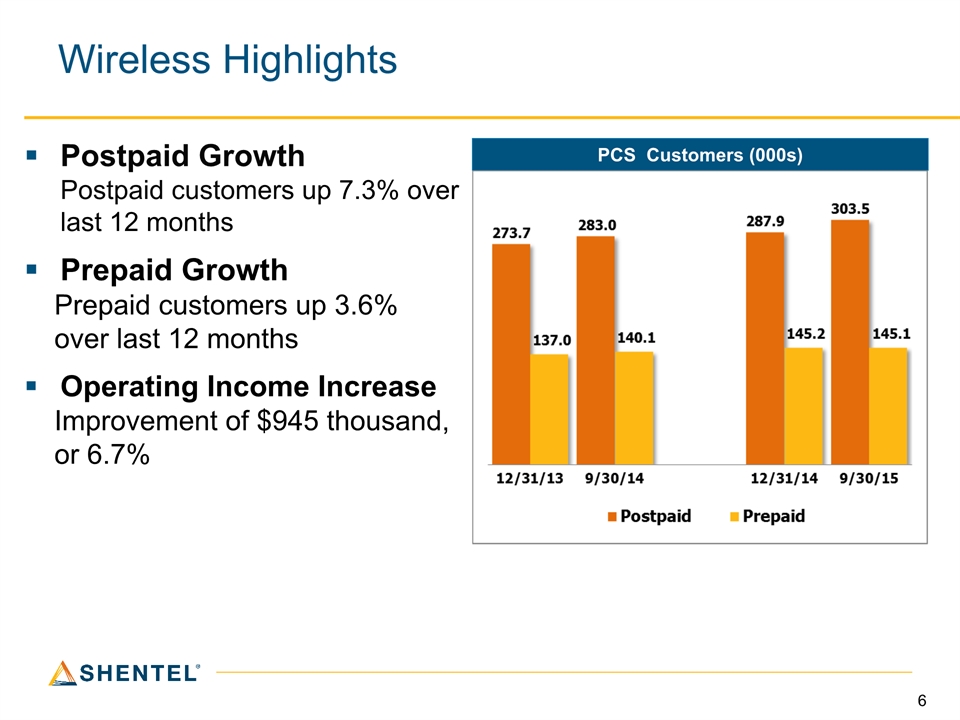
Wireless Highlights PCS Customers (000s) Postpaid Growth Postpaid customers up 7.3% over last 12 monthsPrepaid GrowthPrepaid customers up 3.6% over last 12 monthsOperating Income IncreaseImprovement of $945 thousand, or 6.7%
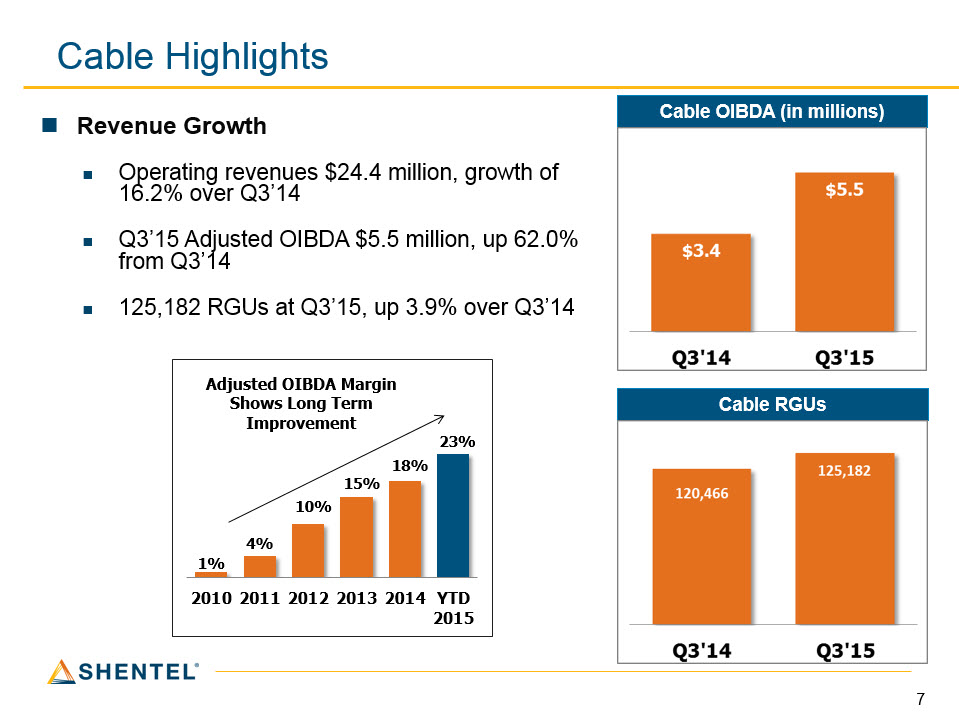
Cable Highlights Revenue GrowthOperating revenues $24.4 million, growth of 16.2% over Q3’14Q3’15 Adjusted OIBDA $5.5 million, up 62.0% from Q3’14125,182 RGUs at Q3’15, up 3.9% over Q3’14 Cable OIBDA (in millions) Cable RGUs
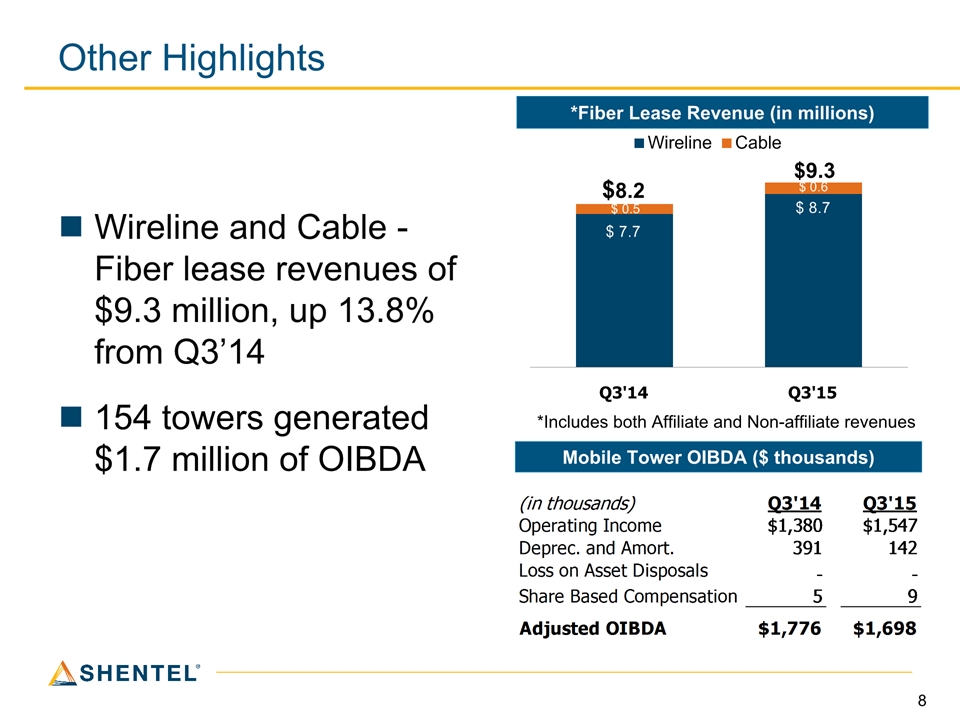
Other Highlights Wireline and Cable -Fiber lease revenues of $9.3 million, up 13.8% from Q3’14154 towers generated $1.7 million of OIBDA *Fiber Lease Revenue (in millions) Mobile Tower OIBDA ($ thousands) *Includes both Affiliate and Non-affiliate revenues
NTELOS Transaction Status Retail Syndication of the credit facilities oversubscribed without any change in termsRegulatory Approvals Early termination of Hart-Scott-Rodino reviewAll state regulatory approvals receivedFCC transfer application is expected to go on public notice soonIntegrationExtended employment offers to nTelos employeesOn track to close in early 2016

Adele SkolitsVP of Finance and CFO
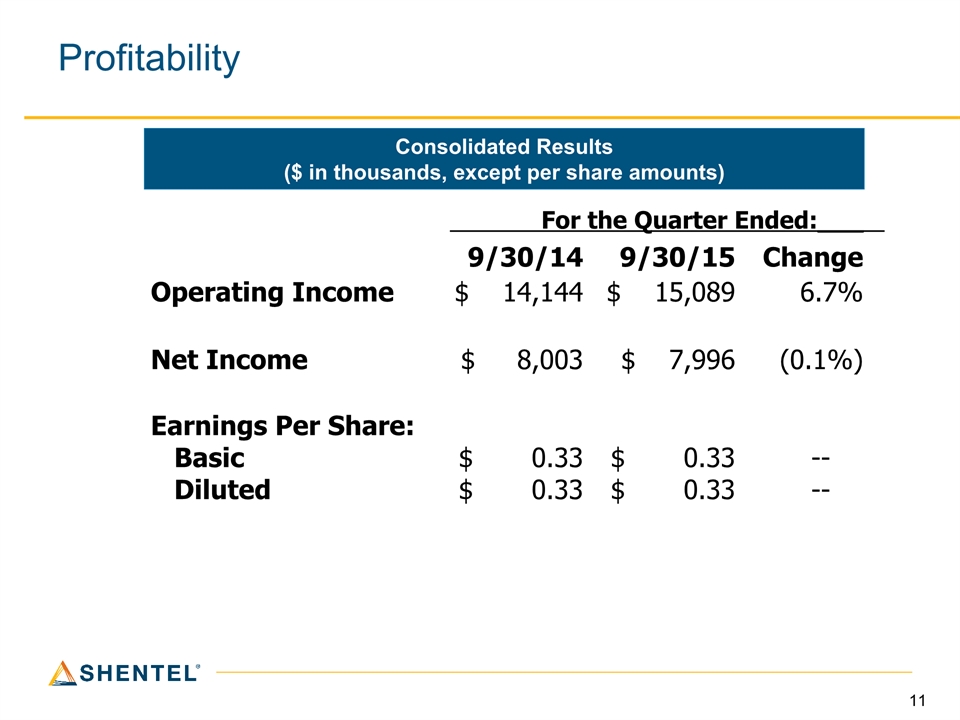
Profitability Consolidated Results($ in thousands, except per share amounts) 9/30/14 9/30/15 Change Operating Income $ 14,144 $ 15,089 6.7% Net Income $ 8,003 $ 7,996 (0.1%) Earnings Per Share: Basic Diluted $ 0.33$ 0.33 $ 0.33 $ 0.33 -- -- For the Quarter Ended:___
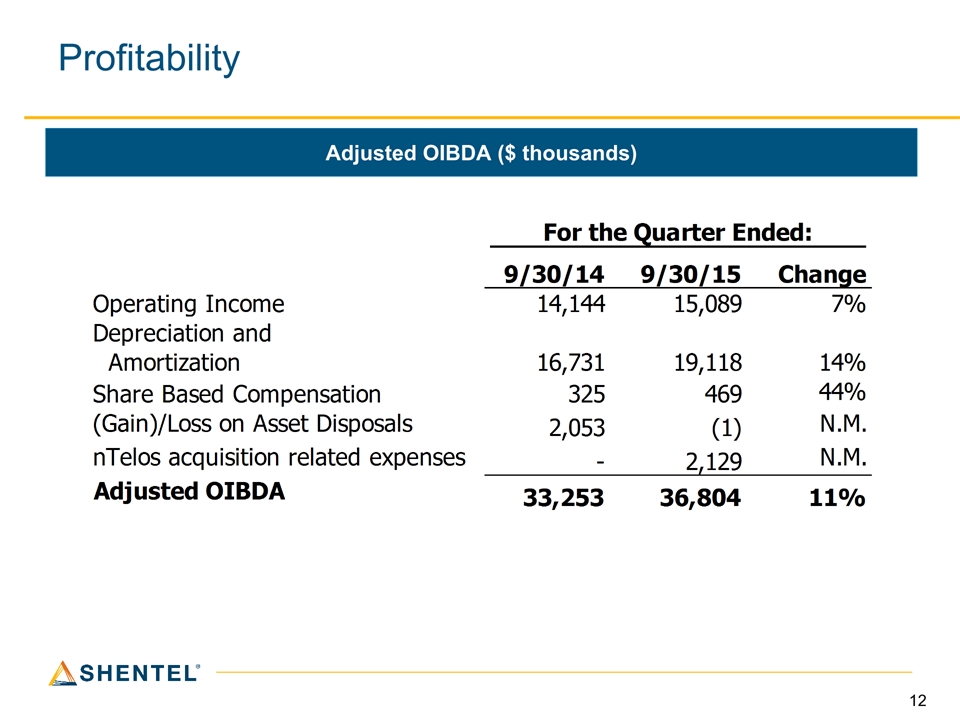
Profitability Adjusted OIBDA ($ thousands)
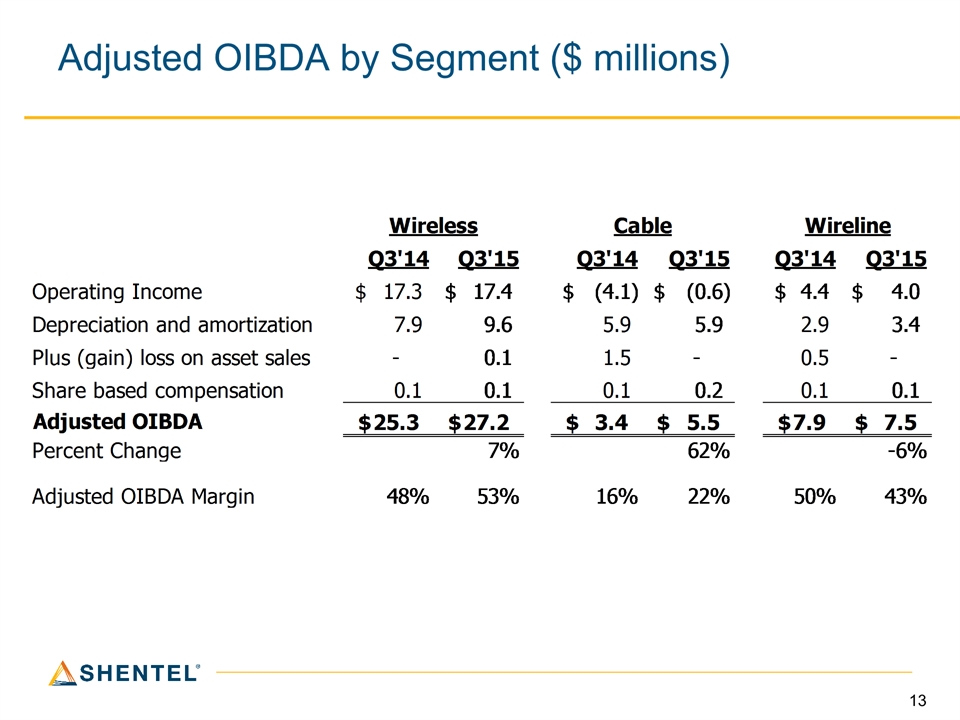
Adjusted OIBDA by Segment ($ millions)
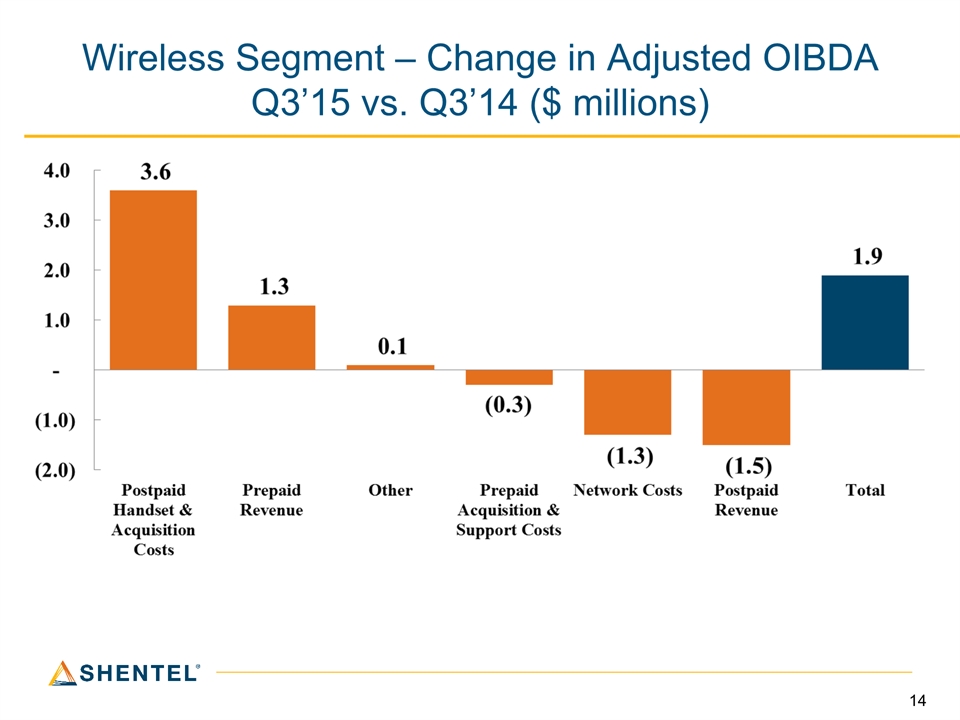
Wireless Segment – Change in Adjusted OIBDA Q3’15 vs. Q3’14 ($ millions)
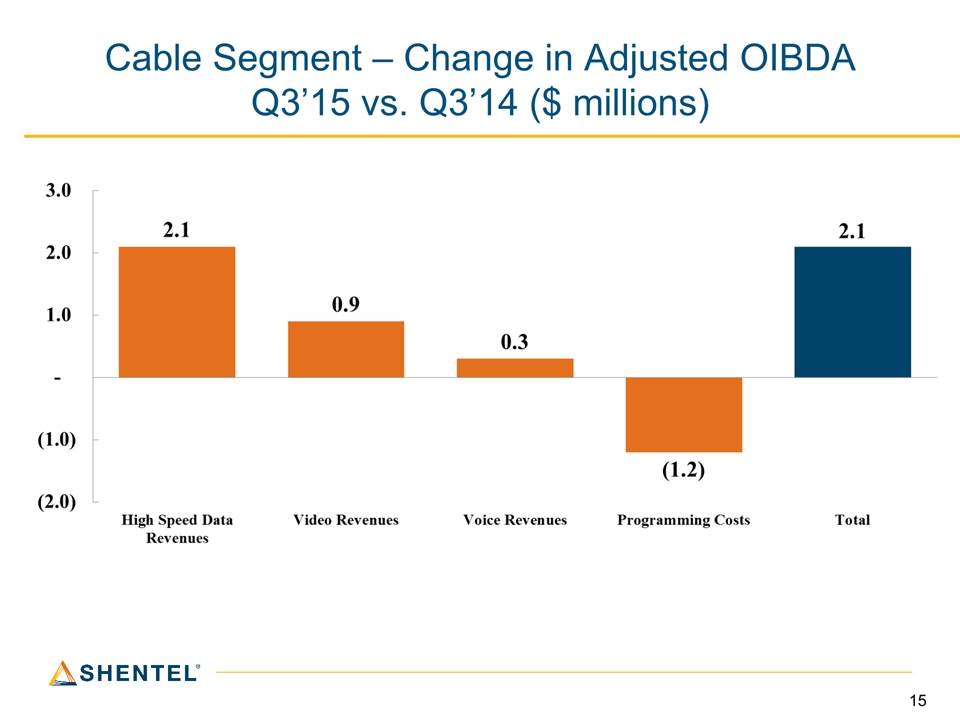
Cable Segment – Change in Adjusted OIBDA Q3’15 vs. Q3’14 ($ millions)

Earle MacKenzieEVP and COO
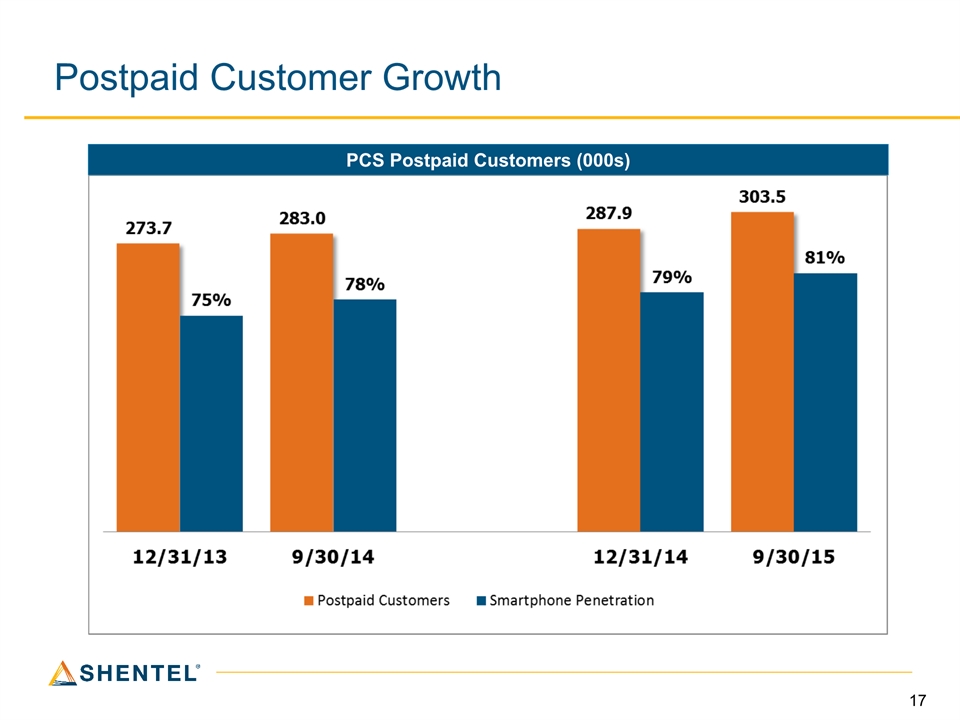
Postpaid Customer Growth PCS Postpaid Customers (000s)
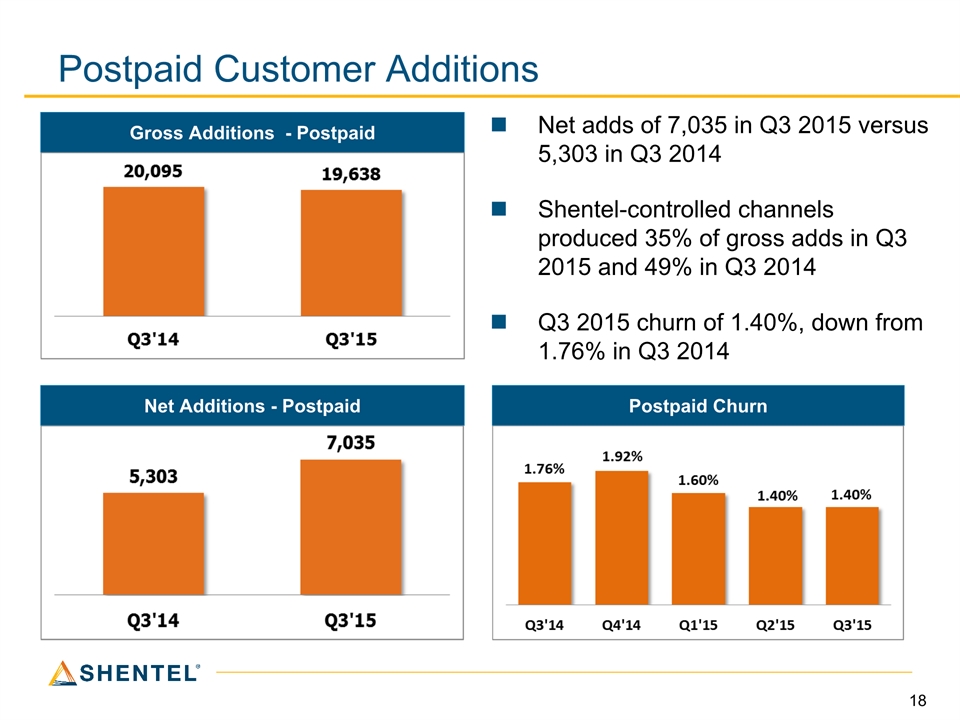
Postpaid Customer Additions Net Additions - Postpaid Gross Additions - Postpaid Net adds of 7,035 in Q3 2015 versus 5,303 in Q3 2014Shentel-controlled channels produced 35% of gross adds in Q3 2015 and 49% in Q3 2014Q3 2015 churn of 1.40%, down from 1.76% in Q3 2014 Postpaid Churn
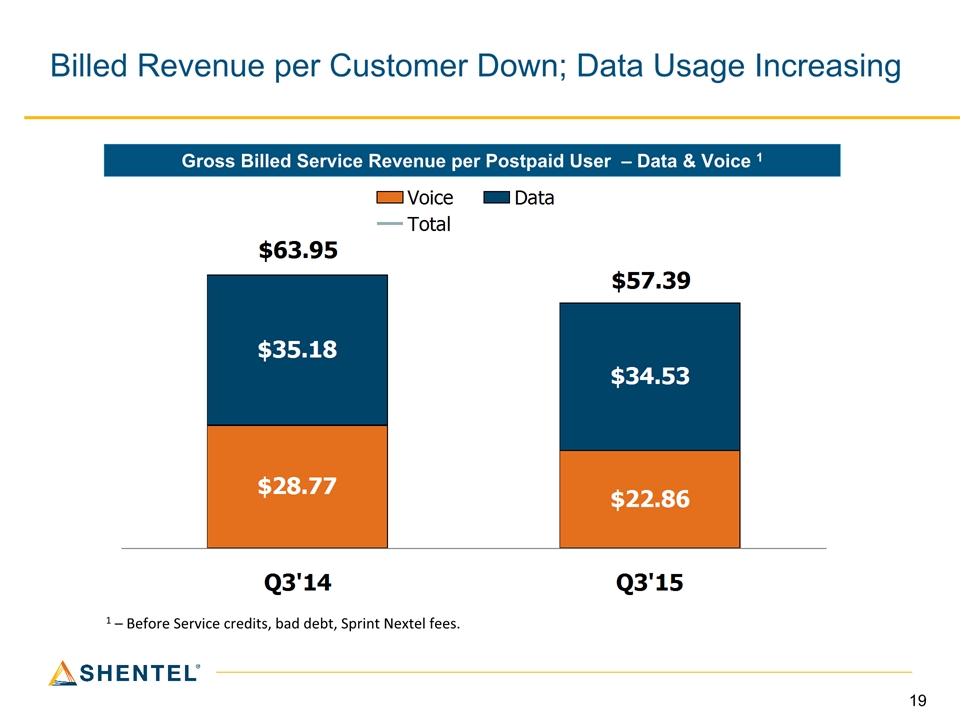
Billed Revenue per Customer Down; Data Usage Increasing Gross Billed Service Revenue per Postpaid User – Data & Voice 1 1 – Before Service credits, bad debt, Sprint Nextel fees.
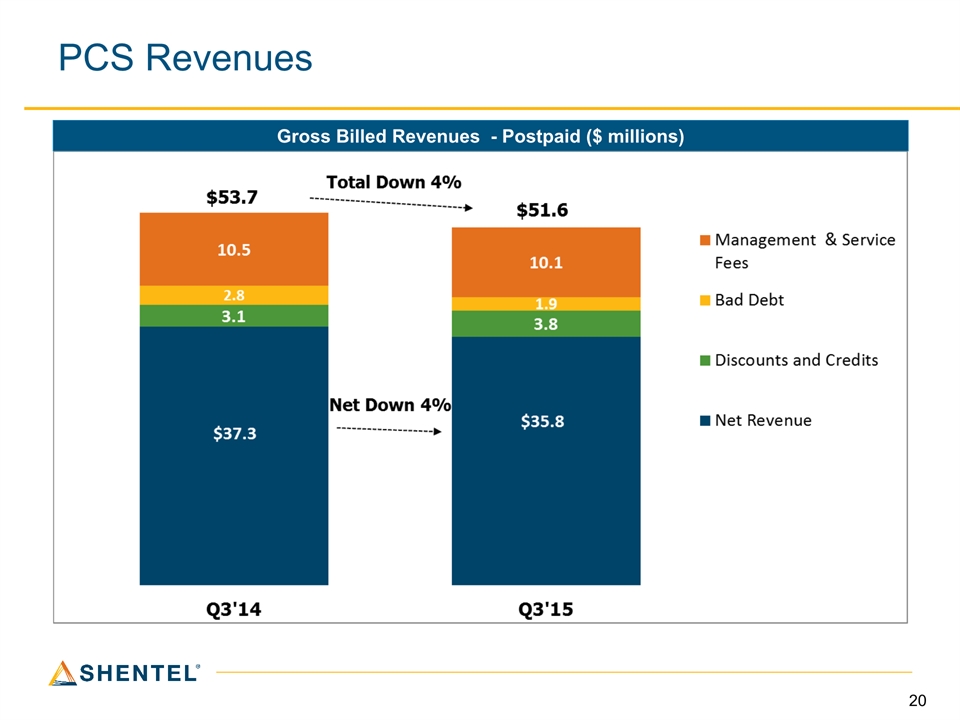
PCS Revenues Gross Billed Revenues - Postpaid ($ millions) *
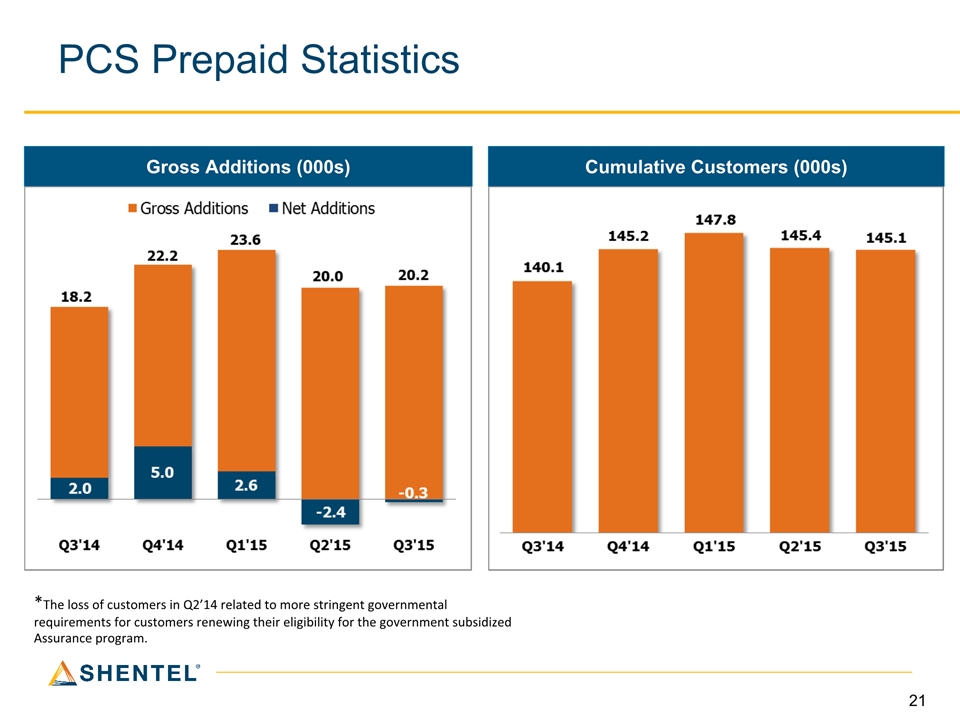
PCS Prepaid Statistics Gross Additions (000s) Cumulative Customers (000s) *The loss of customers in Q2’14 related to more stringent governmental requirements for customers renewing their eligibility for the government subsidized Assurance program.
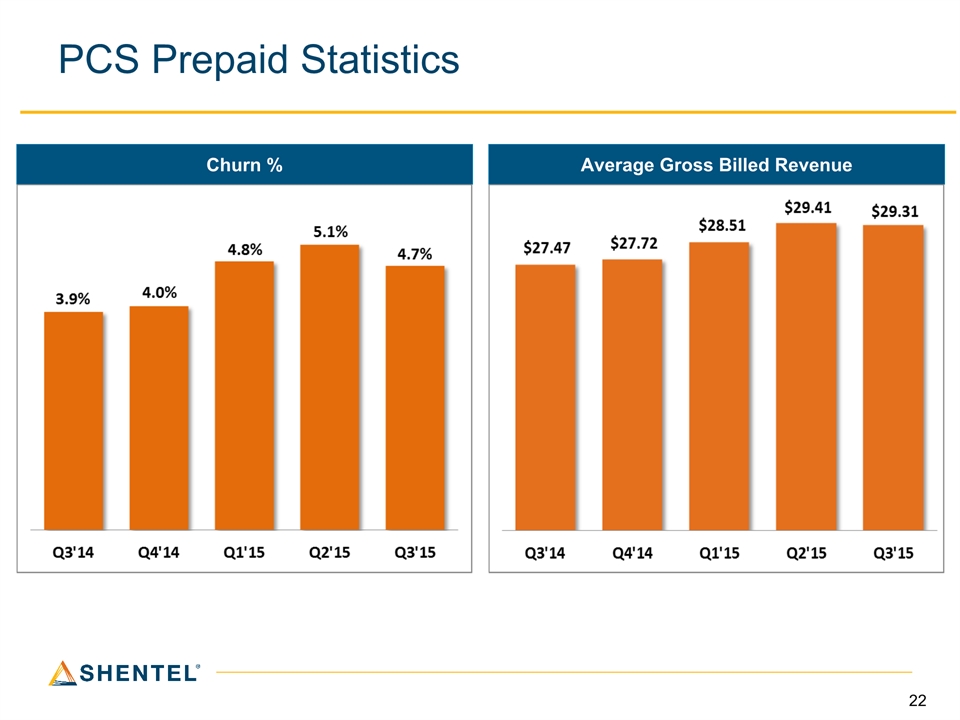
PCS Prepaid Statistics Churn % Average Gross Billed Revenue
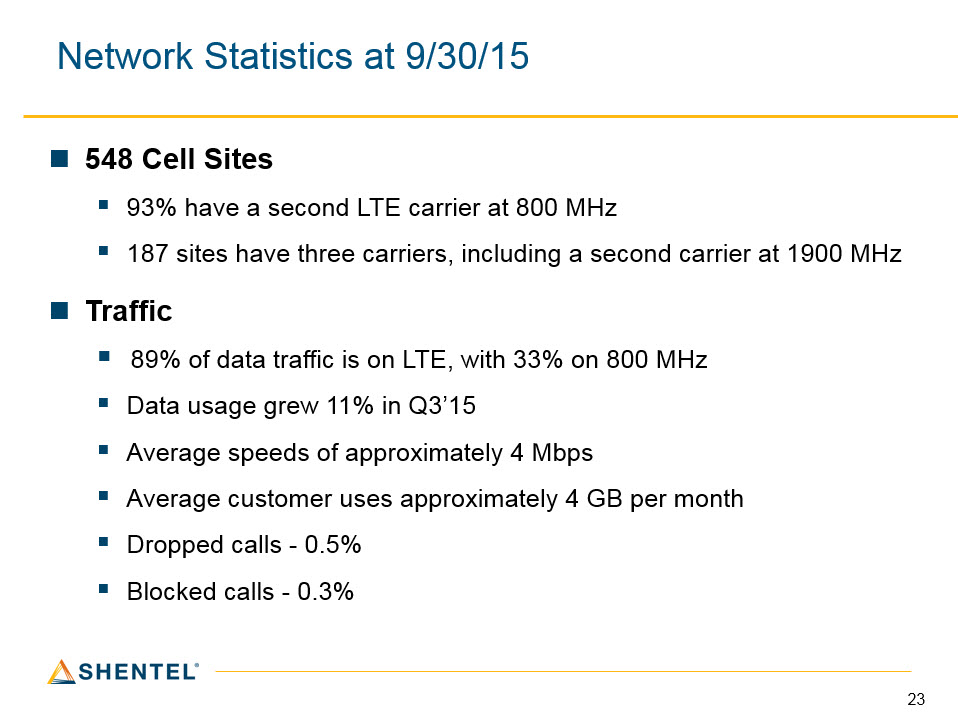
Network Statistics at 9/30/15 548 Cell Sites93% have a second LTE carrier at 800 MHz187 sites have three carriers, including a second carrier at 1900 MHzTraffic 89% of data traffic is on LTE, with 33% on 800 MHzData usage grew 11% in Q3’15Average speeds of approximately 4 MbpsAverage customer uses approximately 4 GB per monthDropped calls - 0.5%Blocked calls - 0.3%
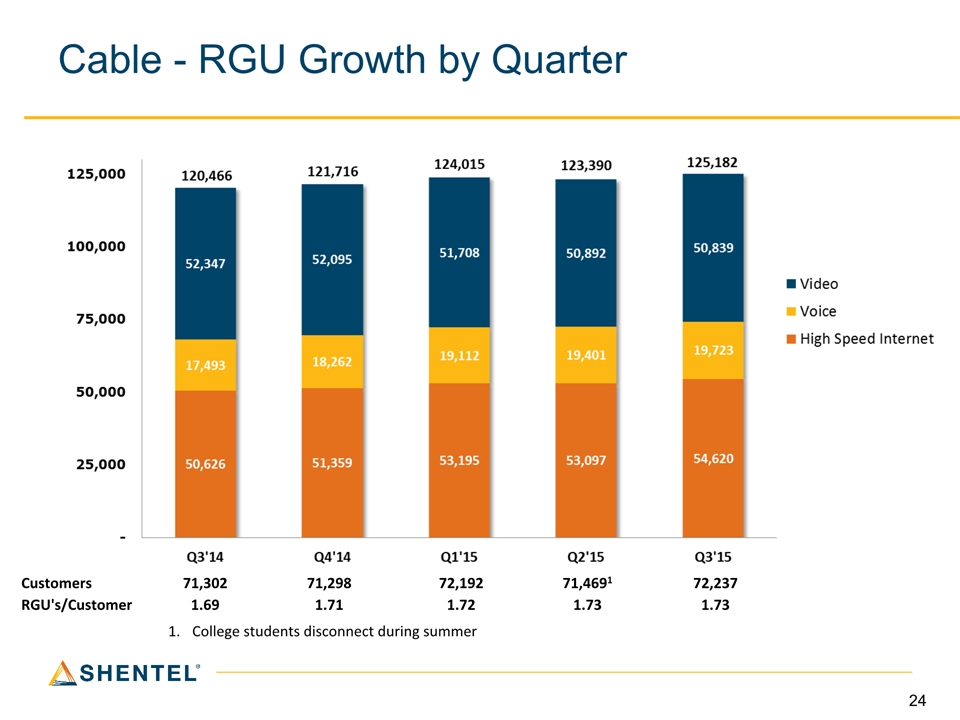
Cable - RGU Growth by Quarter Customers 71,302 71,298 72,192 71,4691 72,237 RGU's/Customer 1.69 1.71 1.72 1.73 1.73 College students disconnect during summer
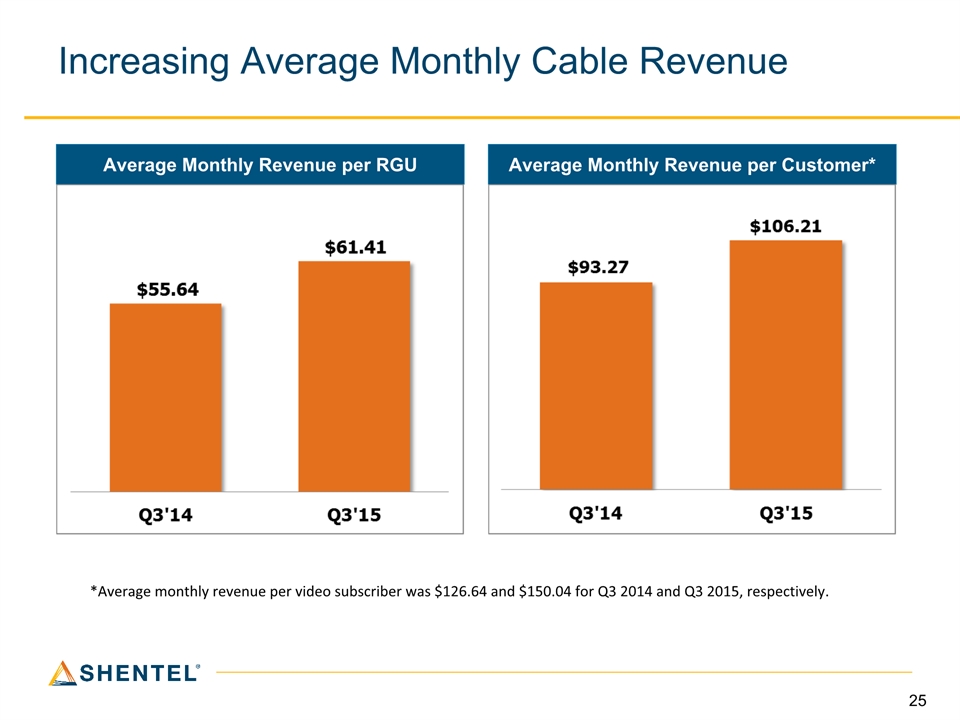
Increasing Average Monthly Cable Revenue Average Monthly Revenue per RGU Average Monthly Revenue per Customer* *Average monthly revenue per video subscriber was $126.64 and $150.04 for Q3 2014 and Q3 2015, respectively.
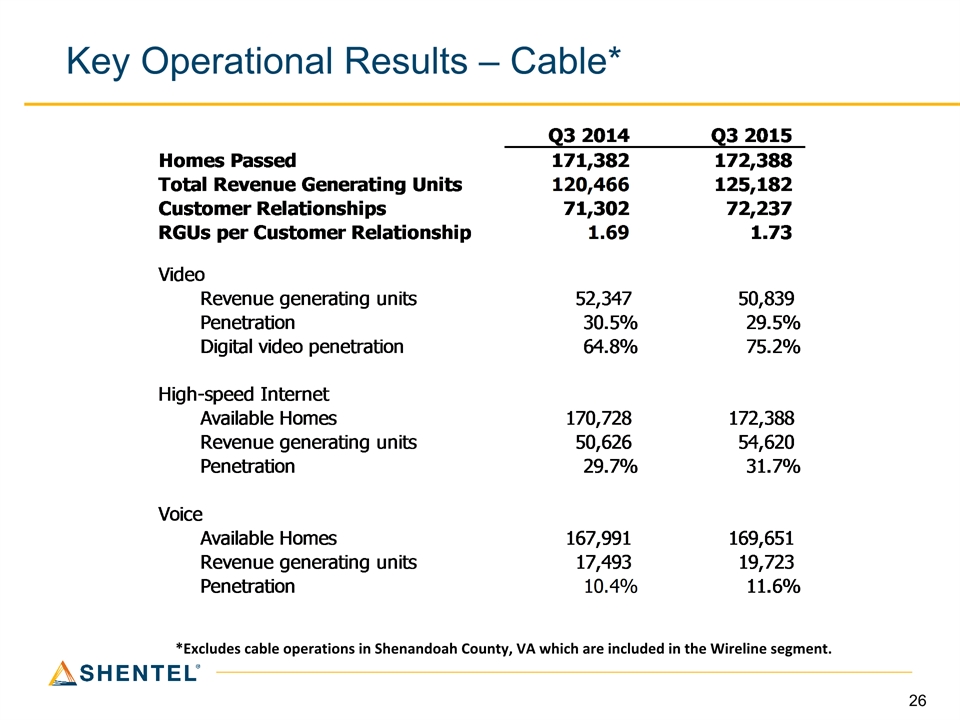
Key Operational Results – Cable* *Excludes cable operations in Shenandoah County, VA which are included in the Wireline segment.
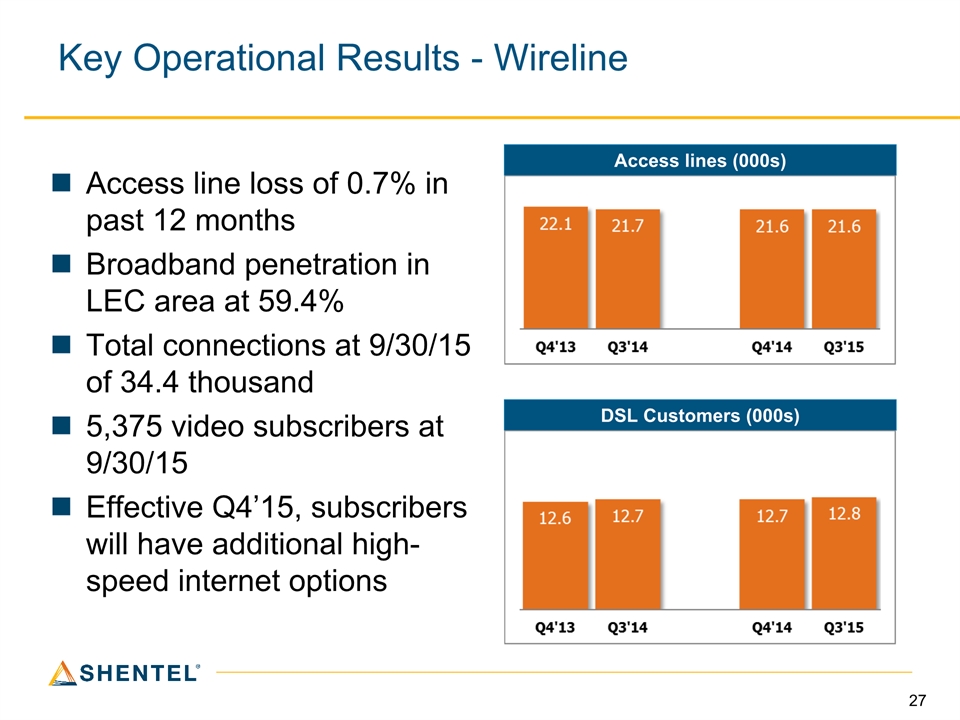
Key Operational Results - Wireline Access line loss of 0.7% in past 12 monthsBroadband penetration in LEC area at 59.4%Total connections at 9/30/15 of 34.4 thousand5,375 video subscribers at 9/30/15Effective Q4’15, subscribers will have additional high-speed internet options Access lines (000s) DSL Customers (000s)
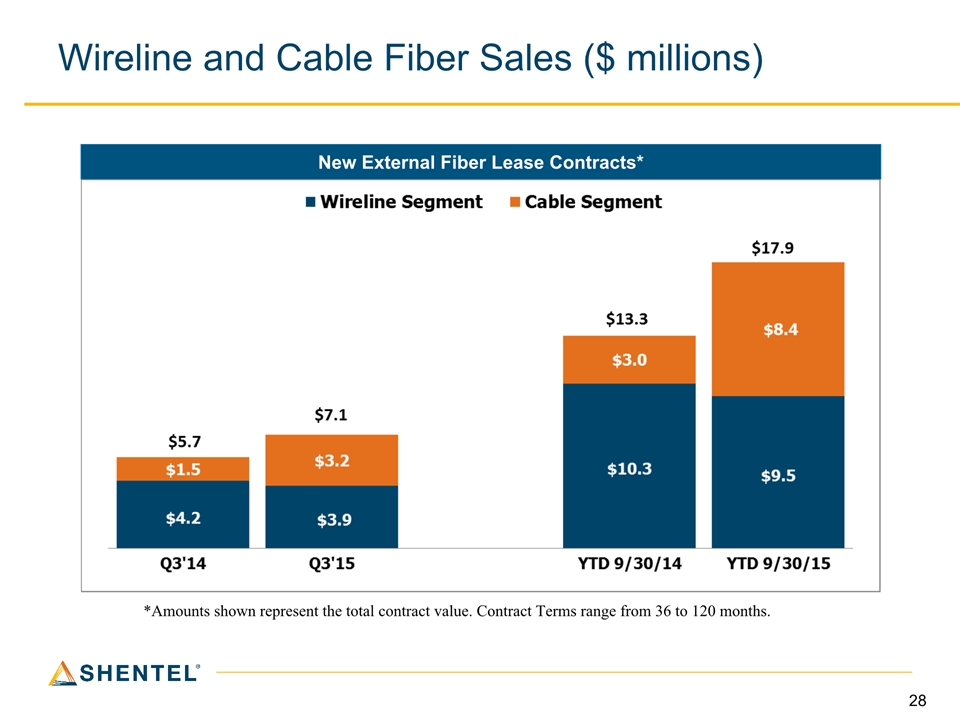
Wireline and Cable Fiber Sales ($ millions) *Amounts shown represent the total contract value. Contract Terms range from 36 to 120 months. New External Fiber Lease Contracts*
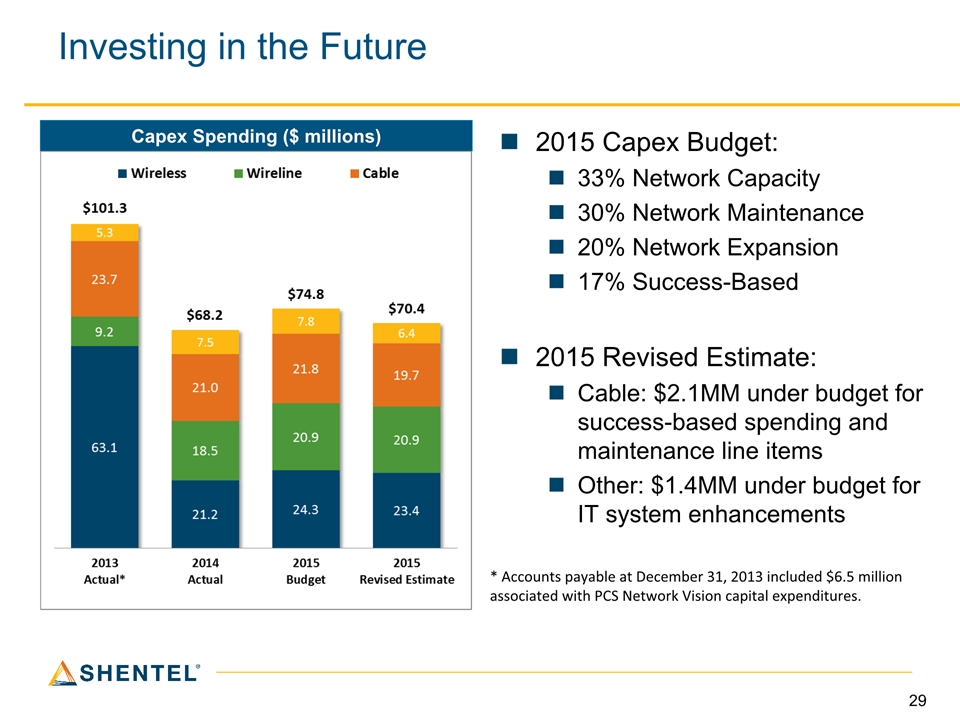
Investing in the Future Capex Spending ($ millions) * Accounts payable at December 31, 2013 included $6.5 million associated with PCS Network Vision capital expenditures. 2015 Capex Budget:33% Network Capacity30% Network Maintenance20% Network Expansion17% Success-Based2015 Revised Estimate:Cable: $2.1MM under budget for success-based spending and maintenance line itemsOther: $1.4MM under budget for IT system enhancements

Q&A

Appendix
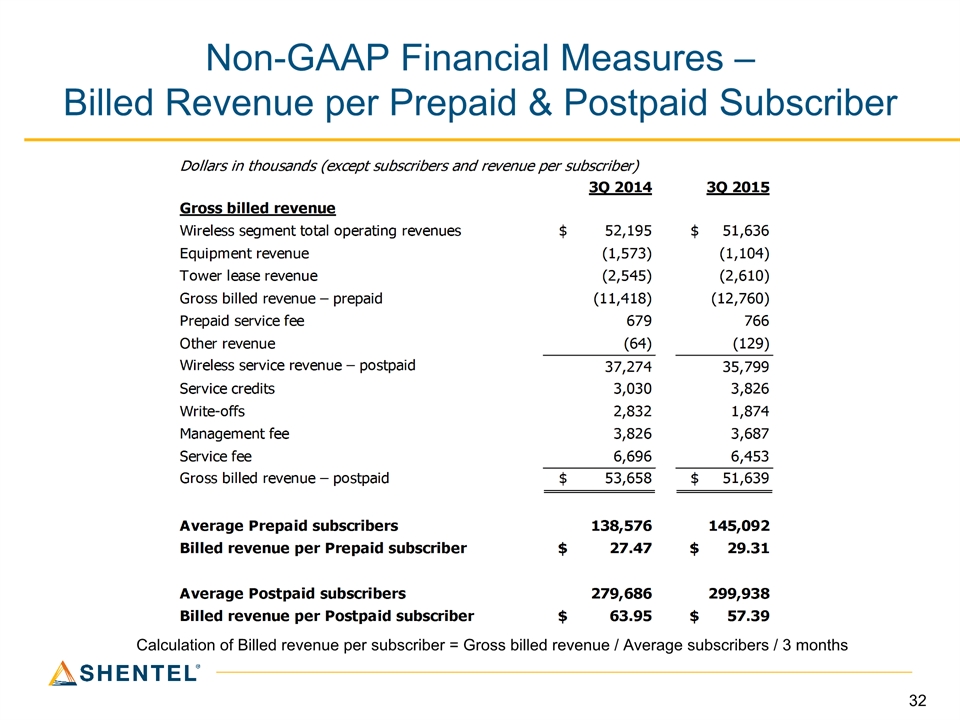
Non-GAAP Financial Measures – Billed Revenue per Prepaid & Postpaid Subscriber Calculation of Billed revenue per subscriber = Gross billed revenue / Average subscribers / 3 months
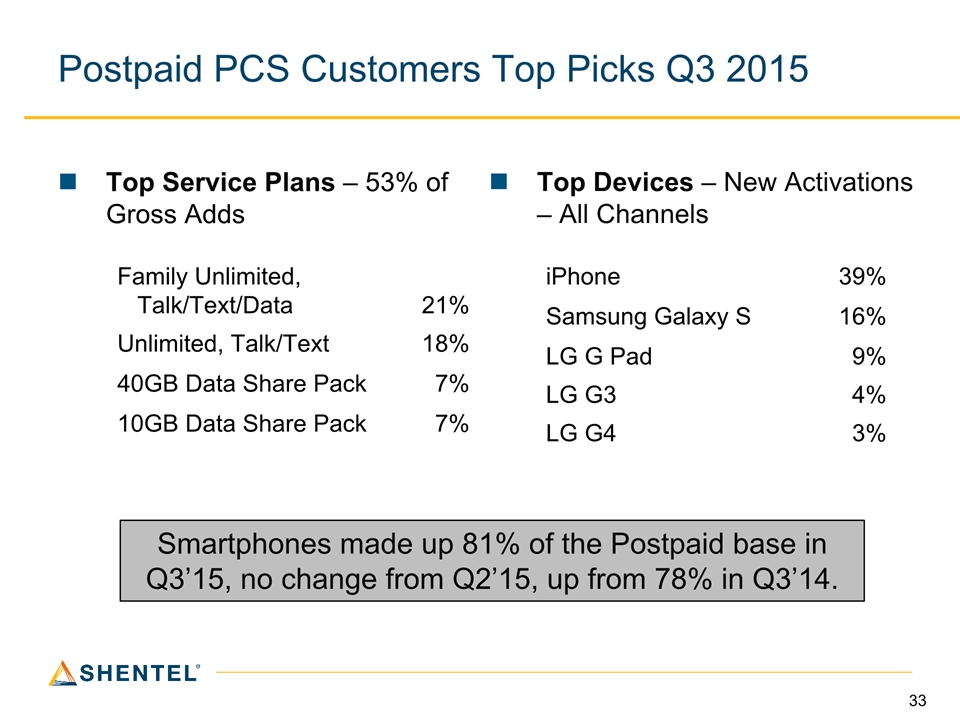
Postpaid PCS Customers Top Picks Q3 2015 Top Service Plans – 53% of Gross Adds Top Devices – New Activations – All Channels Family Unlimited, Talk/Text/Data 21% Unlimited, Talk/Text 18% 40GB Data Share Pack 7% 10GB Data Share Pack 7% iPhone 39% Samsung Galaxy S 16% LG G Pad 9% LG G3 4% LG G4 3% Smartphones made up 81% of the Postpaid base in Q3’15, no change from Q2’15, up from 78% in Q3’14.
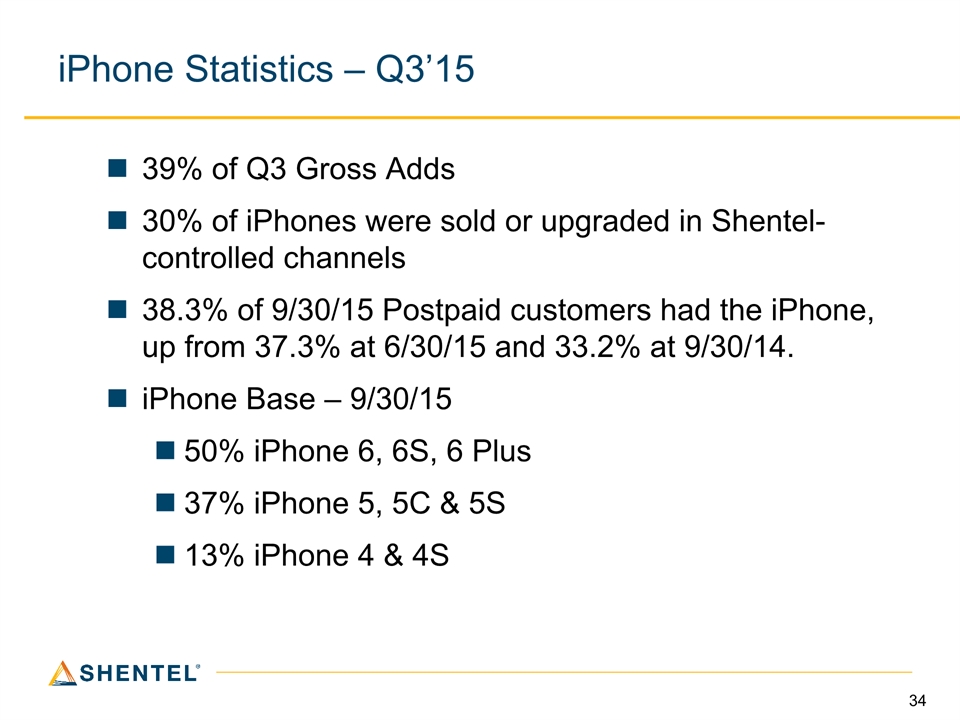
iPhone Statistics – Q3’15 39% of Q3 Gross Adds30% of iPhones were sold or upgraded in Shentel-controlled channels38.3% of 9/30/15 Postpaid customers had the iPhone, up from 37.3% at 6/30/15 and 33.2% at 9/30/14.iPhone Base – 9/30/1550% iPhone 6, 6S, 6 Plus37% iPhone 5, 5C & 5S13% iPhone 4 & 4S
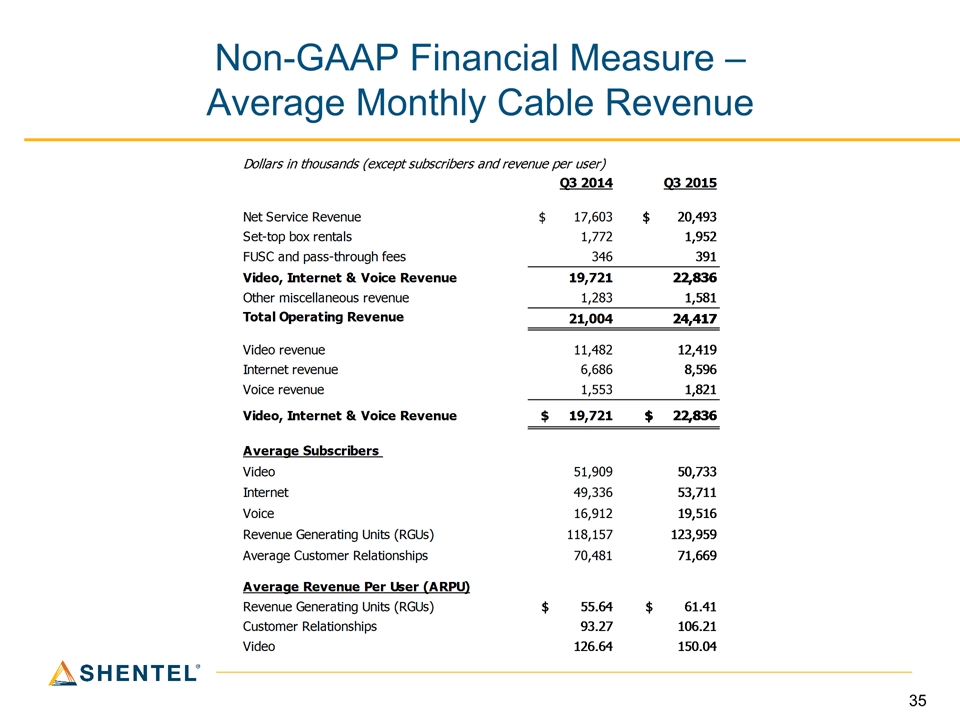
Non-GAAP Financial Measure – Average Monthly Cable Revenue
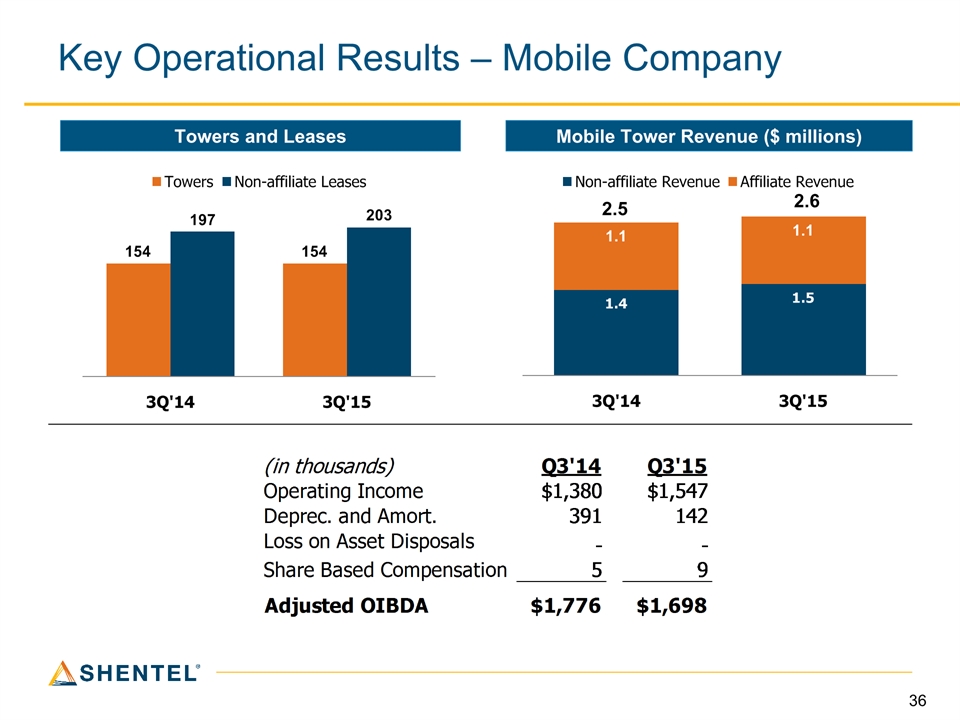
Key Operational Results – Mobile Company Mobile Tower Revenue ($ millions) Towers and Leases