Attached files
| file | filename |
|---|---|
| 8-K - 8-K - SCANSOURCE, INC. | a2016-q1form8xk09302015.htm |
| EX-99.1 - EXHIBIT 99.1 - SCANSOURCE, INC. | a2016-q1exhibit99109302015.htm |

Q1 FY16 FINANCIAL RESULTS CONFERENCE CALL October 29, 2015 at 5:00 pm ET Exhibit 99.2
SAFE HARBOR This presentation may contain certain comments, which are “forward-looking” statements that involve plans, strategies, economic performance and trends, projections, expectations, costs or beliefs about future events and other statements that are not descriptions of historical facts, may be forward- looking statements within the meaning of the Private Securities Litigation Reform Act of 1995, Section 27A of the Securities Act of 1933 and Section 21E of the Securities Exchange Act of 1934. Forward-looking information is inherently subject to risks and uncertainties; these statements are subject to the safe harbor created by the Private Securities Litigation Reform Act of 1995. Any number of factors could cause actual results to differ materially from anticipated results. For more information concerning factors that could cause actual results to differ from anticipated results, see the “Risk Factors” included in the Company’s annual report on Form 10-K for the fiscal year ended June 30, 2015, filed with the Securities and Exchange Commission (“SEC”). Although ScanSource believes the expectations in its forward-looking statements are reasonable, it cannot guarantee future results, levels of activity, performance or achievement. ScanSource disclaims any intentions or obligation to update or revise any forward-looking statements, whether as a result of new information, future events, or otherwise, except as may be required by law. In addition to disclosing results that are determined in accordance with United States Generally Accepted Accounting Principles (“GAAP”), the Company also discloses certain non-GAAP measures, including non-GAAP operating income, non-GAAP operating margin, non-GAAP net income, non-GAAP diluted earnings per share, return on invested capital (“ROIC”) and the percentage change in net sales excluding the impact of foreign currency exchange rates. A reconciliation of the Company's non-GAAP financial information to GAAP financial information is provided in the Appendix and in the Company’s Form 8-K, filed with the SEC, with the quarterly earnings press release for the period indicated. 2

HIGHLIGHTS – Q1 FY16 3 Record net sales of $871 million, up 10% Y/Y, and non-GAAP diluted EPS of $0.68*; within or above expected ranges Gross profit margin of 10.1%; non-GAAP operating margin of 3.3%* Acquisition of KBZ completed September 4, 2015 Three acquisitions during the past year – Imago, Network1 and KBZ – contributed positively to our growth and strong operating performance Implementation of SAP ERP system in North America in early July 2015 Returned cash to shareholders through share repurchases First quarter 2016 return on invested capital of 14.6%* * See Appendix for calculation of non-GAAP measures and reconciliations to GAAP measures.
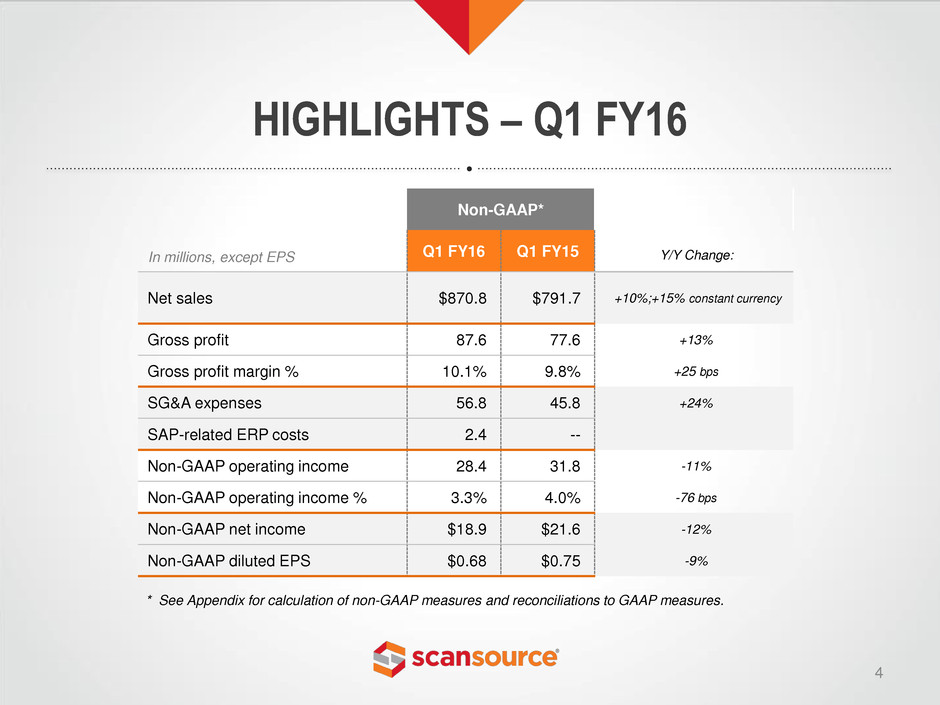
HIGHLIGHTS – Q1 FY16 4 Non-GAAP* Q1 FY16 Q1 FY15 Y/Y Change: Net sales $870.8 $791.7 +10%;+15% constant currency Gross profit 87.6 77.6 +13% Gross profit margin % 10.1% 9.8% +25 bps SG&A expenses 56.8 45.8 +24% SAP-related ERP costs 2.4 -- Non-GAAP operating income 28.4 31.8 -11% Non-GAAP operating income % 3.3% 4.0% -76 bps Non-GAAP net income $18.9 $21.6 -12% Non-GAAP diluted EPS $0.68 $0.75 -9% In millions, except EPS * See Appendix for calculation of non-GAAP measures and reconciliations to GAAP measures.

Q1 FY16 Q4 FY15 Q1 FY15 Net sales $515.7 $489.6 $501.0 Gross profit $44.7 $44.4 $43.0 Gross margin 8.7% 9.1% 8.6% Operating income $13.1 $12.2 $12.5 Operating income % 2.5% 2.5% 2.5% Non-GAAP operating income $13.8 $13.4 $13.6 Non-GAAP operating income % 2.7% 2.7% 2.7% WW BARCODE & SECURITY 5 $ in millions Non-GAAP operating income excludes amortization of intangibles and change in fair value of contingent consideration. See Appendix for calculation of non-GAAP measures and reconciliations to GAAP measures. Q1 FY15 Q1 FY16 $501 $516 Acqs. Net Sales, $ in millions Up 3% Constant Currency, Up 10%

Q1 FY16 Q4 FY15 Q1 FY15 Net sales $355.2 $367.1 $290.8 Gross profit $42.9 $46.9 $34.6 Gross margin 12.1% 12.8% 11.9% Operating income $11.6 $12.9 $17.8 Operating income % 3.3% 3.5% 6.1% Non-GAAP operating income $14.6 $15.2 $18.2 Non-GAAP operating income % 4.1% 4.1% 6.3% WW COMMUNICATIONS & SERVICES 6 Q1 FY15 Q1 FY16 Net Sales, $ in millions Up 22% Constant Currency, Up 23% $ in millions Non-GAAP operating income excludes amortization of intangibles and change in fair value of contingent consideration. See Appendix for calculation of non-GAAP measures and reconciliations to GAAP measures. $355 Acqs. $291

Q1 FY16 Q4 FY15 Q1 FY15 Accounts receivable (Q/E) $588.0 $522.5 $500.0 Days sales outstanding in receivables 56* 55 55** Inventory (Q/E) $588.2 $553.1 $495.1 Inventory turns 5.3* 5.9 5.7** Accounts payable (Q/E) $516.1 $501.3 $423.5 Paid for inventory days 13.0* 6.1 9.7** WORKING CAPITAL MEASURES $ in millions 7 * Excludes the impact of KBZ, which was completed September 4, 2015 ** Excludes the impact of Imago, which was completed September 19, 2014

Q1 FY16 Q4 FY15 Q1 FY15 Return on invested capital (“ROIC”)* 14.6% 15.2% 16.2% Operating cash flow, trailing 12-months $17.1 $75.5 $2.7 Cash and cash equivalents (Q/E) $41.2 $121.6 $139.9 Debt (Q/E) $94.5 $8.8 $5.4 Net debt to EBITDA, trailing 12-months 0.46x -- -- Shares repurchased – # of shares (QTR) 1,149,103 409,860 -- Shares repurchased – dollars (QTR) $41.9 $16.1 Cum. repurchases under plan – # shares (as of Q/E) 1,628,928 479,825 Cum. repurchases under plan – # shares (as of Q/E) $60.7 $18.8 Remaining authorization under plan (as of Q/E) $59.3 $101.2 -- CASH FLOW AND BALANCE SHEET HIGHLIGHTS $ in millions 8 * Excludes non-GAAP adjustments and change in fair value of contingent consideration. See Appendix for calculation of ROIC, a non-GAAP measure.

Q2 FY16 OUTLOOK* 9 * Outlook as of October 29, 2015. Non-GAAP diluted EPS excludes amortization of intangible assets, change in fair value of contingent consideration, and acquisition costs. Reflects the following FX rates: $1.12 to EUR 1.00 for the Euro, $0.256 to R$1.00 for the Brazilian real (R$3.91 to $1), and $1.53 to GBP 1.00 for the British pound. For the quarter ending December 31, 2015, excluding amortization of intangible assets, change in fair value of contingent consideration, and acquisition costs: Net Sales Non-GAAP Diluted Earnings Per Share Range from $900 million to $980 million Range from $0.72 to $0.80 per share

APPENDIX: NON-GAAP FINANCIAL INFORMATION 10 Income Statement Highlights ($ in thousands) Q1 FY16 Q4 FY15 Q1 FY15 GAAP Non- GAAP GAAP Non- GAAP GAAP Non- GAAP Net sales $870,829 $870,829 $856,685 $856,685 $791,720 $791,720 Gross profit 87,552 87,552 91,318 91,318 77,645 77,645 Gross profit margin % (of net sales) 10.1% 10.1% 10.7% 10.7% 9.8% 9.8% SG&A expenses 56,750 56,750 60,403 60,403 45,813 45,813 SAP-related ERP costs 2,392 2,392 2,303 2,303 - - Amortization of intangible assets 2,185 - 2,091 - 992 - Change, FV contingent consideration 1,564 - 1,406 - 513 - Acquisition costs 220 - 138 - 1,350 - Operating income 24,441 28,410 24,977 28,612 28,977 31,832 Operating income % (of net sales) 2.8% 3.3% 2.9% 3.3% 3.7% 4.0% Net income $ 15,996 $ 18,893 $ 16,447 $ 18,990 $ 19,208 $ 21,559 Diluted EPS $ 0.57 $ 0.68 $ 0.57 $ 0.66 $ 0.67 $ 0.75

APPENDIX: NON-GAAP FINANCIAL INFORMATION 11 Operating Income, Net Income & EPS ($ in thousands) Quarter Ended September 30, 2015 Operating Income Pre-tax income Net income Diluted EPS GAAP measure $ 24,441 $ 24,422 $ 15,996 $ 0.57 Adjustment: Amortization of intangible assets 2,185 2,185 1,597 0.06 Change in fair value of contingent consideration 1,564 1,564 1,080 0.04 Acquisition costs (a) 220 220 220 0.01 Non-GAAP measure $ 28,410 $ 28,391 $ 18,893 $ 0.68 Quarter Ended September 30, 2014 Operating Income Pre-tax income Net income Diluted EPS GAAP measure $ 28,977 $ 29,236 $ 19,208 $ 0.67 Adjustment: Amortization of intangible assets 992 992 660 0.02 Change in fair value of contingent consideration 513 513 341 0.01 Acquisition costs (a) 1,350 1,350 1,350 0.05 Non-GAAP measure $ 31,832 $ 32,091 $ 21,559 $ 0.75 (a) Acquisition costs are nondeductible for tax purposes.
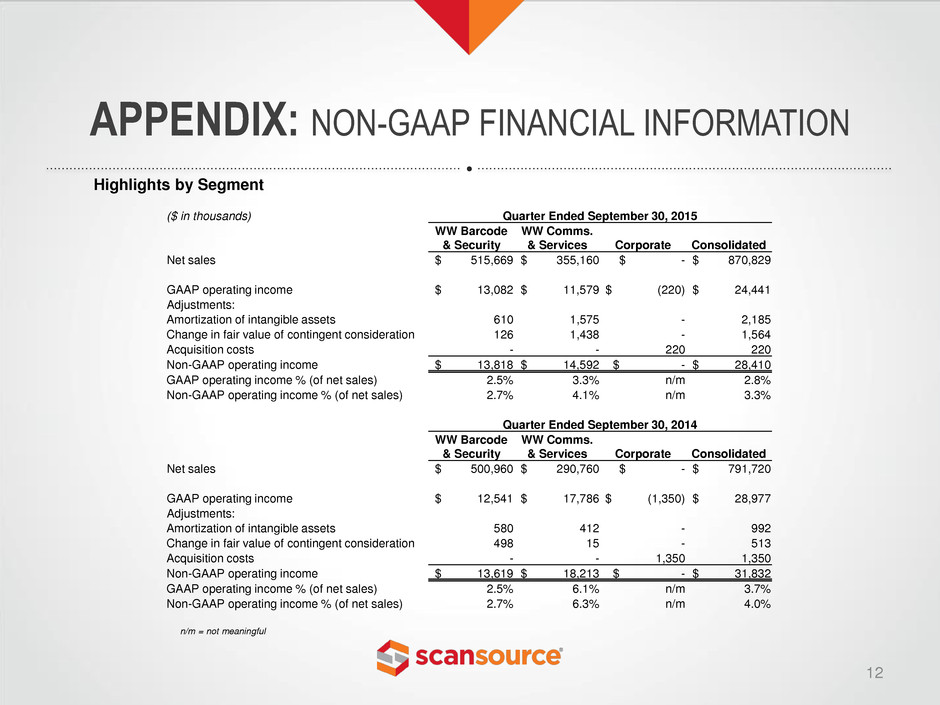
APPENDIX: NON-GAAP FINANCIAL INFORMATION 12 ($ in thousands) Quarter Ended September 30, 2015 WW Barcode & Security WW Comms. & Services Corporate Consolidated Net sales $ 515,669 $ 355,160 $ - $ 870,829 GAAP operating income $ 13,082 $ 11,579 $ (220) $ 24,441 Adjustments: Amortization of intangible assets 610 1,575 - 2,185 Change in fair value of contingent consideration 126 1,438 - 1,564 Acquisition costs - - 220 220 Non-GAAP operating income $ 13,818 $ 14,592 $ - $ 28,410 GAAP operating income % (of net sales) 2.5% 3.3% n/m 2.8% Non-GAAP operating income % (of net sales) 2.7% 4.1% n/m 3.3% Quarter Ended September 30, 2014 WW Barcode & Security WW Comms. & Services Corporate Consolidated Net sales $ 500,960 $ 290,760 $ - $ 791,720 GAAP operating income $ 12,541 $ 17,786 $ (1,350) $ 28,977 Adjustments: Amortization of intangible assets 580 412 - 992 Change in fair value of contingent consideration 498 15 - 513 Acquisition costs - - 1,350 1,350 Non-GAAP operating income $ 13,619 $ 18,213 $ - $ 31,832 GAAP operating income % (of net sales) 2.5% 6.1% n/m 3.7% Non-GAAP operating income % (of net sales) 2.7% 6.3% n/m 4.0% n/m = not meaningful Highlights by Segment
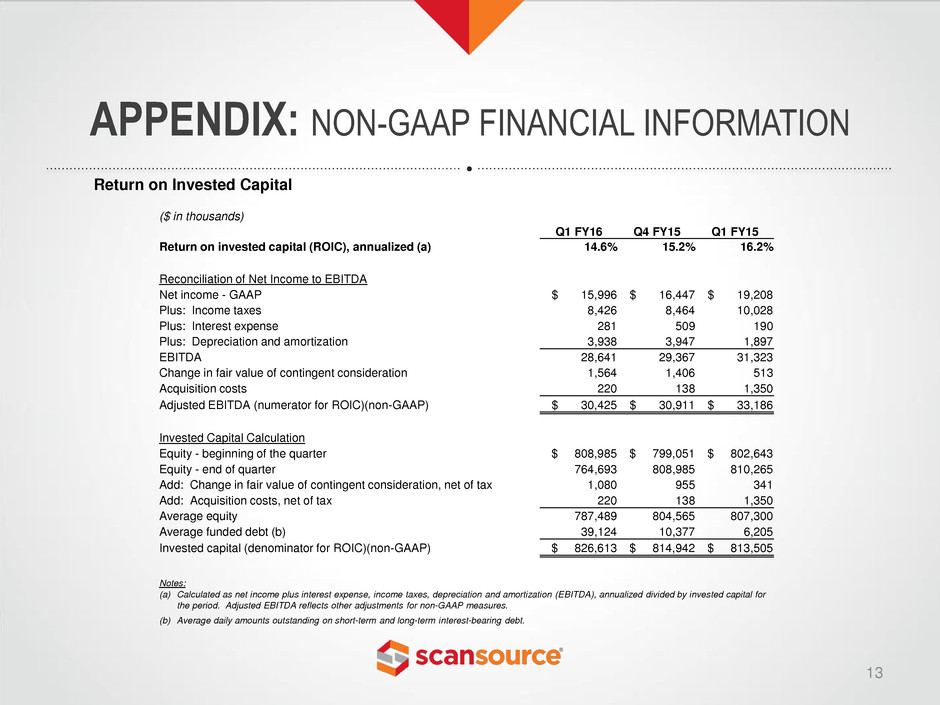
APPENDIX: NON-GAAP FINANCIAL INFORMATION 13 ($ in thousands) Q1 FY16 Q4 FY15 Q1 FY15 Return on invested capital (ROIC), annualized (a) 14.6% 15.2% 16.2% Reconciliation of Net Income to EBITDA Net income - GAAP $ 15,996 $ 16,447 $ 19,208 Plus: Income taxes 8,426 8,464 10,028 Plus: Interest expense 281 509 190 Plus: Depreciation and amortization 3,938 3,947 1,897 EBITDA 28,641 29,367 31,323 Change in fair value of contingent consideration 1,564 1,406 513 Acquisition costs 220 138 1,350 Adjusted EBITDA (numerator for ROIC)(non-GAAP) $ 30,425 $ 30,911 $ 33,186 Invested Capital Calculation Equity - beginning of the quarter $ 808,985 $ 799,051 $ 802,643 Equity - end of quarter 764,693 808,985 810,265 Add: Change in fair value of contingent consideration, net of tax 1,080 955 341 Add: Acquisition costs, net of tax 220 138 1,350 Average equity 787,489 804,565 807,300 Average funded debt (b) 39,124 10,377 6,205 Invested capital (denominator for ROIC)(non-GAAP) $ 826,613 $ 814,942 $ 813,505 Notes: (a) Calculated as net income plus interest expense, income taxes, depreciation and amortization (EBITDA), annualized divided by invested capital for the period. Adjusted EBITDA reflects other adjustments for non-GAAP measures. (b) Average daily amounts outstanding on short-term and long-term interest-bearing debt. Return on Invested Capital
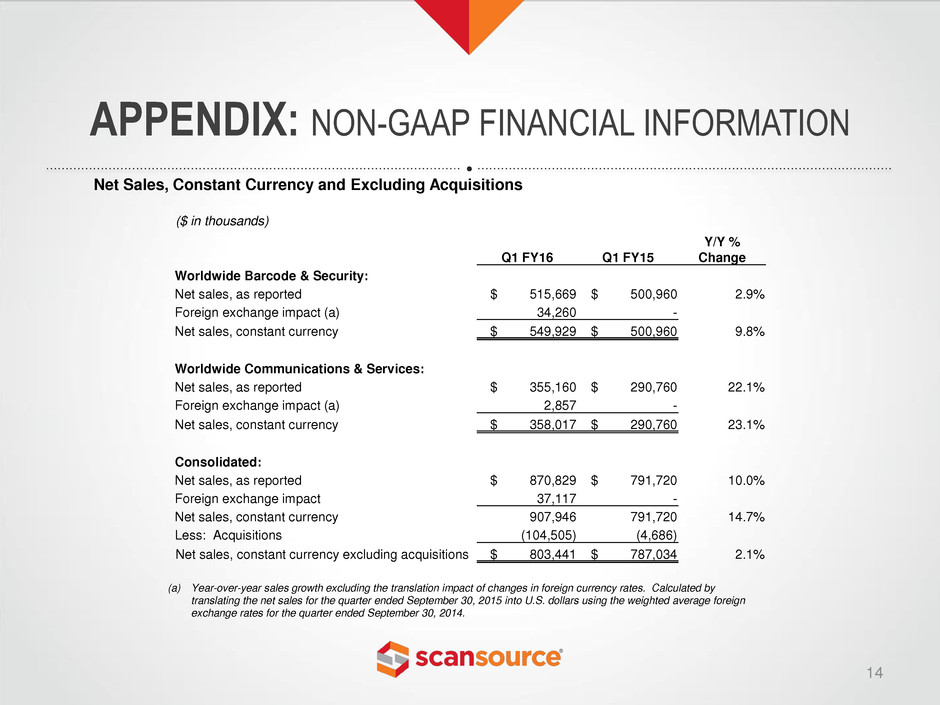
APPENDIX: NON-GAAP FINANCIAL INFORMATION 14 Net Sales, Constant Currency and Excluding Acquisitions ($ in thousands) Q1 FY16 Q1 FY15 Y/Y % Change Worldwide Barcode & Security: Net sales, as reported $ 515,669 $ 500,960 2.9% Foreign exchange impact (a) 34,260 - Net sales, constant currency $ 549,929 $ 500,960 9.8% Worldwide Communications & Services: Net sales, as reported $ 355,160 $ 290,760 22.1% Foreign exchange impact (a) 2,857 - Net sales, constant currency $ 358,017 $ 290,760 23.1% Consolidated: Net sales, as reported $ 870,829 $ 791,720 10.0% Foreign exchange impact 37,117 - Net sales, constant currency 907,946 791,720 14.7% Less: Acquisitions (104,505) (4,686) Net sales, constant currency excluding acquisitions $ 803,441 $ 787,034 2.1% (a) Year-over-year sales growth excluding the translation impact of changes in foreign currency rates. Calculated by translating the net sales for the quarter ended September 30, 2015 into U.S. dollars using the weighted average foreign exchange rates for the quarter ended September 30, 2014.
