Attached files
Table of Contents
Index to Financial Statements
UNITED STATES
SECURITIES AND EXCHANGE COMMISSION
Washington, D.C. 20549
FORM 10-K
(Mark One)
| x | Annual Report Pursuant to Section 13 or 15(d) of the Securities Exchange Act of 1934 |
For the fiscal year ended June 30, 2010
OR
| ¨ | Transition Report Pursuant to Section 13 or 15(d) of the Securities Exchange Act of 1934 |
For the transition period from to .
Commission File Number: 000-26926

ScanSource, Inc.
(Exact name of registrant as specified in its charter)
| South Carolina | 57-0965380 | |
| (State or other jurisdiction of incorporation or organization) |
(I.R.S. Employer Identification No.) | |
| 6 Logue Court Greenville, South Carolina |
29615 | |
| (Address of principal executive offices) | (Zip Code) | |
(864) 288-2432
(Registrant’s telephone number, including area code)
Securities registered pursuant to Section 12(b) of the Act:
| Title of Each Class |
Name of Each Exchange on Which Registered | |
| Common Stock, no par value | NASDAQ Global Select Market |
Securities registered pursuant to Section 12(g) of the Act:
None.
Indicate by check mark if the registrant is a well-known seasoned issuer, as defined in Rule 405 of the Securities Act. x Yes ¨ No
Indicate by check mark if the registrant is not required to file reports pursuant to Section 13 or Section 15(d) of the Act. ¨ Yes x No
Indicate by check mark whether the registrant (1) has filed all reports required to be filed by Section 13 or 15(d) of the Securities Exchange Act of 1934 during the preceding 12 months (or for such shorter period that the registrant was required to file such reports), and (2) has been subject to such filing requirements for the past 90 days. x Yes ¨ No
Indicate by check mark whether the registrant has submitted electronically and posted on its corporate Web site, if any, every Interactive Data File required to be submitted and posted pursuant to Rule 405 of Regulation S-T (§232.405 of this chapter) during the preceding 12 months (or for such shorter period that the registrant was required to submit and post such files). ¨ Yes ¨ No
Indicate by check mark if disclosure of delinquent filers pursuant to Item 405 of Regulation S-K (§229.405) is not contained herein, and will not be contained, to the best of registrant’s knowledge, in definitive proxy or information statements incorporated by reference in Part III of this Form 10-K or any amendment to this Form 10-K. x
Indicate by check mark whether the registrant is a large accelerated filer, an accelerated filer, a non-accelerated filer, or a smaller reporting company. See the definitions of “large accelerated filer,” “accelerated filer” and “smaller reporting company” in Rule 12b-2 of the Exchange Act.
| Large accelerated filer |
x |
Accelerated filer |
¨ | |||||
| Non-accelerated filer |
¨ |
Smaller reporting company |
¨ | |||||
| (Do not check if a smaller reporting company) |
Indicate by check mark whether the registrant is a shell company (as defined in Rule 12b-2 of the Act). ¨ Yes x No
The aggregate market value of the voting common stock of the Registrant held by non-affiliates of the Registrant at December 31, 2009 was $701,550,029, as computed by reference to the closing price of such stock on such date.
Indicate the number of shares outstanding of each of the issuer’s classes of common stock, as of the latest practicable date.
| Class |
Outstanding at August 24, 2010 | |
| Common Stock, no par value per share | 26,713,038 shares |
DOCUMENTS INCORPORATED BY REFERENCE
The registrant has incorporated by referenced into Part III of this report certain portions of its proxy statement for its 2010 Annual Meeting of Shareholders, which is expected to be filed pursuant to Regulation 14A within 120 days after the end of the registrant’s fiscal year ended June 30, 2010.
Table of Contents
Index to Financial Statements
FORWARD-LOOKING STATEMENTS
The forward-looking statements included in the “Business,” “Risk Factors,” “Legal Proceedings,” “Management’s Discussion and Analysis of Financial Condition and Results of Operations,” and “Quantitative and Qualitative Disclosures About Market Risk” sections and elsewhere herein, which reflect our best judgment based on factors currently known, involve risks and uncertainties. Words such as “expects,” “anticipates,” “believes,” “intends,” “plans,” “hopes,” and variations of such words and similar expressions are intended to identify such forward-looking statements. Except as may be required by law, we expressly disclaim any obligation to update these forward-looking statements to reflect events or circumstances after the date of this Annual Report on Form 10-K or to reflect the occurrence of unanticipated events. Actual results could differ materially from those anticipated in these forward-looking statements as a result of a number of factors including, but not limited to, the factors discussed in such sections and, in particular, those set forth in the cautionary statements contained in “Risk Factors.” The forward-looking information we have provided in this Annual Report on Form 10-K pursuant to the safe harbor established under the Private Securities Litigation Reform Act of 1995 should be evaluated in the context of these factors.
Table of Contents
Index to Financial Statements
Table of Contents
Index to Financial Statements
PART I
| ITEM 1. | Business. |
ScanSource, Inc. (the “Company”), incorporated in South Carolina in December 1992, is a leading wholesale distributor of specialty technology products, providing value-added distribution sales to resellers in the specialty technology markets. The Company has two geographic distribution segments: one serving North America from the Southaven, Mississippi distribution center, and an international segment currently serving Latin America (including Mexico) and Europe from distribution centers located in Florida and Mexico, and in Belgium and Germany, respectively. The North American distribution segment markets automatic identification and data capture (“AIDC”) and point-of-sale (“POS”) products through its ScanSource POS and Barcoding sales unit; voice, data and converged communications equipment through its Catalyst Telecom sales unit; video conferencing, telephony, and communications products through its ScanSource Communications sales unit; and electronic security products and wireless infrastructure products through its ScanSource Security Distribution unit. The international distribution segment markets AIDC, POS, communications and security products as follows: ScanSource Latin America markets AIDC, POS, communications and security products. ScanSource Europe markets AIDC and POS products, while communication products are marketed through its ScanSource Communications sales unit in Europe. See Note 14 to the Notes to the Consolidated Financial Statements for financial information concerning the Company’s reporting segments and the geographic areas in which the Company operates.
North American Distribution Segment
ScanSource POS and Barcoding Sales Unit
The ScanSource POS and Barcoding sales unit markets AIDC and POS products which interface with computer systems used to automate the collection, processing and communication of information for commercial and industrial applications, including retail sales, distribution, shipping, inventory control, materials handling and warehouse management. The bar code family of products is referred to as automatic identification and data capture (AIDC) because it includes all types of portable data collection terminals, wireless products and bar code label printers, in addition to scanners. POS products are those PC-based products that have replaced electronic cash registers in retail and hospitality environments and the peripheral products that attach to them. These peripheral devices include such items as cash drawers, pole displays, signature capture units, display monitors and magnetic strip readers. In addition to these peripheral devices, ScanSource POS and Barcoding also sells products that attach to the POS network in the store, including kiosks, network access points, routers and digital signage displays.
ScanSource POS and Barcoding sales unit vendors include most of the leading AIDC and POS manufacturers, including Cisco, Datalogic, Elo, Epson America, Honeywell, IBM, Intermec, Motorola, NCR, and Zebra Technologies.
Catalyst Telecom Sales Unit
The Catalyst Telecom sales unit markets voice, data and converged communication systems and is a distributor of Avaya communications solutions, including Avaya Enterprise Solutions, Small and Medium Enterprise (SME) and internet protocol (IP) products. Catalyst Telecom also markets data and network security products from vendors including Aruba, Extreme Networks, Juniper Networks, as well as Plantronics, Polycom, and multiple wireless vendors.
ScanSource Communications Sales Unit
ScanSource Communications is a comprehensive value-added distributor of total communications solutions, including video and audio conferencing products; telephony solutions including Voice over IP (VoIP); and computer telephony building blocks. ScanSource Communications’ manufacturing partners include Polycom, Audiocodes, Dialogic, and Plantronics.
1
Table of Contents
Index to Financial Statements
ScanSource Security Sales Unit
The ScanSource Security sales unit focuses on hardware distribution of electronic security equipment using the two-tier distribution model, as described below in “Industry Overview”. The product offering includes identification, access control, video surveillance, intrusion-related, and wireless infrastructure products. Manufacturers include Alvarion, Axis, Bosch, Cisco Security, Datacard, DSC, HID, Motorola Wireless, Panasonic, Ruckus Wireless, Sony, Tropos, United Technologies Fire and Security, and Zebra Card.
International Distribution Segment
The Company’s international distribution segment markets AIDC, POS, and communications products exclusively to technology resellers and integrators in the Latin American (including Mexico) and European markets. Key vendors include many of the same vendors that supply the ScanSource POS and Barcoding, Catalyst Telecom, and ScanSource Communications sales units of the North American distribution segment.
See Item 1A. “Risk Factors” below for a discussion of certain risks attendant to the Company’s international operations.
Products and Markets
The Company currently markets over 65,000 products from approximately 200 hardware and software vendors to over 20,000 reseller customers primarily from its central warehouses in Mississippi, Florida, Mexico, Belgium and Germany.
AIDC technology incorporates the capabilities for electronic identification and data processing without the need for manual input and consists of a wide range of products, including bar code printers, hand-held and fixed-mount laser scanners, mobile and wireless data collection devices, and magnetic stripe readers. As AIDC technology has become more pervasive, applications have evolved from traditional uses such as inventory control, materials handling, distribution, shipping and warehouse management to more advanced applications such as health care. POS products include those computer-based systems that have replaced electronic cash registers in grocery, retail, and hospitality environments. POS product lines include computer-based terminals, monitors, receipt printers, pole displays, cash drawers, keyboards, peripheral equipment and fully integrated processing units. Voice and data products include private branch exchanges (PBXs), key systems, and telephone handsets and components used in voice, fax, data, voice recognition, call center management and IP communication applications. Converged communication products combine voice, data, fax, and speech technologies to deliver communications solutions that combine computers, telecommunications and the Internet. Converged communications products include telephone and IP network interfaces, VoIP systems, PBX integration products and carrier-class board systems-level products. Video products include video and voice conferencing and network systems. Electronic security products include identification, access control, video surveillance, and intrusion-related products, and wireless infrastructure products.
See Item 7. “Management’s Discussion and Analysis of Financial Condition and Results of Operations” below for a discussion of the amount of the Company’s net sales contributed by product categories.
Industry Overview
The distribution channels for specialty technology products generally consist of manufacturers, wholesale distributors such as ScanSource, resellers and end-users. The “sales channel” for specialty technology products typically evolves through a three-stage process: (i) direct sales by manufacturers to end-users; (ii) single-tier distribution in which manufacturers sell to resellers who, in turn, sell directly to end-users; and (iii) two-tier, or wholesale distribution, in which manufacturers sell to wholesale distributors, including ScanSource, who sell only to resellers who, in turn, sell directly to end-users.
2
Table of Contents
Index to Financial Statements
Currently, the technology products wholesale distribution channel is served by both broad line and specialty distributors. The broad line distributors are engaged primarily in conventional order fulfillment and typically offer their reseller customers less support and fewer value-added services than do specialty distributors. The specialty distributors that compete with ScanSource are generally smaller, both in terms of size and geographic area covered.
Competition among an expanding number of manufacturers typically causes product prices to decrease and product applications to expand, which has resulted in an increasing number of resellers entering the market in order to support a broader base of potential end-users. As the number of resellers and end-users has grown, competition among manufacturers and within the reseller channel has intensified. Because many specialty technology manufacturers develop products that represent only one part of a total solution, most products eventually are developed to provide interoperability among products from multiple manufacturers. As a result of interoperability, a variety of manufacturers’ products are typically configured together to create a system solution. Therefore, both manufacturers and resellers have become more dependent upon value-added wholesale distributors such as ScanSource for the aggregation of products and reseller support services, as well as the organization and maintenance of an efficient market structure.
In addition, manufacturers that face declining product prices and rising costs of direct sales increasingly rely upon value-added wholesale distributors by outsourcing certain support functions, such as product assortment, delivery, inventory management, technical assistance, and marketing. At the same time, shortened product life cycles and the introduction of new products and applications have caused resellers increasingly to rely on wholesale distributors for various inventory management, financing, technical support and related functions. The Company believes that as the reseller market grows and becomes more fragmented, and as specialty technology products continue to transition to open systems, the wholesale distribution channel in which the Company operates will become increasingly more important.
Vendors
The Company’s key vendors for its ScanSource POS and Barcoding sales unit are Cisco, Datalogic, Elo, Epson America, Honeywell, IBM, Intermec, LXE, Motorola, NCR, and Zebra Technologies. The Company’s key vendors in its Catalyst Telecom sales unit are Aruba, Avaya, Extreme Networks, Juniper Networks, Plantronics and Polycom. The Company’s key vendors for its ScanSource Communications sales unit are Audiocodes, Dialogic, Plantronics, and Polycom. The Company’s key vendors for its ScanSource Security sales unit are Axis, Cisco, HID, Panasonic, Sony and Zebra Card.
The Company has approximately 200 hardware and software vendors that currently supply its products. Of all of the Company’s vendors, only two, Motorola and Avaya, each constitute more than 10% of the Company’s net sales. The Company’s products are typically purchased directly from the manufacturer on a non-exclusive basis. The Company’s agreements with its vendors generally do not restrict the Company from selling similar or comparable products manufactured by competitors. The Company has the flexibility to terminate or curtail sales of one product line in favor of another due to technological change, pricing considerations, product availability, customer demand, or vendor distribution policies.
The Company has written distribution agreements with its key vendors and with almost all of its vendors. These agreements are in the form that the Company believes are customarily used by manufacturers and distributors. The Company’s agreements generally provide it with non-exclusive distribution rights and often include territorial restrictions that limit the countries in which the Company can distribute its products. These agreements typically provide the Company with stock rotation and price protection provisions. Stock rotation rights give the Company the ability, subject to certain limitations, to return for credit or exchange a portion of those inventory items purchased from the vendor. Price protection situations occur when a vendor credits the Company for declines in inventory value resulting from the vendor’s price reductions. Along with the Company’s inventory management policies and practices, these provisions are designed to reduce the Company’s risk of loss due to slow-moving inventory, vendor price reductions, product updates or obsolescence.
3
Table of Contents
Index to Financial Statements
Some of the Company’s distribution agreements contain minimum purchase requirements that the Company must meet in order to receive preferential prices. The Company participates in various rebate, cash discount and cooperative marketing programs offered by its vendors to support expenses associated with distributing and marketing the vendor’s products. The rebates and purchase discounts are generally influenced by sales volumes and are subject to change.
The Company’s distribution agreements are generally short term, subject to periodic renewal, and provide for termination by either party without cause upon 30 to 120 days notice. The Company’s vendors generally warrant the products the Company distributes and allow returns of defective products, including those returned to the Company by its customers. The Company generally does not independently warrant the products it distributes; however, local laws may in some cases impose warranty obligations on the Company.
The Company’s merchandising department recruits vendors and manages important aspects of its vendor relationships, such as purchasing arrangements, cooperative marketing initiatives, vendor sales force relationships, product training, monitoring of rebate programs and various contract terms and conditions.
Customers
The Company’s reseller customers currently include over 20,000 active value-added reseller accounts (“VARs”) located in the United States, Canada, Mexico, Latin America and Europe. No single customer accounted for more than 5% of the Company’s total net sales for the fiscal year ended June 30, 2010. The Company generally targets two types of reseller customers:
Specialty Technology VARs
These resellers focus on selling specialty technology products as tailored software or integrated hardware solutions for their end-users’ existing applications or incorporating specialty technology products into customized technology solutions for their end-users. Primary industries served by these resellers include manufacturing, distribution, health care, pharmaceutical, hospitality, government, convenience, grocery, financial, and other retail markets.
Networking or PC VARs
These resellers develop computer solutions and networking for their end-users’ microcomputer needs. They typically have well-established relationships with end-user management information system directors and are seeking additional revenue and profit opportunities in related technology markets, such as AIDC, POS, security, or communications.
Sales and Electronic Commerce
The Company’s sales department consists primarily of inside sales representatives located in the United States, Canada, Mexico, Belgium, France, Germany, the United Kingdom, and the Netherlands. In order to build strong customer relationships, most active resellers are assigned to a sales representative. Each sales representative negotiates pricing directly with their assigned customers. The Company also employs business development representatives who are responsible for developing technical expertise within broad product markets, recruiting customers, creating demand, and reviewing overall product and service requirements of resellers. Each sales representative and business development representative receives comprehensive training with respect to the technical characteristics of each vendor’s products. This training is supplemented by frequent product seminars conducted by vendors’ representatives and bi-weekly meetings among product, marketing and sales managers.
4
Table of Contents
Index to Financial Statements
Increasingly, customers rely upon the Company’s electronic ordering and information systems, in addition to its product catalogs and frequent mailings, as sources for product information, including availability and price. Through the Company’s website, most customers can gain remote access to the Company’s information systems to check real-time product availability, see their customized pricing and place orders. Customers can also follow the status of their orders and obtain United Parcel Service (“UPS”) and Federal Express (“FedEx”) package tracking numbers from this site.
Marketing
The Company provides a range of marketing services, including cooperative advertising with vendors through trade publications and direct mail, product catalogs for each of the North American, European and Latin American markets, periodic newsletters, management of sales leads, trade shows with hardware and software companies and vendors, direct mail, and sales promotions. In addition, the Company organizes and operates its own seminars and teams with top vendors to recruit prospective resellers and introduce new applications for the specialty technology products it distributes. The Company frequently customizes its marketing services for vendors and resellers.
Value-Added Services
In addition to the basic order fulfillment and credit services that conventional wholesale distributors typically provide to resellers, the Company differentiates itself by providing an array of value-added services and business tools that assist resellers to provide more complete solutions and improve customer service. Such services include custom configuration, professional services, technical support, partner marketing, web storefronts, custom packaging, and other specialized services.
Operations
Information System
The Company’s information system is a scalable, centralized processing system capable of supporting numerous operational functions including purchasing, receiving, order processing, shipping, inventory management and accounting. Sales representatives rely on the information system for on-line, real-time information on product pricing, inventory availability and reservation, and order status. The Company’s warehouse operations use bar code technology for receiving and shipping, and automated UPS and FedEx systems for freight processing and shipment tracking, each of which is integrated with the Company’s information system. The customer service and technical support departments employ the system for documentation and faster processing of customer product returns. To ensure that adequate inventory levels are maintained, the Company’s buyers depend on the system’s purchasing and receiving functions to track inventory on a continual basis.
Central Warehouse and Shipping
The Company operates a 600,000 square foot distribution center in Southaven, Mississippi, which is located near the FedEx hub facility in Memphis, Tennessee and serves all of North America. The Company utilizes a third party warehouse located in Liege, Belgium and a warehouse in Cologne, Germany that serves all of Europe, including the United Kingdom. The Company has additional warehouse facilities in Florida and Mexico, which serve Latin America (including Mexico). The Company believes that its centralized distribution creates several advantages, including: (i) a reduced amount of “safety stock” inventory which, in turn, reduces the Company’s working capital requirements; (ii) an increased turnover rate through tighter controls over inventory; (iii) maintenance of a consistent order-fill rate; (iv) improved personnel productivity; (v) improved delivery time; (vi) simplified purchasing and tracking; (vii) decreased demand for management personnel; and (viii) flexibility to meet customer needs for systems integration. The Company’s objective is to ship all orders on the same day, using bar code technology to expedite shipments and minimize shipping errors. The Company offers reduced freight rates and flexible delivery options to minimize a reseller’s need for inventory.
5
Table of Contents
Index to Financial Statements
Financial Services
The Company routinely offers competitive credit terms relative to the specific geographic area for qualified resellers and facilitates various third-party financing options, including leasing, flooring, and other secured financing. The Company believes this policy reduces the customer’s need to establish multiple credit relationships with a large number of manufacturers.
Competition
The markets in which the Company operates, as identified above, are highly competitive. Competition is based primarily on factors such as price, product availability, speed and accuracy of delivery, effectiveness of sales and marketing programs, credit availability, ability to tailor specific solutions to customer needs, quality and breadth of product lines and services, and availability of technical and product information.
In the ScanSource POS and Barcoding sales unit, the Company competes with broad-line distributors such as Avnet, Ingram Micro, Synnex and Tech Data, in all geographic segments. Additionally, the Company also competes against other smaller, more specialized AIDC and POS distributors, such as Bluestar. In the Catalyst Telecom sales unit, the Company competes against Avnet, Ingram Micro, Jenne, Tech Data, and Voda One. In the ScanSource Communications sales unit based in North America and in Europe, the Company competes against Ingram Micro, Nimans, Tech Data, and Westcon. In the ScanSource Security sales unit, which is based in North America, the Company competes against other broad-line distributors such as ADI, Synnex, and Tech Data and more specialized distributors such as Anixter and Tri-Northern. As the Company seeks to expand its business into other areas closely related to the Company’s offerings, the Company may encounter increased competition from current competitors and/or from new competitors, some of which may be the Company’s current customers.
The Company’s competitors include regional and national wholesale distributors, as well as hardware manufacturers (including most of the Company’s vendors) that sell directly to resellers and to end-users. In addition, the Company competes with master resellers that sell to franchisees, third-party dealers and end-users. Certain of the Company’s current and potential competitors have greater financial, technical, marketing and other resources than the Company has and may be able to respond more quickly to new or emerging technologies and changes in customer requirements. Certain smaller regional competitors, who are specialty two-tier or mixed model master resellers, may also be able to respond more quickly to new or emerging technologies and changes in customer requirements. Competition has increased for our sales units over the last several years as broad-line and other value-added distributors have entered into the specialty technology markets. Such competition could also result in price reductions, reduced margins and loss of market share by the Company.
Employees
As of June 30, 2010, the Company had 1,074 employees located in North America, Latin America (including Mexico) and Europe. Only employees located in Mexico are considered to be a collective bargaining unit. The Company considers its employee relations to be good.
Service Marks
The Company conducts its business under the trademarks and service marks “ScanSource POS and Barcode”, “Catalyst Telecom”, “ScanSource Communications”, “Partner Services”, and “ScanSource Security”.
The Company has been issued registrations for the service marks “ScanSource” and “Catalyst Telecom” in countries in its principal markets. These trademarks and service marks do not have value assigned to them and have a designated indefinite life. The Company does not believe that its operations are dependent upon any of its trademarks or service marks. The Company also sells products and provides services under various trademarks, service marks and trade names to which reference is made in this report that are the property of owners other than the Company.
6
Table of Contents
Index to Financial Statements
Additional Information
The Company’s principal internet address is www.scansourceinc.com. The information contained on, or that can be accessed through, the Company’s website is not incorporated by reference into this annual report. The Company has included its website address as a factual reference and does not intend it as an active link to its website. The Company provides its annual reports on Form 10-K, quarterly reports on Form 10-Q and current reports on Form 8-K, and all amendments to those reports, free of charge on www.scansourceinc.com, as soon as reasonably practicable after they are electronically filed, or furnished to, the Securities and Exchange Commission (“SEC”).
| ITEM 1A. | Risk Factors. |
The following are certain risk factors that could affect our business, financial position and results of operations. These risks should be considered in connection with evaluating the forward looking statements contained in this Annual Report on Form 10-K because these factors could cause the actual results and conditions to differ materially from those projected in the forward looking statements. There also are other risks that we may not describe, generally because we currently do not perceive them to be material, which could impact us. If any of these risks develops into actual events, our business, financial condition or results of operations could be negatively affected, the market price of our common stock could decline and you may lose all or part of your investment in our common stock. We expressly disclaim any obligation to update or revise any risk factors, whether as a result of new information, future events or otherwise, except as required by law.
Global economic instability – Current world-wide economic conditions and market disruptions may adversely affect our business and results of operations.
Financial markets throughout the world could continue to experience extreme disruption, including, among other things, severely diminished liquidity and credit availability, rating downgrades of certain investments and declining valuations and pricing volatility of others, volatile energy costs, geopolitical issues and failure and potential failures of major financial institutions. These continuing developments and the related general economic downturn may adversely impact our business and financial condition in a number of ways. The slowdown could lead to reduced information technology spending by end users, which could adversely affect our sales. The global economic downturn and instability may also result in changes in vendor terms and conditions, such as rebates, cash discounts and cooperative marketing efforts, which may result in downward pressure on our gross margins. The tightening of credit in financial markets and the general economic downturn may adversely affect the ability of our reseller customers, vendors and service providers to obtain financing for significant purchases and operations and to perform their obligations under our agreements with them. This could result in a decrease in or cancellation of orders for our products and services, could negatively impact our ability to collect our accounts receivable on a timely basis, could result in additional reserves for uncollectible accounts receivable being required, and could lead to elevated levels of obsolete inventory. Deterioration in the financial and credit market heightens the risk of customer bankruptcies and delay in payment. Significant volatility and fluctuations in the rates of exchange for the U.S. dollar against currencies such as the Euro, could also negatively impact our customer pricing and operating results.
We continue to be unable to predict the duration and severity of the current economic downturn and disruption in financial markets or their effects on our business and results of operations.
People – If we cannot continue to hire and retain high quality employees, our business and financial results may be negatively affected.
Our operating results could be adversely affected by increased competition for employees, higher employee turnover, or increased salary and benefit costs. Like most businesses, our employees are important to our success and we are dependent in part on our ability to retain the services of our key management, sales, IT, operational, finance and administrative personnel. We have built our business on a set of core values and we attempt to hire employees who are committed to these values. We want employees who will fit our culture of providing
7
Table of Contents
Index to Financial Statements
exceptional service to our vendors and customers. In order to compete and to continue to grow, we must attract, retain, and motivate employees, including those in executive, senior management, sales, marketing, logistics, technical support and other operating positions.
Many of our employees work in small teams to provide specific services to vendors and customers. They are trained to develop their knowledge of vendor products, programs and practices, and customer business needs, as well as to enhance the skills required to provide exceptional service and to manage our business. As they gain experience and develop their knowledge and skills, our employees become highly desired by other businesses. Therefore, to retain our employees, we have to provide a satisfying work environment and competitive compensation and benefits. If our costs to retain our skilled employees increase, then our business and financial results may be negatively affected.
Our continued growth is also dependent, in part, on the skills, experience and efforts of our senior management, including but not limited to, Michael Baur, our Chief Executive Officer. We may not be successful in retaining the members of our senior management team or our other key employees. While we have entered into employment agreements with key executives and have obtained a key person life insurance policy on our CEO’s life, the loss of the services of Mr. Baur or any member of our senior management team could also have an adverse effect on our business, financial condition and results of operations.
Vendor relationships – Terminations of a distribution or services agreement or a significant change in supplier terms, authorizations, or lack of product availability, or conditions of sale could negatively affect our operating margins, revenue or the level of capital required to fund our operations.
A significant percentage of our net sales relates to products sold to us by relatively few vendors. As a result of such concentration risk, terminations of supply or services agreements or a significant change in terms or conditions of sale from one or more of our more significant vendors could negatively affect our operating margins, revenues or the level of capital required to fund our operations. Our vendors have the ability to make significantly adverse changes in their sales terms and conditions, such as reducing the level of purchase discounts and rebates they make available to us. We have no guaranteed price or delivery agreements with our significant vendors. In certain product categories, limited price protection or return rights offered by our vendors may have a bearing on the amount of product we may be willing to stock. Our inability to pass through to our reseller customers the impact of these changes, as well as our failure to develop systems to manage ongoing vendor programs, could cause us to record inventory write-downs or other losses and could have significant negative impact on our gross margins.
We receive purchase discounts and rebates from some vendors based on various factors, including goals for quantitative and qualitative sales or purchase volume and customer related metrics. Certain purchase discounts and rebates may affect gross margins. Many purchase discounts from vendors are based on percentage increases in sales of products. Our operating results could be negatively impacted if these rebates or discounts are reduced or eliminated or if our vendors significantly increase the complexity of process and costs for us to receive such rebates.
Our ability to obtain particular products or product lines in the required quantities and to fulfill customer orders on a timely basis is critical to our success. Our manufacturers have experienced product supply shortages from time to time due to the inability of certain suppliers to supply certain products on a timely basis. As a result, we have experienced, and may in the future continue to experience, short-term shortages of specific products. In addition, vendors who currently distribute their products through us may decide to shift to or substantially increase their existing distribution, through other distributors, their own dealer networks, or directly to resellers or end-users. Suppliers have, from time to time, made efforts to reduce the number of distributors with which they do business. This could result in more intense competition as distributors strive to secure distribution rights with these vendors, which could have an adverse effect on our operating results. If vendors are not able to provide us with an adequate supply of products to fulfill our customer orders on a timely basis or we cannot otherwise obtain particular products or a product line or vendors substantially increase their existing distribution through other distributors, their own dealer networks, or directly to resellers, our reputation, sales and profitability may suffer.
8
Table of Contents
Index to Financial Statements
Customer relationships – We operate in a highly competitive environment and good customer relations are critical to our success. There can be no assurance that we will be able to retain and expand our customer relationships or acquire new customers.
Meeting our customers’ needs quickly and fairly is critical to our business success. Our transactions with our customers are generally performed on a purchase order basis rather than under long term supply agreements. Our customers generally do not have an obligation to purchase from us. Therefore, our customers can readily switch vendors. From time to time, we experience shortages in availability of some products from vendors, and this impacts our customers’ decisions regarding whether to make purchases from us. Anything that negatively impacts our customer relations also can negatively impact our operating results. Accordingly, our sales can vary as a result of fluctuations in pricing, product availability, and general competitive and economic conditions.
Centralized functions – We have centralized a number of functions to provide efficient support to our business. As a result, a loss or reduction of use of one of our locations could have an adverse effect on our business operations and financial results.
In order to be as efficient as possible, we centralize a number of critical functions. For instance, we currently distribute products in North America from a single warehouse near Memphis, Tennessee (with corresponding arrangements for our Latin American and European markets). Similarly, we utilize a single information system based in Greenville, South Carolina. While we have backup systems and business continuity plans, any significant or lengthy interruption of our ability to provide these centralized functions could significantly impair our ability to continue normal business operations. In addition, the centralization of these functions increases our exposure to local risks, such as the availability of qualified employees and the lessening of competition for critical services, such as freight and communications.
Although we have business interruption insurance, not all losses are covered, and an uninsured loss from electrical or telephone failure, fire or other casualty, or other disruption could have an adverse effect on our business, financial condition, and results of operations. In addition, there are limits on all of our insurance coverage, and it is possible that losses might exceed that coverage.
Systems – Our ability to manage our business and monitor results is highly dependent upon information and communication systems. A failure of these systems could disrupt our business.
We are highly dependent upon a variety of internal computer and telecommunication systems to operate our business. Our customers rely increasingly on our electronic ordering and information systems as a source for product information, including availability and pricing. There can be no assurance that our systems will not fail or experience disruptions, and any significant failure or disruption of these systems could prevent us from making sales, ordering and delivering products and otherwise conducting our business. Many of our customers use our website to check real-time product availability, see their customized pricing and to place orders. The Internet and individual websites have experienced a number of disruptions and slowdowns. In addition, some websites have experienced security breakdowns. While our website has not experienced any material disruptions or security breakdowns, any disruptions or breaches in security or a breach that compromises sensitive information could harm our relationship with our vendors, customers and other business partners. Any material disruption of our website or the Internet in general could impair our order processing or prevent our vendors and customers from accessing information and cause us to lose business.
In order to continue support of our growth, we plan to make significant technological upgrades to our information systems. This can be a lengthy and expensive process that may result in a significant diversion of resources from other operations. In addition, the information systems of companies we acquire may not be sufficient to meet our standards or we may not be able to successfully convert them to provide acceptable information on a timely and cost-effective basis. In addition, we must attract and retain qualified people to operate our systems, expand and improve them, integrate new programs effectively with our existing programs,
9
Table of Contents
Index to Financial Statements
and convert to new systems efficiently when required. Any disruption to our business due to such issues, or an increase in our costs to cover these issues that is greater than what we have anticipated, could have an adverse affect on our financial results and operations.
In addition, the information systems of companies we acquire may not be sufficient to meet our standards or we may not be able to successfully convert them to provide acceptable information on a timely and cost-effective basis. In addition, we must attract and retain qualified people to operate our systems, expand and improve them, integrate new programs effectively with our existing programs, and convert to new systems efficiently when required.
International operations – Our international operations expose us to risks that are different from, or possibly greater than, the risks we are exposed to domestically.
We currently have facilities in seven countries outside the United States and sell products in a number of others. A significant portion of our revenue is derived from our international operations. These operations are subject to a variety of risks that either are in addition to the risks that we face domestically or are similar risks but with potentially greater exposure. These risks include:
| • | Changes in international trade laws, such as the North American Free Trade Agreement, affecting our import and export activities, including export license requirements, restrictions on the export of certain technology, and tariff changes; |
| • | Difficulties in collecting accounts receivable and longer collection periods; |
| • | Changes in, or expiration of, various foreign incentives that provide economic benefits to us; |
| • | Changes in labor laws and regulations affecting our ability to hire and retain employees; |
| • | Difficulties in staffing and managing operations in foreign countries; |
| • | Fluctuations of foreign currency, exchange controls and currency devaluations; |
| • | Changes in the interpretation and enforcement of laws (in particular related to items such as duty and taxation); |
| • | Potential political and economic instability and changes in governments; |
| • | Terrorist or military actions that result in destruction or seizure of our assets or suspension or disruption of our operations or those of our customers; |
| • | Potential regulatory changes, including foreign environmental restrictions; and |
| • | Different general economic conditions. |
Because we have operations in Canada, Mexico and Europe, we are exposed to fluctuations in foreign currency exchange rates. Exchange rate fluctuations may cause our international results to fluctuate significantly when reflected in U.S. Dollar terms. We manage our exposure to fluctuations in the value of currencies using various derivative instruments. However, we may not be able to mitigate all foreign currency related risk.
In addition, in foreign markets we are more dependent upon third party providers of key services, such as third party freight forwarders and third party warehouses. Adverse changes in any of these third party services could have an adverse effect on our business, financial condition, and results of operations. As we expand our international operations, we expect these risks to increase.
10
Table of Contents
Index to Financial Statements
In addition, the value of our equity investment in foreign countries, such as our purchase of Algol Europe, GmbH in 2009, may fluctuate based on changes in foreign currency exchange rates. These fluctuations may result in losses in the event a foreign subsidiary is sold or closed at a time when the foreign currency is weaker than when we initially invested.
Credit exposure – We have credit exposure to our reseller customers. Any adverse trends in their businesses could cause us to suffer credit losses.
We have credit exposure to our reseller customers and negative trends in their businesses could increase our credit risk. As is customary in our industry, we extend credit to our reseller customers and most of our sales are on open accounts. We may be unable to collect on receivables if our reseller customers experience decreases in demand for their products and services, do not manage their businesses adequately, or otherwise become less able to pay due to adverse economic conditions. As we grow and compete for business, our typical payment terms tend to be longer, and therefore may increase our credit risk.
While we evaluate resellers’ qualifications for credit and monitor our extensions of credit, these efforts cannot prevent all credit losses, and credit losses in excess of historical levels would negatively impact our performance. In addition, for financial reporting purposes we estimate future credit losses and establish an appropriate reserve. To the extent that our credit losses exceed those reserves, our financial performance will be negatively impacted. During the past 12 months our operating expenses increased as a result of bad debt expense that we recognized primarily from a single customer. There is no guarantee that our operating expenses will not increase as a result of the recognition of bad debt expense from our reseller customers.
Terrorist or military operations – Future terrorist or military operations could result in a disruption of our operation or loss of assets in certain markets.
Future terrorist or military actions, in the United States or abroad, could result in destruction or seizure of assets or suspension or disruption of our operations. Additionally, such actions could affect the operations of our suppliers or customers, resulting in loss of access to products, potential losses on supplier programs, loss of business, higher losses on receivables or inventory, and/or other disruptions in our business, which could negatively affect our operating results. We do not carry broad insurance covering such terrorist or military actions, and even if we were to seek such coverage, the cost would likely be prohibitive.
Narrow profit margins – Our narrow margins significantly impact our operating results.
Our industry is highly competitive and characterized by narrow gross and operating margins. As a result, we have significant price competition that results in narrow gross profit and operating profit margins. Because these margins are narrow, fluctuations in sales can have a significant impact on our overall operating results.
Competition – We experience intense competition in all of our markets. Such competition could result in reduced margins and loss of our market share.
The markets that we operate in are highly competitive. We compete on the basis of price, product availability, speed and accuracy of delivery, effectiveness of sales and marketing programs, credit availability, ability to tailor solutions to the needs of our customers, quality and breadth of product line and services, and availability of technical and product information. Our competitors include regional and national wholesale distributors as well as hardware manufacturers (including most of our vendors) that sell directly to resellers and to end users. In addition, we compete with master resellers that sell to franchisees, third party dealers and end-users. Certain of our current and potential competitors have greater financial, technical, marketing and other resources than we have and may be able to respond more quickly to new or emerging technologies and changes in customer requirements. Certain smaller, regional competitors, who are specialty two-tier or mixed model master resellers, may also be able to respond more quickly to new or emerging technologies and changes in
11
Table of Contents
Index to Financial Statements
customer requirements. Competition has increased for our sales units as broad line and other value-added distributors have entered into the specialty technology markets. Such competition could result in price reductions, reduced margins and loss of our market share. As a result of intense price competition in our industry, our gross margins and our operating profit margins have historically been narrow and we expect them to be narrow in the future. To remain competitive we may be forced to offer more credit or extended payment terms to our customers. This could result in an increase in our need for capital, increase our financing costs, increase our bad debt expenses and have a negative impact on our financial results.
Growth strategies – If we fail to effectively manage and implement our organic growth strategies, we may experience a negative effect on our business and financial results.
A significant component of our growth strategy has been to add new vendors and products, and we expect to be able to enter new product markets in the future. Expansion of our existing product markets and entry into new product markets divert the use of our resources and systems, require additional resources that might not be available (or available on acceptable terms), result in new or more intense competition, may require longer implementation times or greater start-up expenditures than anticipated, and may otherwise fail to achieve the desired results in a timely fashion, if at all. In addition, while we have been very successful in adding new vendors in the past, we already represent most of the significant vendors in our primary areas of focus, and there is regular consolidation among our vendors. As a result, there may be fewer expansion opportunities of this nature in the future. If we are unable to increase our sales and earnings by expanding our product offerings in a cost effective manner, then our revenues may not grow.
Our ability to successfully manage our growth will require continued enhancement of our operational, managerial, and financial resources and controls. Our failure to effectively manage our growth could have an adverse effect on our business, financial condition, and results of operations. Additionally, our growth may increase our working capital requirements and as a result, we may require additional equity or debt financing. Such financing may not be available on terms that are favorable to us, if at all.
Acquisitions – Our growth strategy includes potential acquisitions of companies that complement or expand or existing business. Acquisitions involve a number of risks and uncertainties.
We have and expect to continue to acquire companies that complement or expand our business in the United States or internationally. Acquisitions may involve significant risks and uncertainties including distraction of management’s attention away from normal business operations; sufficient revenue generation to offset liabilities assumed and expenses associated with the acquisition; difficulty in the integration of acquired businesses, including new employees, business systems and technology; inability to adapt to challenges of new markets, including geographies, products and services, or to attract new sources of profitable business from expansion of products or services; exposure to new regulations; and issues not discovered in our due diligence process. Our operations may be adversely impacted by an acquisition that (i) is not suited for us, (ii) is improperly executed, or (iii) substantially increases our debt. Any of these factors could adversely affect our operating results or financial condition.
Inventory – The value of our inventory may be adversely affected by market and other factors.
Our business, like that of other distributors, is subject to the risk that the value of our inventory will be adversely affected by price reductions by manufacturers or by technological changes affecting the usefulness or desirability of our products. Under the terms of most of our vendor agreements and the policy of most manufacturers of specialty technology products, we have some price protection and stock rotation opportunities with respect to slow moving or obsolete inventory items. However, these protections are limited in scope and do not protect against all declines in inventory value, excess inventory, or product obsolescence, and in some instances we may not be able to fulfill all necessary conditions or successfully manage such price protection or stock rotation opportunities. In addition, these industry practices are sometimes not reflected in vendor
12
Table of Contents
Index to Financial Statements
agreements and their application in a particular situation is dependent upon negotiations between our vendors and us. As a result, from time-to-time we are required to write down the value of excess and obsolete inventory, and should any of these write-downs occur at a significant level, they could have an adverse effect on our business, financial condition, and results of operations.
Should the current economic downturn persist, it is possible that prices may decline due to an oversupply of product, and therefore, there may be a greater risk of declines in inventory value. In addition, our vendors may become insolvent and unable to fulfill their product obligations to us. Significant declines in inventory value in excess of established inventory reserves or dramatic changes in prevailing technologies could have an adverse effect on our business, financial condition, and results of operations.
Laws and regulations – Changes in tax laws, and other laws and regulations may adversely impact us.
We are subject to a wide range of local, state and federal laws and regulations both in the United States and in the other countries in which we operate. While we plan our operations based upon existing and anticipated laws and regulations, we cannot anticipate every change and can have only little, if any, impact on others. We are particularly susceptible to changes in income and other tax laws, laws regulating international trade, and accounting and securities disclosure laws and regulations. To a lesser degree, changes in environmental regulation, including electronic waste recovery legislation, may impact us. In each case, a change in the laws or regulations that we are required to comply with could have an adverse impact on our business operations or financial results.
Accounting rules – Changes in accounting rules or standards could have a significant adverse affect on our reported earnings.
Our financial statements are prepared in accordance with U.S. generally accepted accounting principles. These principles are subject to interpretations by various governing bodies including the Financial Accounting Standards Board, the Public Accounting Oversight Board, the SEC and the American Institute of Certified Public Accountants. These governing bodies create and interpret appropriate accounting standards. Future periodic assessments required by current or new accounting standards may result in additional non-cash charges and/or changes in presentation or disclosure. A change from current accounting standards could have a significant adverse effect on our financial position or results of operations.
Quarterly fluctuations – Our net sales and operating results are dependent on a number of factors. Our net sales may fluctuate from quarter to quarter and these fluctuations may cause volatility in our stock price.
Our net sales and operating results may fluctuate quarterly as a result of changes in demand for our products and services, the introduction of new technology, actions by our competitors, changes in vendors’ prices or price protection policies, changes in vendors’ business practices or strategies, changes in freight rates, the timing of the addition of operating expenses to support our growth, the timing of major marketing or other service projects, product supply shortages, changes in product mix, and the general economic factors referenced above. In addition, a substantial portion of our net sales in each quarter results from orders booked in that quarter, which are difficult to accurately forecast in advance. As a result, our performance in one period may vary significantly from our performance in the preceding quarter, and may differ significantly from our forecast of performance from quarter to quarter. The impact of these variances may cause volatility in our stock price.
Third-party freight carriers – We are dependent on third-parties for the delivery of a majority of our products. Changes in shipping terms or the failure or inability of our third-party shippers to perform could have an adverse impact on our business and results of operations.
We are dependent upon major shipping companies, including Federal Express and United Parcel Service, for the shipment of our products to and from our centralized warehouses. Changes in shipping terms, or the
13
Table of Contents
Index to Financial Statements
inability of these third-party shippers to perform effectively (whether as a result of mechanical failure, casualty loss, labor stoppage, or any other reason), could have an adverse effect on our business, financial condition, and results of operations. From time to time, we have experienced significant increases in shipping costs due to increases in fuel costs. If our shipping costs increase, it may adversely affect our financial results if we are unable to pass on these higher costs to our customers.
Litigation – We routinely are involved in litigation that can be costly and lead to adverse results.
In the ordinary course of our business, we are involved in a wide range of disputes, some of which result in litigation. In addition, as a public company with a large shareholder base, we are susceptible to class-action and other litigation resulting from disclosures that we make and our other activities. Litigation is expensive to bring and defend, and the outcome of litigation can be adverse and significant. Not all adverse outcomes can be anticipated, and applicable accounting rules do not always require or permit the establishment of a reserve until a final result has occurred or becomes probable and estimable. In some instances we are insured for the potential losses; in other instances we are not. An uninsured adverse outcome in significant litigation could have an adverse effect on our business, financial condition and results of operations.
Liquidity and capital resources – Market factors may increase the cost and availability of capital. Additional capital may not be available to us on acceptable terms to fund our working capital needs and growth.
Our business requires significant levels of capital to finance accounts receivable and product inventory that is not financed by trade creditors. We have an increased demand for capital when our business is expanding, including through acquisitions. Changes in payment terms with either suppliers or customers could increase our capital requirements. We have historically relied upon cash generated from operations, borrowings under our revolving credit facility, secured and unsecured borrowings, and, to a lesser extent, borrowings under a subsidiary’s line of credit to satisfy our capital needs and to finance growth. While we believe that our existing sources of liquidity will provide sufficient resources to meet our current working capital and cash requirements, if we require capital to meet our future business needs, such capital may not be available to us on terms acceptable to us, or at all. Changes in how lenders rate our credit worthiness, as well as macroeconomic factors such as the current economic downturn and global economic instability may restrict our ability to raise capital in adequate amounts or on terms acceptable to us, and the failure to do so could harm our ability to operate our business.
In addition, our cash and cash equivalents are deposited with various financial institutions located in the various countries in which we operate. We endeavor to monitor these financial institutions regularly for credit quality; however, we are exposed to risk of loss on such funds or we may experience significant disruptions in our liquidity needs if one or more of these financial institutions were to suffer bankruptcy or similar restructuring.
| ITEM 1B. | Unresolved Staff Comments. |
Not applicable.
| ITEM 2. | Properties. |
The Company owns a 70,000 square foot building in Greenville, South Carolina, which is the site of its principal executive and sales offices, and a 103,000 square foot building on adjacent property, of which approximately 70,000 feet is subleased to an unrelated third parties.
North American Distribution Facilities
In February 2008, the Company completed the process of relocating its North American distribution operations from Memphis, Tennessee to its current location in Southaven, Mississippi, allowing for substantially
14
Table of Contents
Index to Financial Statements
expanded warehousing capacity. The Southaven facility accommodates approximately 600,000 square feet with an optional 147,000 square feet of available expansion space. A subsidiary of the Company entered into a ten-year lease associated with this facility, with options to extend the lease for two consecutive five-year periods. Shortly after operations commenced in the Southaven facility, the Company completed the sale of its former distribution facility in Memphis, Tennessee.
The Company or its subsidiaries also have offices, each of 10,000 square feet or less, in leased facilities in Norcross, Georgia; Williamsville, New York; Tempe, Arizona; Lenexa, Kansas; Eagan, Minnesota; and Toronto, Canada.
International Distribution Facilities
The Company or its subsidiaries lease 22,000 square feet of office and distribution center space in Miami, Florida and 25,000 square feet of office and distribution center space in Mexico City, Mexico, and 17,000 square feet of office space in Brussels, Belgium. The Company or its subsidiaries lease approximately 38,000 square feet of third party warehouse space in Liege, Belgium and 2,884 square feet of office and distribution center space in Cologne, Germany. During the last part of this year, the Company consolidated the Egham, U.K. distribution facility for communications products into its Liege, Belgium facility, continuing its efforts to gain additional efficiencies and economies of scale.
The Company or its subsidiaries have additional sales offices, each of 10,000 square feet or less, in leased facilities in Bad Homburg, Germany; Hull, England; Crawley, England; Egham, England; Olivet, France; and Eindhoven, Netherlands.
Management believes the Company’s office and warehouse facilities are adequate to support its operations at their current levels and for the foreseeable future.
| ITEM 3. | Legal Proceedings. |
The Company and its subsidiaries are, from time to time, parties to lawsuits arising out of operations. Although there can be no assurance, based upon information known to the Company, the Company believes that any liability resulting from an adverse determination of such lawsuits would not have a material adverse effect on the Company’s financial condition or results of operations.
| ITEM 4. | Removed and Reserved. |
15
Table of Contents
Index to Financial Statements
PART II
| ITEM 5. | Market For Registrant’s Common Equity, Related Stockholder Matters and Issuer Purchases of Equity Securities. |
The Company’s common stock is quoted on the NASDAQ Global Select Market under the symbol “SCSC.” The Company has never paid or declared a cash dividend since inception and the Board of Directors does not intend to institute a cash dividend policy in the foreseeable future. Under the terms of the Company’s revolving credit facility, the payment of cash dividends is restricted. As of August 24, 2010, there were approximately 569 holders of record of our common stock. The following table sets forth, for the periods indicated, the high and low sales prices of the Company’s common stock on the NASDAQ Global Select Market.
| High | Low | |||||
| Fiscal Year 2010 |
||||||
| First quarter |
$ | 31.50 | $ | 23.37 | ||
| Second quarter |
32.40 | 22.70 | ||||
| Third quarter |
30.67 | 24.90 | ||||
| Fourth quarter |
30.29 | 22.98 | ||||
| Fiscal Year 2009 |
||||||
| First quarter |
$ | 34.74 | $ | 25.18 | ||
| Second quarter |
29.09 | 13.58 | ||||
| Third quarter |
20.59 | 13.78 | ||||
| Fourth quarter |
27.64 | 16.59 | ||||
16
Table of Contents
Index to Financial Statements
Stock Performance Chart
The following stock performance graph compares cumulative total shareholder return on the Company’s common stock over a five-year period with the Nasdaq Market Index and with the Standard Industrial Classification (“SIC”) Code Index (SIC Code 5045 – Wholesale Computers and Peripheral Equipment and Software) for the same period. Total shareholder return represents stock price changes and assumes the reinvestment of dividends. The graph assumes the investment of $100 on June 30, 2005.
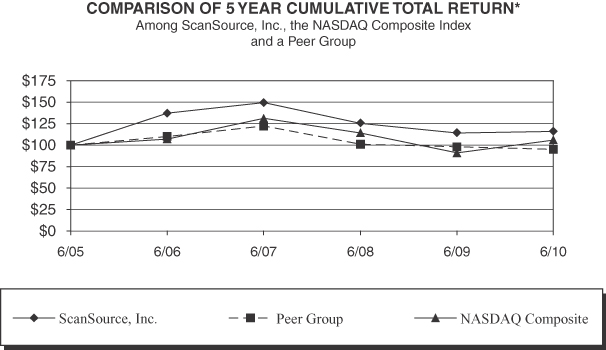
| 2005 | 2006 | 2007 | 2008 | 2009 | 2010 | |||||||||||||
| ScanSource, Inc. |
$ | 100 | $ | 137 | $ | 149 | $ | 125 | $ | 114 | $ | 116 | ||||||
| SIC Code 5045 – Computers & Peripheral Equipment |
$ | 100 | $ | 110 | $ | 122 | $ | 101 | $ | 98 | $ | 95 | ||||||
| NASDAQ Market Index |
$ | 100 | $ | 107 | $ | 131 | $ | 114 | $ | 91 | $ | 106 | ||||||
17
Table of Contents
Index to Financial Statements
| ITEM 6. | Selected Financial Data. |
The selected financial data below should be read in conjunction with “Management’s Discussion and Analysis of Financial Condition and Results of Operations” and the consolidated financial statements and related notes thereto included elsewhere in this Annual Report on Form 10-K. The following statement of income data and balance sheet data were derived from the Company’s consolidated financial statements.
FIVE YEAR FINANCIAL SUMMARY
| Fiscal Year Ended June 30, | ||||||||||||||||||||
| 2010 | 2009 | 2008(1) | 2007(1) | 2006(1) | ||||||||||||||||
| (in thousands, except per share data) | ||||||||||||||||||||
| Statement of income data: |
||||||||||||||||||||
| Net sales |
$ | 2,114,979 | $ | 1,847,969 | $ | 2,175,485 | $ | 1,986,927 | $ | 1,665,600 | ||||||||||
| Cost of goods sold |
1,896,052 | 1,639,121 | 1,947,867 | 1,776,255 | 1,497,248 | |||||||||||||||
| Gross profit |
218,927 | 208,848 | 227,618 | 210,672 | 168,352 | |||||||||||||||
| Selling, general and administrative expenses |
143,151 | 134,730 | 133,653 | 135,339 | 105,042 | |||||||||||||||
| Operating income |
75,776 | 74,118 | 93,965 | 75,333 | 63,310 | |||||||||||||||
| Interest expense, net |
85 | 771 | 3,959 | 6,804 | 1,620 | |||||||||||||||
| Other (income) expense, net |
(50 | ) | (2,307 | ) | (212 | ) | (144 | ) | 57 | |||||||||||
| Income before income taxes and minority interest |
75,741 | 75,654 | 90,218 | 68,673 | 61,633 | |||||||||||||||
| Provision for income taxes |
26,929 | 27,966 | 34,586 | 25,987 | 21,592 | |||||||||||||||
| Consolidated net income |
48,812 | 47,688 | 55,632 | 42,686 | $ | 40,041 | ||||||||||||||
| Noncontrolling interest in income of subsidiary |
- | - | - | (60 | ) | (225 | ) | |||||||||||||
| Net income attributable to shareholders of ScanSource |
$ | 48,812 | $ | 47,688 | $ | 55,632 | $ | 42,626 | $ | 39,816 | ||||||||||
| Net income per common share, basic |
$ | 1.83 | $ | 1.80 | $ | 2.13 | $ | 1.65 | $ | 1.56 | ||||||||||
| Weighted-average shares outstanding, basic |
26,605 | 26,445 | 26,098 | 25,773 | 25,491 | |||||||||||||||
| Net income per common share, diluted |
$ | 1.82 | $ | 1.79 | $ | 2.10 | $ | 1.63 | $ | 1.53 | ||||||||||
| Weighted-average shares outstanding, diluted |
26,869 | 26,588 | 26,445 | 26,213 | 26,034 | |||||||||||||||
| As of June 30, | ||||||||||||||||||||
| 2010 | 2009 | 2008 | 2007 | 2006 | ||||||||||||||||
| (in thousands) | ||||||||||||||||||||
| Balance sheet data: |
||||||||||||||||||||
| Working capital |
$ | 436,953 | $ | 399,647 | $ | 368,636 | $ | 352,955 | $ | 262,171 | ||||||||||
| Total assets |
859,750 | 748,631 | 772,206 | 738,448 | 617,497 | |||||||||||||||
| Total long-term debt (including current portion) |
30,429 | 30,429 | 56,623 | 107,730 | 32,185 | |||||||||||||||
| Total shareholders’ equity |
486,851 | 445,446 | 395,753 | 324,744 | 273,409 | |||||||||||||||
| (1) | Included in the statement of income for the fiscal years ended June 30, 2008 and 2007 are $1.0 million and $9.9 million, respectively, of direct costs associated with the special committee review of the Company’s stock option practices. See Note 1A to the Notes to Consolidated Financial Statements included in Part II, Item 8 of the Company’s amended Annual Report on Form 10-K/A for the fiscal year ended June 30, 2006. |
18
Table of Contents
Index to Financial Statements
| ITEM 7. | Management’s Discussion and Analysis of Financial Condition and Results of Operations. |
Certain statements within this Annual Report on Form 10-K, including this Management’s Discussion and Analysis of Financial Condition and Results of Operations (“MD&A”), are not historical facts and contain “forward-looking statements” as described in the “safe harbor” provision of the Private Securities Litigation Reform Act of 1995. These statements involve a number of risks and uncertainties and actual results could differ materially from those projected. Factors that could cause actual results to differ materially include the following: our ability to retain key employees, particularly senior management; our ability to retain and expand our existing and new customer relationships; our dependence on vendors, product supply, and availability; our ability to centralize certain functions to provide efficient support to our business; our dependence upon information systems; our ability to manage the potential adverse effects of operating in foreign jurisdictions; our ability to manage and limit our credit exposure due to the deterioration in the financial condition of our customers; our ability to remain profitable in the face of narrow margins; our ability to compete in new and existing markets that are highly competitive; our ability to manage our business when general economic conditions are poor; our ability to effectively manage and implement our growth strategies; our ability to manage and negotiate successful pricing and stock rotation opportunities associated with inventory value decreases; our ability to anticipate adverse changes in tax laws, accounting rules, and other laws and regulations; our inability to eliminate potential volatility in our net sales and operating results on a quarterly basis as a result of changes in demand for our products; our dependence on third-party freight carriers; our inability to resolve or settle potentially adverse litigation matters; and our inability to obtain required capital at acceptable terms to fund our working capital and growth strategies. Additional discussion of these and other factors affecting our business and prospects is contained in our periodic filings with the SEC, copies of which can be obtained under the “Investors Relations” tab on website at www.scansourceinc.com. Please refer to the cautionary statements and important factors discussed in Item 1A. “Risk Factors” in this Annual Report on Form 10-K for further information. This discussion and analysis should be read in conjunction with “Selected Financial Data” and the Consolidated Financial Statements and the Notes thereto included elsewhere in this Annual Report on Form 10-K.
Overview
ScanSource, Inc. is a leading wholesale distributor of specialty technology products, providing value-added distribution sales to resellers in the specialty technology markets. The Company distributes more than 65,000 products worldwide. The Company has two geographic distribution segments: one serving North America from the Southaven, Mississippi distribution center, and an international segment currently serving Latin America (including Mexico) and Europe from distribution centers located in Florida and Mexico, and in Belgium and Germany, respectively. The North American distribution segment markets automatic identification and data capture (“AIDC”) and point-of-sale (“POS”) products through its ScanSource POS and Barcoding sales unit; voice, data and converged communications equipment through its Catalyst Telecom sales unit; video conferencing, telephony and communications products through its ScanSource Communications sales unit; and electronic security products and wireless infrastructure products through its ScanSource Security sales unit. The international distribution segment markets AIDC, POS and Barcode, communications, and security products through its ScanSource Latin America sales unit; POS and AIDC products through its ScanSource Europe sales unit, and communication products through its ScanSource Communications sales unit in Europe.
The Company was incorporated in South Carolina in December 1992 and is headquartered in Greenville, South Carolina. The Company serves North America from a single, centrally located distribution center located in Southaven, Mississippi, near the FedEx hub. The single warehouse and strong management information system form the cornerstone of the Company’s cost-driven operational strategy. This strategy has been expanded to Latin America and Europe, with distribution centers located in Florida and Mexico, and in Belgium and Germany, respectively.
On November 30, 2009 the Company acquired substantially all of the assets and certain liabilities of Algol Europe, GmbH, a value added distributor specializing in convergence communication solutions. Algol,
19
Table of Contents
Index to Financial Statements
headquartered in Cologne, Germany, was renamed ScanSource Communications GmbH and joined ScanSource Communications UK as part of ScanSource Communications Europe.
North American Distribution Segment
The Company’s North American distribution segment sells products exclusively to resellers and integrators in large and growing technology markets. Key AIDC vendors include Cisco, Datalogic, Honeywell, Intermec, Motorola and Zebra, and leading POS lines include Elo, Epson America, IBM, and NCR. Key communications vendors include Aruba, Avaya, Extreme Networks, Juniper Networks, Plantronics and Polycom, while Dialogic supplies key components for the converged communications market. Key electronic security vendors include Alvarion, Axis, Cisco Security, Datacard, HID, Motorola Wireless, Panasonic, Sony, Tropos, United Technologies Fire and Security, and Zebra Card.
International Distribution Segment
The Company’s international distribution segment sells AIDC, POS, security, and communications products exclusively to resellers and integrators in the Latin American (including Mexico) and European markets principally from the same product manufacturers as those sold by the North American distribution segment. Marketing efforts to recruit new reseller customers, competitive product pricing, the addition of new vendors, and strategic acquisitions have driven growth in net sales.
Cost Control/Profitability
The Company’s operating income growth is driven not only by gross profits but by a disciplined control of operating expenses. The Company’s operations feature a scalable information system, streamlined management, and centralized distribution, enabling it to achieve the economies of scale necessary for cost-effective order fulfillment. From its inception, the Company has managed its general and administrative expenses by maintaining strong cost controls. However, in order to continue to grow its markets, the Company has invested in new initiatives including investments in new geographic markets of Europe and Latin America, increased marketing efforts to recruit resellers, enhancements of employee benefit plans to retain employees, and strategic acquisitions in both the North American and International distribution segments.
Evaluating Financial Condition and Operating Performance
The Company’s management places a significant emphasis on operating income and return on invested capital (“ROIC”) in evaluating and monitoring the Company’s financial condition and operating performance. ROIC is used by the Company to assess its efficiency at allocating the capital under its control to generate returns. ROIC is computed by the Company as net income plus income taxes, interest expense, depreciation and amortization divided by invested capital. Invested capital is defined as average equity plus average interest bearing debt for the period.
The following table summarizes the Company’s return on invested capital ratio for the fiscal years ended June 30, 2010, 2009, and 2008, respectively:
| 2010 | 2009 | 2008 | |||||||
| Return on invested capital ratio |
16.7 | % | 17.7 | % | 22.7 | % | |||
20
Table of Contents
Index to Financial Statements
The discussion that follows this overview explains the decrease in ROIC from the comparative periods shown above. The Company uses ROIC as a performance measurement because it believes that this metric best balances the Company’s operating results with its asset and liability management, it excludes the results of capitalization decisions, is easily computed, communicated and understood and drives changes in shareholder value. The components of this calculation and reconciliation to the Company’s financial statements are shown, as follows:
| Reconciliation of EBITDA to Net Income |
||||||||||||
| Fiscal Year Ended June 30, | ||||||||||||
| 2010 | 2009 | 2008 | ||||||||||
| (in thousands) | ||||||||||||
| Net income |
$ | 48,812 | $ | 47,688 | $ | 55,632 | ||||||
| Plus: income taxes |
26,929 | 27,966 | 34,586 | |||||||||
| Plus: interest expense |
1,472 | 2,176 | 5,471 | |||||||||
| Plus: depreciation & amortization |
6,064 | 6,781 | 7,127 | |||||||||
| EBITDA (numerator) |
$ | 83,277 | $ | 84,611 | $ | 102,816 | ||||||
| Invested capital calculations |
||||||||||||
| Fiscal Year Ended June 30, | ||||||||||||
| 2010 | 2009 | 2008 | ||||||||||
| (in thousands) | ||||||||||||
| Equity – beginning of the year |
$ | 445,446 | $ | 395,753 | $ | 324,744 | ||||||
| Equity – end of the year |
486,851 | 445,446 | 395,753 | |||||||||
| Average equity |
466,148 | 420,600 | 360,249 | |||||||||
| Average debt(1) |
31,800 | 57,605 | 92,456 | |||||||||
| Invested capital (denominator) |
$ | 497,948 | $ | 478,205 | $ | 452,705 | ||||||
| Return on invested capital |
16.7 | % | 17.7 | % | 22.7 | % | ||||||
| (1) | Average debt is based upon average outstanding daily debt. |
Results of Operations
The following table sets forth for the periods indicated certain income and expense items as a percentage of net sales:
| Fiscal Year Ended June 30, | |||||||||
| 2010 | 2009 | 2008 | |||||||
| Statement of income data: |
|||||||||
| Net sales |
100.0 | % | 100.0 | % | 100.0 | % | |||
| Cost of goods sold |
89.6 | 88.7 | 89.5 | ||||||
| Gross profit |
10.4 | 11.3 | 10.5 | ||||||
| Selling, general and administrative expenses |
6.8 | 7.3 | 6.2 | ||||||
| Operating income |
3.6 | 4.0 | 4.3 | ||||||
| Interest expense (income), net |
- | - | 0.2 | ||||||
| Other (income) expense, net |
- | (0.1 | ) | - | |||||
| Income before income taxes and minority interest |
3.6 | 4.1 | 4.1 | ||||||
| Provision for income taxes |
1.3 | 1.5 | 1.5 | ||||||
| Net income |
2.3 | % | 2.6 | % | 2.6 | % | |||
21
Table of Contents
Index to Financial Statements
Comparison of Fiscal Years Ended June 30, 2010 and 2009
Net Sales
The Company has two reporting segments, which are based on geographic location. The following table summarizes the Company’s net sales results (net of inter-segment sales) for each of these product categories and reporting segments for the comparable fiscal years ending June 30th:
Product Category
| 2010 | 2009 | $ Change | % Change | |||||||||
| (in thousands) | ||||||||||||
| POS, barcoding and security products |
$ | 1,300,525 | $ | 1,161,956 | $ | 138,569 | 11.9 | % | ||||
| Communications products |
814,454 | 686,013 | 128,441 | 18.7 | % | |||||||
| Net Sales |
$ | 2,114,979 | $ | 1,847,969 | $ | 267,010 | 14.4 | % | ||||
Geographic Segments
| 2010 | 2009 | $ Change | % Change | |||||||||
| (in thousands) | ||||||||||||
| North American distribution segment |
$ | 1,666,012 | $ | 1,500,144 | $ | 165,868 | 11.1 | % | ||||
| International distribution segment |
448,967 | 347,825 | 101,142 | 29.1 | % | |||||||
| Total net sales |
$ | 2,114,979 | $ | 1,847,969 | $ | 267,010 | 14.4 | % | ||||
Consolidated net sales for the fiscal year ended June 30, 2010 increased 14.4% to $2.1 billion in comparison to prior fiscal year net sales of $1.85 billion.
North American Distribution
The North American distribution segment includes sales to technology resellers in the United States and Canada that originate from our centralized distribution facility located in Southaven, Mississippi. Sales to technology resellers in Canada accounted for less than 4% of total net sales for both fiscal years presented. For the fiscal year ended June 30, 2010, net sales for this segment increased by approximately $165.9 million, or 11.1%, as compared to the prior fiscal year.
The Company’s North American POS, barcoding, and security product categories saw revenues increase by 9.9% in comparison to the prior fiscal year. During the fiscal year ended June 30, 2010, these units experienced stronger demand as economic conditions improved from the prior fiscal year. Sales of substantially all of our major vendors and product lines increased in comparison to the prior fiscal year, as larger deals and projects returned during the fiscal year. In addition, the Company saw strong growth in its security product lines on a comparative basis, driven by its video surveillance and wireless networking lines.
The Company has two North American sales units that sell communications products to our customers – the Catalyst Telecom and ScanSource Communications sales units. The combined sales of these units were 12.5% higher for the fiscal year ended June 30, 2010 versus the prior fiscal year. Both of these sales units also experienced sales growth due to improved economic conditions as discussed above, and a majority of the vendors in these units saw sales growth compared to the prior year.
International Distribution
The international distribution segment includes sales to Latin America (including Mexico) and Europe from the ScanSource POS and Barcoding sales unit and in Europe through the ScanSource Communications sales unit. Sales for the overall international segment increased by 29.1%, or $101 million, as compared to the prior fiscal year. However, on a constant exchange rate basis, the sales increase was approximately 29%. The constant
22
Table of Contents
Index to Financial Statements
currency increase in sales for both geographies was driven by stronger end-user demand which was largely attributable to stronger economic conditions in Europe and Latin America, and the acquisition of Algol Europe in November 2009, now part of ScanSource Communications Europe.
The fiscal year ended June 30, 2010 included incremental revenues associated with the Company’s acquisition of substantially all of the assets and certain liabilities of Algol Europe, now ScanSource Communications, GmbH, on November 30, 2009. Algol Europe was a value added distributor of specialty technologies, including voice, data, and video communications products located in Cologne, Germany. This acquisition significantly expanded the footprint of the ScanSource Communications sales unit outside of the United Kingdom and is part of the Company’s strategy to become a pan-European distributor of communications.
Gross Profit
The following table summarizes the Company’s gross profit for the fiscal years ended June 30th:
| % of Sales June 30, |
|||||||||||||||||||
| 2010 | 2009 | $ Change | % Change | 2010 | 2009 | ||||||||||||||
| (in thousands) | |||||||||||||||||||
| North American distribution segment |
$ | 167,638 | $ | 155,916 | $ | 11,722 | 7.5 | % | 10.1 | % | 10.4 | % | |||||||
| International distribution segment |
51,289 | 52,932 | (1,643 | ) | (3.1 | %) | 11.4 | % | 15.2 | % | |||||||||
| Total gross profit |
$ | 218,927 | $ | 208,848 | $ | 10,079 | 4.8 | % | 10.4 | % | 11.3 | % | |||||||
North American Distribution
Gross profit for the North American distribution segment increased $11.7 million, or 7.5%, for the fiscal year ended June 30, 2010, as compared to the prior fiscal year. The increase in gross profit was primarily the result of higher sales volume in all of our sales units, as previously discussed. While total gross profit for the North American distribution segment increased, gross profit, expressed as a percentage of net sales, actually decreased to 10.1% for the fiscal year ended June 30, 2010 as compared to 10.4% for the prior fiscal year. This was largely the result of a less favorable product mix and higher margin dilution due to an increase of larger deals and projects that traditionally carry lower margins.
International Distribution
Despite the increase in sales for the international distribution segment, gross profit actually decreased by $1.6 million, or 3.1% for the fiscal year ended June 30, 2010, as compared to the prior fiscal year. The decline in gross profit for the fiscal year ended June 30, 2010 was primarily due to the absence of strategic inventory purchases in anticipation of subsequent vendor price increases in our European operating segment that occurred in the prior year. These opportunistic purchases resulted in the achievement of significantly higher gross margins during the second half of the 2009 fiscal year. As a result, gross profit, expressed as a percentage of net sales for this segment decreased to 11.4% in the fiscal year ended June 30, 2010 versus 15.2% in the prior fiscal year.
Operating Expenses
The following table summarizes the Company’s operating expenses for the periods ended June 30th:
| % of Sales June 30, |
||||||||||||||||||
| 2010 | 2009 | $ Change | % Change | 2010 | 2009 | |||||||||||||
| (in thousands) | ||||||||||||||||||
| Operating expenses |
$ | 143,151 | $ | 134,730 | $ | 8,421 | 6.3 | % | 6.8 | % | 7.3 | % | ||||||
23
Table of Contents
Index to Financial Statements
For the fiscal year ended June 30, 2010, operating expenses were $143.2 million, a 6.3% increase from the prior year. This increase was mainly attributable to an increase in bad debt expense in the current fiscal year and approximately $4.1 million of incremental expenses related to the acquisition of Algol Europe, GmbH.
Operating expenses as a percentage of sales decreased to 6.8% for the fiscal year ended June 30, 2010, compared to 7.3% in the prior year. This decrease was largely due to the increase in net sales between the two comparable periods.
Operating Income
The following table summarizes the Company’s operating income for the fiscal years ended June 30th:
| % of Sales June 30, |
|||||||||||||||||||
| 2010 | 2009 | $ Change | % Change | 2010 | 2009 | ||||||||||||||
| (in thousands) | |||||||||||||||||||
| North American distribution |
$ | 64,342 | $ | 56,261 | $ | 8,081 | 14.4 | % | 3.9 | % | 3.8 | % | |||||||
| International distribution |
11,434 | 17,857 | (6,423 | ) | (36.0 | %) | 2.6 | % | 5.1 | % | |||||||||
| $ | 75,776 | $ | 74,118 | $ | 1,658 | 2.2 | % | 3.6 | % | 4.0 | % | ||||||||
Operating income increased 2.2% or $1.7 million for the fiscal year ended June 30, 2010 as compared to the prior fiscal year. This increase was the result of higher sales volumes experienced in both the North American and International distribution segments, offset by a higher mix of lower margin products and bad debt in the North American segment and lower margins primarily due to the lack of opportunistic purchases in the International distribution segment that occurred in the prior year.
Total Other (Income) Expense
The following table summarizes the Company’s total other (income) expense for the fiscal years ended June 30th:
| % of Sales June 30, |
|||||||||||||||||||||
| 2010 | 2009 | $ Change | % Change | 2010 | 2009 | ||||||||||||||||
| (in thousands) | |||||||||||||||||||||
| Interest expense |
$ | 1,472 | $ | 2,176 | $ | (704 | ) | (32.4 | %) | 0.1 | % | 0.1 | % | ||||||||
| Interest income |
(1,387 | ) | (1,405 | ) | 18 | (1.3 | %) | (0.1 | %) | (0.1 | %) | ||||||||||
| Net foreign exchange losses |
239 | 1,587 | (1,348 | ) | (84.9 | %) | 0.0 | % | 0.1 | % | |||||||||||
| Other, net |
(289 | ) | (3,894 | ) | 3,605 | (92.6 | %) | 0.0 | % | (0.2 | %) | ||||||||||
| Total other (income) expense |
$ | 35 | $ | (1,536 | ) | $ | 1,571 | (102.3 | %) | 0.0 | % | (0.1 | %) | ||||||||
Interest expense reflects interest paid on borrowings on the Company’s revolving credit facility and long-term debt. Interest expense for the fiscal year ended June 30, 2010 was $1.5 million compared to $2.2 million for the comparative prior year period. The decrease in interest expense was primarily the result of lower average debt balances between the respective periods.
Interest income for the period ended June 30, 2010 was consistent with the comparative prior year periods. The Company generates interest income on longer-term interest bearing receivables, and, to a much lesser extent, interest earned on cash and cash-equivalent balances on hand.
24
Table of Contents
Index to Financial Statements
Net foreign exchange gains and losses consist of foreign currency transactional and functional currency re-measurements, offset by net foreign currency exchange contract gains and losses. Foreign exchange losses and gains are generated as the result of fluctuations in the value of the Euro versus the British Pound and the U.S. Dollar versus other currencies. During the fiscal year ended June 30, 2009, the Company generated a net foreign exchange loss due to the strengthening of the U.S. Dollar against the Euro, the British Pound, the Mexican Peso, and the Canadian Dollar. While the Company utilizes foreign exchange contracts and debt in non-functional currencies to hedge foreign currency exposure, our foreign exchange policy prohibits us from entering into speculative transactions.
During the quarter ended December 31, 2008, the Company settled a claim against a former legal service provider resulting in a $3.5 million recovery. The settlement was received by the Company on December 5, 2008 and was recorded as other income.
Provision for Income Taxes
Income tax expense was $27 million and $28 million for the fiscal years ended June 30, 2010 and 2009, respectively, reflecting an effective tax rate of 35.6% and 37.0%, respectively. The decrease in the effective tax rate from the prior fiscal year is largely attributable to a favorable mix of income derived from lower tax rate jurisdictions, and reflects the benefit of changes to the international capital structure executed during the fiscal year 2010.
Net Income
The following table summarizes the Company’s net income for the fiscal year ended June 30th:
| % of Sales June 30, |
||||||||||||||||||
| 2010 | 2009 | $ Change | % Change | 2010 | 2009 | |||||||||||||
| (in thousands) | ||||||||||||||||||
| Net income |
$ | 48,812 | $ | 47,688 | $ | 1,124 | 2.4 | % | 2.3 | % | 2.6 | % | ||||||
Net income for the fiscal year ended June 30, 2010 was $48.8 million, a $1.1 million increase over the prior fiscal year. The increase in net income is attributable to the changes in operating profits previously discussed.
Comparison of Fiscal Years Ended June 30, 2009 and 2008
Net Sales
The Company has two reporting segments, which are based on geographic location. The following table summarizes the Company’s net sales results (net of inter-segment sales) for each of these reporting segments for the comparable fiscal years ending June 30th:
Product Category
| 2009 | 2008 | $ Change | % Change | ||||||||||
| (in thousands) | |||||||||||||
| POS, barcoding and security products |
$ | 1,161,956 | $ | 1,379,573 | $ | (217,617 | ) | (15.8 | %) | ||||
| Communications products |
686,013 | 795,912 | (109,899 | ) | (13.8 | %) | |||||||
| Net Sales |
$ | 1,847,969 | $ | 2,175,485 | $ | (327,516 | ) | (15.1 | %) | ||||
25
Table of Contents
Index to Financial Statements
Geographic Segments
| 2009 | 2008 | $ Change | % Change | ||||||||||
| (in thousands) | |||||||||||||
| North American distribution segment |
$ | 1,500,144 | $ | 1,777,534 | $ | (277,390 | ) | (15.6 | %) | ||||
| International distribution segment |
347,825 | 397,951 | (50,126 | ) | (12.6 | %) | |||||||
| Total net sales |
$ | 1,847,969 | $ | 2,175,485 | $ | (327,516 | ) | (15.1 | %) | ||||
Consolidated net sales for the fiscal year ended June 30, 2009 decreased 15.1% to $1.85 billion in comparison to prior fiscal year net sales of $2.18 billion.
North American Distribution
The North American distribution segment includes sales to technology resellers in the United States and Canada that originate from our centralized distribution facility located in Southaven, Mississippi. We note that sales to technology resellers in Canada accounted for less than 4% of total net sales for both fiscal years presented. For the fiscal year ended June 30, 2009, net sales for this segment decreased by approximately $277.4 million, or 15.6%, as compared to the prior fiscal year.
The Company’s North American POS, barcoding, and security product categories saw revenues decrease by 16% in comparison to the prior fiscal year. During the fiscal year ended June 30, 2009, all of these units were challenged by weaker end-user demand caused by tighter credit markets and uncertain economic conditions in North America. Sales of substantially all of our major vendors and product lines were down in comparison to the prior fiscal year, as many of the larger deals and projects that we normally expect to see during the fiscal year were delayed or even cancelled.
The Company has two North American sales units that sell communications products to our customers – the Catalyst Telecom and ScanSource Communications sales units. The combined sales of these units were 15.1% lower for the fiscal year ended June 30, 2009 versus the prior fiscal year. Both of these sales units were also impacted by the prevailing macroeconomic conditions in North America discussed above, and a majority of the vendors in these units experienced lower sales on a comparative basis.
For the first six months of the fiscal year ended June 30, 2009, our key vendor in the Catalyst Telecom sales unit implemented various corrective program changes in response to an unsuccessful new program roll-out from the prior fiscal year. Due to the negative reaction surrounding the initial program roll-out, in addition to the uncertainty associated with the subsequent changes designed to correct the program, revenues for this sales unit were adversely impacted as reseller purchases were delayed or lost to competitive products during the first half of fiscal 2009. We believe that this vendor continues to make progress with its programs, products, and service offerings and we are encouraged that these changes have been well-received by our resellers. Accordingly, we attribute the overall lack of demand experienced over the last half of the fiscal year to be driven primarily by the uncertain economic climate and an absence of larger transactions that would normally occur in a more stable economic environment.
International Distribution
The international distribution segment includes sales to Latin America (including Mexico) and Europe from the ScanSource POS and Barcoding sales unit and in Europe through the ScanSource Communications sales unit. Sales for the overall international segment decreased by 12.6%, or $50.1 million, as compared to the prior fiscal year. However, on a constant exchange rate basis, the sales decrease was approximately 7.0%. The constant currency decline in sales for both geographies was also driven by weakness in end-user demand which was largely attributable to the economic downturn experienced in both Europe and Latin America.
26
Table of Contents
Index to Financial Statements
Gross Profit
The following table summarizes the Company’s gross profit for the fiscal years ended June 30th:
| % of Sales June 30, |
|||||||||||||||||||
| 2009 | 2008 | $ Change | % Change | 2009 | 2008 | ||||||||||||||
| (in thousands) | |||||||||||||||||||
| North American distribution segment |
$ | 155,916 | $ | 176,692 | $ | (20,776 | ) | (11.8 | %) | 10.4 | % | 9.9 | % | ||||||
| International distribution segment |
52,932 | 50,926 | 2,006 | 3.9 | % | 15.2 | % | 12.8 | % | ||||||||||
| Total gross profit |
$ | 208,848 | $ | 227,618 | $ | (18,770 | ) | (8.2 | %) | 11.3 | % | 10.5 | % | ||||||
North American Distribution
Gross profit for the North American distribution segment decreased $20.8 million, or 11.8%, for the fiscal year ended June 30, 2009, as compared to the prior fiscal year. The decrease in gross profit was primarily the result of lower sales volume in all of our sales units, as previously discussed. While total gross profit for the North American distribution segment decreased, gross profit, expressed as a percentage of net sales, actually increased to 10.4% for the fiscal year ended June 30, 2009 as compared to 9.9% for the prior fiscal year. This improvement was largely the result of a more favorable product mix and less margin dilution due to an absence of larger deals and projects that traditionally carry lower margins.
International Distribution
Despite a decrease in sales for the international distribution segment, gross profit actually increased by $2.0 million, or 3.9% for the fiscal year ended June 30, 2009, as compared to the prior fiscal year. The increase in gross profit for the fiscal year ended June 30, 2009 was achieved primarily through the use of strategic inventory purchases in the anticipation of subsequent vendor price increases in our European operating segment. These opportunistic purchases resulted in the achievement of significantly higher gross margins during the second half of fiscal 2009. As a result, gross profit, expressed as a percentage of net sales for this segment increased to 15.2% in the fiscal year ended June 30, 2009 versus 12.8% in the prior fiscal year. While gross profit of this segment, expressed as a percentage of net sales, is typically greater than the North American distribution segment, the significant increase in gross margin percentage experienced during the quarter was a direct result of this unique buying opportunity, and did not reflect a sustainable increase in profitability for this segment.
Operating Expenses
The following table summarizes the Company’s operating expenses for the periods ended June 30th:
| % of Sales June 30, |
||||||||||||||||||
| 2009 | 2008 | $ Change | % Change | 2009 | 2008 | |||||||||||||
| (in thousands) | ||||||||||||||||||
| Operating expenses |
$ | 134,730 | $ | 133,653 | $ | 1,077 | 0.8 | % | 7.3 | % | 6.2 | % | ||||||
For the fiscal year ended June 30, 2009, operating expenses were $134.7 million, which was slightly higher than the prior fiscal year. Approximately $2.7 million of this increase was attributable to the incremental operating expenses associated with our acquisition of MTV Telecom in April 2008. Offsetting these incremental costs was the favorable year over year exchange rate impact on operating expenses in our international distribution segment.
Operating expenses as a percentage of sales increased to 7.3% for the fiscal year ended June 30, 2009, compared to 6.2% in the prior year comparative period. This increase was largely due to the significant decline in revenues
27
Table of Contents
Index to Financial Statements
between the two comparable periods. However, the increase also reflects the Company’s continued investment in its ScanSource Security sales units in North America and ScanSource Communications sales unit in Europe.
Operating Income
The following table summarizes the Company’s operating income for the fiscal years ended June 30th:
| % of Sales June 30, |
|||||||||||||||||||
| 2009 | 2008 | $ Change | % Change | 2009 | 2008 | ||||||||||||||
| (in thousands) | |||||||||||||||||||
| North American distribution |
$ | 56,261 | $ | 76,233 | $ | (19,972 | ) | (26.2 | %) | 3.8 | % | 4.3 | % | ||||||
| International distribution |
17,857 | 17,732 | 125 | 0.7 | % | 5.1 | % | 4.5 | % | ||||||||||
| $ | 74,118 | $ | 93,965 | $ | (19,847 | ) | (21.1 | %) | 4.0 | % | 4.3 | % | |||||||
Operating income decreased 21.1% or $19.8 million for the fiscal year ended June 30, 2009 as compared to the prior fiscal year. This decrease was entirely the result of lower sales volumes experienced in our North America distribution segment due to the prevailing economic conditions. While our International distribution segment also experienced lower sales volumes, the sales generated in the fiscal year ended June 30, 2009 yielded significantly more gross profit than the comparative sales in the prior fiscal year, as discussed previously.
Total Other (Income) Expense
The following table summarizes the Company’s total other (income) expense for the fiscal years ended June 30th:
| % of Sales June 30, |
|||||||||||||||||||||
| 2009 | 2008 | $ Change | % Change | 2009 | 2008 | ||||||||||||||||
| (in thousands) | |||||||||||||||||||||
| Interest expense |
$ | 2,176 | $ | 5,471 | $ | (3,295 | ) | (60.2 | %) | 0.1 | % | 0.3 | % | ||||||||
| Interest income |
(1,405 | ) | (1,512 | ) | 107 | (7.1 | %) | (0.1 | %) | (0.1 | %) | ||||||||||
| Net foreign exchange losses (gains) |
1,587 | 194 | 1,393 | 718.0 | % | 0.1 | % | 0.0 | % | ||||||||||||
| Other, net |
(3,894 | ) | (406 | ) | (3,488 | ) | 858.9 | % | (0.2 | %) | 0.0 | % | |||||||||
| Total other (income) expense |
$ | (1,536 | ) | $ | 3,747 | $ | (5,283 | ) | (141.0 | %) | (0.1 | %) | 0.2 | % | |||||||
Interest expense reflects interest paid on borrowings on the Company’s revolving credit facility and long-term debt. Interest expense for the period ended June 30, 2009 was $2.2 million compared to $5.5 million for the comparative prior year period. The decrease in interest expense was primarily the result of lower average debt balances between the respective periods, and, to a much lesser extent, lower interest rates experienced between the comparative periods.
Interest income for the period ended June 30, 2009 was consistent with the comparative prior year periods. The Company generates interest income on longer-term interest bearing receivables, and, to a much lesser extent, interest earned on cash and cash-equivalent balances on hand.
Net foreign exchange gains and losses consist of foreign currency transactional and functional currency re-measurements, offset by net foreign currency exchange contract gains and losses. Foreign exchange losses and gains are generated as the result of fluctuations in the value of the Euro versus the British Pound and the U.S. Dollar versus other currencies. During the fiscal year ended June 30, 2009, the Company generated a net foreign exchange loss due to the strengthening of the U.S. Dollar against the Euro, the British Pound, the Mexican Peso, and the Canadian Dollar. While the Company utilizes foreign exchange contracts and debt in non-functional currencies to hedge foreign currency exposure, our foreign exchange policy prohibits us from entering into speculative transactions.
28
Table of Contents
Index to Financial Statements
During the quarter ended December 31, 2008, the Company settled a claim against a former legal service provider resulting in a $3.5 million recovery. The settlement was received by the Company on December 5, 2008 and was recorded as other income.
Provision for Income Taxes
Income tax expense was $28.0 million and $34.6 million for the fiscal years ended June 30, 2009 and 2008, respectively, reflecting an effective tax rate of 37.0% and 38.3%, respectively. The decrease in the effective tax rate for the fiscal year ended June 30, 2009 was largely attributable to the Company’s receipt of a favorable tax ruling from a state taxing jurisdiction that was retroactive to fiscal 2008, which had the effect of decreasing our effective tax rate for the fiscal year ended June 30, 2009.
Net Income
The following table summarizes the Company’s net income for the fiscal year ended June 30th:
| % of Sales June 30, |
|||||||||||||||||||
| 2009 | 2008 | $ Change | % Change | 2009 | 2008 | ||||||||||||||
| (in thousands) | |||||||||||||||||||
| Net income |
$ | 47,688 | $ | 55,632 | $ | (7,944 | ) | (14.28 | %) | 2.6 | % | 2.6 | % | ||||||
Net income for the fiscal year ended June 30, 2009 was $47.7 million, a $7.9 million decrease over the prior fiscal year period. The decrease in net income is attributable to the changes in operating profits previously discussed.
Quarterly Results
The following tables set forth certain unaudited quarterly financial data. The information has been derived from unaudited financial statements that, in the opinion of management, reflect all adjustments.
| Three Months Ended | ||||||||||||||||||||||||
| Fiscal 2010 | Fiscal 2009 | |||||||||||||||||||||||
| Jun. 30 2010 |
Mar. 31 2010 |
Dec. 31 2009 |
Sept. 30 2009 |
Jun. 30 2009 |
Mar. 31 2009 |
Dec. 31 2008 |
Sept. 30 2008 | |||||||||||||||||
| (in thousands, except per share data) | ||||||||||||||||||||||||
| Net sales |
$ | 582,342 | $ | 496,102 | $ | 548,112 | $ | 488,423 | $ | 441,236 | $ | 389,815 | $ | 477,093 | $ | 539,825 | ||||||||
| Cost of goods sold |
525,520 | 441,711 | 491,816 | 437,005 | 387,753 | 342,280 | 424,765 | 484,323 | ||||||||||||||||
| Gross profit |
$ | 56,822 | $ | 54,391 | $ | 56,296 | $ | 51,418 | $ | 53,483 | $ | 47,535 | $ | 52,328 | $ | 55,502 | ||||||||
| Net income |
$ | 14,048 | $ | 12,014 | $ | 11,815 | $ | 10,935 | $ | 12,504 | $ | 9,229 | $ | 13,525 | $ | 12,430 | ||||||||
| Weighted-average shares outstanding, basic |
26,669 | 26,608 | 26,575 | 26,567 | 26,542 | 26,463 | 26,411 | 26,364 | ||||||||||||||||
| Weighted-average shares outstanding, assuming dilution |
26,937 | 26,884 | 26,798 | 26,821 | 26,704 | 26,565 | 26,540 | 26,611 | ||||||||||||||||
| Net income per common share, basic |
$ | 0.53 | $ | 0.45 | $ | 0.44 | $ | 0.41 | $ | 0.47 | $ | 0.35 | $ | 0.51 | $ | 0.47 | ||||||||
| Net income per common share, assuming dilution |
$ | 0.52 | $ | 0.45 | $ | 0.44 | $ | 0.41 | $ | 0.47 | $ | 0.35 | $ | 0.51 | $ | 0.47 | ||||||||
29
Table of Contents
Index to Financial Statements
Critical Accounting Policies and Estimates
Management’s discussion and analysis of financial condition and results of operations are based upon the Company’s consolidated financial statements, which have been prepared in conformity with accounting principles generally accepted in the United States of America. The preparation of financial statements requires management to make estimates and assumptions that affect the reported amounts of assets and liabilities and disclosure of contingent assets and liabilities at the date of the financial statements and the reported amounts of revenues and expenses during the reporting period. On an ongoing basis management evaluates its estimates, including those related to the allowance for uncollectible accounts receivable, inventory reserves to reduce inventories to the lower of cost or market, and vendor incentives. Management bases its estimates on historical experience and on various other assumptions that management believes to be reasonable under the circumstances, the results of which form a basis for making judgments about the carrying value of assets and liabilities that are not readily available from other sources. Actual results may differ materially from these estimates under different assumptions or conditions, however, management believes that its estimates, including those for the above-described items are reasonable and that the actual results will not vary significantly from the estimated amounts. For further discussion of our significant accounting policies, refer to Note 2 of Notes to Consolidated Financial Statements.
Revenue Recognition
The Company recognizes revenue once four criteria are met: (1) the Company must have persuasive evidence that an arrangement exists; (2) delivery must occur, which happens at the point of shipment (this includes the transfer of both title and risk of loss, provided that no significant obligations remain); (3) the price must be fixed and determinable; and (4) collectability must be reasonably assured. A provision for estimated losses on returns is recorded at the time of sale based on historical experience.
The Company has service revenue associated with configuration and marketing, which is recognized when the work is complete and all obligations are substantially met. The Company also sells third-party services, such as maintenance contracts. Since the Company is acting as an agent for these services, revenue is recognized net of cost at the time of sale. The Company has a self branded warranty program for one product line and buys fulfillment contracts from a third party for most of its obligations. These revenues and associated third party costs are amortized over the life of contract. Revenue from multiple element arrangements is allocated to the various elements based on the relative fair value of the elements, and each revenue cycle is considered a separate accounting unit with recognition of revenue based on the criteria met for the individual element of the multiple deliverables.
Allowances for Trade and Notes Receivable
The Company maintains an allowance for uncollectible accounts receivable for estimated losses resulting from customers’ failure to make payments on accounts receivable due to the Company. Management determines the estimate of the allowance for uncollectible accounts receivable by considering a number of factors, including: (1) historical experience, (2) aging of the accounts receivable and (3) specific information obtained by the Company on the financial condition and the current creditworthiness of its customers. If the financial condition of the Company’s customers were to deteriorate and reduce the ability of the Company’s customers to make payments on their accounts, the Company may be required to increase its allowance by recording additional bad debt expense. Likewise, should the financial condition of the Company’s customers improve and result in payments or settlements of previously reserved amounts, the Company may be required to record a reduction in bad debt expense to reverse the recorded allowance. A provision for estimated losses on returns and allowances is recorded at the time of sale based on historical experience.
Inventory Reserves
Management determines the inventory reserves required to reduce inventories to the lower of cost or market based principally on the effects of technological changes, quantities of goods on hand, and other factors. An estimate is made of the market value, less cost to dispose, of products whose value is determined to be impaired.
30
Table of Contents
Index to Financial Statements
If these products are ultimately sold at less than estimated amounts, additional reserves may be required. Likewise, if these products are sold for more than the estimated amounts, reserves may be reduced.
Vendor Programs
The Company receives incentives from vendors related to cooperative advertising allowances, volume rebates and other incentive agreements. These incentives are generally under quarterly, semi-annual or annual agreements with the vendors. Some of these incentives are negotiated on an ad hoc basis to support specific programs mutually developed between the Company and the vendor. Vendors generally require that we use their cooperative advertising allowances exclusively for advertising or other marketing programs. Incentives received from vendors for specifically identified incremental cooperative advertising programs are recorded as adjustments to selling, general and administrative expenses. The Financial Accounting Standards Board’s (“FASB”) Accounting Standards Codification (“ASC”) 605 – Revenue Recognition, addresses accounting by a customer (including a reseller) for certain consideration received from a vendor. This guidance requires that a portion of these vendor funds in excess of our costs be reflected as a reduction of inventory. Such funds are recognized as a reduction of the cost of goods sold when the related inventory is sold.
The Company records unrestricted volume rebates received as a reduction of inventory and as a reduction of the cost of goods sold when the related inventory is sold. Amounts received or receivable from vendors that are not yet earned are deferred in the consolidated balance sheet. In addition, the Company may receive early payment discounts from certain vendors. The Company records early payment discounts received as a reduction of inventory and recognizes the discount as a reduction of cost of goods sold when the related inventory is sold.
ASC 605 requires management to make certain estimates of the amounts of vendor incentives that will be received. Actual recognition of the vendor consideration may vary from management estimates based on actual results.
Accounting Standards Recently Issued
See Note 2 of Notes to Consolidated Financial Statements for the discussion on recent accounting pronouncements.
Liquidity and Capital Resources
The Company’s primary sources of liquidity are cash flow from operations, borrowings under the revolving credit facility, secured and unsecured borrowings, and borrowings under the subsidiary’s line of credit. The Company’s cash and cash equivalent balance totaled $34.6 million at June 30, 2010, compared to $127.7 million at June 30, 2009. The Company’s working capital increased to $437.0 million at June 30, 2010 from $400.0 million at June 30, 2009. The $37 million increase in working capital was primarily due to higher accounts receivables and inventory balances between the two periods, offset by lower cash and increased accounts payables. As of June 30, 2010, there was no outstanding balance on the Company’s revolving line of credit facility.
The number of days sales in receivables (DSO) was 55 at June 30, 2010, compared to 59 days at June 30, 2009 and 59 days at March 31, 2010. This was due to increased collections at year end and a favorable mix of customers with shorter terms of sale during the fiscal year ended June 30, 2010.
Inventory turnover decreased to 6.4 times in the current fiscal year versus 7.1 times in the comparative prior year period. This decrease was largely the function of higher average inventory balances carried during the fiscal year ended June 30, 2010 due to increased demand and managing product constraints with certain vendors throughout the year.
Cash used by operating activities was approximately $78.2 million for the year ended June 30, 2010, compared to $143.3 million of cash provided by operating activities for the comparative prior year period. This decrease was driven primarily by an increase in receivables and inventory due to increased demand, partially offset by the timing of vendor payments between the periods.
31
Table of Contents
Index to Financial Statements
Cash used in investing activities for the twelve months ended June 30, 2010 was $15.6 million, compared to $2.5 million used in the comparative prior year period. This increase was largely attributed to the Company’s November 30, 2009, acquisition of substantially all of the assets and certain liabilities of Algol Europe, GmbH, a value-added distributor of specialty technologies, including voice, data, and video communications based in Cologne, Germany for €6.7 million (approximately $10.0 million) in cash. There was no acquisition activity in the prior year period. For the twelve months ended June 30, 2010, the company had worldwide capital expenditures of $5.6 million versus $3.7 million in the comparative prior year period. For the 2010 fiscal year, the increase from the prior year was largely related to capital expenditures in new software systems. In the prior fiscal year, cash used for capital expenditures was offset by the receipt of proceeds from the sale of property and equipment of $1.2 million. These proceeds reflect the sale of our fractional interests in two airplanes and a Company owned property in the United Kingdom during the fiscal year ended June 30, 2009.
Cash provided by financing activities was approximately $1.3 million for the twelve months ended June 30, 2010, compared to cash used of $28.2 million for the comparative prior year period. In the current fiscal year, there was minimal activity in terms of financing activities, with the exception of proceeds received by the Company as a result of the stock option exercises by employees. The Company’s average outstanding balance on its revolving credit facility was $2.1 million during the quarter and the Company had cash on hand of $34.6 million at June 30, 2010. In contrast, in the comparative prior year period, the Company was in the process of reducing its outstanding debt balances as cash flows from operations decreased due to lower sales volumes and a decrease in inventory purchases as demand slowed.
In addition to our domestic revolving credit facility, the Company has a €6.0 million secured revolving credit facility utilized by our European operations which bears interest at the 30 day Euro Interbank Offered Rate (“EURIBOR”) plus a spread of 1.25 per annum. At June 30, 2010 and at June 30, 2009, there were no outstanding borrowings against this facility. This facility is secured by the assets of our European operations and is guaranteed by ScanSource, Inc.
On January 2, 2008, the Company entered into a $25 million promissory note with a financial institution. This note payable accrues interest on the unpaid balance at a rate per annum equal to the 30 day LIBOR plus 0.65% and matures on September 28, 2012. The terms of the note payable allow for payments to be due and payable in consecutive monthly payment terms of accrued interest only, commencing on January 31, 2008, and continuing on the last day of each month thereafter until fully re-paid. This note may be prepaid in whole or in part at any time without penalty. Under the terms of the note, the Company has agreed not to encumber its headquarters’ property, except as permitted by the lender. As of June 30, 2010, the Company was in compliance with all covenants under this note payable.
On January 4, 2008, the Company entered into an interest rate swap with a notional amount of $25 million and designated this instrument as a cash flow hedge of our exposure to variability in future cash flows associated with this note payable. Under the terms of the swap, the Company pays a fixed rate of 3.65% plus a fixed spread of 0.65% on the $25 million notional amount and receives payments from a counterparty based on 30 day LIBOR plus a fixed spread of 0.65% for a term ending on September 28, 2011.
On September 28, 2007, the Company entered into a $250 million multi-currency revolving credit facility with a syndicate of banks that matures on September 28, 2012. This revolving credit facility has a $50 million accordion feature that allows the Company to increase the availability to $300 million, subject to obtaining commitments for the incremental capacity from existing or new lenders. The facility is guaranteed by the Company and certain of its subsidiaries and is secured by substantially all of the domestic assets of the Company and its domestic subsidiaries. The facility bears interest at a rate equal to a spread over the applicable LIBOR or prime rate, as chosen by the Company. This spread is dependent on the Company’s ratio of funded debt to EBITDA (as defined in the credit facility) and ranges from 0.50% to 1.25% for LIBOR-based loans, and from 0.00% to 0.25% for prime rate-based loans. The spread in effect as of June 30, 2010 was 0.50% for LIBOR-based loans and 0.00% for prime rate-based loans. This agreement subjects the Company to certain financial
32
Table of Contents
Index to Financial Statements
covenants, including minimum fixed charge and leverage ratio covenants. The agreement also has certain restrictive covenants that, among other things, place limitations on the payment of cash dividends. In October 2009, it was determined that the Company was not in compliance with a specific intercompany loan covenant within the agreement since June 30, 2008. This default was due to a technical misunderstanding of the underlying legal agreement which was immediately waived and the agreement was amended to allow for such transactions in the future. The Company determined that revisions to prior period financial statements were not necessary. The Company was in compliance with all covenants under the credit facility as of June 30, 2010. There were no outstanding borrowings on this facility as of June 30, 2010 and June 30, 2009, leaving $250 million available for additional borrowings.
On August 1, 2007, the Company entered into an agreement with the State of Mississippi in order to provide financing for the acquisition and installation of certain equipment to be utilized at the Company’s Southaven, Mississippi distribution facility, through the issuance of an industrial development revenue bond. The bond matures on September 1, 2032 and accrues interest at the 30-day LIBOR rate plus a spread of 0.85%. The terms of the bond allow for payment of interest only for the first 10 years of the agreement, and then, starting on September 1, 2018 through 2032, principal and interest payments are due until the maturity date or the redemption of the bond. The outstanding balance on this facility was $5.4 million as of June 30, 2010, and the effective interest rate was 1.2%. The Company was in compliance with all covenants associated with this agreement as of June 30, 2010.
The Company believes that its existing sources of liquidity, including cash resources and cash provided by operating activities, supplemented as necessary with funds under the Company’s credit agreements, will provide sufficient resources to meet the Company’s present and future working capital and cash requirements for at least the next twelve months.
Commitments
At June 30, 2010, the Company had contractual obligations in the form of non-cancelable operating leases and debt, including interest payments (See Notes 7 and 13 of Notes to the Consolidated Financial Statements) as follows:
| Payments Due by Period | |||||||||||||||
| Total | Less than 1 Year |
1 - 3 Years |
3 - 5 Years |
Greater than 5 Years | |||||||||||
| (in thousands) | |||||||||||||||
| Contractual Obligations |
|||||||||||||||
| Principal debt payments |
$ | 30,429 | $ | - | $ | 25,000 | $ | - | $ | 5,429 | |||||
| Non-cancelable operating leases(1) |
23,258 | 4,610 | 7,279 | 5,920 | 5,449 | ||||||||||
|
Other(2) |
- | - | - | - | - | ||||||||||
| Total obligations |
$ | 53,687 | $ | 4,610 | $ | 32,279 | $ | 5,920 | $ | 10,878 | |||||
| (1) | Amounts to be paid in future periods for real estate taxes, insurance, and other operating expenses applicable to the properties pursuant to the respective operating leases have been excluded from the table above as the amounts payable in future periods are generally not specified in the lease agreements and are dependent upon amounts which are not known at this time. Such amounts were not material in the current fiscal year. |
| (2) | Amounts totaling $8.1 million of deferred compensation which are included in current and other non-current liabilities in our consolidated balance sheet as of June 30, 2010 have been excluded from the table above due to the uncertainty of the timing of the payment of these obligations, which are generally at the discretion of the individual employees or upon death of the former employee, respectively. |
33
Table of Contents
Index to Financial Statements
| ITEM 7A. | Quantitative and Qualitative Disclosures about Market Risk. |
The Company’s principal exposure to changes in financial market conditions in the normal course of its business is a result of its selective use of bank debt and transacting business in foreign currencies in connection with its foreign operations.
Interest Rate Risk
The Company is exposed to changes in interest rates primarily as a result of its borrowing activities, which include revolving credit facilities with a group of banks used to maintain liquidity and fund the Company’s business operations. The nature and amount of the Company’s debt may vary as a result of future business requirements, market conditions and other factors. A hypothetical 100 basis point increase or decrease in interest rates on borrowings on the Company’s revolving credit facility, variable rate long term debt and subsidiary line of credit for the fiscal year ended June 30, 2010 would have resulted in a less than $0.1 million increase or decrease, respectively, in pre-tax income for the period.
To mitigate the risk of interest rate fluctuations associated with the Company’s variable rate long-term debt, the Company has implemented an interest rate risk management strategy that incorporates the use of an interest rate swap designated as a cash flow hedge to minimize the significant unplanned fluctuations in earnings caused by interest rate volatility. The Company’s use of derivative instruments has the potential to expose the Company to certain market risks including the possibility of (1) the Company’s hedging activities not being as effective as anticipated in reducing the volatility of the Company’s cash flows, (2) the counterparty not performing its obligations under the applicable hedging arrangement, (3) the hedging arrangement being imperfect or ineffective, or (4) the terms of the swap or associated debt may change. The Company seeks to lessen such risks by having established a policy to identify, control, and manage market risks which may arise from changes in interest rates, as well as limiting its counterparties to major financial institutions.
Foreign Currency Exchange Rate Risk
The Company is exposed to foreign currency risks that arise from its foreign operations in Canada, Mexico and Europe. These risks include the translation of local currency balances of foreign subsidiaries, inter-company loans with foreign subsidiaries and transactions denominated in non-functional currencies. These risks may change over time as business practices evolve and could have a material impact on the Company’s financial results in the future. In the normal course of business, foreign exchange risk is managed by using foreign currency forward contracts to hedge these exposures, as well as balance sheet netting of exposures. The Company’s Board of Directors has approved a foreign exchange hedging policy to minimize foreign currency exposure. The Company’s policy is to utilize financial instruments to reduce risks where internal netting cannot be effectively employed and not to enter into foreign currency derivative instruments for speculative or trading purposes. The Company monitors its risk associated with the volatility of certain foreign currencies against its functional currencies and enters into foreign exchange derivative contracts to minimize short-term currency risks on cash flows. These positions are based upon our forecasted purchases and sales denominated in certain foreign currencies. The Company continually evaluates foreign exchange risk and may enter into foreign exchange transactions in accordance with its policy. Actual variances from these forecasted transactions can adversely impact foreign exchange results. Foreign currency gains and losses are included in other expense (income).
The Company has elected not to designate its foreign currency contracts as hedging instruments, and therefore, the instruments are marked to market with changes in their values recorded in the Consolidated Income Statement each period. The underlying exposures are denominated primarily in British Pounds, Euros, Mexican Pesos and Canadian Dollars. At June 30, 2010, the fair value of the Company’s currency forward contracts outstanding was a net payable of less than $0.2 million. The Company does not utilize financial instruments for trading or other speculative purposes.
34
Table of Contents
Index to Financial Statements
| ITEM 8. | Financial Statements and Supplementary Data. |
| Page | ||
| Financial Statements |
||
| Report of Independent Registered Certified Public Accounting Firm |
36 | |
| 37 | ||
| 38 | ||
| 39 | ||
| 40 | ||
| 41 | ||
| 42 | ||
All schedules and exhibits not included are not applicable, not required or would contain information which is shown in the financial statements or notes thereto.
35
Table of Contents
Index to Financial Statements
Report of Independent Registered Public Accounting Firm
The Board of Directors and Shareholders of ScanSource, Inc.
We have audited the accompanying consolidated balance sheets of ScanSource, Inc. and subsidiaries as of June 30, 2010 and 2009, and the related consolidated statements of income, shareholders’ equity, and cash flows for each of the three years in the period ended June 30, 2010. Our audits also included the financial statement schedule listed in the index at item 15(a). These financial statements and schedule are the responsibility of the Company’s management. Our responsibility is to express an opinion on these financial statements and schedule based on our audits.
We conducted our audits in accordance with the standards of the Public Company Accounting Oversight Board (United States). Those standards require that we plan and perform the audit to obtain reasonable assurance about whether the financial statements are free of material misstatement. An audit includes examining, on a test basis, evidence supporting the amounts and disclosures in the financial statements. An audit also includes assessing the accounting principles used and significant estimates made by management, as well as evaluating the overall financial statement presentation. We believe that our audits provide a reasonable basis for our opinion.
In our opinion, the financial statements referred to above present fairly, in all material respects, the consolidated financial position of ScanSource, Inc. and subsidiaries at June 30, 2010 and 2009, and the consolidated results of their operations and their cash flows for each of the three years in the period ended June 30, 2010, in conformity with U.S. generally accepted accounting principles. Also, in our opinion, the related financial statement schedule, when considered in relation to the basic financial statements taken as a whole, presents fairly in all material respects the information set forth therein.
We also have audited, in accordance with the standards of the Public Company Accounting Oversight Board (United States), ScanSource, Inc.’s internal control over financial reporting as of June 30, 2010, based on criteria established in Internal Control-Integrated Framework issued by the Committee of Sponsoring Organizations of the Treadway Commission and our report dated August 26, 2010 expressed an unqualified opinion thereon.
/s/ Ernst & Young LLP
Greenville, South Carolina
August 26, 2010
36
Table of Contents
Index to Financial Statements
Report of Independent Registered Public Accounting Firm
The Board of Directors and Shareholders of ScanSource, Inc.
We have audited ScanSource, Inc. and subsidiaries’ internal control over financial reporting as of June 30, 2010, based on criteria established in Internal Control – Integrated Framework issued by the Committee of Sponsoring Organizations of the Treadway Commission (the COSO criteria). ScanSource, Inc. and subsidiaries’ management is responsible for maintaining effective internal control over financial reporting, and for its assessment of the effectiveness of internal control over financial reporting included in the accompanying Management’s Report on Internal Control Over Financial Reporting. Our responsibility is to express an opinion on the company’s internal control over financial reporting based on our audit.
We conducted our audit in accordance with the standards of the Public Company Accounting Oversight Board (United States). Those standards require that we plan and perform the audit to obtain reasonable assurance about whether effective internal control over financial reporting was maintained in all material respects. Our audit included obtaining an understanding of internal control over financial reporting, assessing the risk that a material weakness exists, testing and evaluating the design and operating effectiveness of internal control based on the assessed risk, and performing such other procedures as we considered necessary in the circumstances. We believe that our audit provides a reasonable basis for our opinion.
A company’s internal control over financial reporting is a process designed to provide reasonable assurance regarding the reliability of financial reporting and the preparation of financial statements for external purposes in accordance with generally accepted accounting principles. A company’s internal control over financial reporting includes those policies and procedures that (1) pertain to the maintenance of records that, in reasonable detail, accurately and fairly reflect the transactions and dispositions of the assets of the company; (2) provide reasonable assurance that transactions are recorded as necessary to permit preparation of financial statements in accordance with generally accepted accounting principles, and that receipts and expenditures of the company are being made only in accordance with authorizations of management and directors of the company; and (3) provide reasonable assurance regarding prevention or timely detection of unauthorized acquisition, use, or disposition of the company’s assets that could have a material effect on the financial statements.
Because of its inherent limitations, internal control over financial reporting may not prevent or detect misstatements. Also, projections of any evaluation of effectiveness to future periods are subject to the risk that controls may become inadequate because of changes in conditions, or that the degree of compliance with the policies or procedures may deteriorate.
In our opinion, ScanSource, Inc. and subsidiaries maintained, in all material respects, effective internal control over financial reporting as of June 30, 2010, based on the COSO criteria.
We also have audited, in accordance with the standards of the Public Company Accounting Oversight Board (United States), the consolidated balance sheets of ScanSource, Inc. and subsidiaries as of June 30, 2010 and 2009, and the related consolidated statements of income, shareholders’ equity, and cash flows for each of the three years in the period ended June 30, 2010 of ScanSource, Inc. and subsidiaries and our report dated August 26, 2010 expressed an unqualified opinion thereon.
/s/ Ernst & Young LLP
Greenville, South Carolina
August 26, 2010
37
Table of Contents
Index to Financial Statements
ScanSource, Inc. and Subsidiaries
Consolidated Balance Sheets
(in thousands, except for share information)
| June 30, 2010 | June 30, 2009 | ||||||
| Assets | |||||||
| Current assets: |
|||||||
| Cash and cash equivalents |
$ | 34,605 | $ | 127,664 | |||
| Accounts receivable, less allowance of $21,907 at June 30, 2010 and $16,883 at June 30, 2009 |
357,749 | 291,037 | |||||
| Inventories |
346,610 | 216,829 | |||||
| Prepaid expenses and other assets |
16,762 | 18,032 | |||||
| Deferred income taxes |
12,066 | 8,735 | |||||
| Total current assets |
767,792 | 662,297 | |||||
| Property and equipment, net |
23,528 | 21,035 | |||||
| Goodwill |
33,785 | 34,087 | |||||
| Other assets, including identifiable intangible assets |
34,645 | 31,212 | |||||
| Total assets |
$ | 859,750 | $ | 748,631 | |||
| Liabilities and Shareholders’ Equity | |||||||
| Current liabilities: |
|||||||
| Current portion of long-term debt |
$ | - | $ | - | |||
| Short-term borrowings |
- | - | |||||
| Accounts payable |
287,864 | 228,408 | |||||
| Accrued expenses and other liabilities |
35,027 | 30,443 | |||||
| Income taxes payable |
7,948 | 3,799 | |||||
| Total current liabilities |
330,839 | 262,650 | |||||
| Long-term debt |
30,429 | 30,429 | |||||
| Borrowings under revolving credit facility |
- | - | |||||
| Other long-term liabilities |
11,631 | 10,106 | |||||
| Total liabilities |
372,899 | 303,185 | |||||
| Commitments and contingencies |
|||||||
| Shareholders’ equity: |
|||||||
| Preferred stock, no par value; 3,000,000 shares authorized, none issued |
- | - | |||||
| Common stock, no par value; 45,000,000 shares authorized, 26,703,038 and 26,565,870 shares issued and outstanding at June 30, 2010 and June 30, 2009, respectively |
111,951 | 104,461 | |||||
| Retained earnings |
386,634 | 337,822 | |||||
| Accumulated other comprehensive (loss) income |
(11,734 | ) | 3,163 | ||||
| Total shareholders’ equity |
486,851 | 445,446 | |||||
| Total liabilities and shareholders’ equity |
$ | 859,750 | $ | 748,631 | |||
See accompanying notes to consolidated financial statements
38
Table of Contents
Index to Financial Statements
ScanSource, Inc. and Subsidiaries
Consolidated Income Statements
Years Ended June 30, 2010, 2009, and 2008
(in thousands, except per share data)
| 2010 | 2009 | 2008 | ||||||||||
| Net sales |
$ | 2,114,979 | $ | 1,847,969 | $ | 2,175,485 | ||||||
| Cost of goods sold |
1,896,052 | 1,639,121 | 1,947,867 | |||||||||
| Gross profit |
218,927 | 208,848 | 227,618 | |||||||||
| Selling, general and administrative expenses |
143,151 | 134,730 | 133,653 | |||||||||
| Operating income |
75,776 | 74,118 | 93,965 | |||||||||
| Interest expense |
1,472 | 2,176 | 5,471 | |||||||||
| Interest income |
(1,387 | ) | (1,405 | ) | (1,512 | ) | ||||||
| Other (income), net |
(50 | ) | (2,307 | ) | (212 | ) | ||||||
| Income before income taxes |
75,741 | 75,654 | 90,218 | |||||||||
| Provision for income taxes |
26,929 | 27,966 | 34,586 | |||||||||
| Net income |
$ | 48,812 | $ | 47,688 | $ | 55,632 | ||||||
| Per share data: |
||||||||||||
| Net income per common share, basic |
$ | 1.83 | $ | 1.80 | $ | 2.13 | ||||||
| Weighted-average shares outstanding, basic |
26,605 | 26,445 | 26,098 | |||||||||
| Net income per common share, diluted |
$ | 1.82 | $ | 1.79 | $ | 2.10 | ||||||
| Weighted-average shares outstanding, diluted |
26,869 | 26,588 | 26,445 | |||||||||
See accompanying notes to consolidated financial statements
39
Table of Contents
Index to Financial Statements
ScanSource, Inc. and Subsidiaries
Consolidated Statements of Shareholders’ Equity
Years Ended June 30, 2010, 2009, and 2008
(in thousands, except per share data)
| Common Stock (Shares) |
Common Stock (Amount) |
Retained Earnings |
Accumulated Other Comprehensive Income |
Total | |||||||||||||
| Balance at June 30, 2007 |
25,855,724 | $ | 83,653 | $ | 234,502 | $ | 6,589 | $ | 324,744 | ||||||||
| Comprehensive Income: |
|||||||||||||||||
| Net income |
- | - | 55,632 | - | 55,632 | ||||||||||||
| Unrealized gain on hedged transaction, net of tax of $41 |
- | - | - | 66 | 66 | ||||||||||||
| Foreign currency translation adjustment |
- | - | - | 2,867 | 2,867 | ||||||||||||
| Total comprehensive income |
58,565 | ||||||||||||||||
| Exercise of stock options and shares issued under share-based compensation plans |
493,796 | 7,487 | - | - | 7,487 | ||||||||||||
| Share based compensation |
- | 4,300 | - | - | 4,300 | ||||||||||||
| Tax benefit of deductible compensation arising from exercise of stock options |
- | 364 | - | - | 364 | ||||||||||||
| Consideration received from certain officers related to remediation activities |
- | 751 | - | - | 751 | ||||||||||||
| Reclassification of additional paid-in-capital related to remediation activities |
- | (458 | ) | - | - | (458 | ) | ||||||||||
| Balance at June 30, 2008 |
26,349,520 | $ | 96,097 | $ | 290,134 | $ | 9,522 | $ | 395,753 | ||||||||
| Comprehensive Income: |
|||||||||||||||||
| Net income |
- | - | 47,688 | - | 47,688 | ||||||||||||
| Unrealized loss on hedged transaction, net of tax of $476 |
- | - | - | (821 | ) | (821 | ) | ||||||||||
| Foreign currency translation adjustment |
- | - | - | (5,538 | ) | (5,538 | ) | ||||||||||
| Total comprehensive income |
41,329 | ||||||||||||||||
| Exercise of stock options and shares issued under share-based compensation plans |
216,350 | 2,077 | - | - | 2,077 | ||||||||||||
| Share based compensation |
- | 4,738 | - | - | 4,738 | ||||||||||||
| Tax benefit of deductible compensation arising from exercise of stock options |
- | 1,549 | - | - | 1,549 | ||||||||||||
| Balance at June 30, 2009 |
26,565,870 | $ | 104,461 | $ | 337,822 | $ | 3,163 | $ | 445,446 | ||||||||
| Comprehensive Income: |
|||||||||||||||||
| Net income |
- | - | 48,812 | - | 48,812 | ||||||||||||
| Unrealized gain on hedged transaction, net of tax of $85 |
- | - | - | 148 | 148 | ||||||||||||
| Foreign currency translation adjustment |
- | - | - | (15,045 | ) | (15,045 | ) | ||||||||||
| Total comprehensive income |
33,915 | ||||||||||||||||
| Exercise of stock options and shares issued under share-based compensation plans, net of shares withheld for employer taxes |
137,168 | 1,095 | - | - | 1,095 | ||||||||||||
| Share based compensation |
- | 6,168 | - | - | 6,168 | ||||||||||||
| Tax benefit of deductible compensation arising from exercise or vesting of share based payment arrangements |
- | 227 | - | - | 227 | ||||||||||||
| Balance at June 30, 2010 |
26,703,038 | $ | 111,951 | $ | 386,634 | ($11,734 | ) | $ | 486,851 | ||||||||
See accompanying notes to consolidated financial statements
40
Table of Contents
Index to Financial Statements
ScanSource, Inc. and Subsidiaries
Consolidated Statements of Cash Flows
Years Ended June 30, 2010, 2009, and 2008
(in thousands)
| 2010 | 2009 | 2008 | ||||||||||
| Cash flows from operating activities: |
||||||||||||
| Net income |
$ | 48,812 | $ | 47,688 | $ | 55,632 | ||||||
| Adjustments to reconcile net income to net cash provided by (used in) operating activities: |
||||||||||||
| Depreciation and amortization |
6,064 | 6,781 | 7,127 | |||||||||
| Allowance for accounts and notes receivable |
10,854 | 6,404 | 6,504 | |||||||||
| Share-based compensation and restricted stock |
6,065 | 4,738 | 4,904 | |||||||||
| Asset impairment |
- | 191 | 202 | |||||||||
| Deferred income taxes |
(4,658 | ) | 1,763 | (94 | ) | |||||||
| Excess tax benefits from share-based payment arrangements |
(227 | ) | (1,549 | ) | (364 | ) | ||||||
| Changes in operating assets and liabilities, net of acquisitions: |
||||||||||||
| Accounts receivable |
(79,145 | ) | 54,186 | (3,056 | ) | |||||||
| Inventories |
(133,492 | ) | 58,929 | 85 | ||||||||
| Prepaid expenses and other assets |
884 | (2,145 | ) | (4,498 | ) | |||||||
| Other noncurrent assets |
(2,660 | ) | (212 | ) | (2,692 | ) | ||||||
| Accounts payable |
57,977 | (32,267 | ) | 629 | ||||||||
| Accrued expenses and other liabilities |
6,876 | (2,173 | ) | (267 | ) | |||||||
| Income taxes payable |
4,486 | 916 | (1,223 | ) | ||||||||
| Net cash (used in) provided by operating activities |
(78,164 | ) | 143,250 | 62,889 | ||||||||
| Cash flows used in investing activities: |
||||||||||||
| Capital expenditures |
(5,606 | ) | (3,655 | ) | (6,982 | ) | ||||||
| Net proceeds from sale of property and equipment |
- | 1,158 | 6,100 | |||||||||
| Cash paid for business acquisitions, net of cash acquired |
(9,994 | ) | - | (10,530 | ) | |||||||
| Net cash (used in) investing activities |
(15,600 | ) | (2,497 | ) | (11,412 | ) | ||||||
| Cash flows from financing activities: |
||||||||||||
| (Decreases) increases in short-term borrowings, net |
- | (6,564 | ) | 3,797 | ||||||||
| (Payments) advances on revolving credit, net of expenses |
- | (26,141 | ) | (63,137 | ) | |||||||
| Exercise of stock options and Section 16 remediation |
1,095 | 2,077 | 8,238 | |||||||||
| Excess tax benefits from share-based payment arrangements |
227 | 1,549 | 364 | |||||||||
| Proceeds from issuance of long-term debt |
- | 853 | 25,000 | |||||||||
| Repayment of long-term debt |
- | - | (12,840 | ) | ||||||||
| Net cash provided by (used in) financing activities |
1,322 | (28,226 | ) | (38,578 | ) | |||||||
| Effect of exchange rate changes on cash and cash equivalents |
(617 | ) | (87 | ) | 461 | |||||||
| (Decrease) Increase in cash and cash equivalents |
(93,059 | ) | 112,440 | 13,360 | ||||||||
| Cash and cash equivalents at beginning of period |
127,664 | 15,224 | 1,864 | |||||||||
| Cash and cash equivalents at end of period |
$ | 34,605 | $ | 127,664 | $ | 15,224 | ||||||
| Supplemental disclosure of cash flow information: |
||||||||||||
| Interest paid during the year |
$ | 1,391 | $ | 2,308 | $ | 6,885 | ||||||
| Income taxes paid during the year |
$ | 23,422 | $ | 30,379 | $ | 29,580 | ||||||
See accompanying notes to consolidated financial statements
41
Table of Contents
Index to Financial Statements
SCANSOURCE, INC. AND SUBSIDIARIES
Notes to Consolidated Financial Statements
June 30, 2010
| (1) | Business Description |
ScanSource, Inc. (“The Company”) is a leading wholesale distributor of specialty technology products, providing value-added distribution sales to resellers in the specialty technology markets. The Company has two geographic distribution segments: one serving North America from the Southaven, Mississippi distribution center, and an international segment currently serving Latin America (including Mexico) and Europe from distribution centers located in Florida and Mexico, and in Belgium and Germany, respectively. The North American distribution segment markets automatic identification and data capture (“AIDC”) and point-of-sale (“POS”) products through its ScanSource POS and Barcoding sales unit; voice, data and converged communications equipment through its Catalyst Telecom sales unit; video conferencing, telephony, and communications products through its ScanSource Communications unit; and electronic security products and wireless infrastructure products through its ScanSource Security Distribution unit. The international distribution segment markets AIDC, POS, communications and security products as follows: ScanSource Latin America markets AIDC, POS, communications and security products. ScanSource Europe markets AIDC and POS products, while communication products are marketed through its ScanSource Communications sales unit in Europe.
In the quarter ended December 31, 2009, the Company established a new entity, ScanSource Communications GmbH, that acquired substantially all of the assets and certain liabilities of Algol Europe, GmbH, as a value-add distributor specializing in convergence communications solutions. The purchase transaction closed on November 30, 2009. Algol, headquartered in Cologne, Germany, has joined ScanSource Communications UK as part of ScanSource Communications Europe.
| (2) | Summary of Significant Accounting Policies and Accounting Standards Recently Issued |
Consolidation Policy
The consolidated financial statements include the accounts of the Company and its subsidiaries. All significant inter-company accounts and transactions have been eliminated.
Use of Estimates
The preparation of financial statements in conformity with accounting principles generally accepted in the United States of America requires management to make estimates and assumptions that affect the reported amounts of assets and liabilities and disclosure of contingent assets and liabilities at the date of the financial statements and the reported amounts of revenues and expenses during the reporting period. On an ongoing basis, management evaluates its estimates, including those related to the allowance for uncollectible accounts receivable and inventory reserves. Management bases its estimates on assumptions that management believes to be reasonable under the circumstances, the results of which form a basis for making judgments about the carrying value of assets and liabilities that are not readily available from other sources. Actual results may differ from these estimates under different assumptions or conditions; however, management believes that its estimates, including those for the above described items, are reasonable and that the actual results will not vary significantly from the estimated amounts.
42
Table of Contents
Index to Financial Statements
SCANSOURCE, INC. AND SUBSIDIARIES
Notes to Consolidated Financial Statements—(Continued)
June 30, 2010
The following significant accounting policies relate to the more significant judgments and estimates used in the preparation of the consolidated financial statements:
(a) Allowances for Trade and Notes Receivable
The Company maintains an allowance for uncollectible accounts receivable for estimated losses resulting from customers’ failure to make payments on accounts receivable due to the Company.
Management determines the estimate of the allowance for uncollectible accounts receivable by considering a number of factors, including: (1) historical experience, (2) aging of the accounts receivable and (3) specific information obtained by the Company on the financial condition and the current creditworthiness of its customers. If the financial condition of the Company’s customers were to deteriorate and reduce the ability of the Company’s customers to make payments on their accounts, the Company may be required to increase its allowance by recording additional bad debt expense. Likewise, should the financial condition of the Company’s customers improve and result in payments or settlements of previously reserved amounts, the Company may be required to record a reduction in bad debt expense to reverse the recorded allowance. A provision for estimated losses on returns and allowances is recorded on historical experience.
(b) Inventory Reserves
Management determines the inventory reserves required to reduce inventories to the lower of cost or market based principally on the effects of technological changes, quantities of goods on hand, and other factors. An estimate is made of the market value, less cost to dispose, of products whose value is determined to be impaired. If these products are ultimately sold at less than estimated amounts, additional reserves may be required. Likewise, if these products are sold for more than the estimated amounts, reserves may be reduced.
Reclassifications
Certain prior year amounts have been reclassified to conform to the current year presentation in the accompanying consolidated financial statements.
Cash and Cash Equivalents
The Company considers all highly liquid investments with original maturities of three months or less to be cash equivalents. The Company from time to time maintains balances in depository accounts in excess of FDIC insured limits. The Company has not experienced any credit losses nor anticipates any future losses in such accounts. At June 30, 2010 and 2009, amounts exceeding FDIC insured limits aggregated approximately $25.9 million and $8.1 million, respectively. Checks released but not yet cleared at the Company’s bank of $62.7 million and $45.6 million as of June 30, 2010 and 2009, respectively, are included in accounts payable.
Concentration of Credit Risk
The Company sells its products to a large base of value-added resellers throughout North America, Latin America (including Mexico) and Europe. The Company performs ongoing credit evaluations of its customers’ financial condition. In certain cases, the Company will accept tangible assets as collateral to increase the trade credit of its customers. No single customer accounted for more than 5% of the Company’s net sales for fiscal 2010, 2009, or 2008.
43
Table of Contents
Index to Financial Statements
SCANSOURCE, INC. AND SUBSIDIARIES
Notes to Consolidated Financial Statements—(Continued)
June 30, 2010
The Company has established arrangements with certain customers for longer term financing. The Company accounts for these arrangements by recording them at their historical cost less specific allowances at balance sheet dates. Interest income is recognized in the period earned and is recorded as interest income in the Consolidated Income Statement.
Financial instruments that potentially subject the Company to a concentration of credit risk consist of cash. The Company maintains its cash with high credit quality financial institutions. At times, such investments may be in excess of FDIC insurance limits.
Derivative Financial Instruments
The Company uses derivative instruments to manage certain exposures related to foreign currency as well as changes in interest rates as a result of our borrowing activities. We record all derivative instruments as either assets or liabilities in the balance sheet at fair value. The Company currently does not use derivative financial instruments for trading or speculative purposes.
The Company’s foreign currency exposure results from purchasing and selling internationally in several foreign currencies. In addition, the Company has foreign currency risk related to debt that is denominated in currencies other than the U.S. Dollar. The Company may reduce its exposure to fluctuations in foreign exchange rates by creating offsetting positions through the use of derivative financial instruments or multi-currency borrowings. The market risk related to the foreign exchange agreements is offset by changes in the valuation of the underlying items. Derivative financial instruments related to foreign currency exposure are accounted for on an accrual basis with gains or losses on these contracts recorded in income in the period in which their value changes, with the offsetting entry for unsettled positions reflected in either other assets or other liabilities. These contracts are generally for a duration of 90 days or less. The Company has elected not to designate its foreign currency contracts as hedging instruments. They are, therefore, marked-to-market with changes in their fair value recorded in the Consolidated Income Statement each period. The underlying exposures are denominated primarily by British Pounds, Euros, Mexican Pesos, and Canadian Dollars.
During the fiscal year ended June 30, 2008, the Company entered into an interest rate swap and designated this instrument as a hedge of the cash flows on certain variable rate debt. To the extent the derivative instrument is effective in offsetting the variability of the hedged cash flows, changes in the fair value of the derivative instrument will not be included in current earnings, but will be reported as other comprehensive income (loss). The ineffective portion, if any, will be recorded as an adjustment to earnings.
Investments
The Company has investments that are held in a grantor trust formed by the Company related to the ScanSource, Inc. Nonqualified Deferred Compensation Plan. The Company has classified these investments as trading securities and they are recorded at fair market value with unrealized gains and losses included in the accompanying Consolidated Income Statements. The Company’s obligations under this deferred compensation plan change in concert with the performance of the investments. The fair value of these investments and the corresponding deferred compensation obligation was $8.1 million and $6.1 million as of June 30, 2010 and June 30, 2009, respectively. These investments are classified as either current assets or other non-current assets in the Consolidated Balance Sheets depending on the timing of planned disbursements. The deferred compensation obligation is classified either within current liabilities or other long-term liabilities as well. At June 30, 2010, $1.1 million of these investments were classified as current assets with a corresponding current liability.
44
Table of Contents
Index to Financial Statements
SCANSOURCE, INC. AND SUBSIDIARIES
Notes to Consolidated Financial Statements—(Continued)
June 30, 2010
Inventories
Inventories (consisting entirely of finished goods) are stated at the lower of cost (first-in, first-out method) or market.
Vendor Programs
The Company receives incentives from vendors related to cooperative advertising allowances, volume rebates and other incentive agreements. These incentives are generally under quarterly, semi-annual or annual agreements with the vendors. Some of these incentives are negotiated on an ad hoc basis to support specific programs mutually developed between the Company and the vendor. Vendors generally require that we use their cooperative advertising allowances exclusively for advertising or other marketing programs. Incentives received from vendors for specifically identified incremental cooperative advertising programs are recorded as adjustments to selling, general and administrative expenses. The Financial Accounting Standards Board’s (“FASB”) Accounting Standards Codification (“ASC”) 605 – Revenue Recognition, addresses accounting by a customer (including a reseller) for certain consideration received from a vendor. This guidance requires that the portion of these vendor funds in excess of our costs be reflected as a reduction of inventory. Such funds are recognized as a reduction of the cost of products sold when the related inventory is sold.
The Company records unrestricted volume rebates received as a reduction of inventory and as a reduction of the cost of goods sold when the related inventory is sold. Amounts received or receivables from vendors that are not yet earned are deferred in the Consolidated Balance Sheets. In addition, the Company may receive early payment discounts from certain vendors. The Company records early payment discounts received as a reduction of inventory and recognizes the discount as a reduction of cost of goods sold when the related inventory is sold. ASC 605 requires management to make certain estimates of the amounts of vendor incentives that will be received. Actual recognition of the vendor consideration may vary from management estimates based on actual results.
Vendor Concentration
The Company sells products from many suppliers, however, sales from products supplied by Motorola and Avaya each constituted more than 10% of the Company’s net sales for the fiscal years ended June 30, 2010, 2009, and 2008, respectively.
Product Warranty
The Company’s vendors generally provide a warranty on the products distributed by the Company and allow the Company to return defective products, including those that have been returned to the Company by its customers. In one product line, the Company offers certain warranty service programs. With respect to these programs, the Company either records a provision for estimated service warranty costs at the time of sale adjusting periodically to reflect the actual experience, or will purchase a contract from an unrelated third party to fulfill the service. To date, neither warranty expense nor the accrual for warranty costs has been material to the Company’s consolidated financial statements. For all other product lines, the Company does not independently provide a warranty on the products it distributes; however, to maintain customer relations, the Company facilitates returns of defective products from the Company’s customers by accepting for exchange, with the Company’s prior approval, most defective products within 30 days of invoicing.
45
Table of Contents
Index to Financial Statements
SCANSOURCE, INC. AND SUBSIDIARIES
Notes to Consolidated Financial Statements—(Continued)
June 30, 2010
Property and Equipment
Property and equipment are recorded at cost. Depreciation is computed using the straight-line method over estimated useful lives of 3 to 10 years for furniture, equipment and computer software, 40 years for buildings and 15 years for building improvements. Leasehold improvements are amortized over the shorter of the lease term or the estimated useful life. Maintenance, repairs and minor renewals are charged to expense as incurred. Additions, major renewals and betterments to property and equipment are capitalized.
Goodwill
The Company accounts for recorded goodwill in accordance with ASC 350, Goodwill and Other Intangible Assets, which requires that they are reviewed annually for impairment or more frequently if impairment indicators exist. See Note 6, “Goodwill and Other Identifiable Intangible Assets” for a discussion of the annual goodwill impairment test.
Intangible Assets
Intangible assets consist of customer relationships, debt issue costs, trade names, trademarks, distributor agreements and non-compete agreements. Customer relationships and distributor agreements are amortized using the straight-line method over their estimated useful lives, which range from 5 to 15 years. Debt issue costs are amortized over the term of the credit facility.
Trade names and trademarks are amortized over a period ranging from 1 to 2 years. Non-compete agreements are amortized over their contract life. These assets are included in other assets and are shown in detail in Note 6, “Goodwill and Other Identifiable Intangible Assets”.
Impairment of Long-Lived Assets
The Company reviews its long-lived assets for impairment whenever events or changes in circumstances indicate that the carrying amount of the asset or asset group may not be recoverable. Tests for recoverability of a long-lived asset to be held and used are measured by comparing the carrying amount of the long-lived asset to the sum of the estimated future discounted cash flows expected to be generated by the asset. In estimating the future discounted cash flows we use projections of cash flows directly associated with, and which are expected to arise as a direct result of, the use and eventual disposition of the assets. If it is determined that a long-lived asset is not recoverable, an impairment loss would be calculated equal to the excess of the carrying amount of the long-lived asset over its fair value. The Company did not record any material impairment charges for the fiscal years ended June 30, 2010, 2009 and 2008.
Fair Value of Financial Instruments
The fair value of financial instruments is the amount at which the instrument could be exchanged in a current transaction between willing parties. The carrying values of financial instruments such as accounts receivable, accounts payable, accrued liabilities, borrowings under the revolving credit facility and subsidiary lines of credit approximate fair value based upon either short maturities or variable interest rates of these instruments. For additional information related to the fair value of derivatives, please see footnote 9.
46
Table of Contents
Index to Financial Statements
SCANSOURCE, INC. AND SUBSIDIARIES
Notes to Consolidated Financial Statements—(Continued)
June 30, 2010
Contingencies
The Company accrues for contingent obligations, including estimated legal costs, when it is probable that a liability is incurred and the amount is reasonably estimable. As facts concerning contingencies become known, management reassesses its position and makes appropriate adjustments to the financial statements. Estimates that are particularly sensitive to future changes include tax, legal, and other regulatory matters, which are subject to change as events evolve, and as additional information becomes available during the administrative and litigation process.
Revenue Recognition
Revenue is recognized once four criteria are met: (1) the Company must have persuasive evidence that an arrangement exists; (2) delivery must occur, which happens at the point of shipment (this includes the transfer of both title and risk of loss, provided that no significant obligations remain); (3) the price must be fixed and determinable; and (4) collectability must be reasonably assured. A provision for estimated losses on returns is recorded based on historical experience.
The Company has service revenue associated with configuration and marketing, which is recognized when the work is complete and all obligations are substantially met. The Company also sells third-party services, such as maintenance contracts. Since the company is acting as an agent for these services, revenue is recognized net of cost at the time of sale. The Company has a self branded warranty program for one product line and buys fulfillment contracts from a third party for most of its obligations. These revenues and associated third party costs are amortized over the life of contract. Revenue from multiple element arrangements is allocated to the various elements based on the relative fair value of the elements, and each revenue cycle is considered a separate accounting unit with recognition of revenue based on the criteria met for the individual element of the multiple deliverables.
Shipping Revenue and Costs
Shipping revenue is included in net sales and related costs are included in cost of goods sold. Shipping revenue for the years ended June 30, 2010, 2009 and 2008 was approximately $10.2 million, $9.9 million, and $11.8 million, respectively.
Advertising Costs
The Company defers advertising related costs until the advertising is first run in trade or other publications, or in the case of brochures, until the brochures are printed and available for distribution. Advertising costs, included in marketing costs, after vendor reimbursement, were not significant in any of the three years ended June 30, 2010. Deferred advertising costs at June 30, 2010 and 2009 were not significant.
Foreign Currency
The currency effects of translating the financial statements of the Company’s foreign entities that operate in their local currency are included in the cumulative currency translation adjustment component of accumulated other comprehensive loss income. The assets and liabilities of these foreign entities are translated into U.S. Dollars using the exchange rate at the end of the respective period. Sales, costs and expenses are translated at average exchange rates effective during the respective period. Foreign currency transactional and re-measurement gains and losses are included in other (income) expense in the Consolidated Income Statements. Such amounts are not significant to any of the periods presented.
47
Table of Contents
Index to Financial Statements
SCANSOURCE, INC. AND SUBSIDIARIES
Notes to Consolidated Financial Statements—(Continued)
June 30, 2010
Income Taxes
Income taxes are accounted for under the asset and liability method. Deferred income taxes reflect tax consequences on future years of differences between the tax bases of assets and liabilities and their financial reporting amounts. Valuation allowances are provided against deferred tax assets in accordance with ASC 740, Accounting for Income Taxes. Federal income taxes are not provided on the undistributed earnings of foreign subsidiaries because it has been the practice of the Company to reinvest those earnings in the business outside the United States. See Note 12 for more information. The Company maintains reserves for uncertain tax provisions in accordance with ASC 740.
Share-Based Payment
The Company accounts for share-based compensation using the provisions of ASC 718, Accounting for Stock Compensation, which requires the recognition of the fair value of share-based compensation. Share-based compensation is estimated at the grant date based on the fair value of the awards, in accordance with the provisions of ASC 718. Since this compensation cost is based on awards ultimately expected to vest, it has been reduced for estimated forfeitures. ASC 718 requires forfeitures to be estimated at the time of grant and revised, if necessary, in subsequent periods if actual forfeitures differ from those estimates. The Company has elected to expense grants of awards with graded vesting on a straight-line basis over the requisite service period for each separately vesting portion of the award.
Comprehensive Income
ASC 220, Reporting Comprehensive Income, defines comprehensive income as the change in equity (net assets) of a business enterprise during a period from transactions and other events and circumstances from non-owner sources. The primary components of comprehensive income for the Company include net income, foreign currency translation adjustments arising from the consolidation of the Company’s foreign subsidiaries, and unrealized gains and losses on the Company’s hedged transactions, net of tax.
Accounting Standards Recently Issued
FASB Accounting Standards Codification
In June 2009, the Financial Accounting Standards Board (“FASB”) issued Accounting Standards Codification (“ASC”) 105 (Prior authoritative literature: Statement of Financial Accounting Standards (“SFAS”) No. 168, The FASB Accounting Standards Codification and the Hierarchy of Generally Accepted Accounting Principle – a replacement of FASB Statement 162). ASC 105 replaces SFAS 162 and establishes the FASB Accounting Standards Codification as the source of authoritative accounting principles recognized by the FASB to be applied by nongovernmental entities in the preparation of financial statements in conformity with GAAP. ASC 105 is effective for financial statements issued for interim and annual periods ended after September 15, 2009. The adoption of this pronouncement did have an impact to the Company’s financial statement disclosures, as all references to authoritative accounting literature have been referenced in accordance with the Codification.
Earnings Per Share
In June 2008, the FASB issued ASC 260 (Prior authoritative literature: FASB Staff Position (“FSP”) No. EITF 03-6-1, Determining Whether Instruments Granted in Share-Based Payment Transactions Are
48
Table of Contents
Index to Financial Statements
SCANSOURCE, INC. AND SUBSIDIARIES
Notes to Consolidated Financial Statements—(Continued)
June 30, 2010
Participating Securities, (“FSP 03-6-1”)). ASC 260 replaces FSP 03-6-1 and states that unvested share-based payment awards that contain non-forfeitable rights to dividends or dividend equivalents are participating securities and should be included in the computation of earnings per share using the two-class method outlined in SFAS No. 128, Earnings per Share. The two-class method is an earnings allocation formula that determines earnings per share for each class of common stock and participating security according to dividends declared and participation rights in undistributed earnings. ASC 260 is effective for financial statements issued for fiscal years beginning after December 15, 2008 and requires that all prior period earnings per share data be adjusted retrospectively to conform to the provisions of the ASC. The adoption of these provisions did not have an impact on our Consolidated Financial Statements.
Business Combinations
Effective July 1, 2009, the Company adopted the provisions of FASB issued ASC 805-10 (Prior authoritative literature: SFAS 141 (R), Business Combinations, which replaces FASB Statement No. 141). ASC 805-10 establishes principles and requirements for how an acquirer recognizes and measures in its financial statements the identifiable assets acquired, the liabilities assumed, any non controlling interest in the acquiree and the goodwill acquired. The Statement also establishes disclosure requirements which will enable users to evaluate the nature and financial effects of the business combination. The adoption of this standard did not have a material impact on the Company’s Consolidated Financial Statements and the Company’s November 30, 2009 acquisition of substantially all of the assets and certain liabilities of Algol Europe, GmbH was accounted for under this standard.
Effective July 1, 2009, the Company adopted the provisions of FASB issued ASC 805-10-05 (Prior authoritative literature: FSP 141(R)-1 Accounting for Assets Acquired and Liabilities Assumed in a Business Combination That Arises from Contingencies). For business combinations, the standard requires the acquirer to recognize at fair value an asset acquired or liability assumed from a contingency if the acquisition date fair value can be determined during the measurement period. The adoption of this standard did not have a material impact on the Company’s Consolidated Financial Statements.
Fair Value Measurements
Effective July 1, 2009, the Company adopted the provisions of ASC 820 for non-financial assets and liabilities which were previously deferred under the provisions of ASC 820-10-65 (Prior authoritative literature: FSP FAS 157-2). The adoption of this standard did not have a significant impact on the Company’s Condensed Consolidated Financial Statements.
Fair Value Disclosures
The Company adopted the provisions of Accounting Standards Update (ASU) 2010-06, Improving Disclosures about Fair Value. ASU 2010-06 is an amendment to the accounting for fair value measurements and disclosures which details additional disclosures on fair value measurements, requires a gross presentation of activities within a Level 3 roll-forward, and adds a new requirement to disclose transfers in and out of Level 1 and Level 2 measurements. The new disclosures are required of all entities that are required to provide disclosures about recurring and nonrecurring fair value measurements. A portion of ASU 2010-06 relating to the gross presentation of Level 3 roll-forward information is required for annual reporting periods beginning after December 15, 2010, and for interim reporting periods within those years. The adoption of this standard did not have a material impact on the Company’s disclosures in the footnotes to the Consolidated Financial Statements.
49
Table of Contents
Index to Financial Statements
SCANSOURCE, INC. AND SUBSIDIARIES
Notes to Consolidated Financial Statements—(Continued)
June 30, 2010
Subsequent Events
Effective September 30, 2009, the Company adopted the provisions of ASC 855 as it relates to subsequent events. This guidance, amended in February 2010, establishes general standards of accounting for and disclosure of events that occur after the balance sheet date, but before the financial statements are issued or are available to be issued. The adoption of this standard did not have a material impact on the Company’s Consolidated Financial Statements.
Variable Interest Entities
In June 2009, the FASB issued ASC 810 as it relates to variable interest entities (VIE) (Prior authoritative literature: SFAS No. 167, Amendments to FASB Interpretation No. 46(R). ASC 810 amends FASB Interpretation No. 46(R). This guidance amends the evaluation criteria to identify the primary beneficiary of a VIE and requires ongoing assessment of whether an enterprise is the primary beneficiary of the VIE. The determination of whether a reporting entity is required to consolidate another entity is based on, among other things, the other entity’s purpose and design and the reporting entity’s ability to direct the activities that most significantly impact the other entity’s economic performance. This guidance is effective for the annual periods beginning after November 15, 2009. The Company is in process of determining the impact the adoption of ASC 810 as it relates to VIE will have on its Consolidated Financial Statements.
Multi-element Revenue Arrangements
In October 2009, the FASB issued an update to the existing multi-element revenue guidance, ASC 605-25 (Prior authoritative literature: EITF 08-1, Revenue Recognition with Multi-Element Arrangements.) This revised guidance primarily provides two significant changes: 1) eliminates the need for objective and reliable evidence of the fair value for the undelivered element in order for a delivered item to be treated as a separate unit of accounting, and 2) eliminates the residual method to allocate the arrangement consideration. This accounting update is effective for the first annual reporting period beginning on or after June 15, 2010, with early adoption permitted provided that the revised guidance is retroactively applied to the beginning of the year of adoption. This standard is applicable to the Company beginning on July 1, 2010. The Company is currently assessing the future impact of this new accounting update to its consolidated financial statements.
50
Table of Contents
Index to Financial Statements
SCANSOURCE, INC. AND SUBSIDIARIES
Notes to Consolidated Financial Statements—(Continued)
June 30, 2010
| (3) | Earnings per Share |
Basic earnings per share are computed by dividing net income by the weighted-average number of common shares outstanding. Diluted earnings per share are computed by dividing net income by the weighted-average number of common and potential common shares outstanding.
| Net Income | Shares | Per Share Amount | ||||||
| (in thousands, except per share data) | ||||||||
| Fiscal Year Ended June 30, 2010: |
||||||||
| Net income per common share, basic |
$ | 48,812 | 26,605 | $ | 1.83 | |||
| Effect of dilutive stock options |
- | 264 | ||||||
| Net income per common share, assuming dilution |
$ | 48,812 | 26,869 | $ | 1.82 | |||
| Fiscal Year Ended June 30, 2009: |
||||||||
| Net income per common share, basic |
$ | 47,688 | 26,445 | $ | 1.80 | |||
| Effect of dilutive stock options |
- | 143 | ||||||
| Net income per common share, assuming dilution |
$ | 47,688 | 26,588 | $ | 1.79 | |||
| Fiscal Year Ended June 30, 2008: |
||||||||
| Net income per common share, basic |
$ | 55,632 | 26,098 | $ | 2.13 | |||
| Effect of dilutive stock options |
- | 347 | ||||||
| Net income per common share, assuming dilution |
$ | 55,632 | 26,445 | $ | 2.10 | |||
| (4) | Property and Equipment |
Property and equipment is comprised of the following:
| June 30, | ||||||||
| 2010 | 2009 | |||||||
| (in thousands) | ||||||||
| Land |
$ | 3,009 | $ | 2,978 | ||||
| Buildings and leasehold improvements |
15,845 | 15,822 | ||||||
| Computer software and equipment |
13,139 | 12,437 | ||||||
| Furniture, fixtures and equipment |
17,240 | 17,095 | ||||||
| Construction in Progress |
4,526 | 136 | ||||||
| 53,759 | 48,468 | |||||||
| Less accumulated depreciation |
(30,231 | ) | (27,433 | ) | ||||
| $ | 23,528 | $ | 21,035 | |||||
During the fiscal year ended June 30, 2010, the increase in gross fixed assets from prior year is largely related to capital expenditures in new software systems.
Depreciation expense was $4.1 million, $4.2 million, and $4.7 million, respectively, for the fiscal years end 2010, 2009, and 2008.
51
Table of Contents
Index to Financial Statements
SCANSOURCE, INC. AND SUBSIDIARIES
Notes to Consolidated Financial Statements—(Continued)
June 30, 2010
| (5) | Acquisitions |
On November 30, 2009, the Company acquired substantially all of the assets and certain liabilities of Algol Europe, GmbH for €6.7 million or ($10.0 million) in our international distribution segment. Algol Europe, now a part of ScanSource Communications, is a value-added distributor of specialty technologies, including voice, data, and video communication products located in Cologne, Germany. This acquisition significantly expanded the footprint of the ScanSource Communications sales unit outside of the United Kingdom and is part of the Company’s strategy to become a pan-European distributor of communication products. The purchase price of this acquisition was allocated to the assets acquired and the liabilities assumed based on their estimated fair values on the transaction date, resulting in approximately $0.7 million in goodwill and $2.3 million of identifiable intangible assets related to non-compete agreements, distributor agreements and customer relationships as of November 30, 2009. These amounts were recorded in the international segment. All professional fees and other costs associated with our acquisition of these assets were expensed as incurred.
| (6) | Goodwill and Other Identifiable Intangible Assets |
In accordance with ASC 350, Intangibles – Goodwill and Others, the Company performs its annual goodwill impairment test at the end of each fiscal year, or whenever indicators of impairment are present. This testing includes the determination of each reporting unit’s fair value using market multiples and discounted cash flows modeling. These reporting units are also the Company’s operating segments. During fiscal years 2010, 2009 and 2008, no impairment charge related to goodwill was recorded.
Changes in the carrying amount of goodwill for the years ended June 30, 2010 and 2009, by operating segment, are as follows:
| North American Distribution Segment |
International Distribution Segment |
Total | |||||||||
| (in thousands) | |||||||||||
| Balance as of June 30, 2008 |
$ | 20,081 | $ | 16,040 | $ | 36,121 | |||||
| Fluctuations in foreign currencies |
- | (2,034 | ) | (2,034 | ) | ||||||
| Balance as of June 30, 2009 |
$ | 20,081 | $ | 14,006 | $ | 34,087 | |||||
| Goodwill acquired during 2010 |
- | 712 | 712 | ||||||||
| Fluctuations in foreign currencies |
- | (1,014 | ) | (1,014 | ) | ||||||
| Balance as of June 30, 2010 |
$ | 20,081 | $ | 13,704 | $ | 33,785 | |||||
During the fiscal year ended June 30, 2010, the Company’s goodwill balances increased due to the acquisition of Algol Europe in November 2009. During the fiscal year 2009, there were no acquisitions that impacted goodwill.
52
Table of Contents
Index to Financial Statements
SCANSOURCE, INC. AND SUBSIDIARIES
Notes to Consolidated Financial Statements—(Continued)
June 30, 2010
The following table shows the Company’s identifiable intangible assets as of June 30, 2010 and 2009, respectively. These balances are included on the consolidated balance sheet within other assets:
| June 30, 2010 | June 30, 2009 | |||||||||||||||||
| Gross Carrying Amount |
Accumulated Amortization |
Net Book Value |
Gross Carrying Amount |
Accumulated Amortization |
Net Book Value | |||||||||||||
| (in thousands) | ||||||||||||||||||
| Amortized intangible assets: |
||||||||||||||||||
| Customer relationships |
$ | 20,083 | $ | 5,497 | $ | 14,586 | $ | 19,818 | $ | 3,816 | $ | 16,002 | ||||||
| Debt issue costs |
885 | 427 | 458 | 841 | 265 | 576 | ||||||||||||
| Trade names and trademarks |
947 | 947 | - | 960 | 871 | 89 | ||||||||||||
| Non-compete agreements |
2,987 | 2,112 | 875 | 1,785 | 1,785 | - | ||||||||||||
| Distributor agreement |
598 | 23 | 575 | - | - | - | ||||||||||||
| Total |
$ | 25,500 | $ | 9,006 | $ | 16,494 | $ | 23,404 | $ | 6,737 | $ | 16,667 | ||||||
The weighted average amortization period for all intangible assets was approximately 12 years for fiscal year ended June 30, 2010 and approximately 13 years for years end 2009 and 2008, respectively. Amortization expense for the years ended June 30, 2010, 2009 and 2008 was $2.0 million, $2.6 million, and $2.5 million, respectively. Estimated future amortization expense is as follows:
| Amortization Expense | |||
| (in thousands) | |||
| Year Ended June 30, |
|||
| 2011 |
$ | 2,132 | |
| 2012 |
1,852 | ||
| 2013 |
1,482 | ||
| 2014 |
1,407 | ||
| 2015 |
1,407 | ||
| Thereafter |
8,213 | ||
| $ | 16,494 | ||
| (7) | Short-Term Borrowings and Long-Term Debt |
Short-Term Borrowings
| June 30, 2010 |
June 30, 2009 | |||||
| (in thousands) | ||||||
| Short-term borrowings |
$ | - | $ | - | ||
The Company has a €6.0 million secured revolving credit facility which bears interest at the 30 day Euro Interbank Offered Rate (“EURIBOR”) plus a spread of 1.25 per annum. At June 30, 2010, there were no outstanding borrowings against this facility. This facility is secured by the assets of our European operations and is guaranteed by ScanSource, Inc.
53
Table of Contents
Index to Financial Statements
SCANSOURCE, INC. AND SUBSIDIARIES
Notes to Consolidated Financial Statements—(Continued)
June 30, 2010
Revolving Credit Facility
| June 30, 2010 |
June 30, 2009 | |||||
| (in thousands) | ||||||
| Revolving credit facility |
$ | - | $ | - | ||
On September 28, 2007, the Company entered into a $250 million multi-currency revolving credit facility with a syndicate of banks that matures on September 28, 2012. This revolving credit facility has a $50 million accordion feature that allows the Company to increase the availability to $300 million subject to obtaining commitments for the incremental capacity from existing or new lenders. The facility is guaranteed by the Company and its domestic subsidiaries and is secured by substantially all of the domestic assets of the Company and its domestic subsidiaries. The facility bears interest at a rate equal to a spread over the applicable London Interbank Offered Rate (“LIBOR”) or prime rate, as chosen by the Company. This spread is dependent on the Company’s ratio of funded debt to EBITDA (as defined in the credit facility) and ranges from 0.50% to 1.25% for LIBOR-based loans, and from 0.00% to 0.25% for prime rate-based loans. The spread in effect as of June 30, 2010 was 0.50% for LIBOR-based loans and 0.00% for prime rate-based loans. The agreement subjects the Company to certain financial covenants, including minimum fixed charge and leverage ratio covenants. The agreement also has certain restrictive covenants that, among other things, place limitations on the payment of cash dividends. In October 2009, it was determined that the Company was not in compliance with a specific intercompany loan covenant within the agreement since June 30, 2008. This default was due to a technical misunderstanding of the underlying legal agreement which was immediately waived and the agreement amended to allow for such transactions in the future. The Company determined that revisions to prior period financial statements were not necessary. The Company was in compliance with all covenants under the credit facility as of June 30, 2010. There were no outstanding borrowings on this facility as of June 30, 2010, leaving $250 million available for additional borrowings.
Long-Term Debt
| June 30, 2010 |
June 30, 2009 | |||||
| (in thousands) | ||||||
| Industrial Development Revenue Bond, monthly payments of interest only, 1.2% variable interest rate at June 30, 2010 and maturing in fiscal 2033 |
$ | 5,429 | $ | 5,429 | ||
| Unsecured note payable to a bank, monthly payments of interest only, 1.0% variable interest rate at June 30, 2010 and maturing in fiscal 2013 (see Note 8) |
25,000 | 25,000 | ||||
| 30,429 | 30,429 | |||||
| Less current portion |
- | - | ||||
| Long-term portion |
$ | 30,429 | $ | 30,429 | ||
On August 1, 2007, the Company entered into an agreement with the State of Mississippi in order to provide financing for the acquisition and installation of certain equipment to be utilized at the Company’s current Southaven, Mississippi distribution facility, through the issuance of an industrial development revenue bond. The bond matures on September 1, 2032 and accrues interest at the 30-day LIBOR rate plus a spread of 0.85%. The terms of the bond allow for payment of interest only for the first 10 years of the agreement, and then, starting on
54
Table of Contents
Index to Financial Statements
SCANSOURCE, INC. AND SUBSIDIARIES
Notes to Consolidated Financial Statements—(Continued)
June 30, 2010
September 1, 2018 through 2032, principal and interest payments are due until the maturity date or the redemption of the bond. As of June 30, 2010, the Company was in compliance with all covenants under this bond.
On January 2, 2008, the Company entered into a $25 million promissory note with a third party lender. This note payable accrues interest on the unpaid balance at a rate per annum equal to the 30-day LIBOR plus 0.65% and matures on September 28, 2012. The terms of the note payable allow for payments to be due and payable in consecutive monthly payment terms of accrued interest only, commencing on January 31, 2008, and continuing on the last day of each month thereafter until the principal balance is fully re-paid. This note may be prepaid in whole or in part at any time without penalty. Under the terms of this agreement, the Company has agreed not to encumber its headquarters’ property, except as permitted by the lender. As of June 30, 2010, the Company was in compliance with all covenants under this note payable.
The book value of debt listed above is considered to approximate fair value, as our debt instruments are indexed to LIBOR or the prime rate using the market approach (level 2 criteria).
Scheduled maturities of the Company’s revolving credit facility and long-term debt at June 30, 2010 are as follows:
| Long-Term Debt | |||
| (in thousands) | |||
| Fiscal year: |
|||
| 2011 |
$ | - | |
| 2012 |
- | ||
| 2013 |
25,000 | ||
| 2014 |
- | ||
| 2015 |
- | ||
| Thereafter |
5,429 | ||
| Total principal payments |
$ | 30,429 | |
| (8) | Derivatives and Hedging Activities |
The Company’s results of operations could be materially impacted by significant changes in foreign currency exchange rates and interest rates. These risks and the management of these risks are discussed in greater detail below. In an effort to manage the exposure to these risks, the Company periodically enters into various derivative instruments. The Company’s accounting policies for these instruments are based on whether the instruments are designated as hedge or non-hedge instruments in accordance with generally accepted accounting principles in the United States. The Company records all derivatives on the balance sheet at fair value. Derivatives that are not designated as hedging instruments or the ineffective portions of cash flow hedges are adjusted to fair value through earnings in other income and expense.
Foreign Currency – the Company conducts a portion of its business internationally in a variety of foreign currencies. The exposure to market risk for changes in foreign currency exchange rates arises from foreign currency denominated assets and liabilities, and transactions arising from non-functional currency financing or trading activities. The Company’s objective is to preserve the economic value of non-functional currency denominated cash flows. The Company attempts to hedge transaction exposures with natural offsets to the fullest
55
Table of Contents
Index to Financial Statements
SCANSOURCE, INC. AND SUBSIDIARIES
Notes to Consolidated Financial Statements—(Continued)
June 30, 2010
extent possible and, once these opportunities have been exhausted, through forward contracts or other hedging instruments with third parties. At June 30, 2010, the Company had contracts outstanding with notional amounts of $42.2 million to exchange foreign currencies, including the US Dollar, Euro, British Pound, Canadian Dollar, and Mexican Peso. To date, the Company has chosen not to designate these derivatives as hedging instruments, and accordingly, these instruments are adjusted to fair value through earnings in other income and expense. Summarized financial information related to these derivative contracts and changes in the underlying value of the foreign currency exposures are as follows:
| Fiscal Year Ended June 30, | ||||||||||||
| 2010 | 2009 | 2008 | ||||||||||
| (in thousands) | ||||||||||||
| Net foreign exchange derivative contract (losses) gains |
$ | (1,065 | ) | $ | 5,147 | $ | 873 | |||||
| Net foreign currency transactional and remeasurement gains (losses) |
$ | 826 | $ | (6,734 | ) | $ | (1,067 | ) | ||||
| Net foreign currency transactional and remeasurement (losses) |
$ | (239 | ) | $ | (1,587 | ) | $ | (194 | ) | |||
Interest Rates – the Company’s earnings are also affected by changes in interest rates due to the impact those changes have on interest expense from floating rate debt instruments. To manage the exposure to interest rates, the Company may enter into interest rate swap agreements. In the prior fiscal year, the Company entered into an interest rate swap agreement to hedge the variability in future cash flows of interest payments related to the $25 million promissory note payable discussed in Note 7. Interest rate differentials paid or received under the swap agreement are recognized as adjustments to interest expense. To the extent the swap is effective in offsetting the variability of the hedged cash flows, changes in the fair value of the swap are not included in current earnings but are reported as other comprehensive income (loss). The fair value of the swap was a liability of $1 million as of June 30, 2010. To date, there has not been any ineffectiveness associated with this instrument, and there are no other swap agreements outstanding.
The components of the cash flow hedge included in accumulated other comprehensive (loss) income, net of income taxes, in the Consolidated Statements of Shareholders’ Equity for the fiscal years ended June 30, 2010 and 2009, are as follows:
| Fiscal Year Ended June 30, | ||||||||
| 2010 | 2009 | |||||||
| (in thousands) | ||||||||
| Net interest expense recognized as a result of interest rate swap |
$ | 859 | $ | 540 | ||||
| Unrealized (loss) in fair value of interest swap rates |
(626 | ) | (1,901 | ) | ||||
| Net increase (decrease) in accumulated other comprehensive (loss) income |
$ | 233 | $ | (1,361 | ) | |||
| Income tax effect |
(85 | ) | 540 | |||||
| Net increase (decrease) in accumulated other comprehensive (loss) income, net of tax |
$ | 148 | $ | (821 | ) | |||
56
Table of Contents
Index to Financial Statements
SCANSOURCE, INC. AND SUBSIDIARIES
Notes to Consolidated Financial Statements—(Continued)
June 30, 2010
The Company has the following derivative instruments located on the Consolidated Balance Sheets and Income Statements, utilized for the risk management purposes detailed above:
| As of June 30, 2010 | ||||||||
| Fair Value of Derivatives Designated as Hedge Instruments |
Fair Value of Derivatives Not Designated as Hedge Instruments |
|||||||
| (in thousands) | ||||||||
| Derivative assets(a): |
||||||||
| Foreign exchange contracts |
$ | - | $ | 30 | ||||
| Derivative liabilities(b): |
||||||||
| Foreign exchange contracts |
$ | - | $ | (190 | ) | |||
| Interest rate swap agreement |
$ | (956 | ) | $ | - | |||
| (a) | All derivative assets are recorded as prepaid expense and other assets in the Consolidated Balance Sheets. |
| (b) | All derivative liabilities are recorded as accrued expenses and other liabilities in the Consolidated Balance Sheets. |
| (9) | Fair Value of Financial Instruments |
The Company’s financial assets and liabilities measured at fair value are required to be grouped in one of three levels. The levels prioritize the inputs used to measure the fair value of the assets or liabilities. These levels are:
| • | Level 1 – Unadjusted quoted prices in active markets that are accessible at the measurement date for identical, unrestricted assets or liabilities; |
| • | Level 2 – Quoted prices in markets that are not active, or inputs which are observable, either directly or indirectly, for substantially the full term of the asset or liability; |
| • | Level 3 – Prices or valuation techniques that require inputs that are both significant to the fair value measurement and unobservable (i.e. supported by little or no market activity). |
The following table summarizes the valuation of the Company’s short-term investments and financial instruments by the above categories as of June 30, 2010:
| Total | Quoted prices in active markets (Level 1) |
Significant other observable inputs (Level 2) |
Significant unobservable inputs (Level 3) | |||||||||||
| (in thousands) | ||||||||||||||
| Deferred compensation plan investments(1) |
$ | 8,145 | $ | 8,145 | $ | - | $ | - | ||||||
| Derivative instruments(2) |
||||||||||||||
| Forward foreign currency exchange contracts |
(160 | ) | - | (160 | ) | - | ||||||||
| Interest rate swap liability |
(956 | ) | - | (956 | ) | - | ||||||||
| Total |
$ | 7,029 | $ | 8,145 | $ | (1,116 | ) | $ | - | |||||
57
Table of Contents
Index to Financial Statements
SCANSOURCE, INC. AND SUBSIDIARIES
Notes to Consolidated Financial Statements—(Continued)
June 30, 2010
| (1) | These investments are held in a rabbi trust and include mutual funds and cash equivalents for payment of certain non-qualified benefits for certain retired, terminated and active employees. As of June 30, 2010, approximately $1.1 million was considered current. |
| (2) | See Note 8, “Derivatives and Hedging Activities”. |
The Company’s foreign currency forward contracts are measured using the market approach on a recurring basis considering foreign currency spot rates and forward rates quoted by banks or foreign currency dealers (level 2 criteria.)
The Company’s interest rate swap contract is measured using the market approach on a recurring basis considering LIBOR forward rates quoted by the Company’s counter-party (level 2 criteria.)
| (10) | Share-Based Compensation |
Share-Based Compensation Plans
The Company has awards outstanding from four share-based compensation plans (the 1993 Incentive Stock Option Plan, the 1997 Stock Incentive Plan, the 2002 Long-Term Incentive Plan, and the 2003 Director Plan), two of which (the 2002 Long-Term Incentive Plan and the 2003 Director Plan) are available for future grants. All of the Company’s share-based compensation plans are shareholder approved and it is the Company’s belief that such awards better align the interests of its employees and directors with those of its shareholders. Under the plans, the Company is authorized to award officers, employees, and non-employee members of the Board of Directors various share-based payment awards, including options to purchase common stock and restricted stock. As of June 30, 2010, there were 2,313,378 and 110,800 shares available for future grant under the 2002 Long-Term Incentive Plan and the 2003 Director Plan, respectively.
The Company accounts for its share-based compensation awards in accordance with ASC 718 – Stock Compensation. This standard requires all share-based compensation to be recognized in the income statement based on fair value and applies to all awards granted, modified, cancelled, or repurchased after the effective date. Total share-based compensation included as a component of selling, general, and administrative expense in our Consolidated Income Statements was as follows:
| Fiscal Year Ended June 30, | |||||||||
| 2010 | 2009 | 2008 | |||||||
| (in thousands) | |||||||||
| Share-based compensation related to: |
|||||||||
| Equity classified stock options |
$ | 4,698 | $ | 4,168 | $ | 3,977 | |||
| Equity classified restricted stock |
1,367 | 570 | 323 | ||||||
| Tender offer modification |
- | - | 604 | ||||||
| Total share-based compensation |
$ | 6,065 | $ | 4,738 | $ | 4,904 | |||
Stock Options
During the fiscal year ended June 30, 2010, the Company granted 157,000 stock options to certain employees. These options vest annually over 3 years and have a 10-year contractual life. In accordance with the requirements of the Company’s Equity Award Grant Policy, the options issued during the fiscal year were granted with an exercise price that is no less than 100% of the fair market value of those shares on the date of the grant.
58
Table of Contents
Index to Financial Statements
SCANSOURCE, INC. AND SUBSIDIARIES
Notes to Consolidated Financial Statements—(Continued)
June 30, 2010
The fair value of each option (for purposes of calculation of share-based compensation) was estimated on the date of grant using the Black-Scholes-Merton option pricing formula that uses assumptions determined at the date of grant. Use of this option pricing model requires the input of subjective assumptions. These assumptions include estimating the length of time employees will retain their vested stock options before exercising them (“expected term”), the estimated volatility of our common stock price over the expected term (“expected volatility”) and the number of options that will ultimately not complete their vesting requirements (“forfeitures”). Changes in the subjective assumptions can materially affect the estimate of the fair value of share-based compensation and, consequently, the related amount recognized in the Consolidated Income Statements.
The Company used the following weighted average assumptions for the options granted during the following fiscal years:
| Fiscal Year Ended June 30, | ||||||||||||
| 2010 | 2009 | 2008 | ||||||||||
| Expected term |
6.82 years | 5.12 years | 4.59 years | |||||||||
| Expected volatility |
46.27 | % | 45.73 | % | 38.00 | % | ||||||
| Risk-free interest rate |
2.89 | % | 1.67 | % | 3.40 | % | ||||||
| Dividend yield |
0.00 | % | 0.00 | % | 0.00 | % | ||||||
| Weighted average fair value per option |
$ | 12.43 | $ | 7.49 | $ | 13.20 | ||||||
The weighted average expected term of the options represents the period of time the options are expected to be outstanding based on historical trends and behaviors of certain groups and individuals receiving these awards. The expected volatility is predominately based on the historical volatility of our common stock for a period approximating the expected life. The risk-free interest rate reflects the interest rate at grant date on zero-coupon U.S. governmental bonds that have a remaining life similar to the expected option term. The dividend yield assumption was based on our dividend payment history and expectations of future dividend payments.
A summary of our stock option plans is presented below:
| Fiscal Year Ended June 30, 2010 | |||||||||||
| Options | Weighted- Average Exercise Price |
Weighted- Average Remaining Contractual Life |
Aggregate Intrinsic Value | ||||||||
| Outstanding, beginning of year |
2,154,049 | $ | 24.99 | ||||||||
| Granted during the period |
157,000 | 24.51 | |||||||||
| Exercised during the period |
(105,536 | ) | 11.96 | ||||||||
| Cancelled, forfeited, or expired during the period |
(6,613 | ) | 30.59 | ||||||||
| Outstanding, end of year |
2,198,900 | 25.58 | 6.27 | $ | 7,544,156 | ||||||
| Vested and expected to vest at June 30, 2010 |
2,192,846 | 25.58 | 6.27 | $ | 7,504,514 | ||||||
| Exercisable, end of year |
1,576,593 | $ | 26.58 | 5.39 | $ | 5,059,442 | |||||
The aggregate intrinsic value was calculated using the market price of our stock on June 30, 2010 and the exercise price for only those options that have an exercise price that is less than the market price of our stock. This amount will change as the market price per share changes. The aggregate intrinsic value of options exercised during the fiscal years ended June 30, 2010, 2009, and 2008 was $1.6 million, $2.4 million, and $9.1 million, respectively.
59
Table of Contents
Index to Financial Statements
SCANSOURCE, INC. AND SUBSIDIARIES
Notes to Consolidated Financial Statements—(Continued)
June 30, 2010
A summary of the status of the Company’s unvested shares as of June 30, 2010, and changes during the year then ended, is presented below:
| Fiscal Year Ended June 30, 2010 | |||||||||
| Options | Weighted- Average Exercise Price |
Weighted- Average Grant Date Fair-Value | |||||||
| Unvested, beginning of year |
878,256 | $ | 24.64 | $ | 8.94 | ||||
| Granted |
157,000 | 24.51 | 12.43 | ||||||
| Vested |
(407,668 | ) | 27.04 | 10.49 | |||||
| Cancelled, forfeited, or expired |
(5,281 | ) | 30.59 | 10.75 | |||||
| Unvested, end of year |
622,307 | $ | 22.98 | $ | 9.79 | ||||
As of June 30, 2010 there were approximately $4.1 million of total unrecognized compensation cost related to non-vested share-based compensation arrangements granted under the plans. The cost is expected to be recognized over a weighted-average period of 1 year. The total fair value of shares vested during the fiscal years ended June 30, 2010, 2009, and 2008 is $4.3 million, $3.6 million and $3.4 million, respectively. The following table summarizes information about stock options outstanding as of June 30, 2010:
| Range of Exercise |
Shares Outstanding |
Weighted- Average Remaining Contractual Life |
Weighted Average Exercise Price |
Number Exercisable |
Weighted- Average Exercise Price | |||||||
| $ 0.00 - $ 3.67 |
- | - | $ | - | - | $ | - | |||||
| $ 3.67 - $ 7.34 |
- | - | $ | - | - | $ | - | |||||
| $ 7.34 - $11.01 |
79,402 | .88 | $ | 9.90 | 79,402 | $ | 9.90 | |||||
| $11.01 - $14.68 |
178,958 | 1.74 | $ | 12.64 | 178,958 | $ | 12.64 | |||||
| $14.68 - $18.35 |
577,310 | 7.81 | $ | 18.01 | 221,037 | $ | 17.79 | |||||
| $18.35 - $22.01 |
18,800 | 3.44 | $ | 21.58 | 18,800 | $ | 21.58 | |||||
| $22.01 - $25.68 |
230,792 | 7.54 | $ | 24.53 | 73,792 | $ | 24.57 | |||||
| $25.68 - $29.35 |
89,700 | 5.52 | $ | 27.49 | 89,700 | $ | 27.49 | |||||
| $29.35 - $33.02 |
528,595 | 6.47 | $ | 31.27 | 526,946 | $ | 31.27 | |||||
| $33.02 - $36.69 |
495,343 | 6.44 | $ | 35.74 | 387,958 | $ | 35.48 | |||||
| 2,198,900 | 6.26 | $ | 25.56 | 1,576,593 | $ | 26.58 | ||||||
The Company issues shares to satisfy the exercise of options.
Restricted Stock
Settlement of Restricted Shares
During the fiscal year ended June 30, 2010, the Company elected to offer to employees the use of the net settlement feature. Under this program, shares can be repurchased upon exercise to meet minimum statutory tax-witholding requirements without resulting in a liability classification of the award.
Employees
During the fiscal year ended June 30, 2010, the Company elected to grant certain employees shares of restricted stock. On December 4, 2009, the Company granted 118,500 shares of restricted stock to such employees with a grant date fair value of $24.57. These awards vest annually over 3 years.
60
Table of Contents
Index to Financial Statements
SCANSOURCE, INC. AND SUBSIDIARIES
Notes to Consolidated Financial Statements—(Continued)
June 30, 2010
On May 17, 2010, the Company granted 1,826 shares of restricted stock with a grant date fair value of $27.38 to an executive officer. The vesting of this award is subject to the satisfaction of certain service and performance conditions established within the award agreement.
During the fiscal year ended June 30, 2010, the Company elected to grant certain employees an aggregate of 3,900 shares of restricted stock. These shares were granted based on promotions and will vest annually over 3 years.
Non-Employee Directors
Per the 2003 Directors Plan, non-employee directors will receive annual awards of restricted stock, as opposed to stock options. The number of shares of restricted stock to be granted will be established from time to time by the Board of Directors. Currently, the number of shares of restricted stock awarded to each non-employee director will be determined by dividing $80,000 by the fair market value of the common stock on the date of grant. These awards will generally vest in full on the day that is six months after the date of grant, and the compensation expense associated with these awards will be recognized on a pro-rata basis over this period. On December 4, 2009, the Company granted shares of 16,500 restricted stock in accordance with the provisions of this plan, with a grant date fair value of $24.57.
A summary of the status of the Company’s outstanding restricted stock as of June 30, 2010, and the changes during the year ended June 30, 2010, are presented below:
| Fiscal Year Ended June 30, 2010 | ||||||
| Shares | Weighted-Average Grant Date Fair- Value | |||||
| Outstanding, beginning of year |
71,395 | $ | 19.47 | |||
| Granted during the period |
140,726 | 24.64 | ||||
| Vested during the period |
(38,479 | ) | 21.01 | |||
| Cancelled, forfeited, or expired during the period |
(1,354 | ) | 21.49 | |||
| Outstanding, end of year |
172,288 | $ | 23.33 | |||
As of June 30, 2010, there was approximately $3 million of unrecognized compensation cost related to unvested restricted stock awards granted, which is expected to be recognized over a weighted average period of 2.19 years.
| (11) | Employee Benefit Plans |
The Company has a defined contribution plan under Section 401(k) of the Internal Revenue Code of 1986, as amended that covers all employees located in the United States meeting certain eligibility requirements. For the years ended June 30, 2010, 2009 and 2008 the Company provided a matching contribution of $0.4 million for each period, respectively, which was equal to one-half of each participant’s contribution, up to a maximum matching contribution per participant of $800 for 2010, 2009 and 2008. The Company determines its matching contributions annually and can make discretionary contributions in addition to matching contributions. In fiscal 2010, 2009 and 2008, the Company made discretionary profit-sharing contributions of approximately $3.2 million, $4.4 million and $6.4 million, respectively. Employer contributions are vested based upon tenure over a five-year period.
61
Table of Contents
Index to Financial Statements
SCANSOURCE, INC. AND SUBSIDIARIES
Notes to Consolidated Financial Statements—(Continued)
June 30, 2010
Internationally, the Company contributes to either plans required by local governments or to various employee annuity plans.
The Company also maintains a non-qualified, unfunded, deferred compensation plan that allows eligible executives to defer a portion of their compensation in addition to receiving discretionary matching contributions from the Company. Employer contributions are vested over a five-year period.
| (12) | Income Taxes |
Income tax expense (benefit) consists of:
| Fiscal Year Ended June 30, | ||||||||||||
| 2010 | 2009 | 2008 | ||||||||||
| (in thousands) | ||||||||||||
| Current: |
||||||||||||
| Federal |
$ | 27,749 | $ | 20,444 | $ | 27,087 | ||||||
| State |
1,104 | (314 | ) | 3,663 | ||||||||
| Foreign |
2,922 | 5,626 | 4,046 | |||||||||
| Total current |
31,775 | 25,756 | 34,796 | |||||||||
| Deferred: |
||||||||||||
| Federal |
(4,410 | ) | 2,253 | (348 | ) | |||||||
| State |
(323 | ) | 191 | (162 | ) | |||||||
| Foreign |
(113 | ) | (234 | ) | 300 | |||||||
| Total deferred |
(4,846 | ) | 2,210 | (210 | ) | |||||||
| Total |
$ | 26,929 | $ | 27,966 | $ | 34,586 | ||||||
A reconciliation of the U.S. Federal income tax expense at a statutory rate of 35% to actual income tax expense, excluding any other taxes related to extraordinary gain is as follows:
| Fiscal Year Ended June 30, | ||||||||||||
| 2010 | 2009 | 2008 | ||||||||||
| (in thousands) | ||||||||||||
| U.S. Federal income tax at statutory rate |
$ | 26,509 | $ | 26,479 | $ | 31,588 | ||||||
| Increase (decrease) in income taxes due to: |
||||||||||||
| State and local income taxes, net of |
935 | (81 | ) | 2,338 | ||||||||
| U.S. Federal income tax benefit |
- | - | - | |||||||||
| Tax credits |
(633 | ) | (175 | ) | (277 | ) | ||||||
| Valuation allowance |
(128 | ) | 21 | 772 | ||||||||
| Effect of foreign operations, net |
(1,342 | ) | (162 | ) | (267 | ) | ||||||
| Stock compensation |
580 | 548 | 426 | |||||||||
| Other |
1,008 | 1,336 | 6 | |||||||||
| $ | 26,929 | $ | 27,966 | $ | 34,586 | |||||||
62
Table of Contents
Index to Financial Statements
SCANSOURCE, INC. AND SUBSIDIARIES
Notes to Consolidated Financial Statements—(Continued)
June 30, 2010
The tax effects of temporary differences that give rise to significant portions of the deferred tax assets and liabilities at June 30, 2010 and 2009 are presented below:
| June 30, | ||||||||
| 2010 | 2009 | |||||||
| (in thousands) | ||||||||
| Deferred tax assets derived from: |
||||||||
| Allowance for accounts receivable |
$ | 4,164 | $ | 3,541 | ||||
| Inventories |
7,891 | 5,054 | ||||||
| Nondeductible accrued expenses |
974 | 822 | ||||||
| Net operating loss carryforwards |
290 | 157 | ||||||
| Tax credits |
643 | 1,020 | ||||||
| Deferred compensation |
3,132 | 2,378 | ||||||
| Stock compensation |
4,857 | 3,523 | ||||||
| Total deferred tax assets |
21,951 | 16,495 | ||||||
| Valuation allowance |
(712 | ) | (839 | ) | ||||
| Total deferred tax assets |
21,239 | 15,656 | ||||||
| Deferred tax liabilities derived from: |
||||||||
| Timing of amortization deduction from intangible assets |
(2,317 | ) | (1,792 | ) | ||||
| Timing of depreciation and other deductions for building and equipment |
(459 | ) | (105 | ) | ||||
| Total deferred tax liabilities |
(2,776 | ) | (1,897 | ) | ||||
| Net deferred tax assets |
$ | 18,463 | $ | 13,759 | ||||
The components of pretax earnings are as follows:
| Fiscal Year Ended June 30, | |||||||||
| 2010 | 2009 | 2008 | |||||||
| (in thousands) | |||||||||
| Domestic |
$ | 65,566 | $ | 59,957 | $ | 75,793 | |||
| Foreign |
10,175 | 15,697 | 14,425 | ||||||
| $ | 75,741 | $ | 75,654 | $ | 90,218 | ||||
At June 30, 2010, the Company has: (i) gross net operating loss carry forwards of approximately $0.2 million for U.S. Federal income tax purposes that will begin to expire in 2020; (ii) gross net operating loss carry forwards of approximately $.9 million for state income tax purposes, (iii) foreign gross net operating loss carry forwards of approximately $.8 million and (iv) state income tax credit carry forwards of approximately $0.3 million that will begin to expire in 2024. As of June 30, 2010, the Company has established a full valuation reserve against the foreign net operating loss carry forwards, and, for both periods, a valuation allowance of less than $0.1 million for state net operating losses where it was determined that, in accordance with ASC 740, it is more likely than not that they cannot be utilized.
There is a partial valuation reserve against foreign tax credits of approximately $0.4 million as it was determined that it is more likely than not that a portion of the credits cannot be utilized.
63
Table of Contents
Index to Financial Statements
SCANSOURCE, INC. AND SUBSIDIARIES
Notes to Consolidated Financial Statements—(Continued)
June 30, 2010
The Company has not provided U.S. income taxes for undistributed earnings of foreign subsidiaries that are considered to be retained indefinitely for reinvestment. The distribution of these earnings would result in additional foreign withholding taxes and additional U.S. federal income taxes to the extent they are not offset by foreign tax credits, but it is not practicable to estimate the total liability that would be incurred upon such a distribution.
Effective July 1, 2007, the beginning of fiscal year 2008, the Company adopted the provisions of FIN 48 or (“ASC 740”), which clarifies the accounting for uncertainty in income taxes recognized in an enterprise’s financial statements in accordance with ASC 740 and prescribes a recognition threshold and measurement attribute for the financial statement recognition and measurement of a tax position taken or expected to be taken in a tax return. ASC 740 also provides guidance on de-recognition, classification, interest and penalties, accounting in interim periods, disclosure and transition.
As of June 30, 2010, the Company had gross unrecognized tax benefits of $2.3 million, $2.0 million of which, if recognized, would affect the effective tax rate. This reflects no change on a net basis over the prior fiscal year. The Company does not expect that the total amounts of unrecognized tax benefits will significantly increase or decrease within the next twelve months.
A reconciliation of the beginning and ending amount of unrecognized tax benefits is as follows:
| 2010 | 2009 | 2008 | ||||||||||
| (in thousands) | ||||||||||||
| Beginning Balance |
$ | 2,309 | $ | 1,976 | $ | 1,599 | ||||||
| Additions based on tax positions related to the current year |
- | 173 | - | |||||||||
| Additions for tax positions of prior years |
307 | 182 | 394 | |||||||||
| Reduction for tax positions of prior years |
(359 | ) | (22 | ) | (17 | ) | ||||||
| Settlements |
- | - | - | |||||||||
| Ending Balance |
$ | 2,257 | $ | 2,309 | $ | 1,976 | ||||||
The Company conducts business globally and, as a result, one or more of its subsidiaries files income tax returns in the U.S. federal, various state, local and foreign jurisdictions. In the normal course of business, the Company is subject to examination by taxing authorities in countries in which it operates. With few exceptions, the Company is no longer subject to state and local, or non-U.S. income tax examinations by tax authorities for the years before 2006.
The Company’s continuing practice is to recognize interest and penalties related to income tax matters in income tax expense. As of June 30, 2010, the Company had approximately $1.0 million accrued for interest and penalties, of which $0.2 million was a current period expense.
The Company’s effective tax rate differs from the federal statutory rate of 35% primarily as a result of state taxes.
64
Table of Contents
Index to Financial Statements
SCANSOURCE, INC. AND SUBSIDIARIES
Notes to Consolidated Financial Statements—(Continued)
June 30, 2010
| (13) | Committments and Contingencies |
Leases
The Company leases office and warehouse space under non-cancelable operating leases that expire through September 2017. Future minimum lease payments under operating leases are as follows:
| Payments | |||
| (in thousands) | |||
| Fiscal Year Ended June 30, |
|||
| 2011 |
$ | 4,610 | |
| 2012 |
3,927 | ||
| 2013 |
3,353 | ||
| 2014 |
3,068 | ||
| 2015 |
2,852 | ||
| Thereafter |
5,448 | ||
| $ | 23,258 | ||
Lease expense was approximately $4.4 million, $4.4 million, and $3.8 million for the fiscal years ended June 30, 2010, 2009, and 2008, respectively. On April 27, 2007, the Company entered into an agreement to lease approximately 600,000 square feet for distribution, warehousing and storage purposes in a building located in Southaven, Mississippi. The lease also provides for a right of first refusal on an additional 147,000 square feet of expansion space. The term of the lease is 120 months with 2 consecutive 5-year extension options.
Committments and Contingencies
A majority of the Company’s net revenues in 2010, 2009 and 2008 were received from the sale of products purchased from the Company’s ten largest vendors. The Company has entered into written distribution agreements with substantially all of its major vendors. While the Company’s agreements with most of its vendors contain standard provisions for periodic renewals, these agreements generally permit termination by either party without cause upon 30 to 120 days notice.
The Company or its subsidiaries are, from time to time, parties to lawsuits arising out of operations. Although there can be no assurance, based upon information known to the Company, the Company believes that any liability resulting from an adverse determination of such lawsuits would not have a material adverse effect on the Company’s financial condition or results of operations.
During the Quarter ended December 31, 2008, the Company settled a claim against a former legal service provider resulting in a $3.5 million recovery. The settlement was received by the Company on December 5, 2008 and was recorded as other income.
| (14) | Segment Information |
The Company is a leading distributor of specialty technology products, providing value-added distribution sales to resellers in the specialty technology markets. The Company has two reporting segments, based on geographic location.
65
Table of Contents
Index to Financial Statements
SCANSOURCE, INC. AND SUBSIDIARIES
Notes to Consolidated Financial Statements—(Continued)
June 30, 2010
North American Distribution
North American Distribution offers products for sale in four primary categories: (i) AIDC and POS equipment sold by the ScanSource POS and Barcoding sales unit, (ii) voice, data and converged communications equipment sold by the Catalyst Telecom sales unit, (iii) video conferencing, telephony, and communications products sold by the ScanSource Communications unit, (iv) electronic security products and wireless infrastructure products through the ScanSource Security Distribution sales unit. These products are sold to more than 14,000 resellers and integrators of technology products that are geographically disbursed over the United States and Canada in a pattern that mirrors population concentration. No single account represented more than 5% of the Company’s consolidated net sales for the fiscal years ended June 30, 2010, 2009, and 2008, respectively.
International Distribution
The international distribution segment sells to two geographic areas, Latin America (including Mexico) aggregated with Europe, offers AIDC and POS equipment as well as communications products to more than 7,000 resellers and integrators of technology products. Of this segment’s customers, no single account represented more than 2% of the Company’s consolidated net sales during the fiscal years ended June 30, 2010, 2009, and 2008, respectively.
Inter-segment sales consist primarily of sales by the North American distribution segment to the international distribution segment. All inter-segment revenues and profits have been eliminated in the accompanying Consolidated Financial Statements.
66
Table of Contents
Index to Financial Statements
SCANSOURCE, INC. AND SUBSIDIARIES
Notes to Consolidated Financial Statements—(Continued)
June 30, 2010
Selected financial information for each business segment is presented below:
| Fiscal Year Ended June 30, | ||||||||||||
| 2010 | 2009 | 2008 | ||||||||||
| (in thousands) | ||||||||||||
| Sales: |
||||||||||||
| North American distribution |
$ | 1,688,663 | $ | 1,527,656 | $ | 1,806,700 | ||||||
| International distribution |
448,967 | 347,825 | 397,951 | |||||||||
| Less intersegment sales |
(22,651 | ) | (27,512 | ) | (29,166 | ) | ||||||
| $ | 2,114,979 | $ | 1,847,969 | $ | 2,175,485 | |||||||
| Depreciation and amortization: |
||||||||||||
| North American distribution |
$ | 4,730 | $ | 5,833 | $ | 6,214 | ||||||
| International distribution |
1,334 | 948 | 913 | |||||||||
| $ | 6,064 | $ | 6,781 | $ | 7,127 | |||||||
| Operating income: |
||||||||||||
| North American distribution |
$ | 64,342 | $ | 56,261 | $ | 76,233 | (1) | |||||
| International distribution |
11,434 | 17,857 | 17,732 | |||||||||
| $ | 75,776 | $ | 74,118 | $ | 93,965 | |||||||
| Assets: |
||||||||||||
| North American distribution |
$ | 784,559 | $ | 689,865 | $ | 671,434 | ||||||
| International distribution |
75,191 | 58,766 | 100,772 | |||||||||
| $ | 859,750 | $ | 748,631 | $ | 772,206 | |||||||
| Capital expenditures: |
||||||||||||
| North American distribution |
$ | 5,344 | $ | 3,513 | $ | 5,751 | ||||||
| International distribution |
262 | 142 | 1,231 | |||||||||
| $ | 5,606 | $ | 3,655 | $ | 6,982 | |||||||
| (1) | Included in North American distribution’s operating income for the fiscal years ended June 30, 2008 are $1.0 million of direct costs associated with the special committee review of the Company’s stock option practices. |
Selected financial information by product category is presented below:
| Fiscal Year Ended June 30, | |||||||||
| 2010 | 2009 | 2008 | |||||||
| (in thousands) | |||||||||
| Sales by Product Category: |
|||||||||
| POS, barcoding and security products |
$ | 1,300,525 | $ | 1,161,956 | $ | 1,379,573 | |||
| Communication products |
814,454 | 686,013 | 795,912 | ||||||
| $ | 2,114,979 | $ | 1,847,969 | $ | 2,175,485 | ||||
67
Table of Contents
Index to Financial Statements
SCANSOURCE, INC. AND SUBSIDIARIES
Notes to Consolidated Financial Statements—(Continued)
June 30, 2010
| (15) | Related Party Transactions |
During fiscal years 2010, 2009, and 2008, the Company had sales of $3.7 million, $3.2 million, and $4.2 million, respectively, to companies affiliated with the former minority shareholder of Netpoint. At June 30, 2010 and 2009, accounts receivable from these companies totaled $0.7 million, and $0.3 million, respectively.
During fiscal years 2010, 2009 and 2008, the Company had sales of $0 million, $9.0 million and $7.2 million respectively, to a company affiliated with a member of management. At June 30, 2009, net accounts receivable from this company totaled $4.7 million.
| (16) | Subsequent Events |
In accordance with ASC 855 – Subsequent events, the Company evaluated events occurring between the end of our most recent fiscal year, the date the financial statements were filed with the SEC.
68
Table of Contents
Index to Financial Statements
| ITEM 9. | Changes In and Disagreements with Accountants on Accounting and Financial Disclosure. |
Not applicable.
| ITEM 9A. | Controls and Procedures. |
(a) Evaluation of Disclosure Controls and Procedures
We maintain “disclosure controls and procedures,” as such term is defined in Rule 13a-15(e) under the Securities Exchange Act of 1934 (the “Exchange Act”), that are designed to ensure that information required to be disclosed by us in reports that we file or submit under the Exchange Act is recorded, processed, summarized, and reported within the time periods specified in Securities and Exchange Commission rules and forms, and that such information is accumulated and communicated to our management, including our Chief Executive Officer and Chief Financial Officer, as appropriate, to allow timely decisions regarding required disclosure. In designing and evaluating our disclosure controls and procedures, management recognized that disclosure controls and procedures, no matter how well conceived and operated, can provide only reasonable, not absolute, assurance that the objectives of the disclosure controls and procedures are met. Additionally, in designing disclosure controls and procedures, our management necessarily was required to apply judgment in evaluating the cost-benefit relationship of those disclosure controls and procedures. The design of any disclosure controls and procedures also is based in part upon certain assumptions about the likelihood of future events, and there can be no assurance that any design will succeed in achieving its stated goals under all potential future conditions. Our disclosure controls and procedures are designed to provide reasonable assurance that the controls and procedures will meet their objectives.
Based on their evaluation as of the end of the period covered by this Annual Report on Form 10-K, our Chief Executive Officer and Chief Financial Officer have concluded that our disclosure controls and procedures, as of June 30, 2010, were effective in providing reasonable assurance that the objectives of the disclosure controls and procedures are met.
(b) Management’s Report on Internal Control over Financial Reporting
Our management is responsible for establishing and maintaining adequate internal control over financial reporting as defined in Rule 13a-15(f) of the Exchange Act. Because of its inherent limitations, internal control over financial reporting may not prevent or detect all misstatements. Also, projections of any evaluation of effectiveness to future periods are subject to the risk that controls may become inadequate because of changes in conditions, or that the degree of compliance with the policies or procedures may deteriorate.
We assessed the effectiveness of the Company’s internal control over financial reporting as of June 30, 2010. In making this assessment, we used the criteria set forth by the Committee of Sponsoring Organizations of the Treadway Commission (“COSO”) in Internal Control – Integrated Framework. Based on its assessment using those criteria, our management concluded that our internal control over financial reporting was effective as of June 30, 2010.
The effectiveness of our internal control over financial reporting as of June 30, 2010 has been audited by Ernst & Young, LLP, an independent registered public accounting firm, as stated in their Report of Independent Registered Certified Public Accounting Firm on Internal Control Over Financial Reporting which is included with the Financial Statements in Part II, Item 8 of this Annual Report on Form 10-K and is incorporated herein by reference.
(c) Changes in Internal Control over Financial Reporting
There were no changes in our internal control over financial reporting that occurred during the fiscal year ended June 30, 2010 that have materially affected, or are reasonably likely to materially affect, our internal control over financial reporting.
69
Table of Contents
Index to Financial Statements
| ITEM 9B. | Other Information. |
Not applicable.
70
Table of Contents
Index to Financial Statements
PART III
Information called for by Part III (Items 10, 11, 12, 13 and 14) of this Annual Report on Form 10-K has been omitted as the Company intends to file with the SEC not later than 120 days after the end of its fiscal year ended June 30, 2010, a definitive Proxy Statement relating to the 2010 Annual Meeting of Shareholders pursuant to Regulation 14A promulgated under the Exchange Act. Such information will be set forth in such Proxy Statement and is incorporated herein by reference.
| ITEM 10. | Directors, Executive Officers and Corporate Governance. |
Incorporated herein by reference to the information presented under the headings “Management – Directors and Executive Officers of the Registrant,” “Corporate Governance Matters – Section 16(a) Beneficial Reporting Compliance,” “Corporate Governance Matters – Code of Ethics,” “Corporate Governance Matters – Board Meetings and Committees – Audit Committee,” and “Audit Committee Report” in the Company’s 2010 Proxy Statement, which will be filed with the SEC not later than 120 days after June 30, 2010.
| ITEM 11. | Executive Compensation. |
Incorporated herein by reference to the information presented under the headings “Executive Compensation,” “Corporate Governance Matters – Compensation Committee Interlocks and Insider Participation,” and “Compensation Committee Report” in the Company’s 2010 Proxy Statement, which will be filed with the SEC not later than 120 days after June 30, 2010.
| ITEM 12. | Security Ownership of Certain Beneficial Owners and Management and Related Stockholder Matters. |
Incorporated herein by reference to the information presented under the headings “Equity Compensation Plan Information” and “Security Ownership of Certain Beneficial Owners and Management” in the Company’s 2010 Proxy Statement, which will be filed with the SEC not later than 120 days after June 30, 2010.
| ITEM 13. | Certain Relationships and Related Transactions, and Director Independence. |
Incorporated herein by reference to the information presented under the heading “Certain Relationships and Related Transactions” and “Corporate Governance Matters – Independent Directors” in the Company’s 2010 Proxy Statement, which will be filed with the SEC not later than 120 days after June 30, 2010.
| ITEM 14. | Principal Accountant Fees and Services. |
Incorporated herein by reference to the information presented under the heading “Proposal [Three] – Ratification of Appointment of Independent Auditors – Principal Accountant Fees and Services” in the Company’s 2010 Proxy Statement, which will be filed with the SEC not later than 120 days after June 30, 2010.
71
Table of Contents
Index to Financial Statements
PART IV
| ITEM 15. | Exhibits and Financial Statement Schedules. |
(a)(1) Financial Statements. For a list of the financial statements included in this Annual Report on Form 10-K, see “Index to the Financial Statements” on page 35.
(a)(2) Financial Statement Schedules. Schedule II – “Valuation and Qualifying Accounts” appears below.
(a)(3) Exhibits. The list of exhibits filed as a part of this Annual Report on Form 10-K is set forth on the Exhibit Index immediately preceding such exhibits and is incorporated by reference in this Item 15(a)(3).
(b) Exhibits. See Exhibit Index.
(c) Separate Financial Statements and Schedules. None.
72
Table of Contents
Index to Financial Statements
SCHEDULE II
SCANSOURCE, INC. AND SUBSIDIARIES
Valuation and Qualifying Accounts
(in thousands)
| Description |
Balance at Beginning of Period |
Amounts Charged to Expense |
Reductions(1) | Other(2) | Balance at End of Period | |||||||||
| Valuation account for trade and notes receivable: |
||||||||||||||
| Year ended June 30, 2008 |
$ | 14,620 | 6,504 | (6,110 | ) | 2,230 | $ | 17,244 | ||||||
| Trade and current note receivable allowance |
$ | 17,244 | ||||||||||||
| Long-term note allowance |
$ | - | ||||||||||||
| Year ended June 30, 2009 |
$ | 17,244 | 6,404 | (6,696 | ) | (69 | ) | $ | 16,883 | |||||
| Trade and current note receivable allowance |
$ | 16,883 | ||||||||||||
| Long-term note allowance |
$ | - | ||||||||||||
| Year ended June 30, 2010 |
$ | 16,883 | 10,854 | (7,097 | ) | 1,267 | $ | 21,907 | ||||||
| Trade and current note receivable allowance |
$ | 21,907 | ||||||||||||
| Long-term note allowance |
$ | - | ||||||||||||
| (1) | “Reductions” amounts represent write-offs for the years indicated. |
| (2) | “Other” amounts include recoveries and the effect of foreign currency fluctuations. The amount in 2008 also includes a $1.3 million reclassification. |
73
Table of Contents
Index to Financial Statements
Pursuant to the requirements of Section 13 or 15(d) of the Securities Exchange Act of 1934, the registrant has duly caused this report to be signed on its behalf by the undersigned, thereunto duly authorized.
August 26, 2010
| SCANSOURCE, INC. | ||
| By: | /s/ MICHAEL L. BAUR | |
| Michael L. Baur | ||
| Chief Executive Officer | ||
Pursuant to the requirements of the Securities Exchange Act of 1934, this report has been signed below by the following persons on behalf of the registrant and in the capacities and on the dates indicated.
| Signature |
Title |
Date | ||
| /s/ STEVEN R. FISCHER Steven R. Fischer |
Chairman of the Board | August 26, 2010 | ||
| /s/ MICHAEL L. BAUR Michael L. Baur |
Chief Executive Officer and Director (principal executive officer) |
August 26, 2010 | ||
| /s/ RICHARD P. CLEYS Richard P. Cleys |
Vice President and Chief Financial Officer, (principal financial and accounting officer) |
August 26, 2010 | ||
| /s/ JAMES G. FOODY James G. Foody |
Director | August 26, 2010 | ||
| /s/ MICHAEL J. GRAINGER Michael J. Grainger |
Director | August 26, 2010 | ||
| /s/ JOHN P. REILLY John P. Reilly |
Director | August 26, 2010 | ||
| /s/ CHARLES R. WHITCHURCH Charles R. Whitchurch |
Director | August 26, 2010 | ||
74
Table of Contents
Index to Financial Statements
INDEX TO EXHIBITS
| Exhibit Number |
Description | Filed herewith |
Form | Period Ending |
Exhibit | Filing Date | ||||||
| 3.1 |
Amended and Restated Articles of Incorporation of the Registrant and Articles of Amendment Amending the Amended and Restated Articles of Incorporation of the Registrant | 10-Q | 12/31/04 | 3.1 | 2/3/05 | |||||||
| 3.2 |
Amended and Restated Bylaws of the Registrant, effective December 5, 2008 | 8-K | 3.1 | 12/9/08 | ||||||||
| 4.1 |
Form of Common Stock Certificate | SB-2 | 4.1 | 2/7/94 | ||||||||
| Executive Compensation Plans and Arrangements | ||||||||||||
| 10.1 |
1993 Incentive Stock Option Plan, as amended, of the Registrant and Form of Stock Option Agreement | S-1 | 10.10 | 1/23/97 | ||||||||
| 10.2 |
1997 Stock Incentive Plan, as amended, of the Registrant and Form of Stock Option Agreement | 10-K | 6/30/99 | 10.13 | 9/28/99 | |||||||
| 10.3 |
Amended and Restated 2002 Long-Term Incentive Plan | 8-K | 10.1 | 12/7/09 | ||||||||
| 10.4 |
Amended and Restated Directors Equity Compensation Plan | DEF 14A | Annex A | 10/26/06 | ||||||||
| 10.5 |
Form of Incentive Stock Option Agreement under the 2002 Long-Term Incentive Plan | 8-K | 99.1 | 1/11/05 | ||||||||
| 10.6 |
Form of Incentive Stock Option Agreement for options granted under the 2002 Long-Term Incentive Plan after December 4, 2007 | 10-K | 6/30/08 | 10.6 | 8/28/08 | |||||||
| 10.7 |
Form of Restricted Stock Award Certificate (US) under the 2002 Amended and Restated Long-Term Incentive Plan | 10-Q | 12/31/08 | 10.1 | 2/4/09 | |||||||
| 10.8 |
Form of Restricted Stock Award Certificate (UK) under the 2002 Amended and Restated Long-Term Incentive Plan | 10-Q | 12/31/08 | 10.2 | 2/4/09 | |||||||
| 10.9 |
Form of Restricted Stock Award Certificate (Europe, not UK) under the 2002 Amended and Restated Long-Term Incentive Plan | 10-Q | 12/31/08 | 10.3 | 2/4/09 | |||||||
| 10.10 |
Form of Restricted Stock Award Certificate under the Amended and Restated 2002 Long-Term Incentive Plan for grants on or after December 3, 2009 | 8-K | 10.2 | 12/7/09 | ||||||||
| 10.11 |
Form of Incentive Stock Option Award Certificate under the Amended and Restated 2002 Long-Term Incentive Plan for grants on or after December 3, 2009 | 8-K | 10.3 | 12/7/09 | ||||||||
Table of Contents
Index to Financial Statements
| Exhibit Number |
Description | Filed herewith |
Form | Period Ending |
Exhibit | Filing Date | ||||||
| 10.12 |
Form of Non-Qualified Stock Option Award Certificate under the Amended and Restated 2002 Long-Term Incentive Plan for grants on or after December 3, 2009 | 8-K | 10.4 | 12/7/09 | ||||||||
| 10.13 |
Nonqualified Deferred Compensation Plan, as amended and restated effective January 1, 2005 | 10-Q | 9/30/09 | 10.2 | 11/9/09 | |||||||
| 10.14 |
Amended and Restated Employment Agreement effective as of June 30, 2008 between the Registrant and Michael L. Baur | 10-K | 6/30/08 | 10.19 | 8/28/08 | |||||||
| 10.15 |
Amended and Restated Employment Agreement effective as of June 30, 2008 between the Registrant and Richard P. Cleys | 10-K | 6/30/08 | 10.18 | 8/28/08 | |||||||
| 10.16 |
Amended and Restated Employment Agreement effective as of May 21, 2009 between the Registrant and R. Scott Benbenek | 10-K | 6/30/09 | 10.13 | 8/27/09 | |||||||
| 10.17 |
Amended and Restated Employment Agreement effective as of May 21, 2009 between the Registrant and Andrea Dvorak Meade | 10-K | 6/30/09 | 10.14 | 8/27/09 | |||||||
| 10.18 |
Amended and Restated Employment Agreement dated May 17, 2010 between the Registrant and John J. Ellsworth | X | ||||||||||
| 10.19 |
Form of Amendment to Stock Option Agreement and Promise to Make Cash Payment for Andrea D. Meade and R. Scott Benbenek | 10-Q | 12/31/07 | 10.1 | 2/6/08 | |||||||
| 10.20 |
Amendment to Stock Option Agreement and Promise to Make Cash Payment for Richard Cleys and Bobby McLain | 10-Q | 12/31/07 | 10.2 | 2/6/08 | |||||||
| 10.21 |
Description of Option Remediation for Certain Executive Officers and Directors | 10-Q | 12/31/07 | 10.3 | 2/6/08 | |||||||
| 10.22 |
Form of Restricted Stock Award Certificate for R. Scott Benbenek | 10-K | 6/30/09 | 10.19 | 8/27/09 | |||||||
| 10.23 |
Form of Restricted Stock Award Certificate for Andrea D. Meade | 10-K | 6/30/09 | 10.20 | 8/27/09 | |||||||
| 10.24 |
Form of Restricted Stock Award Certificate for John J. Ellsworth | X | ||||||||||
Table of Contents
Index to Financial Statements
| Exhibit Number |
Description | Filed herewith |
Form | Period Ending |
Exhibit | Filing Date | ||||||
| Bank Agreements | ||||||||||||
| 10.25 |
Amended and Restated Credit Agreement dated as of July 16, 2004 among ScanSource, Inc., Netpoint International, Inc., 4100 Quest, LLC, and Partner Services, Inc., ScanSource Europe SPRL, ScanSource Europe Limited and ScanSource UK Limited, Branch Banking and Trust Company of South Carolina, as Administrative Agent and a Bank, Wachovia Bank, National Association, as Syndication Agent and an Other Currency Lender, and Fifth Third Bank, First Tennessee Bank National Association and Hibernia National Bank as Banks | 10-K | 6/30/04 | 10.19 | 9/10/04 | |||||||
| 10.26 |
First Amendment dated as of May 13, 2005 to Amended and Restated Credit Agreement dated as of July 16, 2004 among ScanSource, Inc., Netpoint International, Inc., 4100 Quest, LLC and Partner Services, Inc., ScanSource Europe SPRL, ScanSource Europe Limited and ScanSource UK Limited, Branch Banking and Trust Company of South Carolina, as Administrative Agent and a Bank, Wachovia Bank, National Association, as Syndication Agent and an Other Currency Lender, and Fifth Third Bank, First Tennessee Bank National Association and Hibernia National Bank as Banks | 10-K | 6/30/05 | 10.25 | 9/1/05 | |||||||
| 10.27 |
Letter Agreement and Consent dated July 3, 2006 amending the Amended and Restated Credit Agreement dated as of July 16, 2004 among ScanSource, Inc., Netpoint International, Inc., 4100 Quest, LLC, and Partner Services, Inc., ScanSource Europe SPRL, ScanSource Europe Limited and ScanSource UK Limited, Branch Banking and Trust Company of South Carolina, as Administrative Agent and a Bank, Wachovia Bank, National Association, as Syndication Agent and an Other Currency Lender, and Fifth Third Bank, First Tennessee Bank National Association and Capital One, N.A. (formerly Hibernia National Bank) as Banks | 10-K | 6/30/06 | 10.30 | 9/1/06 | |||||||
Table of Contents
Index to Financial Statements
| Exhibit Number |
Description | Filed herewith |
Form | Period Ending |
Exhibit | Filing Date | ||||||
| 10.28 |
Waivers dated as of November 7, 2006 to Amended and Restated Credit Agreement dated as of July 16, 2004, as amended, among ScanSource, Inc., Netpoint International, Inc., ScanSource Europe Limited, ScanSource UK Limited, 4100 Quest, LLC, Partner Services, Inc. and T2 Supply, Inc., Branch Banking and Trust Company of South Carolina, Wachovia Bank, National Association, Fifth Third Bank, First Tennessee Bank National Association and Capital One, N.A. | 10-Q | 12/31/06 | 10.1 | 6/18/07 | |||||||
| 10.29 |
Amendment dated as of February 14, 2007 to Amended and Restated Credit Agreement dated as of July 16, 2004, as amended, among ScanSource, Inc., Netpoint International, Inc., ScanSource Europe Limited, ScanSource UK Limited, 4100 Quest, LLC, Partner Services, Inc. and T2 Supply, Inc., Branch Banking and Trust Company of South Carolina, Wachovia Bank, National Association, Fifth Third Bank, First Tennessee Bank National Association and Capital One, N.A. | 10-Q | 3/31/07 | 10.1 | 6/18/07 | |||||||
| 10.30 |
Waivers dated as of February 14, 2007 to Amended and Restated Credit Agreement dated as of July 16, 2004, as amended, among ScanSource, Inc., Netpoint International, Inc., ScanSource Europe Limited, ScanSource UK Limited, 4100 Quest, LLC, Partner Services, Inc. and T2 Supply, Inc., Branch Banking and Trust Company of South Carolina, Wachovia Bank, National Association, Fifth Third Bank, First Tennessee Bank National Association and Capital One, N.A. | 10-Q | 3/31/07 | 10.2 | 6/18/07 | |||||||
| 10.31 |
Third Amendment dated as of April 20, 2007 to its Amended and Restated Credit Agreement dated as of July 16, 2004, as amended, among ScanSource, Inc., Netpoint International, Inc., ScanSource Europe Limited, ScanSource UK Limited, 4100 Quest, LLC, Partner Services, Inc. and T2 Supply, Inc., Branch Banking and Trust Company of South Carolina, Wachovia Bank, National Association, Fifth Third Bank, First Tennessee Bank National Association and Capital One, N.A. (formerly Hibernia National Bank) as Banks | 10-K | 6/30/07 | 10.25 | 8/29/07 | |||||||
Table of Contents
Index to Financial Statements
| Exhibit Number |
Description | Filed herewith |
Form | Period Ending |
Exhibit | Filing Date | ||||||
| 10.32 |
Waivers dated as of May 14, 2007 to Amended and Restated Credit Agreement dated as of July 16, 2004, as amended, among ScanSource, Inc., Netpoint International, Inc., ScanSource Europe Limited, ScanSource UK Limited, 4100 Quest, LLC, Partner Services, Inc. and T2 Supply, Inc., Branch Banking and Trust Company of South Carolina, Wachovia Bank, National Association, Fifth Third Bank, First Tennessee Bank National Association and Capital One, N.A | 10-K | 6/30/07 | 10.28 | 8/29/07 | |||||||
| 10.33 |
Credit Agreement dated as of September 28, 2007, among ScanSource, Inc., the Subsidiary Borrowers party thereto, the Lenders party thereto and, J.P. Morgan Chase Bank, N.A. as Administrative Agent, Swingline Lender and Issuing Bank, Wachovia Bank, N.A. as Syndication Agent, and Regions Bank and Wells Fargo Bank, N.A. as Co-Documentation Agents, J.P. Morgan Securities Inc., as Sole Bookrunner and Sole Lead Arranger | 8-K | 10.1 | 10/1/07 | ||||||||
| 10.34 |
Amendment No. 1 to Credit Agreement and Waiver entered into as of October 30, 2009, among ScanSource, Inc., the Subsidiary Borrowers party thereto, J.P. Morgan Chase Bank, N.A., individually and as administrative agent and the other financial institutions signatory thereto. | 10-Q | 9/30/09 | 10.1 | 11/9/09 | |||||||
| Other Agreements | ||||||||||||
| 10.35+ |
Industrial Lease Agreement dated April 27, 2007 between Registrant and Industrial Developments International, Inc. | 10-K | 6/30/07 | 10.26 | 8/29/07 | |||||||
| 10.36 |
Purchase and Sale Agreement dated December 13, 2007 between 4100 Quest, LLC, a wholly owned subsidiary of ScanSource, Inc., and Kansas City Life Insurance Company | 10-K | 6/30/08 | 10.31 | 8/28/08 | |||||||
| 10.37 |
Amendment dated as of January 18, 2008 to Purchase and Sale Agreement dated December 13, 2007 between 4100 Quest, LLC and Kansas City Life Insurance Company | 10-K | 6/30/08 | 10.32 | 8/28/08 | |||||||
| 10.38 |
Amendment dated as of January 30, 2008 to Purchase and Sale Agreement dated December 13, 2007 between 4100 Quest, LLC and Kansas City Life Insurance Company | 10-K | 6/30/08 | 10.33 | 8/28/08 | |||||||
| 10.39+ |
US Avaya contract with ScanSource, Inc. | X | ||||||||||
Table of Contents
Index to Financial Statements
| Exhibit Number |
Description | Filed herewith |
Form | Period Ending |
Exhibit | Filing Date | ||||||
| 10.40+ |
US Motorola (f/k/a Symbol Technologies) contract with ScanSource, Inc. | X | ||||||||||
| 10.41++ |
Letter Agreement with US Motorola | X | ||||||||||
| 21.1 |
Subsidiaries of the Company | X | ||||||||||
| 23.1 |
Consent of Ernst & Young LLP | X | ||||||||||
| 31.1 |
Certification of the Chief Executive Officer Pursuant to Section 302 of the Sarbanes-Oxley Act of 2002 | X | ||||||||||
| 31.2 |
Certification of the Chief Financial Officer Pursuant to Section 302 of the Sarbanes-Oxley Act of 2002 | X | ||||||||||
| 32.1 |
Certification of the Chief Executive Officer of ScanSource, Inc. Pursuant to 18 U.S.C. Section 1350, as Adopted Pursuant to §906 of the Sarbanes-Oxley Act of 2002 | X | ||||||||||
| 32.2 |
Certification of the Chief Financial Officer of ScanSource, Inc. Pursuant to 18 U.S.C. Section 1350, as Adopted Pursuant to §906 of the Sarbanes-Oxley Act of 2002 | X | ||||||||||
| 99.1 |
Consent Order for Final Approval of Settlement | 8-K | 99.1 | 6/19/09 | ||||||||
| 99.2 |
Stipulation of Compromise and Settlement, dated as of April 15, 2009 | 8-K | 99.1 | 4/15/09 | ||||||||
| + | Confidential treatment has been granted with respect to certain portions of this Exhibit, which portions have been omitted and filed separately with the Commission as part of an application for confidential treatment. |
| ++ | Portions of this Exhibit have been omitted and filed separately with the Commission as a part of an application for confidential treatment. |