Attached files
| file | filename |
|---|---|
| 8-K - 8-K - Great Western Bancorp, Inc. | gwb-20150930x8xkxearnings.htm |
| EX-99.1 - EXHIBIT 99.1 - Great Western Bancorp, Inc. | gwb-20150930xearningsxex991.htm |

Earnings Release | October 29, 2015

Forward-Looking Statements: This presentation contains forward-looking statements within the meaning of the Private Securities Litigation Reform Act of 1995. Statements about our expectations, beliefs, plans, predictions, forecasts, objectives, assumptions or future events or performance are not historical facts and may be forward- looking. These statements are often, but not always, made through the use of words or phrases such as “anticipates,” “believes,” “can,” “could,” “may,” “predicts,” “potential,” “should,” “will,” “estimate,” “plans,” “projects,” “continuing,” “ongoing,” “expects,” “intends” and similar words or phrases. Accordingly, these statements are only predictions and involve estimates, known and unknown risks, assumptions and uncertainties that could cause actual results to differ materially from those expressed. All forward-looking statements are necessarily only estimates of future results, and there can be no assurance that actual results will not differ materially from expectations, and, therefore, you are cautioned not to place undue reliance on such statements. Any forward-looking statements are qualified in their entirety by reference to the factors discussed in the sections titled “Item 1A. Risk Factors” and “Cautionary Note Regarding Forward-Looking Statements” in our Annual Report on Form 10-K for the fiscal year ended September 30, 2014. Further, any forward-looking statement speaks only as of the date on which it is made, and we undertake no obligation to update any forward-looking statement to reflect events or circumstances after the date on which the statement is made or to reflect the occurrence of unanticipated events. Non-GAAP Financial Measures: This presentation contains non-GAAP measures which our management relies on in making financial and operational decisions about our business and which exclude certain items that we do not consider reflective of our business performance. We believe that the presentation of these measures provides investors with greater transparency and supplemental data relating to our financial condition and results of operations. These non-GAAP measures should be considered in context with our GAAP results. A reconciliation of these non- GAAP measures appears in our earnings release dated October 29, 2015 and in the appendix to this presentation. Our earnings release and this presentation are available in the Investor Relations section of our website at www.greatwesternbank.com. Our earnings release and this presentation are also available as part of our Current Report on Form 8-K filed with the SEC on October 29, 2015. Explanatory Note: In this presentation, all financial information presented refers to the financial results of Great Western Bancorp, Inc. combined with those of its predecessor, Great Western Bancorporation, Inc. Disclosures

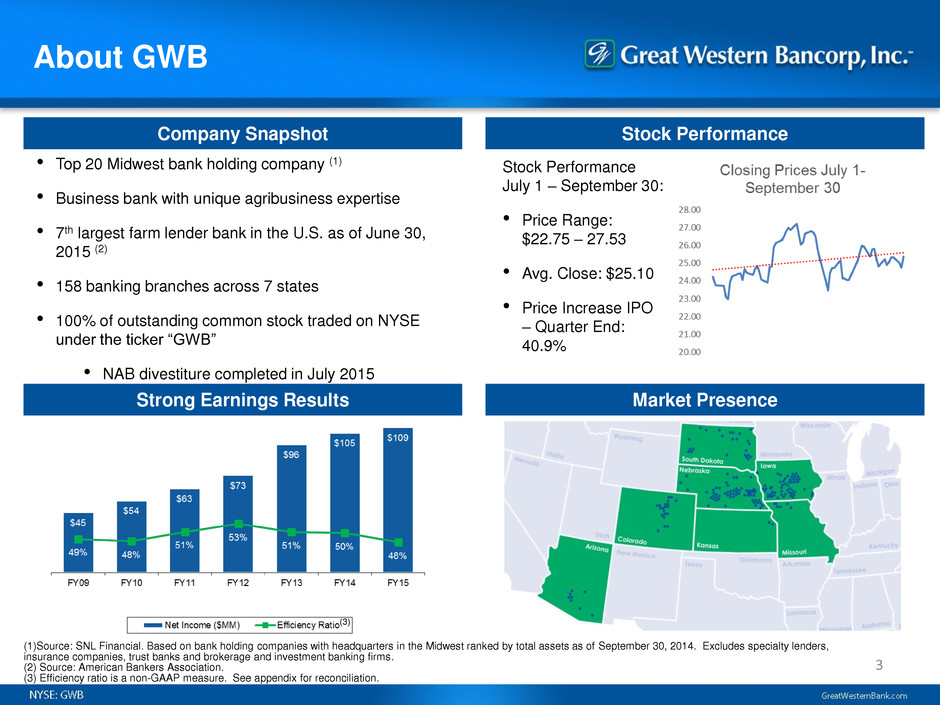
About GWB 3 Company Snapshot Stock Performance Strong Earnings Results Market Presence • Top 20 Midwest bank holding company (1) • Business bank with unique agribusiness expertise • 7th largest farm lender bank in the U.S. as of June 30, 2015 (2) • 158 banking branches across 7 states • 100% of outstanding common stock traded on NYSE under the ticker “GWB” • NAB divestiture completed in July 2015 Stock Performance July 1 – September 30: • Price Range: $22.75 – 27.53 • Avg. Close: $25.10 • Price Increase IPO – Quarter End: 40.9% (1)Source: SNL Financial. Based on bank holding companies with headquarters in the Midwest ranked by total assets as of September 30, 2014. Excludes specialty lenders, insurance companies, trust banks and brokerage and investment banking firms. (2) Source: American Bankers Association. (3) Efficiency ratio is a non-GAAP measure. See appendix for reconciliation. (3)

• FY15 net charge-offs of $9.4 million or 0.13% of average loans (0.14% in FY14) • OREO balances declined $33.7 million or 68% compared to September 30, 2014 and stand at $15.9 million as of September 30, 2015 • Nonperforming loans 0.93% of total loans at September 30, 2015 (1.16% at September 30, 2014) Executing on Strategy Focused Business Banking Franchise with Agribusiness Expertise • Fiscal year loan growth of 7.9% (9.2% core, net of balances managed by loan workout group), including 12% CRE and 11% agriculture growth • Deposit growth of 4.7% included approximately $367 million of net growth in business deposits, reflecting a focus on that portion of the business Strong Profitability and Growth Driven by a Highly Efficient Operating Model • EPS of $0.60 for the quarter and $1.90 for FY15 • Full-year profitability strong despite low rate environment: 1.12% ROAA and 15.4% ROATCE(1) • Efficiency ratio(1) of 48.0% for FY15 improved compared to 50.4% for FY14 Risk Management Driving Strong Credit Quality Strong Capital Generation and Attractive Dividend • Completed $60 million stock repurchase and issued $35 million of sub debt during the quarter • Sub debt proceeds used to repay all outstanding indebtedness to NAB • Quarterly dividend of $0.14 per share announced October 29, 2015; $0.02 per share increase over previous dividends (1) This is a non-GAAP measure. See appendix for reconciliation. 4

(1) Chart excludes changes related to loans and derivatives at fair value which netted $(5.9) million for the quarter. Dollars in thousands. (2) Adjusted NIM (FTE) is a non-GAAP measure. See appendix for reconciliations. Revenue 5 Revenue Highlights Net Interest Income ($MM) and NIM NIM Analysis Noninterest Income (1) • Net interest income (FTE) increased by 3% compared to 4QFY14 driven by higher loan interest income and lower deposit interest expense • Reported and adjusted NIM (FTE)(2) up 3 and 2 basis points, respectively, compared to 3QFY15, driven by growth in average loans outstanding contributing to a more favorable asset mix • Service charges and fees delivered a small seasonal increase, as expected, compared to 3QFY15, but lagged 4QFY14 by 2% driven by changing customer behavior (2) +3% QoQ

Expenses, Provision & Earnings 6 Highlights Provision for Loan Losses ($MM) Noninterest Expense ($MM) Net Income ($MM) • Efficiency ratio (1) was 45.8% for the quarter and 48.0% for FY15 • Net negative OREO charges and net gain on sale of fixed assets (i.e. contra expenses), paired with focused expense control, drove a significantly lower ratio for the quarter • Provision for loan losses decreased $1.1 million, or 41%, in 4QFY15 compared to 4QFY14, but increased $18.3 million for the full year • Higher ALLL for both specific and general (which includes ALLL related to net loan growth) categories drove the majority of the higher annual provision expense Stable Expense Base Aided by Lower Intangible Amortization; Focused Investment in People and Technology (1) Efficiency ratio is a non-GAAP measure. See appendix for reconciliation. (1) YoY increase helped build ALLL (specific and general)

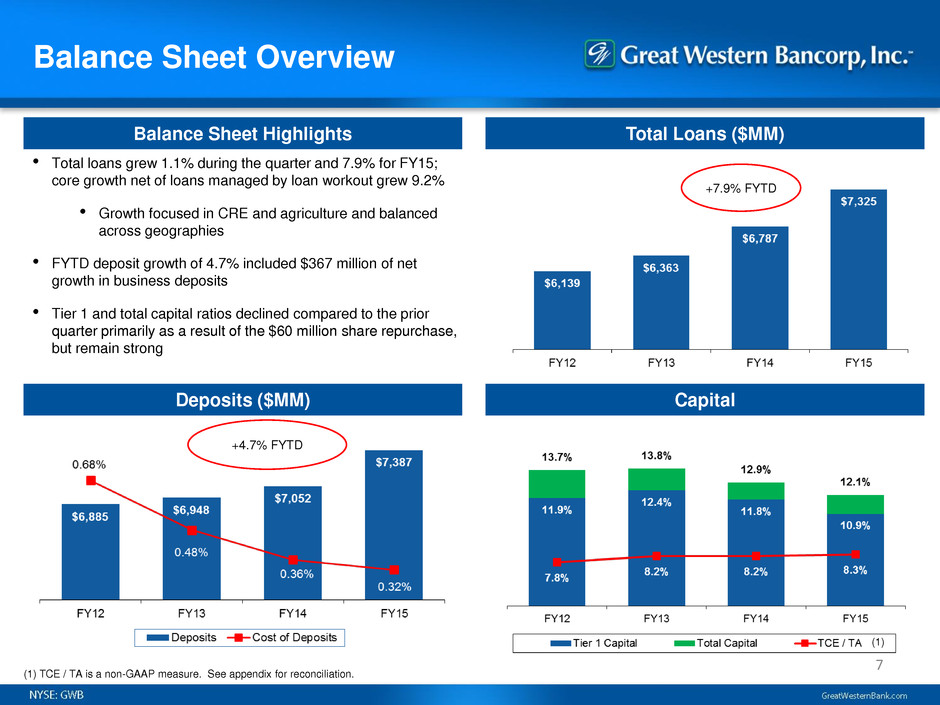
Balance Sheet Overview 7 Balance Sheet Highlights Total Loans ($MM) Deposits ($MM) Capital • Total loans grew 1.1% during the quarter and 7.9% for FY15; core growth net of loans managed by loan workout grew 9.2% • Growth focused in CRE and agriculture and balanced across geographies • FYTD deposit growth of 4.7% included $367 million of net growth in business deposits • Tier 1 and total capital ratios declined compared to the prior quarter primarily as a result of the $60 million share repurchase, but remain strong +7.9% FYTD +4.7% FYTD (1) TCE / TA is a non-GAAP measure. See appendix for reconciliation. (1)

Asset Quality 8 Highlights Net Charge-offs Reserves / NALs Strong Credit Quality • Net charge-offs were $0.4 million for the quarter (0.02% of loans annualized), bringing FY15 net charge-offs / average loans to 0.13%, lower than 0.14% in FY14 • Loans on “watch” status decreased to $310.4 million, a decrease of 4% compared to June 30, 2015, and down from a peak of $384.4 million at March 31, 2015 • Ratio of ALLL / total loans was 0.78% at September 30, 2015 compared to 0.77% at June 30, 2015 and 0.70% at September 30, 2014 • Grain crop conditions across the core footprint appear favorable

Proven Business Strategy 9 Focused Business Banking Franchise with Agribusiness Expertise Risk Management Driving Strong Credit Quality Attract and Retain High-Quality Relationship Bankers Prioritize Organic Growth While Optimizing Footprint Deepen Customer Relationships Strong Profitability and Growth Driven by a Highly Efficient Operating Model Strong Capital Generation and Attractive Dividend

Appendix

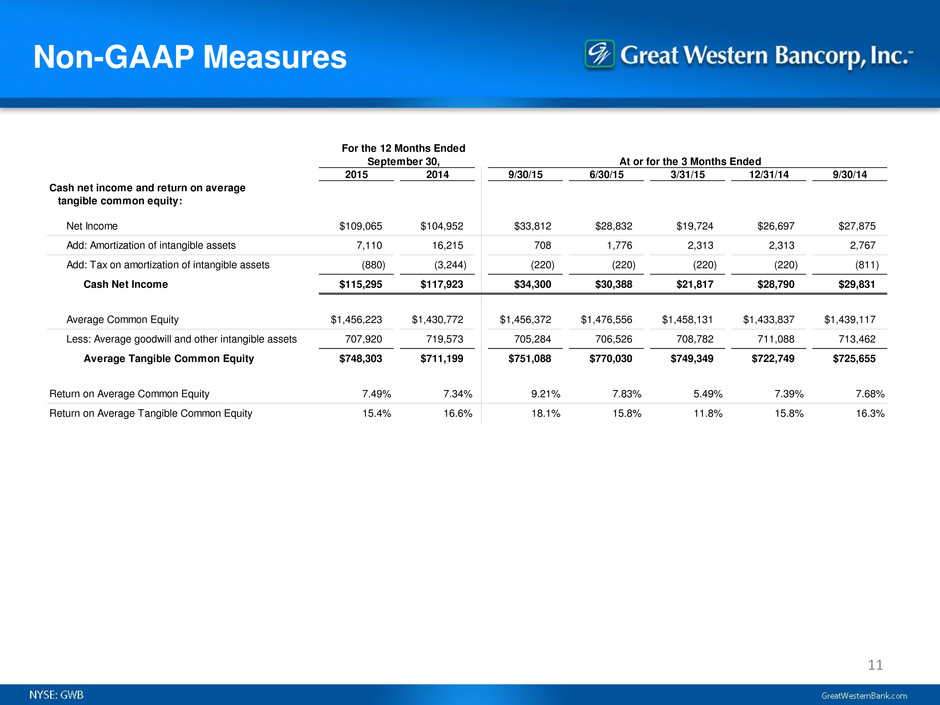
Non-GAAP Measures 11 For the 12 Months Ended September 30, At or for the 3 Months Ended 2015 2014 9/30/15 6/30/15 3/31/15 12/31/14 9/30/14 Cash net income and return on average tangible common equity: Net Income $109,065 $104,952 $33,812 $28,832 $19,724 $26,697 $27,875 Add: Amortization of intangible assets 7,110 16,215 708 1,776 2,313 2,313 2,767 Add: Tax on amortization of intangible assets (880) (3,244) (220) (220) (220) (220) (811) Cash Net Income $115,295 $117,923 $34,300 $30,388 $21,817 $28,790 $29,831 Average Common Equity $1,456,223 $1,430,772 $1,456,372 $1,476,556 $1,458,131 $1,433,837 $1,439,117 Less: Average goodwill and other intangible assets 707,920 719,573 705,284 706,526 708,782 711,088 713,462 Average Tangible Common Equity $748,303 $711,199 $751,088 $770,030 $749,349 $722,749 $725,655 Return on Average Common Equity 7.49% 7.34% 9.21% 7.83% 5.49% 7.39% 7.68% Return on Average Tangible Common Equity 15.4% 16.6% 18.1% 15.8% 11.8% 15.8% 16.3%

Non-GAAP Measures 12 For the 12 Months Ended September 30, At or for the 3 Months Ended 2015 2014 9/30/15 6/30/15 3/31/15 12/31/14 9/30/14 Adjusted net interest income and adjusted net interest margin (fully-tax equivalent basis): Net Interest Income $333,497 $320,424 $85,425 $84,538 $80,625 $82,909 $83,226 Add: Tax equivalent adjustment 6,576 4,663 1,778 1,704 1,590 1,504 1,324 Net Interest Income (FTE) $340,073 $325,087 $87,203 $86,242 $82,215 $84,413 $84,550 Add: Current realized derivative gain (loss) (21,642) (18,255) (5,637) (5,416) (5,307) (5,282) (4,978) Adjusted Net Interest Income (FTE) $318,431 $306,832 $81,566 $80,826 $76,908 $79,131 $79,572 Average Interest-Earning Assets $8,641,719 $8,093,861 $8,693,471 $8,756,244 $8,560,477 $8,556,688 $8,181,194 Net Interest Margin (FTE) 3.94% 4.02% 3.98% 3.95% 3.89% 3.91% 4.10% Adjusted Net Interest Margin (FTE) 3.68% 3.79% 3.72% 3.70% 3.64% 3.67% 3.86% Adjusted net interest income and adjusted yield (fully-tax equivalent basis), on loans other than loans acquired with deteriorated credit quality: Interest Income $329,618 $318,775 $84,835 $83,094 $80,317 $81,372 $82,968 Add: Tax equivalent adjustment 6,576 4,663 1,778 1,704 1,590 1,504 1,324 Interest Income (FTE) $336,194 $323,438 $86,613 $84,798 $81,907 $82,876 $84,292 Add: Current realized derivative gain (loss) (21,642) (18,255) (5,637) (5,416) (5,307) (5,282) (4,978) Adjusted Interest Income (FTE) $314,552 $305,183 $80,976 $79,382 $76,600 $77,594 $79,314 Average loans other than loans acquired with deteriorated credit quality $6,889,738 $6,311,857 $7,108,598 $6,995,340 $6,828,510 $6,626,507 $6,527,721 Yield (FTE) 4.88% 5.12% 4.83% 4.86% 4.86% 4.96% 5.12% Adjusted Yield (FTE) 4.57% 4.84% 4.52% 4.55% 4.55% 4.65% 4.82%

Non-GAAP Measures 13 For the 12 Months Ended September 30, At or for the 3 Months Ended 2015 2014 9/30/15 6/30/15 3/31/15 12/31/15 9/30/14 Efficiency Ratio: Total Revenue $367,387 $360,205 $94,474 $94,543 $87,561 $90,809 $91,727 Add: Tax equivalent adjustment 6,576 4,663 1,778 1,704 1,590 1,504 1,324 Total Revenue (FTE) $373,963 $364,868 $96,252 $96,247 $89,151 $92,313 $93,051 Noninterest Expense $186,794 $200,222 $44,835 $46,430 $48,438 $47,091 $48,318 Less: Amortization of intangible assets 7,110 16,215 708 1,776 2,313 2,313 2,767 Tangible Noninterest Expense $179,684 $184,007 $44,127 $44,654 $46,125 $44,778 $45,551 Efficiency Ratio 48.0% 50.4% 45.8% 46.4% 51.7% 48.5% 49.0% Tangible common equity and tangible common equity to assets: Total Stockholders' Equity $1,459,346 $1,421,090 $1,459,346 $1,487,851 $1,469,552 $1,451,370 $1,421,090 Less: Goodwill and other intangible assets 704,926 712,036 704,926 705,634 707,410 709,723 712,036 Tangible Common Equity $754,420 $709,054 $754,420 $782,217 $762,142 $741,647 $709,054 Total Assets $9,798,654 $9,371,429 $9,798,654 $9,764,159 $9,781,645 $9,641,261 $9,371,429 Less: Goodwill and other intangible assets 704,926 712,036 704,926 705,634 707,410 709,723 712,036 Tangible Assets $9,093,728 $8,659,393 $9,093,728 $9,058,525 $9,074,235 $8,931,538 $8,659,393 Tangible Common Equity to Tangible Assets 8.3% 8.2% 8.3% 8.6% 8.4% 8.3% 8.2%
