Attached files
| file | filename |
|---|---|
| 8-K - CLEARWATER PAPER CORPORATION 8-K - Clearwater Paper Corp | a51212282.htm |
| EX-99.1 - EXHIBIT 99.1 - Clearwater Paper Corp | a51212282ex99_1.htm |
Exhibit 99.2
CLEARWATER PAPER
CORPORATION THIRD QUARTER 2015 SUPPLEMENTAL INFORMATION LINDA MASSMAN
PRESIDENT, CHIEF EXECUTIVE OFFICER AND DIRECTOR JOHN HERTZ SENIOR VICE
PRESIDENT FINANCE AND CHIEF FINANCIAL OFFICERPRESIDENT, CHIEF EXECUTIVE
OFFICER AND DIRECTOR JOHN HERTZ SENIOR VICE PRESIDENT FINANCE AND CHIEF
FINANCIAL OFFICER
FORWARD-LOOKING STATEMENTS
This supplemental information contains, in addition to historical
information, certain forward-looking statements within the meaning of
the Private Securities Litigation Reform Act of 1995, including
statements regarding, the effects of new Consumer Products business;
U.S. and global paperboard industry conditions; segment, corporate and
consolidated outlook for Q4 2015 and fiscal year 2015; production;
product volumes shipped; product pricing and sales mix; pulp and wood
fiber costs and supply; chemical costs; operational and packaging supply
costs; transportation costs; energy costs; cost and timing of major
maintenance and repairs; cost of wages and benefits; selling, general,
and administrative expenses; corporate expenses; consolidated sales and
operating margins; EBITDA sensitivities; and estimated Q4 2015 adjusted
EBITDA. These forward-looking statements are based on management’s
current expectations, estimates, assumptions and projections that are
subject to change. Our actual results of operations may differ
materially from those expressed or implied by the forward-looking
statements contained in this presentation. Important factors that could
cause or contribute to such differences include the risks and
uncertainties described from time to time in the company's public
filings with the Securities and Exchange Commission, as well as the
following: • competitive pricing pressures for our products, including
as a result of increased capacity as additional manufacturing facilities
are operated by our competitors; • customer acceptance, timing and
quantity of purchases of our new through-air-dried, or TAD products, or
other tissue products; • changes in the U.S. and international economies
and in general economic conditions in the regions and industries in
which we operate; • the loss of or changes in prices in regards to a
significant customer; • announced price increases for our products may
not be accepted in whole or part; • changes in transportation costs and
disruptions in transportation services; • manufacturing or operating
disruptions, including IT system and IT system implementation failures,
equipment malfunction and damage to our manufacturing facilities caused
by fire or weather-related events; • changes in the cost and
availability of wood fiber and wood pulp; • labor disruptions; • changes
in costs for and availability of packaging supplies, chemicals, energy
and maintenance and repairs; • cyclical industry conditions; • changes
in customer product preferences and competitors' product offerings; •
changes in expenses and required contributions associated with our
pension plans; • reliance on a limited number of third-party suppliers
for raw materials; • environmental liabilities or expenditures; •
inability to successfully implement our operational efficiencies and
expansion strategies; • inability to fund our debt obligations; •
restrictions on our business from debt covenants and terms; and •
changes in laws, regulations or industry standards affecting our
business. Forward-looking statements contained in this presentation
present management’s views only as of the date of this presentation. We
undertake no obligation to publicly update forward-looking statements,
whether as a result of new information, future events or otherwise. 1
THIRD QUARTER FINANCIAL
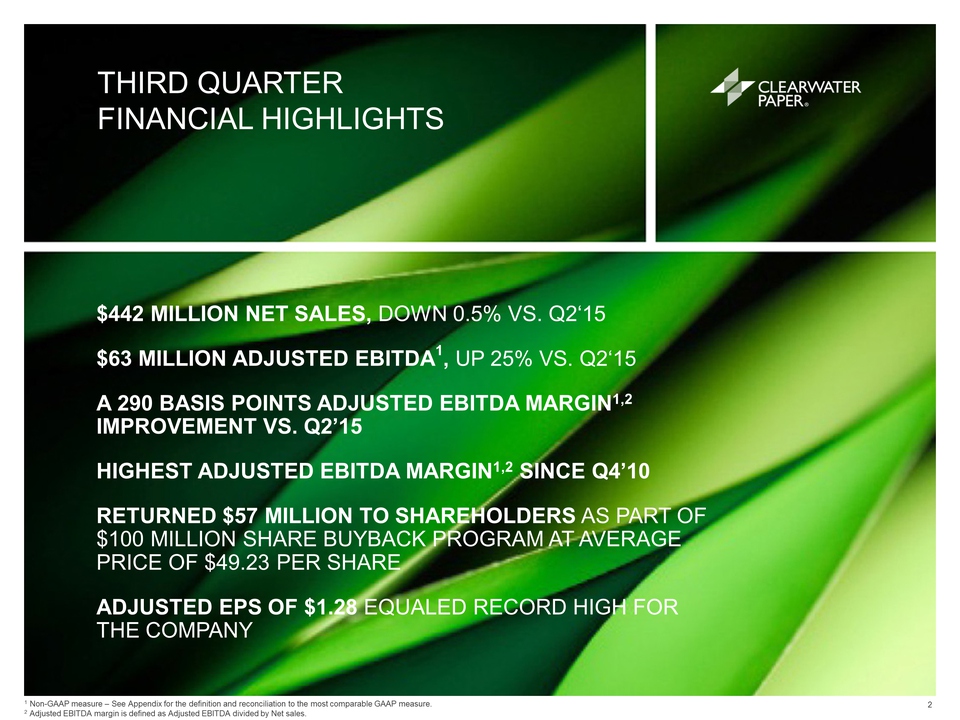
HIGHLIGHTS $442 MILLION NET SALES, DOWN 0.5% VS. Q2‘15 $63 MILLION
ADJUSTED EBITDA1, UP 25% VS. Q2‘15 A 290 BASIS POINTS ADJUSTED EBITDA
MARGIN1,2 IMPROVEMENT VS. Q2’15 HIGHEST ADJUSTED EBITDA MARGIN1,2 SINCE
Q4’10 RETURNED $57 MILLION TO SHAREHOLDERS AS PART OF $100 MILLION SHARE
BUYBACK PROGRAM AT AVERAGE PRICE OF $49.23 PER SHARE ADJUSTED EPS OF
$1.28 EQUALED RECORD HIGH FOR THE COMPANY 1 Non-GAAP measure – See
Appendix for the definition and reconciliation to the most comparable
GAAP measure. 2 2 Adjusted EBITDA margin is defined as Adjusted EBITDA
divided
FINANCIAL SUMMARY
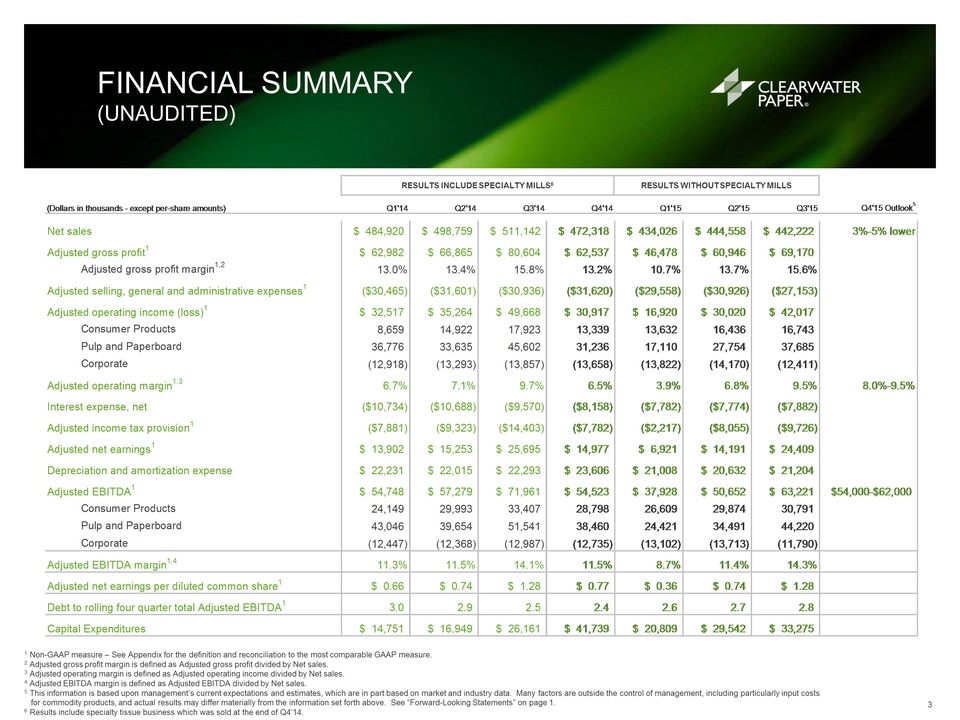
(UNAUDITED) 1 Non-GAAP measure – See Appendix for the definition and
reconciliation to the most comparable GAAP measure. 2 Adjusted gross
profit margin is defined as Adjusted gross profit divided by Net sales.
3 Adjusted operating margin is defined as Adjusted operating income
divided by Net sales. 4 Adjusted EBITDA margin is defined as Adjusted
EBITDA divided by Net sales. 5 This information is based upon
management’s current expectations and estimates, which are in part based
on market and industry data. Many factors are outside the control of
management, including particularly input costs for commodity products,
and actual results may differ materially from the information set forth
above. See “Forward-Looking Statements” on page 1. 6 Results include
specialty tissue business which was sold at the end of Q4’14. 3 RESULTS
INCLUDE SPECIALTY MILLS6 RESULTS WITHOUT SPECIALTY MILLS Q1'14 Q2'14
Q3'14 Q4'14 Q1'15 Q2'15 Q3'15 Q4'15 Outlook5 $ 484,920 $ 498,759 $
511,142 $ 472,318 $ 434,026 $ 444,558 $ 442,222 3%-5% lower $ 62,982 $
66,865 $ 80,604 $ 62,537 $ 46,478 $ 60,946 $ 69,170 Adjusted gross
profit margin1,2 13.0% 13.4% 15.8% 13.2% 10.7% 13.7% 15.6% ($30,465)
($31,601) ($30,936) ($31,620) ($29,558) ($30,926) ($27,153) $ 32,517 $
35,264 $ 49,668 $ 30,917 $ 16,920 $ 30,020 $ 42,017 Consumer Products
8,659 14,922 17,923 13,339 13,632 16,436 16,743 Pulp and Paperboard
36,776 33,635 45,602 31,236 17,110 27,754 37,685 Corporate (12,918)
(13,293) (13,857) (13,658) (13,822) (14,170) (12,411) 6.7% 7.1% 9.7%
6.5% 3.9% 6.8% 9.5% 8.0%-9.5% ($10,734) ($10,688) ($9,570) ($8,158)
($7,782) ($7,774) ($7,882) ($7,881) ($9,323) ($14,403) ($7,782) ($2,217)
($8,055) ($9,726) $ 13,902 $ 15,253 $ 25,695 $ 14,977 $ 6,921 $ 14,191 $
24,409 $ 22,231 $ 22,015 $ 22,293 $ 23,606 $ 21,008 $ 20,632 $ 21,204 $
54,748 $ 57,279 $ 71,961 $ 54,523 $ 37,928 $ 50,652 $ 63,221
$54,000-$62,000 Consumer Products 24,149 29,993 33,407 28,798 26,609
29,874 30,791 Pulp and Paperboard 43,046 39,654 51,541 38,460 24,421
34,491 44,220 Corporate (12,447) (12,368) (12,987) (12,735) (13,102)
(13,713) (11,790) 11.3% 11.5% 14.1% 11.5% 8.7% 11.4% 14.3% $ 0.66 $ 0.74
$ 1.28 $ 0.77 $ 0.36 $ 0.74 $ 1.28 3.0 2.9 2.5 2.4 2.6 2.7 2.8 $ 14,751
$ 16,949 $ 26,161 $ 41,739 $ 20,809 $ 29,542 $ 33,275 Depreciation and
amortization expense Adjusted EBITDA1 Adjusted EBITDA margin1,4 Adjusted
net earnings per diluted common share1 Debt to rolling four quarter
total Adjusted EBITDA1 Capital Expenditures Adjusted operating income
(loss)1 Adjusted operating margin1,3 Interest expense, net Adjusted
income tax provision1 Adjusted net earnings1 (Dollars in thousands -
except per-share amounts) Net sales Adjusted gross profit1 Adjusted
selling, general and administrative expenses1
THIRD QUARTER BUSINESS
SUMMARY CONSUMER PRODUCTS • Secured new business to cover volume lost in
Q1’15 due to merger related distractions at a top customer • New
business ramped up faster than expected in Q3’15, leading to temporary
increase in transportation costs • Volume mix of new business is
improving profitability PAPERBOARD • Strong U.S. dollar is attracting
European manufacturers and pressuring U.S. exports • Industry backlogs
remained below seasonal averages, impacting demand and pricing in
commodity grades • Production remained strong after successful
completion of major maintenance outages in Q1’15 and Q2’15 1 Non-GAAP
measure – See Appendix for the definition and reconciliation to the most
comparable GAAP measure. 4 2 Adjusted EBITDA margin is defined as
Adjusted EBITDA divided by Net sales.
Q3’15 VS. Q2’15
CONSOLIDATED ADJUSTED EBITDA1 BRIDGE 1 Non-GAAP measure – See Appendix
for the definition and reconciliation to the most comparable GAAP
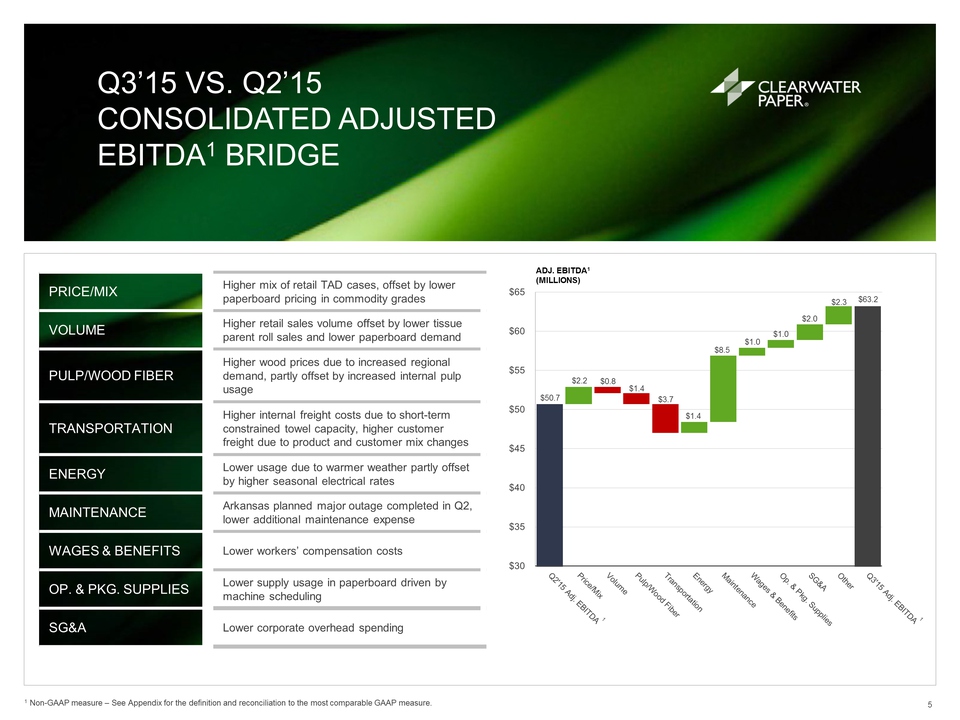
measure. 5 $50.7 $2.2 $0.8 $1.4 $3.7 $1.4 $8.5 $1.0 $1.0 $2.0 $2.3 $63.2
$30 $35 $40 $45 $50 $55 $60 $65 ADJ. EBITDA1 (MILLIONS) PRICE/MIX Higher
mix of retail TAD cases, offset by lower paperboard pricing in commodity
grades VOLUME Higher retail sales volume offset by lower tissue parent
roll sales and lower paperboard demand PULP/WOOD FIBER Higher wood
prices due to increased regional demand, partly offset by increased
internal pulp usage TRANSPORTATION Higher internal freight costs due to
short-term constrained towel capacity, higher customer freight due to
product and customer mix changes ENERGY Lower usage due to warmer
weather partly offset by higher seasonal electrical rates MAINTENANCE
Arkansas planned major outage completed in Q2, lower additional
maintenance expense WAGES & BENEFITS Lower workers’ compensation costs
OP. & PKG. SUPPLIES Lower supply usage in paperboard driven by machine
scheduling SG&A Lower corporate overhead spending
Q3’15 VS. Q3’14
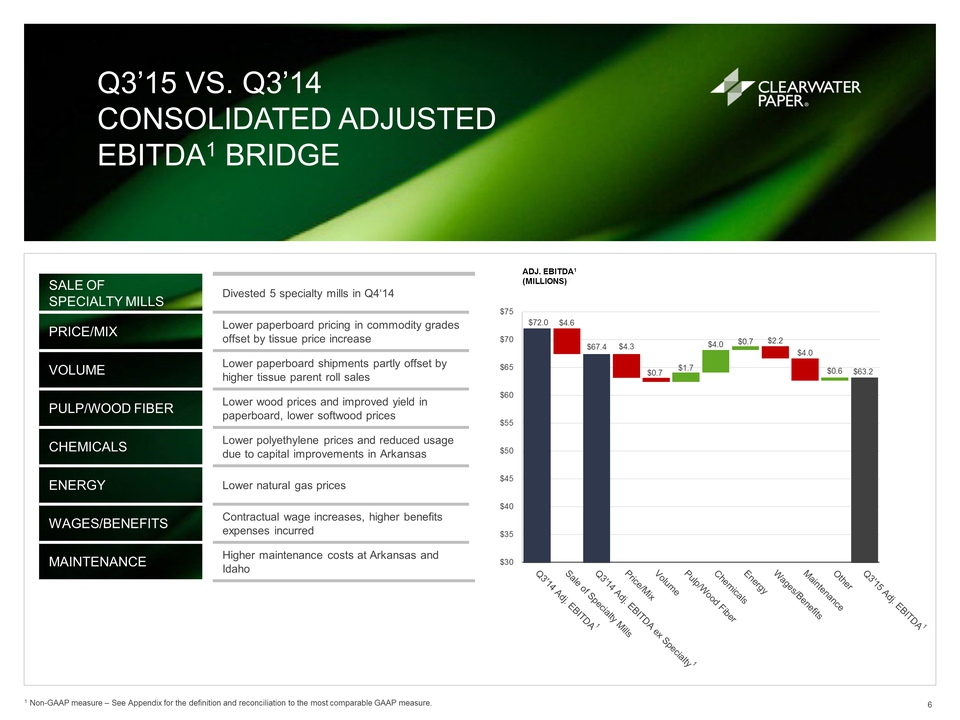
CONSOLIDATED ADJUSTED EBITDA1 BRIDGE 1 Non-GAAP measure – See Appendix
for the definition and reconciliation to the most comparable GAAP
measure. 6 SALE OF SPECIALTY MILLS Divested 5 specialty mills in Q4‘14
PRICE/MIX Lower paperboard pricing in commodity grades offset by tissue
price increase VOLUME Lower paperboard shipments partly offset by higher
tissue parent roll sales PULP/WOOD FIBER Lower wood prices and improved
yield in paperboard, lower softwood prices CHEMICALS Lower polyethylene
prices and reduced usage due to capital improvements in Arkansas ENERGY
Lower natural gas prices WAGES/BENEFITS Contractual wage increases,
higher benefits expenses incurred MAINTENANCE Higher maintenance costs
at Arkansas and Idaho $72.0 $4.6 $67.4 $4.3 $0.7 $1.7 $4.0 $0.7 $2.2
$4.0 $0.6 $63.2 $30 $35 $40 $45 $50 $55 $60 $65 $70 $75 ADJ. EBITDA1
(MILLIONS)
KEY SEGMENT RESULTS –
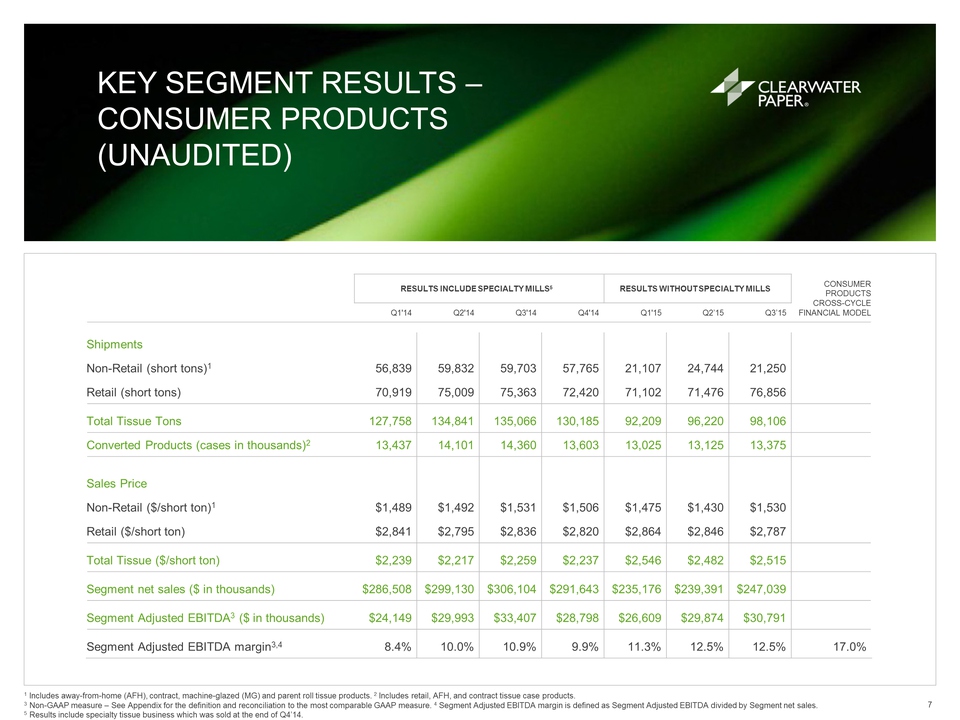
CONSUMER PRODUCTS (UNAUDITED) 7 1 Includes away-from-home (AFH),
contract, machine-glazed (MG) and parent roll tissue products. 2
Includes retail, AFH, and contract tissue case products. 3 Non-GAAP
measure – See Appendix for the definition and reconciliation to the most
comparable GAAP measure. 4 Segment Adjusted EBITDA margin is defined as
Segment Adjusted EBITDA divided by Segment net sales. 5 Results include
specialty tissue business which was sold at the end of Q4’14. CONSUMER
PRODUCTS CROSS-CYCLE FINANCIAL MODEL RESULTS INCLUDE SPECIALTY MILLS5
RESULTS WITHOUT SPECIALTY MILLS Q1'14 Q2'14 Q3'14 Q4'14 Q1'15 Q2’15
Q3’15 Shipments Non-Retail (short tons)1 56,839 59,832 59,703 57,765
21,107 24,744 21,250 Retail (short tons) 70,919 75,009 75,363 72,420
71,102 71,476 76,856 Total Tissue Tons 127,758 134,841 135,066 130,185
92,209 96,220 98,106 Converted Products (cases in thousands)2 13,437
14,101 14,360 13,603 13,025 13,125 13,375 Sales Price Non-Retail
($/short ton)1 $1,489 $1,492 $1,531 $1,506 $1,475 $1,430 $1,530 Retail
($/short ton) $2,841 $2,795 $2,836 $2,820 $2,864 $2,846 $2,787 Total
Tissue ($/short ton) $2,239 $2,217 $2,259 $2,237 $2,546 $2,482 $2,515
Segment net sales ($ in thousands) $286,508 $299,130 $306,104 $291,643
$235,176 $239,391 $247,039 Segment Adjusted EBITDA3 ($ in thousands)
$24,149 $29,993 $33,407 $28,798 $26,609 $29,874 $30,791 Segment Adjusted
EBITDA margin3,4 8.4% 10.0% 10.9% 9.9% 11.3% 12.5% 12.5% 17.0%
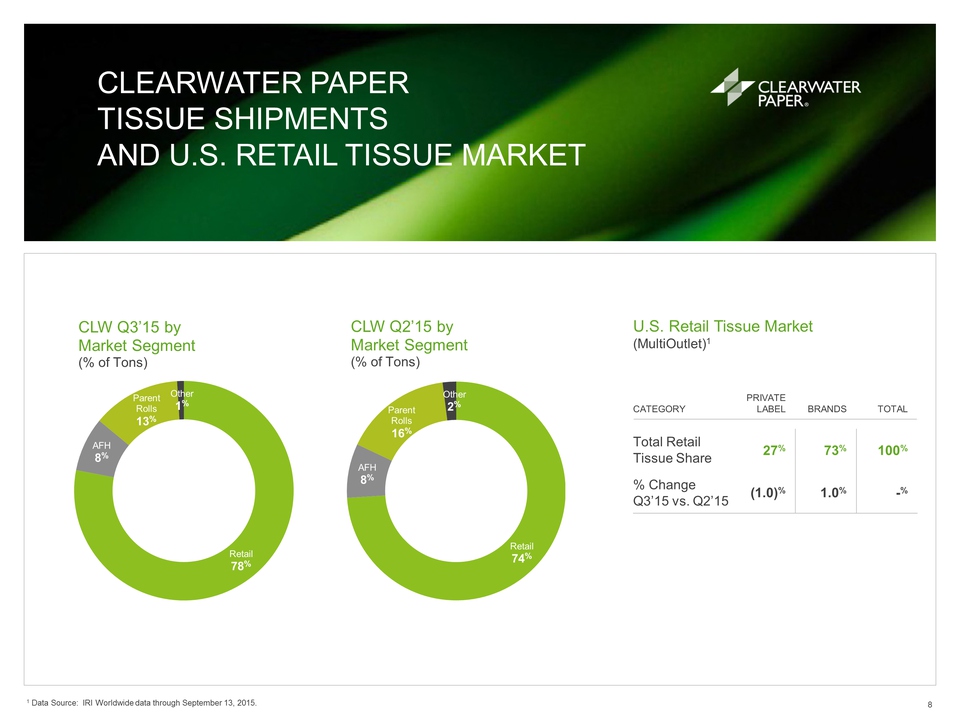
8% Parent Rolls 16% Other
2% CLW Q2’15 by Market Segment (% of Tons) CLEARWATER PAPER TISSUE
SHIPMENTS AND U.S. RETAIL TISSUE MARKET 8 Retail 78% AFH 8% Parent Rolls
13% Other 1% CLW Q3’15 by Market Segment (% of Tons) U.S. Retail Tissue
Market (MultiOutlet)1 CATEGORY PRIVATE LABEL BRANDS TOTAL Total Retail
Tissue Share 27% 73% 100% % Change Q3’15 vs. Q2’15 (1.0)% 1.0% -% 1 Data
Source: IRI Worldwide data through September 13, 2015.
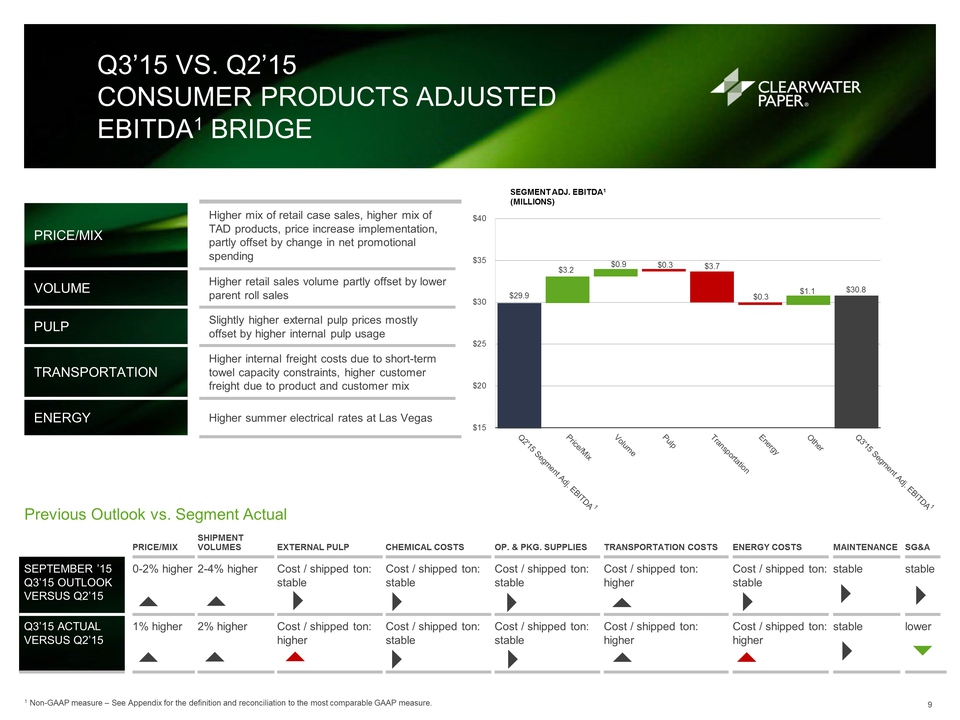
Retail 74% AFHPRICE/MIX
SHIPMENT VOLUMES EXTERNAL PULP CHEMICAL COSTS OP. & PKG. SUPPLIES
TRANSPORTATION COSTS ENERGY COSTS MAINTENANCE SG&A SEPTEMBER ’15 Q3’15
OUTLOOK VERSUS Q2’15 0-2% higher 2-4% higher Cost / shipped ton: stable
Cost / shipped ton: stable Cost / shipped ton: stable Cost / shipped
ton: higher Cost / shipped ton: stable stable stable Q3’15 ACTUAL VERSUS
Q2’15 1% higher 2% higher Cost / shipped ton: higher Cost / shipped ton:
stable Cost / shipped ton: stable Cost / shipped ton: higher Cost /
shipped ton: higher stable lower PRICE/MIX Higher mix of retail case
sales, higher mix of TAD products, price increase implementation, partly
offset by change in net promotional spending VOLUME Higher retail sales
volume partly offset by lower parent roll sales PULP Slightly higher
external pulp prices mostly offset by higher internal pulp usage
TRANSPORTATION Higher internal freight costs due to short-term towel
capacity constraints, higher customer freight due to product and
customer mix ENERGY Higher summer electrical rates at Las Vegas Q3’15
VS. Q2’15 CONSUMER PRODUCTS ADJUSTED EBITDA1 BRIDGE 1 Non-GAAP measure –
See Appendix for the definition and reconciliation to the most
comparable GAAP measure. 9 Previous Outlook vs. Segment Actual $29.9
$3.2 $0.9 $0.3 $3.7 $0.3 $1.1 $30.8 $15 $20 $25 $30 $35 $40 SEGMENT ADJ.
EBITDA1 (MILLIONS)
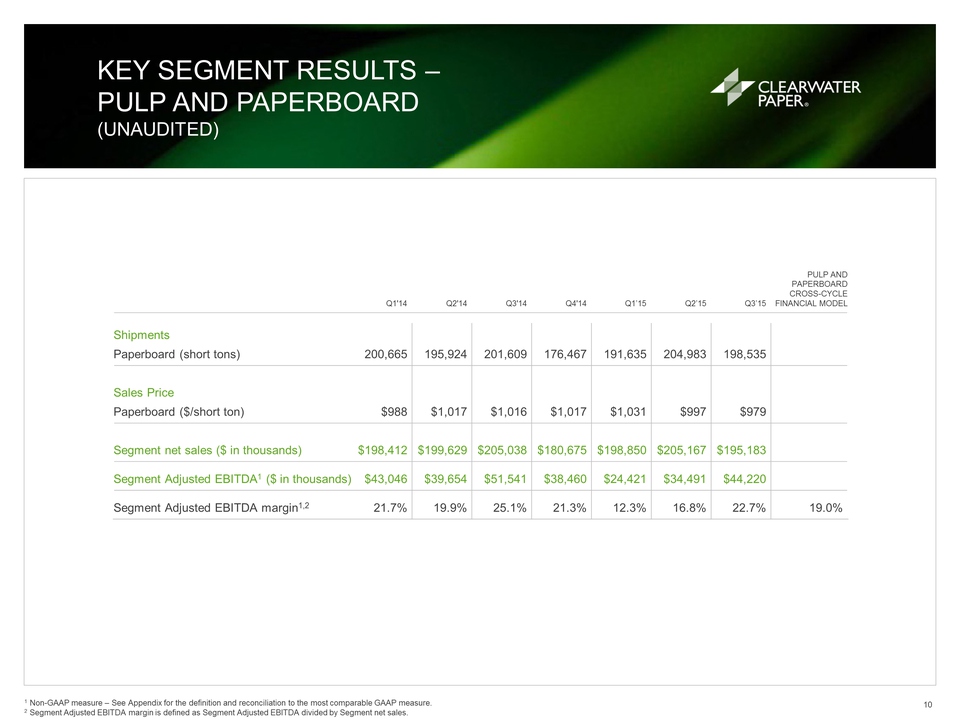
KEY SEGMENT RESULTS – PULP
AND PAPERBOARD (UNAUDITED) 1 Non-GAAP measure – See Appendix for the
definition and reconciliation to the most comparable GAAP measure. 10 2
Segment Adjusted EBITDA margin is defined as Segment Adjusted EBITDA
divided by Segment net sales. PULP AND PAPERBOARD CROSS-CYCLE Q1'14
Q2'14 Q3'14 Q4'14 Q1’15 Q2’15 Q3’15 FINANCIAL MODEL Shipments Paperboard
(short tons) 200,665 195,924 201,609 176,467 191,635 204,983 198,535
Sales Price Paperboard ($/short ton) $988 $1,017 $1,016 $1,017 $1,031
$997 $979 Segment net sales ($ in thousands) $198,412 $199,629 $205,038
$180,675 $198,850 $205,167 $195,183 Segment Adjusted EBITDA1 ($ in
thousands) $43,046 $39,654 $51,541 $38,460 $24,421 $34,491 $44,220
Segment Adjusted EBITDA margin1,2 21.7
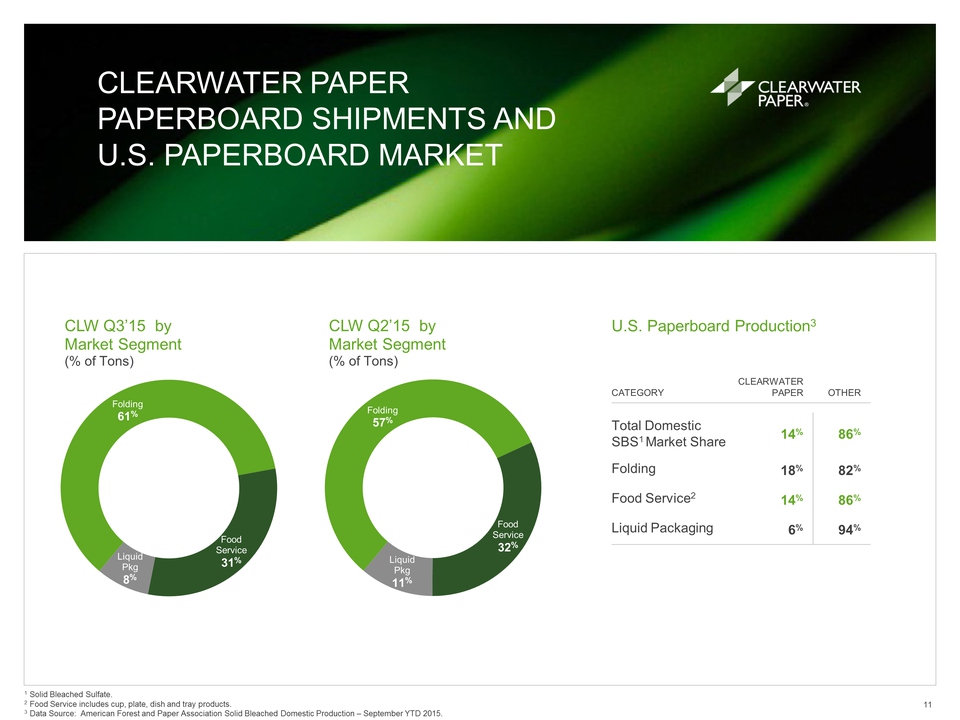
CLEARWATER PAPER PAPERBOARD
SHIPMENTS AND U.S. PAPERBOARD MARKET 11 U.S. Paperboard Production3
CATEGORY CLEARWATER PAPER OTHER Total Domestic SBS1 Market Share 14% 86%
Folding 18% 82% Food Service2 14% 86% Liquid Packaging 6% 94% Folding
57% Food Service 32% Liquid Pkg 11% CLW Q2’15 by Market Segment (% of
Tons) 1 Solid Bleached Sulfate. 2 Food Service includes cup, plate, dish
and tray products. 3 Data Source: American Forest and Paper Association
Solid Bleached Domestic Production – September YTD 2015. Folding 61%
Food Service Liquid 31% Pkg 8% CLW Q3’15 by Market Segment (% of Tons)
PRICE/MIX SHIPMENT VOLUMES
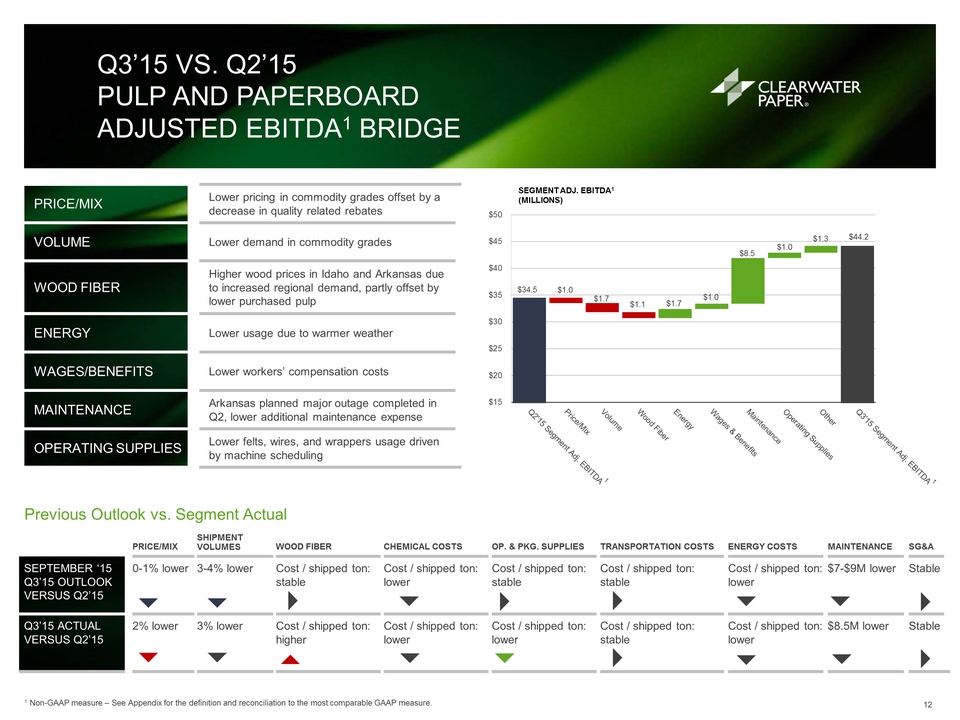
WOOD FIBER CHEMICAL COSTS OP. & PKG. SUPPLIES TRANSPORTATION COSTS
ENERGY COSTS MAINTENANCE SG&A SEPTEMBER ‘15 Q3’15 OUTLOOK VERSUS Q2’15
0-1% lower 3-4% lower Cost / shipped ton: stable Cost / shipped ton:
lower Cost / shipped ton: stable Cost / shipped ton: stable Cost /
shipped ton: lower $7-$9M lower Stable Q3’15 ACTUAL VERSUS Q2’15 2%
lower 3% lower Cost / shipped ton: higher Cost / shipped ton: lower Cost
/ shipped ton: lower Cost / shipped ton: stable Cost / shipped ton:
lower $8.5M lower Stable PRICE/MIX Lower pricing in commodity grades
offset by a decrease in quality related rebates VOLUME Lower demand in
commodity grades WOOD FIBER Higher wood prices in Idaho and Arkansas due
to increased regional demand, partly offset by lower purchased pulp
ENERGY Lower usage due to warmer weather WAGES/BENEFITS Lower workers’
compensation costs MAINTENANCE Arkansas planned major outage completed
in Q2, lower additional maintenance expense OPERATING SUPPLIES Lower
felts, wires, and wrappers usage driven by machine scheduling Q3’15 VS.
Q2’15 PULP AND PAPERBOARD ADJUSTED EBITDA1 BRIDGE 1 Non-GAAP measure –
See Appendix for the definition and reconciliation to the most
comparable GAAP measure. 12 Previous Outlook vs. Segment Actual $34.5
$1.0 $1.7 $1.1 $1.7 $1.0 $8.5 $1.0 $1.3 $44.2 $15 $20 $25 $30 $35 $40
$45 $50 SEGMENT ADJ. EBITDA1 (MILLIONS)
CLEARWATER PAPER
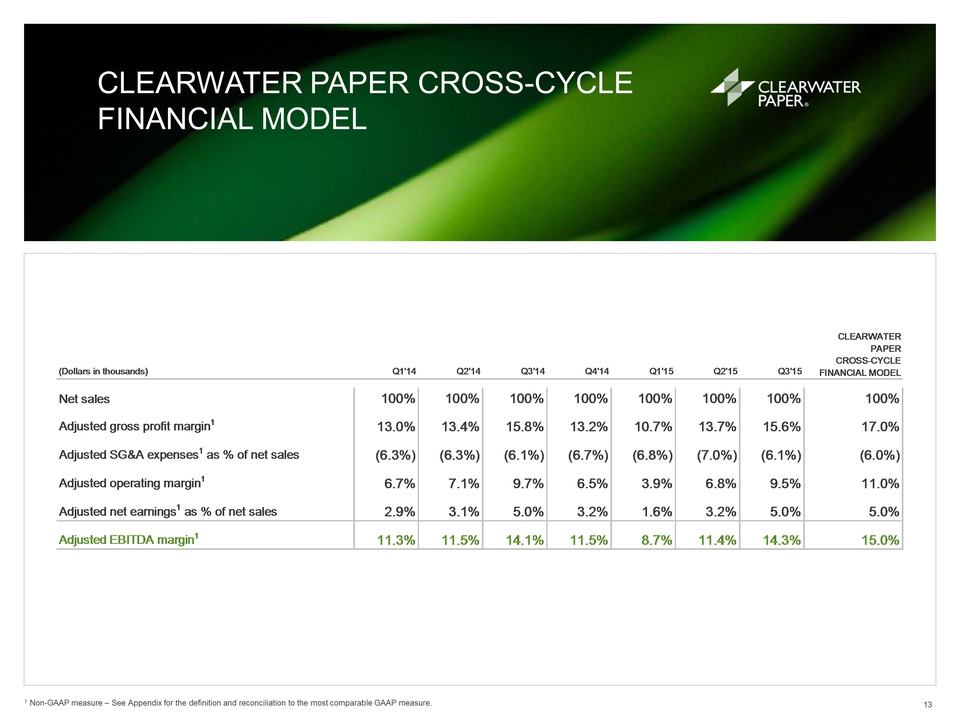
CROSS-CYCLE FINANCIAL MODEL 1 Non-GAAP measure – See Appendix for the
definition and reconciliation to the most comparable GAAP measure. 13
(Dollars in thousands) Q1'14 Q2'14 Q3'14 Q4'14 Q1'15 Q2'15 Q3'15 Net
sales 100% 100% 100% 100% 100% 100% 100% 100% Adjusted gross profit
margin1 13.0% 13.4% 15.8% 13.2% 10.7% 13.7% 15.6% 17.0% Adjusted SG&A
expenses1 as % of net sales (6.3%) (6.3%) (6.1%) (6.7%) (6.8%) (7.0%)
(6.1%) (6.0%) Adjusted operating margin1 6.7% 7.1% 9.7% 6.5% 3.9% 6.8%
9.5% 11.0% Adjusted net earnings1 as % of net sales 2.9% 3.1% 5.0% 3.2%
1.6% 3.2% 5.0% 5.0% Adjusted EBITDA margin1 11.3% 11.5% 14.1% 11.5% 8.7%
11.4% 14.3% 15.0% CLEARWATER PAPER CROSS-CYCLE FINANCIAL MODEL
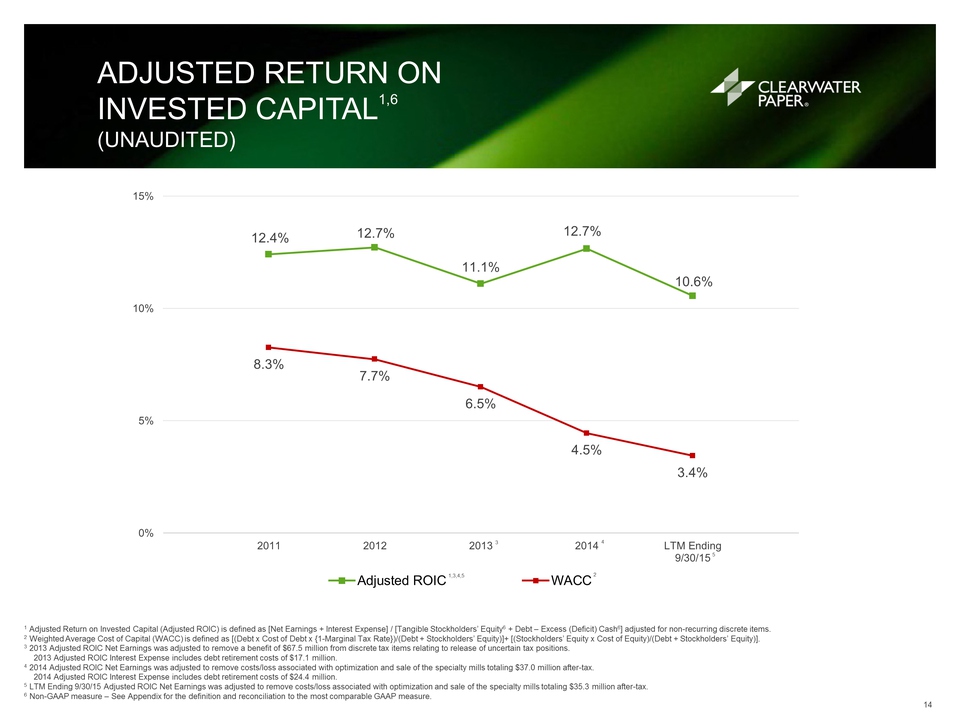
12.4% 12.7% 11.1% 12.7%
10.6% 8.3% 7.7% 6.5% 4.5% 3.4% 0% 5% 10% 15% 2011 2012 2013 2014 LTM
Ending 9/30/15 Adjusted ROIC1,3,4,5 WACC2 5 3 4 ADJUSTED RETURN ON
INVESTED CAPITAL1,6 (UNAUDITED) 14 1 Adjusted Return on Invested Capital
(Adjusted ROIC) is defined as [Net Earnings + Interest Expense] /
[Tangible Stockholders’ Equity6 + Debt – Excess (Deficit) Cash6]
adjusted for non-recurring discrete items. 2 Weighted Average Cost of
Capital (WACC) is defined as [(Debt x Cost of Debt x {1-Marginal Tax
Rate})/(Debt + Stockholders’ Equity)]+ [(Stockholders’ Equity x Cost of
Equity)/(Debt + Stockholders’ Equity)]. 3 2013 Adjusted ROIC Net
Earnings was adjusted to remove a benefit of $67.5 million from discrete
tax items relating to release of uncertain tax positions. 2013 Adjusted
ROIC Interest Expense includes debt retirement costs of $17.1 million. 4
2014 Adjusted ROIC Net Earnings was adjusted to remove costs/loss
associated with optimization and sale of the specialty mills totaling
$37.0 million after-tax. 2014 Adjusted ROIC Interest Expense includes
debt retirement costs of $24.4 million. 5 LTM Ending 9/30/15 Adjusted
ROIC Net Earnings was adjusted to remove costs/loss associated with
optimization and sale of the specialty mills totaling $35.3 million
after-tax. 6 Non-GAAP measure – See Appendix for the definition and
reconciliation to the most comparable GAAP measure.
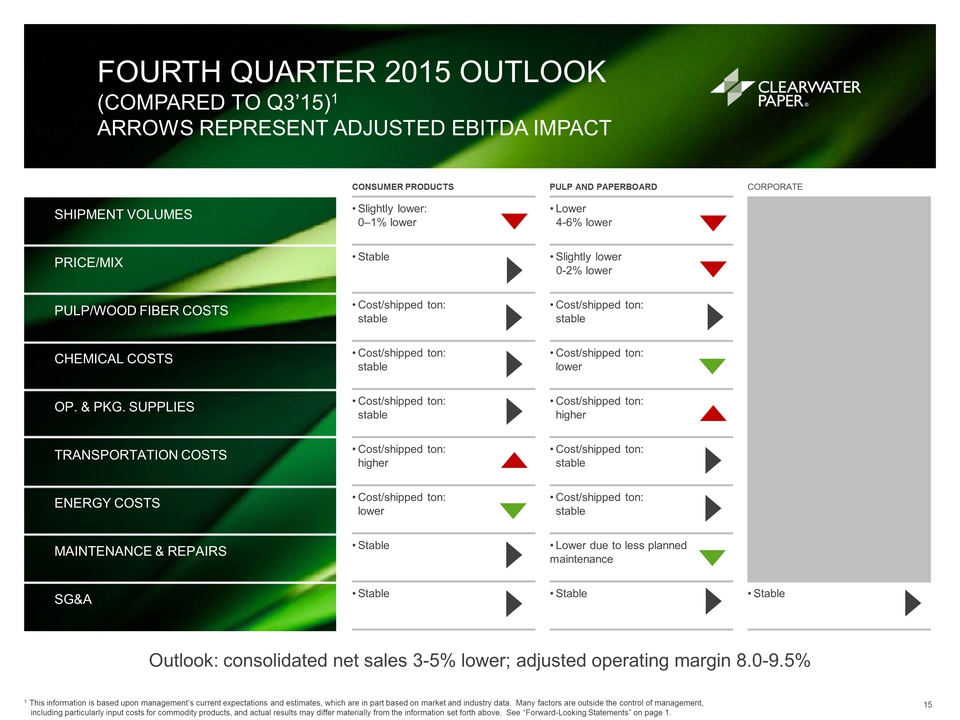
FOURTH QUARTER 2015 OUTLOOK
(COMPARED TO Q3’15)1 ARROWS REPRESENT ADJUSTED EBITDA IMPACT 15 CONSUMER
PRODUCTS PULP AND PAPERBOARD CORPORATE SHIPMENT VOLUMES • Slightly
lower: 0–1% lower • Lower 4-6% lower PRICE/MIX • Stable • Slightly lower
0-2% lower PULP/WOOD FIBER COSTS •Cost/shipped ton: stable •Cost/shipped
ton: stable CHEMICAL COSTS •Cost/shipped ton: stable •Cost/shipped ton:
lower OP. & PKG. SUPPLIES •Cost/shipped ton: stable •Cost/shipped ton:
higher TRANSPORTATION COSTS •Cost/shipped ton: higher •Cost/shipped ton:
stable ENERGY COSTS •Cost/shipped ton: lower •Cost/shipped ton: stable
MAINTENANCE & REPAIRS • Stable • Lower due to less planned maintenance
SG&A • Stable • Stable • Stable Outlook: consolidated net sales 3-5%
lower; adjusted operating margin 8.0-9.5% 1 This information is based
upon management’s current expectations and estimates, which are in part
based on market and industry data. Many factors are outside the control
of management, including particularly input costs for commodity
products, and actual results may differ materially from the information
set forth above. See “Forward-Looking Statements” on page 1.
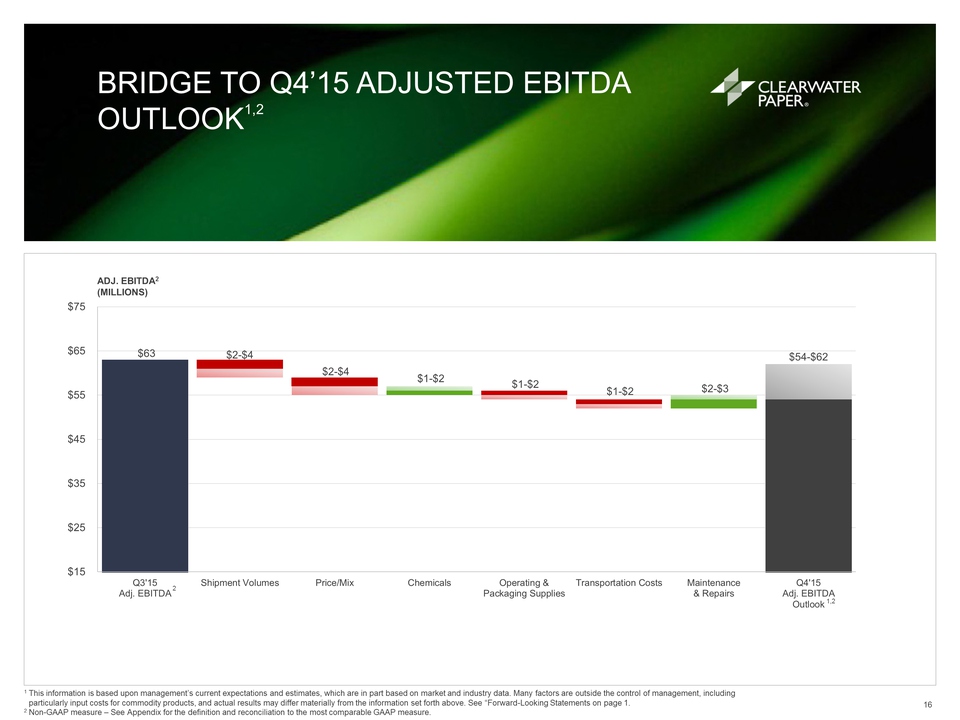
BRIDGE TO Q4’15 ADJUSTED
EBITDA OUTLOOK1,2 16 1 This information is based upon management’s
current expectations and estimates, which are in part based on market
and industry data. Many factors are outside the control of management,
including particularly input costs for commodity products, and actual
results may differ materially from the information set forth above. See
“Forward-Looking Statements on page 1. 2 Non-GAAP measure – See Appendix
for the definition and reconciliation to the most comparable GAAP
measure. $63 $2-$4 $2-$4 $1-$2 $1-$2 $1-$2 $2-$3 $54-$62 $15 $25 $35 $45
$55 $65 $75 Q3'15 Adj. EBITDA Shipment Volumes Price/Mix Chemicals
Operating & Packaging Supplies Transportation Costs Maintenance &
Repairs Q4'15 Adj. EBITDA Outlook ADJ. EBITDA2 (MILLIONS) 1,2 2
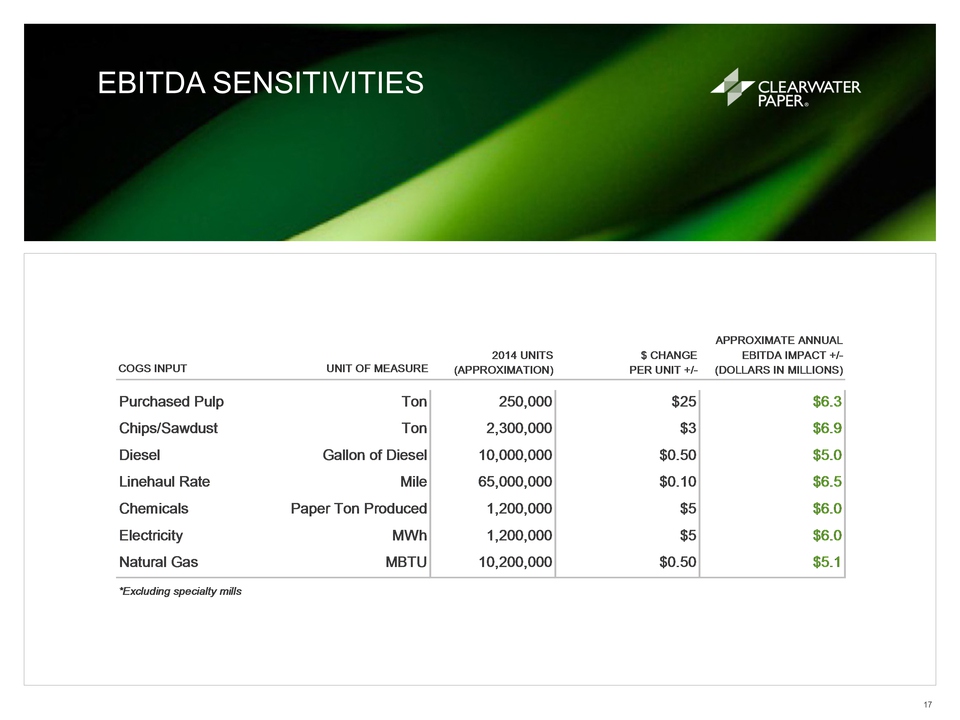
EBITDA SENSITIVITIES 17
COGS INPUT UNIT OF MEASURE Purchased Pulp Ton 250,000 $25 $6.3
Chips/Sawdust Ton 2,300,000 $3 $6.9 Diesel Gallon of Diesel 10,000,000
$0.50 $5.0 Linehaul Rate Mile 65,000,000 $0.10 $6.5 Chemicals Paper Ton
Produced 1,200,000 $5 $6.0 Electricity MWh 1,200,000 $5 $6.0 Natural Gas
MBTU 10,200,000 $0.50 $5.1 *Excluding specialty mills 2014 UNITS
(APPROXIMATION) $ CHANGE PER UNIT +/- APPROXIMATE ANNUAL EBITDA IMPACT
+/- (DOLLARS IN
APPENDIX 18 MILLIONS)
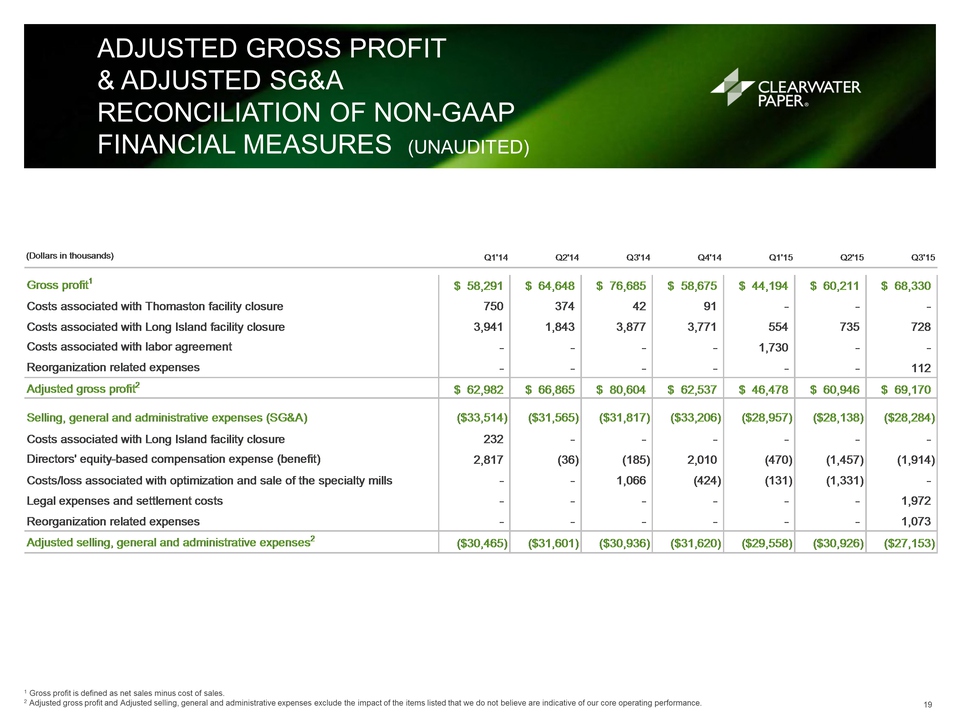
ADJUSTED GROSS PROFIT &
ADJUSTED SG&A RECONCILIATION OF NON-GAAP FINANCIAL MEASURES (UNAUDITED)
19 1 Gross profit is defined as net sales minus cost of sales. 2
Adjusted gross profit and Adjusted selling, general and administrative
expenses exclude the impact of the items listed that we do not believe
are indicative of our core operating performance. (Dollars in thousands)
Q1'14 Q2'14 Q3'14 Q4'14 Q1'15 Q2'15 Q3'15 Gross profit1 $ 58,291 $
64,648 $ 76,685 $ 58,675 $ 44,194 $ 60,211 $ 68,330 Costs associated
with Thomaston facility closure 7 50 374 4 2 91 - - - Costs associated
with Long Island facility closure 3 ,941 1,843 3,877 3,771 5 54 735 728
Costs associated with labor agreement - - - - 1,730 - - Reorganization
related expenses - - - - - - 112 Adjusted gross profit2 $ 62,982 $
66,865 $ 80,604 $ 62,537 $ 46,478 $ 60,946 $ 69,170 Selling, general and
administrative expenses (SG&A) ($33,514) ($31,565) ($31,817) ($33,206)
($28,957) ($28,138) ($28,284) Costs associated with Long Island facility
closure 2 32 - - - - - - Directors' equity-based compensation expense
(benefit) 2 ,817 ( 36) (185) 2,010 ( 470) (1,457) (1,914) Costs/loss
associated with optimization and sale of the specialty mills - - 1,066 (
424) (131) (1,331) - Legal expenses and settlement costs - - - - - -
1,972 Reorganization related expenses - - - - - - 1,073 Adjusted
selling, general and administrative expenses2 ($30,465) ($31,601)
($30,936) ($31,620) ($29,558) ($30,926) ($27,153)
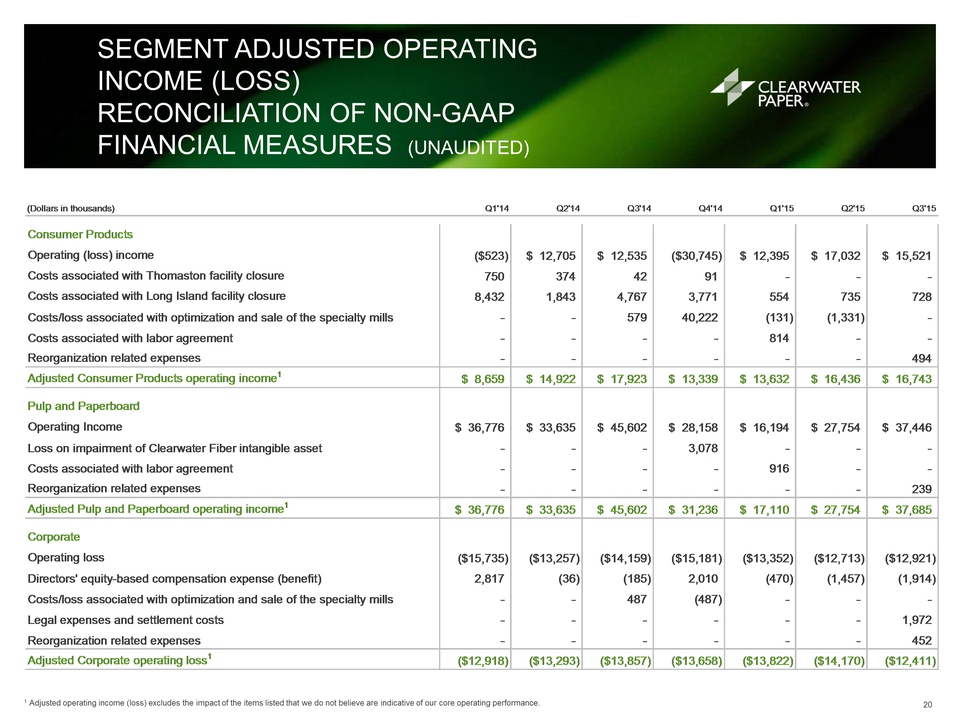
SEGMENT ADJUSTED OPERATING
INCOME (LOSS) RECONCILIATION OF NON-GAAP FINANCIAL MEASURES (UNAUDITED)
1 Adjusted operating income (loss) excludes the impact of the items
listed that we do not believe are indicative of our core operating
performance. 20 (Dollars in thousands) Q1'14 Q2'14 Q3'14 Q4'14 Q1'15
Q2'15 Q3'15 Consumer Products Operating (loss) income ($523) $ 12,705 $
12,535 ($30,745) $ 12,395 $ 17,032 $ 15,521 Costs associated with
Thomaston facility closure 7 50 374 4 2 91 - - - Costs associated with
Long Island facility closure 8 ,432 1,843 4,767 3,771 5 54 735 728
Costs/loss associated with optimization and sale of the specialty mills
- - 579 40,222 ( 131) (1,331) - Costs associated with labor agreement -
- - - 814 - - Reorganization related expenses - - - - - - 494 Adjusted
Consumer Products operating income1 $ 8,659 $ 14,922 $ 17,923 $ 13,339 $
13,632 $ 16,436 $ 16,743 Pulp and Paperboard Operating Income $ 36,776 $
33,635 $ 45,602 $ 28,158 $ 16,194 $ 27,754 $ 37,446 Loss on impairment
of Clearwater Fiber intangible asset - - - 3,078 - - - Costs associated
with labor agreement - - - - 916 - - Reorganization related expenses - -
- - - - 239 Adjusted Pulp and Paperboard operating income1 $ 36,776 $
33,635 $ 45,602 $ 31,236 $ 17,110 $ 27,754 $ 37,685 Corporate Operating
loss ($15,735) ($13,257) ($14,159) ($15,181) ($13,352) ($12,713)
($12,921) Directors' equity-based compensation e xpense (benefit) 2 ,817
( 36) (185) 2,010 ( 470) (1,457) (1,914) Costs/loss associated with
optimization and sale of the specialty mills - - 487 (487) - - - Legal
expenses and settlement costs - - - - - - 1,972 Reorganization related
expenses - - - - - - 452 Adjusted Corporate operating loss1 ($12,918)
($13,293) ($13,857) ($13,658) ($13,822) ($14,170) ($12,411)
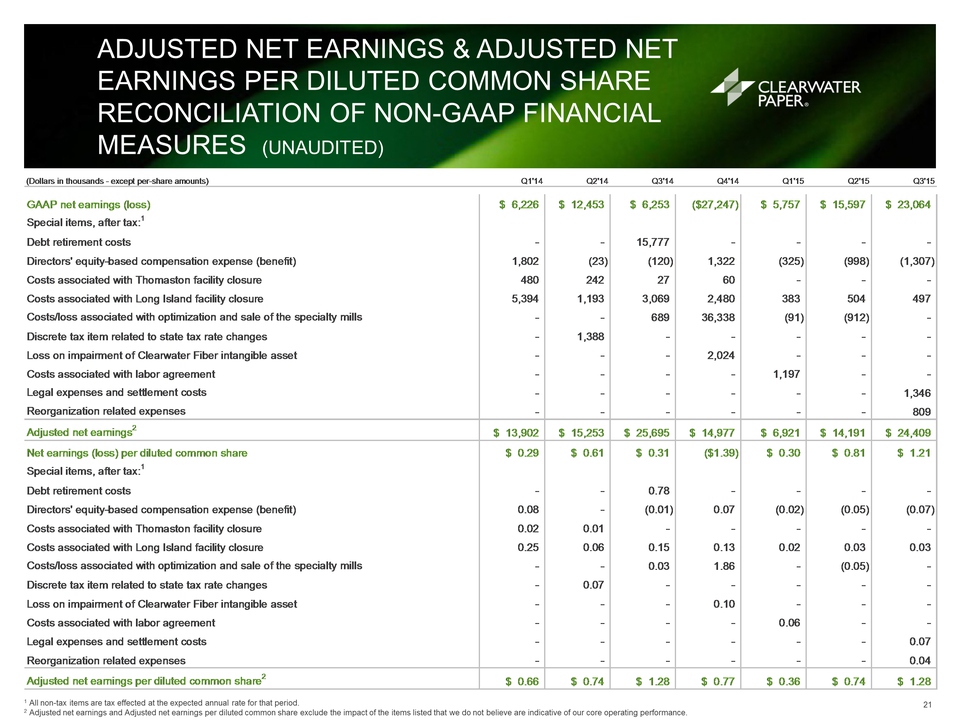
ADJUSTED NET EARNINGS &
ADJUSTED NET EARNINGS PER DILUTED COMMON SHARE RECONCILIATION OF
NON-GAAP FINANCIAL MEASURES (UNAUDITED) 1 All non-tax items are tax
effected at the expected annual rate for that period. 21 2 Adjusted net
earnings and Adjusted net earnings per diluted common share exclude the
impact of the items listed that we do not believe are indicative of our
core operating performance. (Dollars in thousands - except per-share
amounts) Q1'14 Q2'14 Q3'14 Q4'14 Q1'15 Q2'15 Q3'15 GAAP net earnings
(loss) $ 6,226 $ 12,453 $ 6,253 ($27,247) $ 5,757 $ 15,597 $ 23,064
Special items, after tax:1 Debt retirement costs - - 15,777 - - - -
Directors' equity-based compensation expense (benefit) 1 ,802 ( 23)
(120) 1,322 ( 325) (998) (1,307) Costs associated with Thomaston
facility closure 4 80 242 2 7 60 - - - Costs associated with Long Island
facility closure 5 ,394 1,193 3,069 2,480 3 83 504 497 Costs/loss
associated with optimization and sale of the specialty mills - - 689
36,338 ( 91) (912) - Discrete tax item related to state tax rate changes
- 1,388 - - - - - Loss on impairment of Clearwater Fiber intangible
asset - - - 2,024 - - - Costs associated with labor agreement - - - -
1,197 - - Legal expenses and settlement costs - - - - - - 1,346
Reorganization related expenses - - - - - - 809 Adjusted net earnings2 $
13,902 $ 15,253 $ 25,695 $ 14,977 $ 6,921 $ 14,191 $ 24,409 Net earnings
(loss) per diluted common share $ 0.29 $ 0.61 $ 0.31 ($1.39) $ 0.30 $
0.81 $ 1.21 Special items, after tax:1 Debt retirement costs - - 0.78 -
- - - Directors' equity-based compensation expense (benefit) 0 .08 -
(0.01) 0 .07 (0.02) (0.05) (0.07) Costs associated with Thomaston
facility closure 0 .02 0.01 - - - - - Costs associated with Long Island
facility closure 0.25 0.06 0.15 0.13 0.02 0.03 0.03 Costs/loss
associated with optimization and sale of the specialty mills - - 0.03
1.86 - (0.05) - Discrete tax item related to state tax rate changes -
0.07 - - - - - Loss on impairment of Clearwater Fiber intangible asset -
- - 0.10 - - - Costs associated with labor agreement - - - - 0.06 - -
Legal expenses and settlement costs - - - - - - 0.07 Reorganization
related expenses - - - - - - 0.04 Adjusted net earnings per diluted
common share2 $ 0.66 $ 0.74 $ 1.28 $ 0.77 $ 0.36 $ 0.74 $ 1.28
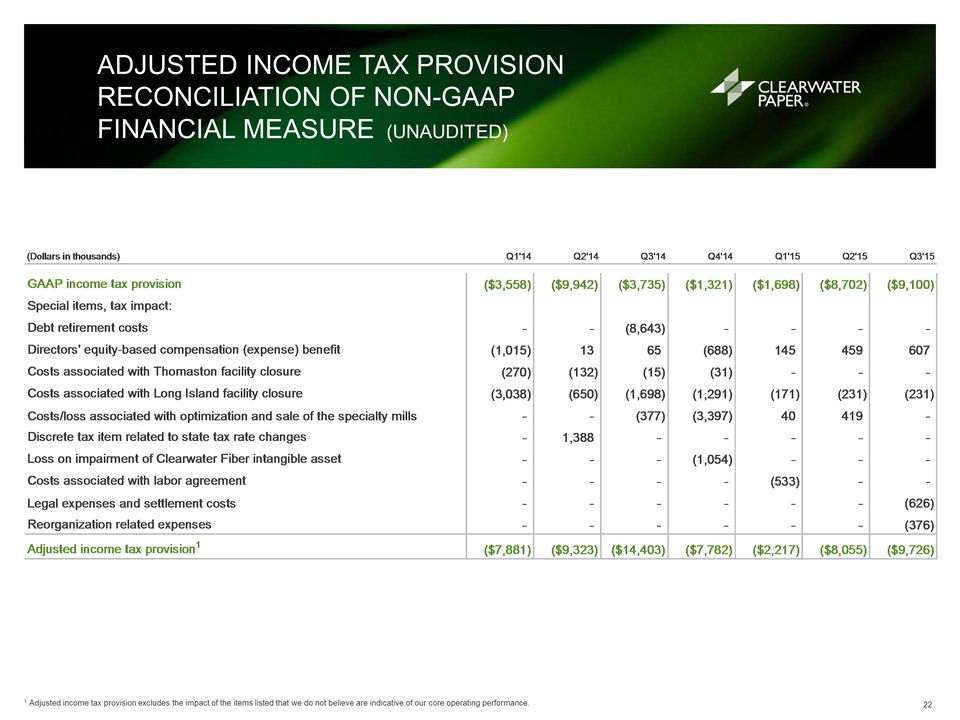
ADJUSTED INCOME TAX
PROVISION RECONCILIATION OF NON-GAAP FINANCIAL MEASURE (UNAUDITED) 1
Adjusted income tax provision excludes the impact of the items listed
that we do not believe are indicative of our core operating performance.
22 (Dollars in thousands) Q1'14 Q2'14 Q3'14 Q4'14 Q1'15 Q2'15 Q3'15 GAAP
income tax provision ($3,558) ($9,942) ($3,735) ($1,321) ($1,698)
($8,702) ($9,100) Special items, tax impact: Debt retirement costs - -
(8,643) - - - - Directors' equity-based compensation (expense) benefit (
1,015) 1 3 65 (688) 145 459 607 Costs associated with Thomaston facility
closure ( 270) (132) (15) (31) - - - Costs associated with Long Island
facility closure ( 3,038) ( 650) (1,698) (1,291) ( 171) (231) (231)
Costs/loss associated with optimization and sale of the specialty mills
- - (377) (3,397) 4 0 419 - Discrete tax item related to state tax rate
changes - 1,388 - - - - - Loss on impairment of Clearwater Fiber
intangible asset - - - (1,054) - - - Costs associated with labor
agreement - - - - (533) - - Legal expenses and settlement costs - - - -
- - (626) Reorganization related expenses - - - - - - (376) Adjusted
income tax provision1 ($7,881) ($9,323) ($14,403) ($7,782) ($2,217)
($8,055) ($9,726)
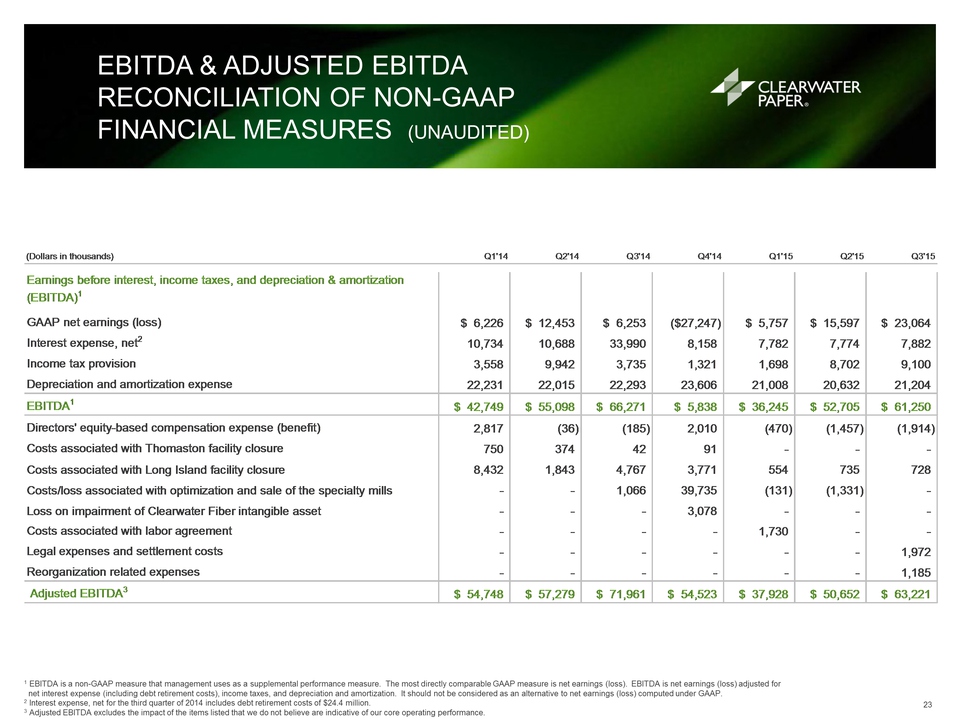
EBITDA & ADJUSTED EBITDA
RECONCILIATION OF NON-GAAP FINANCIAL MEASURES (UNAUDITED) 23 1 EBITDA is
a non-GAAP measure that management uses as a supplemental performance
measure. The most directly comparable GAAP measure is net earnings
(loss). EBITDA is net earnings (loss) adjusted for net interest expense
(including debt retirement costs), income taxes, and depreciation and
amortization. It should not be considered as an alternative to net
earnings (loss) computed under GAAP. 2 Interest expense, net for the
third quarter of 2014 includes debt retirement costs of $24.4 million. 3
Adjusted EBITDA excludes the impact of the items listed that we do not
believe are indicative of our core operating performance. (Dollars in
thousands) Q1'14 Q2'14 Q3'14 Q4'14 Q1'15 Q2'15 Q3'15 Earnings before
interest, income taxes, and depreciation & amortization (EBITDA)1 GAAP
net earnings (loss) $ 6,226 $ 12,453 $ 6,253 ($27,247) $ 5,757 $ 15,597
$ 23,064 Interest expense, net2 10,734 10,688 33,990 8,158 7,782 7,774
7,882 Income tax provision 3,558 9,942 3,735 1,321 1,698 8,702 9,100
Depreciation and amortization expense 22,231 22,015 22,293 23,606 21,008
20,632 21,204 EBITDA1 $ 42,749 $ 55,098 $ 66,271 $ 5,838 $ 36,245 $
52,705 $ 61,250 Directors' equity-based compensation expense (benefit) 2
,817 ( 36) (185) 2,010 ( 470) (1,457) (1,914) Costs associated with
Thomaston facility closure 7 50 374 4 2 91 - - - Costs associated with
Long Island facility closure 8 ,432 1,843 4,767 3,771 5 54 735 728
Costs/loss associated with optimization and sale of the specialty mills
- - 1,066 39,735 ( 131) (1,331) - Loss on impairment of Clearwater Fiber
intangible asset - - - 3,078 - - - Costs associated with labor agreement
- - - - 1,730 - - Legal expenses and settlement costs - - - - - - 1,972
Reorganization related expenses - - - - - - 1,185 Adjusted EBITDA3 $
54,748 $ 57,279 $ 71,961 $ 54,523 $ 37,928 $ 50,652 $ 63,221
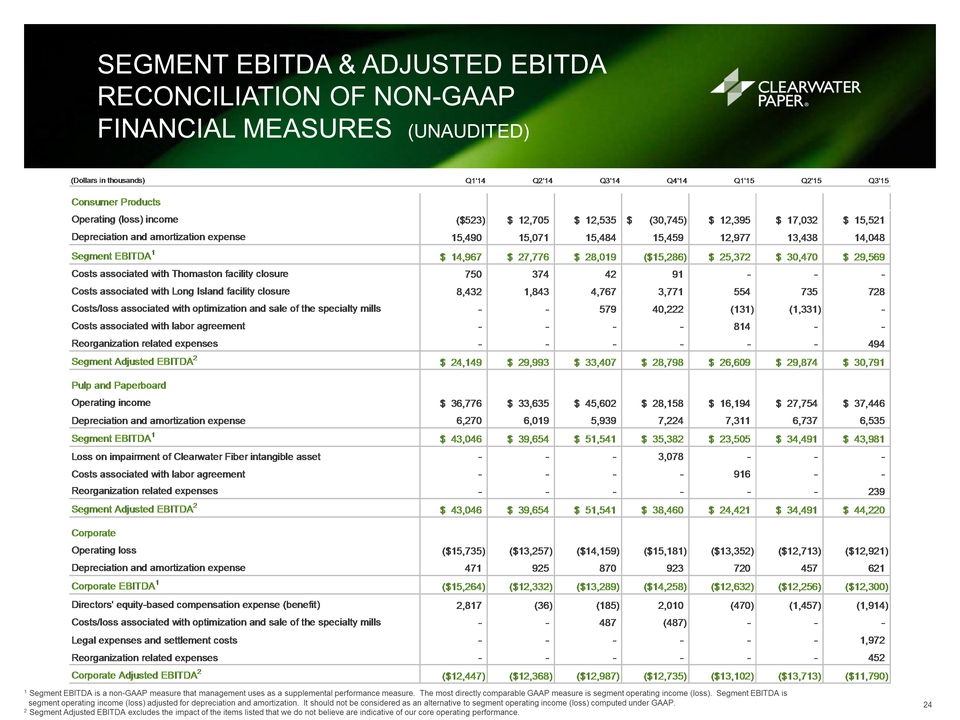
1 Segment EBITDA is a
non-GAAP measure that management uses as a supplemental performance
measure. The most directly comparable GAAP measure is segment operating
income (loss). Segment EBITDA is segment operating income (loss)
adjusted for depreciation and amortization. It should not be considered
as an alternative to segment operating income (loss) computed under
GAAP. 2 Segment Adjusted EBITDA excludes the impact of the items listed
that we do not believe are indicative of our core operating performance.
(Dollars in thousands) Q1'14 Q2'14 Q3'14 Q4'14 Q1'15 Q2'15 Q3'15
Consumer Products Operating (loss) income ($523) $ 12,705 $ 12,535 $
(30,745) $ 12,395 $ 17,032 $ 15,521 Depreciation and amortization
expense 1 5,490 15,071 15,484 15,459 12,977 13,438 14,048 Segment
EBITDA1 $ 14,967 $ 27,776 $ 28,019 ($15,286) $ 25,372 $ 30,470 $ 29,569
Costs associated with Thomaston facility closure 7 50 374 42 91 - - -
Costs associated with Long Island facility closure 8 ,432 1,843 4,767
3,771 5 54 735 728 Costs/loss associated with optimization and sale of
the specialty mills - - 579 40,222 ( 131) (1,331) - Costs associated
with labor agreement - - - - 814 - - Reorganization related expenses - -
- - - - 494 Segment Adjusted EBITDA2 $ 24,149 $ 29,993 $ 33,407 $ 28,798
$ 26,609 $ 29,874 $ 30,791 Pulp and Paperboard Operating income $ 36,776
$ 33,635 $ 45,602 $ 28,158 $ 16,194 $ 27,754 $ 37,446 Depreciation and
amortization expense 6 ,270 6,019 5,939 7,224 7,311 6,737 6,535 Segment
EBITDA1 $ 43,046 $ 39,654 $ 51,541 $ 35,382 $ 23,505 $ 34,491 $ 43,981
Loss on impairment of Clearwater Fiber i ntangible asset - - - 3,078 - -
- Costs associated with labor agreement - - - - 916 - - Reorganization
related expenses - - - - - - 239 Segment Adjusted EBITDA2 $ 43,046 $
39,654 $ 51,541 $ 38,460 $ 24,421 $ 34,491 $ 44,220 Corporate Operating
loss ($15,735) ($13,257) ($14,159) ($15,181) ($13,352) ($12,713)
($12,921) Depreciation and amortization expense 4 71 925 870 923 720 457
621 Corporate EBITDA1 ($15,264) ($12,332) ($13,289) ($14,258) ($12,632)
($12,256) ($12,300) Directors' equity-based compensation expense
(benefit) 2 ,817 ( 36) (185) 2,010 (470) (1,457) (1,914) Costs/loss
associated with optimization and sale of the specialty mills - - 487
(487) - - - Legal expenses and settlement costs - - - - - - 1,972
Reorganization related expenses - - - - - - 452 Corporate Adjusted
EBITDA2 ($12,447) ($12,368) ($12,987) ($12,735) ($13,102) ($13,713)
($11,790)
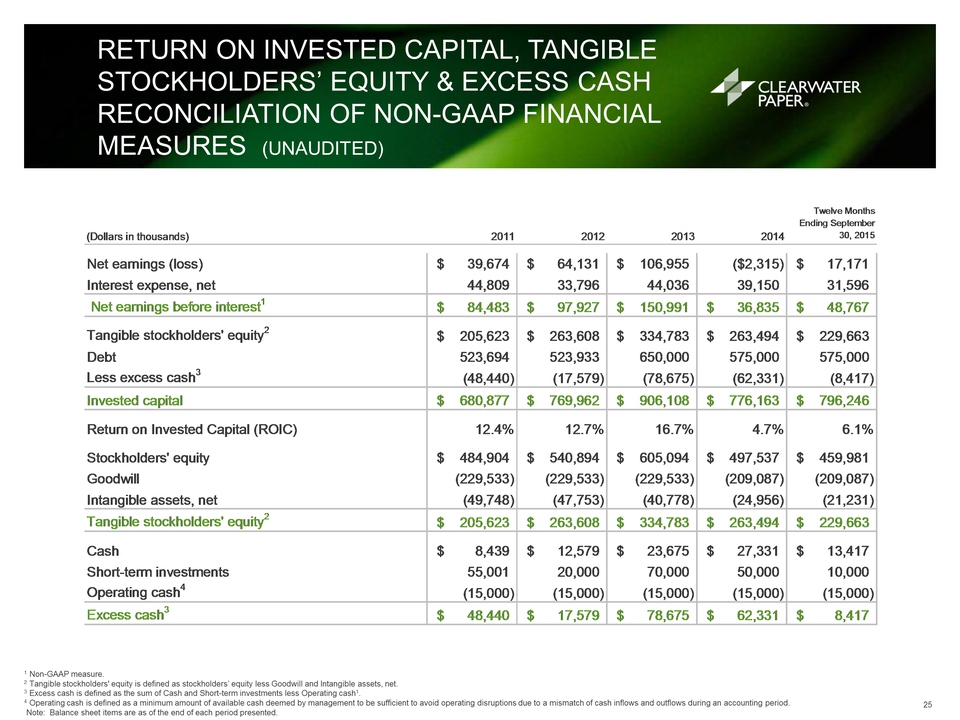
RETURN ON INVESTED CAPITAL,
TANGIBLE STOCKHOLDERS’ EQUITY & EXCESS CASH RECONCILIATION OF NON-GAAP
FINANCIAL MEASURES (UNAUDITED) 25 1 Non-GAAP measure. 2 Tangible
stockholders' equity is defined as stockholders’ equity less Goodwill
and Intangible assets, net. 3 Excess cash is defined as the sum of Cash
and Short-term investments less Operating cash1. 4 Operating cash is
defined as a minimum amount of available cash deemed by management to be
sufficient to avoid operating disruptions due to a mismatch of cash
inflows and outflows during an accounting period. Note: Balance sheet
items are as of the end of each period presented. (Dollars in thousands)
2011 2012 2013 2014 Twelve Months Ending September 30, 2015 Net earnings
(loss) $ 39,674 $ 64,131 $ 106,955 ($2,315) $ 1 7,171 Interest expense,
net 44,809 33,796 44,036 39,150 31,596 Net earnings before interest1 $
84,483 $ 97,927 $ 150,991 $ 36,835 $ 48,767 Tangible stockholders'
equity2 $ 205,623 $ 263,608 $ 334,783 $ 263,494 $ 229,663 Debt 5 23,694
523,933 650,000 575,000 575,000 Less excess cash3 ( 48,440) (17,579)
(78,675) (62,331) ( 8,417) Invested capital $ 680,877 $ 769,962 $
906,108 $ 776,163 $ 796,246 Return on Invested Capital (ROIC) 12.4%
12.7% 16.7% 4.7% 6.1% Stockholders' equity $ 4 84,904 $ 540,894 $
605,094 $ 497,537 $ 459,981 Goodwill ( 229,533) (229,533) (229,533)
(209,087) (209,087) Intangible assets, net ( 49,748) (47,753) (40,778)
(24,956) (21,231) Tangible stockholders' equity2 $ 205,623 $ 263,608 $
334,783 $ 263,494 $ 229,663 Cash $ 8,439 $ 12,579 $ 2 3,675 $ 27,331 $
13,417 Short-term investments 55,001 20,000 70,000 50,000 10,000
Operating cash4 ( 15,000) (15,000) (15,000) (15,000) (15,000) Excess
cash3 $ 48,440 $ 17,579 $ 7 8,675 $ 62,331 $ 8 ,417
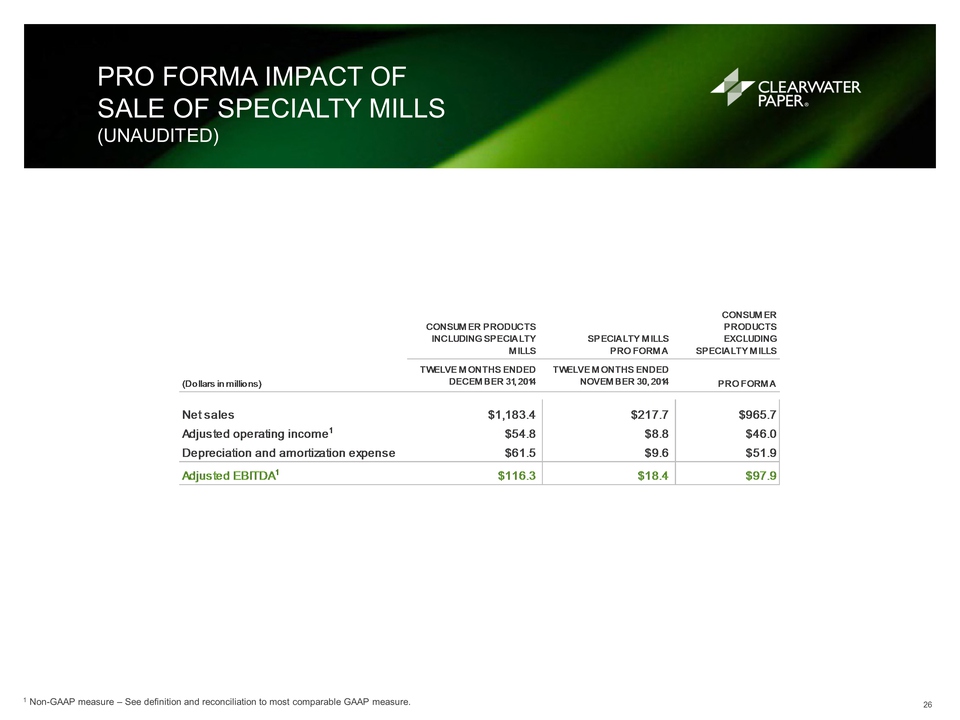
CONSUMER PRODUCTS INCLUDING
SPECIALTY MILLS SPECIALTY M ILLS PRO FORMA CONSUMER PRODUCTS EXCLUDING
SPECIALTY M ILLS (Dollars in millions) TWELVE MONTHS ENDED DECEMBER 31,
2014 TWELVE MONTHS ENDED NOVEMBER 30, 2014 PRO FORMA Net sales $1,183.4
$217.7 $965.7 Adjusted operating income1 $54.8 $8.8 $46.0 Depreciation
and amortization expense $61.5 $9.6 $51.9 Adjusted EBITDA1 $116.3 $18.4
$97.9 PRO FORMA IMPACT OF SALE OF SPECIALTY MILLS (UNAUDITED) 26 1
Non-GAAP measure – See definition and reconciliation to most comparable
GAAP measure.
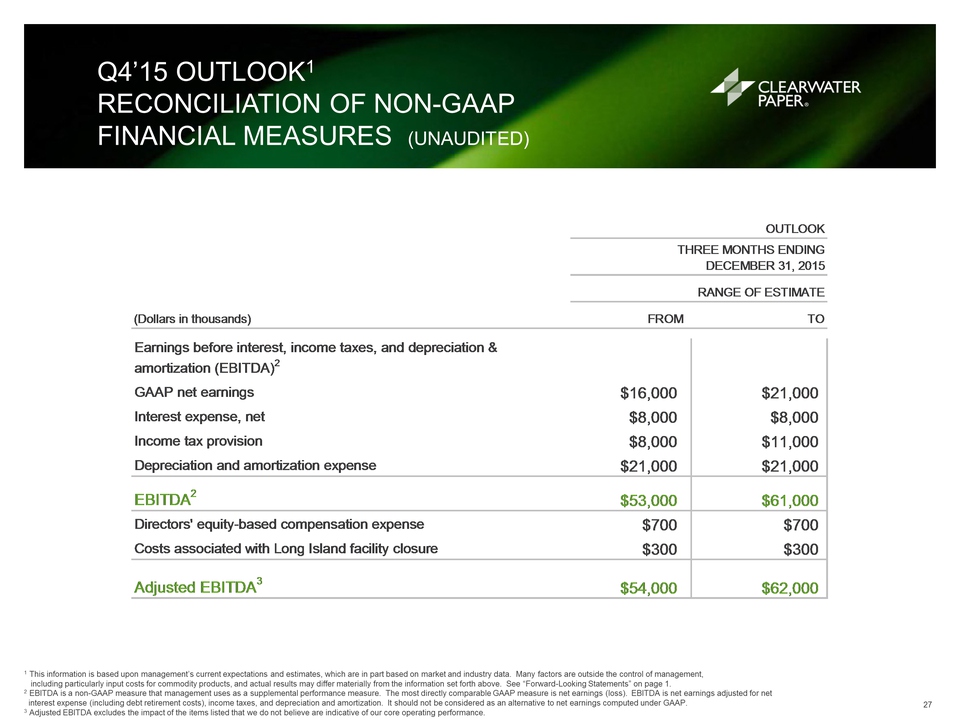
Q4’15 OUTLOOK1
RECONCILIATION OF NON-GAAP FINANCIAL MEASURES (UNAUDITED) 27 1 This
information is based upon management’s current expectations and
estimates, which are in part based on market and industry data. Many
factors are outside the control of management, including particularly
input costs for commodity products, and actual results may differ
materially from the information set forth above. See “Forward-Looking
Statements” on page 1. 2 EBITDA is a non-GAAP measure that management
uses as a supplemental performance measure. The most directly comparable
GAAP measure is net earnings (loss). EBITDA is net earnings adjusted for
net interest expense (including debt retirement costs), income taxes,
and depreciation and amortization. It should not be considered as an
alternative to net earnings computed under GAAP. 3 Adjusted EBITDA
excludes the impact of the items listed that we do not believe are
indicative of our core operating performance. (Dollars in thousands)
FROM TO Earnings before interest, income taxes, and depreciation &
amortization (EBITDA)2 GAAP net earnings $16,000 $21,000 Interest
expense, net $8,000 $8,000 Income tax provision $8,000 $11,000
Depreciation and amortization expense $21,000 $21,000 EBITDA2 $53,000
$61,000 Directors' equity-based compensation expense $700 $700 Costs
associated with Long Island facility closure $300 $300 Adjusted EBITDA3
$54,000 $62,000 THREE MONTHS ENDING DECEMBER 31, 2015 RANGE OF ESTIMATE
OUTLOOK

FOR MORE INFORMATION:
WWW.CLEARWATERPAPER.COM 28