Attached files
| file | filename |
|---|---|
| 8-K - FORM 8-K - SEACOAST BANKING CORP OF FLORIDA | v422953_8k.htm |
| EX-99.2 - EXHIBIT 99.2 - SEACOAST BANKING CORP OF FLORIDA | v422953_ex99-2.htm |
| EX-99.1 - EXHIBIT 99.1 - SEACOAST BANKING CORP OF FLORIDA | v422953_ex99-1.htm |
Exhibit 99.3
Third Quarter 2015 October 23, 2015 Contact : (email) Steve.Fowle@SeacoastBank.com (phone) 772.463.8977 (web) www.SeacoastBanking.com
Third Quarter 2015 Cautionary Notice Regarding Forward - Looking Statements 2 These slides contain “forward - looking statements” within the meaning of Section 27 A of the Securities Act of 1933 and Section 21 E of the Securities Exchange Act of 1934 , including, without limitation, statements about future financial and operating results, ability to realized deferred tax assets, cost savings, enhanced revenues, economic and seasonal conditions in our markets, and improvements to reported earnings that may be realized from cost controls and for integration of banks that we have acquired, as well as statements with respect to Seacoast’s objectives, expectations and intentions and other statements that are not historical facts . Actual results may differ from those set forth in the forward - looking statements . Forward - looking statements include statements with respect to our beliefs, plans, objectives, goals, expectations, anticipations, estimates and intentions, and involve known and unknown risks, uncertainties and other factors, which may be beyond our control, and which may cause the actual results, performance or achievements of Seacoast to be materially different from future results, performance or achievements expressed or implied by such forward - looking statements . You should not expect us to update any forward - looking statements . You can identify these forward - looking statements through our use of words such as “may,” “will,” “anticipate,” “assume,” “should,” “support”, “indicate,” “would,” “believe,” “contemplate,” “expect,” “estimate,” “continue,” “further”, “point to,” “project,” “could,” “intend” or other similar words and expressions of the future . These forward - looking statements may not be realized due to a variety of factors, including, without limitation : the effects of future economic and market conditions, including seasonality ; governmental monetary and fiscal policies, as well as legislative, tax and regulatory changes ; changes in accounting policies, rules and practices ; the risks of changes in interest rates on the level and composition of deposits, loan demand, liquidity and the values of loan collateral, securities, and interest sensitive assets and liabilities ; interest rate risks, sensitivities and the shape of the yield curve ; the effects of competition from other commercial banks, thrifts, mortgage banking firms, consumer finance companies, credit unions, securities brokerage firms, insurance companies, money market and other mutual funds and other financial institutions operating in our market areas and elsewhere, including institutions operating regionally, nationally and internationally, together with such competitors offering banking products and services by mail, telephone, computer and the Internet ; and the failure of assumptions underlying the establishment of reserves for possible loan losses . The risks of mergers and acquisitions, include, without limitation : unexpected transaction costs, including the costs of integrating operations ; the risks that the businesses will not be integrated successfully or that such integration may be more difficult, time - consuming or costly than expected ; the potential failure to fully or timely realize expected revenues and revenue synergies, including as the result of revenues following the merger being lower than expected ; the risk of deposit and customer attrition ; any changes in deposit mix ; unexpected operating and other costs, which may differ or change from expectations ; the risks of customer and employee loss and business disruption, including, without limitation, as the result of difficulties in maintaining relationships with employees ; increased competitive pressures and solicitations of customers by competitors ; as well as the difficulties and risks inherent with entering new markets . All written or oral forward - looking statements attributable to us are expressly qualified in their entirety by this cautionary notice, including, without limitation, those risks and uncertainties described in our annual report on Form 10 - K for the year ended December 31 , 2014 under “Special Cautionary Notice Regarding Forward - Looking Statements” and “Risk Factors”, and otherwise in our SEC reports and filings . Such reports are available upon request from the Company, or from the Securities and Exchange Commission, including through the SEC’s Internet website at http : //www . sec . gov .
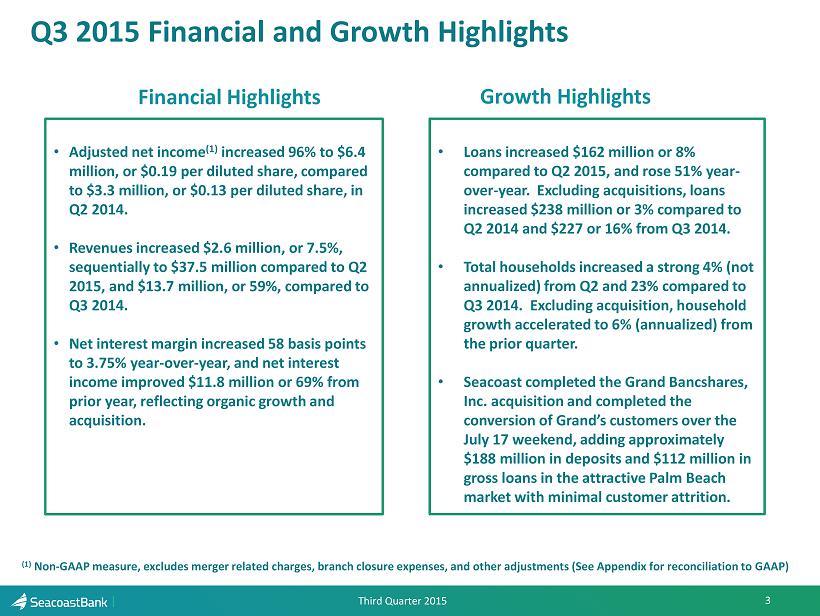
Third Quarter 2015 3 Financial Highlights Growth Highlights Q3 2015 Financial and Growth Highlights • Loans increased $162 million or 8% compared to Q2 2015, and rose 51% year - over - year. Excluding acquisitions, loans increased $238 million or 3% compared to Q2 2014 and $227 or 16% from Q3 2014. • Total households increased a strong 4% (not annualized) from Q2 and 23% compared to Q3 2014. Excluding acquisition, household growth accelerated to 6% (annualized) from the prior quarter. • Seacoast completed the Grand Bancshares, Inc. acquisition and completed the conversion of Grand’s customers over the July 17 weekend, adding approximately $188 million in deposits and $112 million in gross loans in the attractive Palm Beach market with minimal customer attrition . • Adjusted net income (1) increased 96% to $6.4 million, or $0.19 per diluted share, compared to $3.3 million, or $0.13 per diluted share, in Q2 2014. • Revenues increased $2.6 million, or 7.5%, sequentially to $ 37.5 million compared to Q2 2015, and $13.7 million, or 59%, compared to Q3 2014. • Net interest margin increased 58 basis points to 3.75% year - over - year, and net interest income improved $11.8 million or 69% from prior year, reflecting organic growth and acquisition . (1) Non - GAAP measure, excludes merger related charges, branch closure expenses, and other adjustments (See Appendix for reconciliation to GAA P)
Third Quarter 2015 • About Seacoast • Florida Economic Updates • Acquisitions Update • Earnings Highlights • Balance Sheet Trends • Income Statement Highlights • Appendix 4
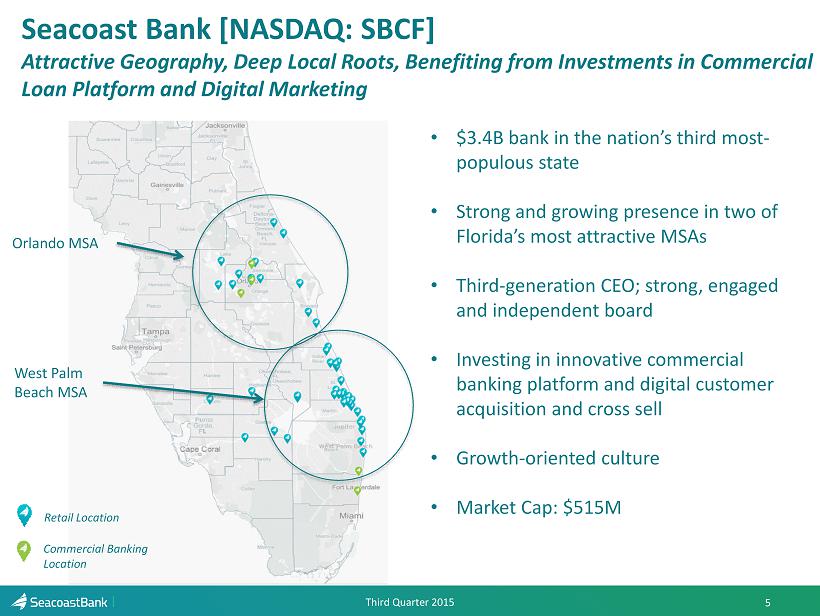
Third Quarter 2015 Agenda • $3.4B bank in the nation’s third most - populous state • Strong and growing presence in two of Florida’s most attractive MSAs • Third - generation CEO; strong, engaged and independent board • Investing in innovative commercial banking platform and digital customer acquisition and cross sell • Growth - oriented culture • Market Cap: $ 515M Seacoast Bank [NASDAQ: SBCF] Attractive Geography, Deep Local Roots, Benefiting from Investments in Commercial Loan Platform and Digital Marketing 5 Orlando MSA West Palm Beach MSA Retail Location Commercial Banking Location
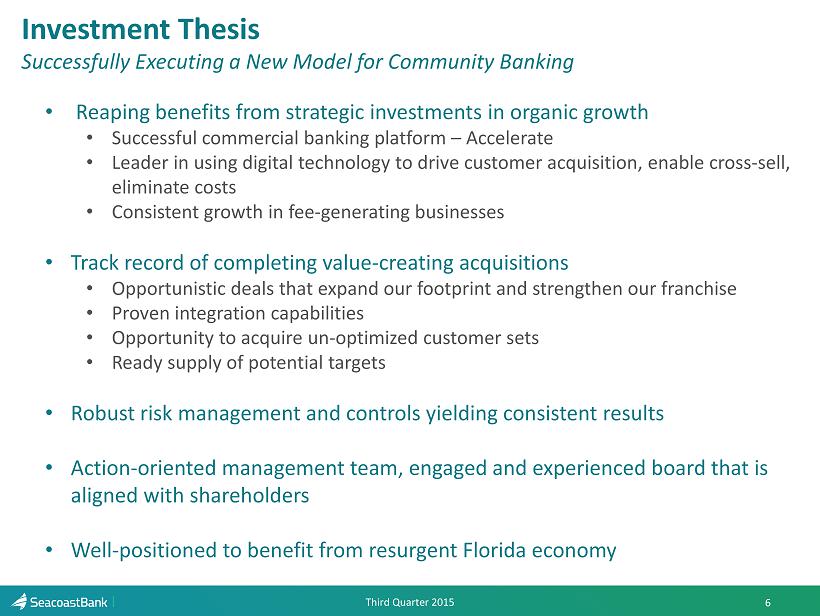
Third Quarter 2015 Agenda Investment Thesis Successfully Executing a New Model for Community Bankin g 6 • Reaping benefits from strategic investments in organic growth • Successful commercial banking platform – Accelerate • Leader in using digital technology to drive customer acquisition, enable cross - sell, eliminate costs • Consistent growth in fee - generating businesses • Track record of completing value - creating acquisitions • Opportunistic deals that expand our footprint and strengthen our franchise • Proven integration capabilities • Opportunity to acquire un - optimized customer sets • Ready supply of potential targets • Robust risk management and controls yielding consistent results • Action - oriented management team, engaged and experienced board that is aligned with shareholders • Well - positioned to benefit from resurgent Florida economy
Third Quarter 2015 • About Seacoast • Florida Economic Updates • Acquisitions Update • Earnings Highlights • Balance Sheet Trends • Income Statement Highlights • Appendix 7
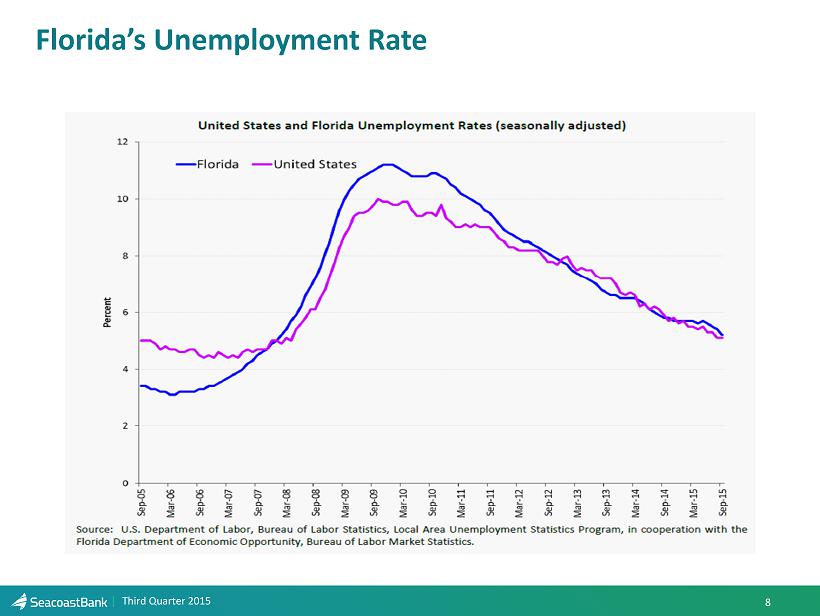
8 Third Quarter 2015 Florida’s Unemployment Rate
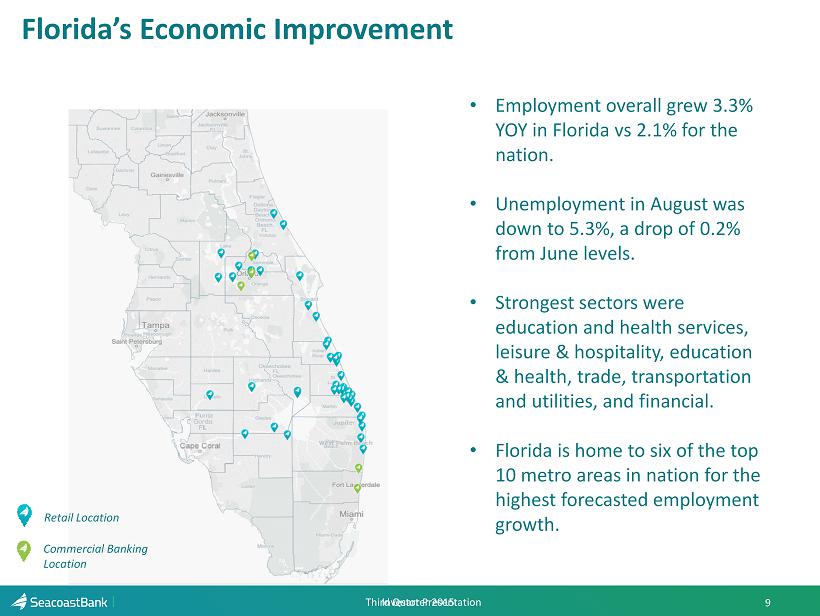
Third Quarter 2015 Agenda Florida’s Economic Improvement 9 Investor Presentation Retail Location Commercial Banking Location • Employment overall grew 3.3% YOY in Florida vs 2.1% for the nation. • Unemployment in August was down to 5.3%, a drop of 0.2% from June levels. • Strongest sectors were education and health services, leisure & hospitality, education & health, trade, transportation and utilities, and financial . • Florida is home to six of the top 10 metro areas in nation for the highest forecasted employment growth.
Third Quarter 2015 • About Seacoast • Florida Economic Updates • Acquisitions Update • Earnings Highlights • Balance Sheet Trends • Income Statement Highlights • Appendix 10
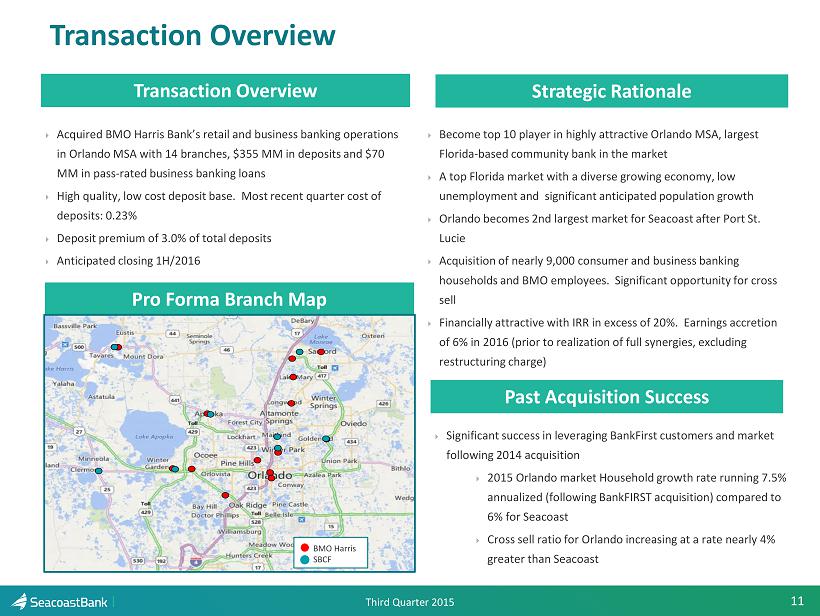
Third Quarter 2015 Acquired BMO Harris Bank’s retail and business banking operations in Orlando MSA with 14 branches, $355 MM in deposits and $70 MM in pass - rated business banking loans High quality, low cost deposit base. Most recent quarter cost of deposits: 0.23% Deposit premium of 3.0% of total deposits Anticipated closing 1H/2016 Transaction Overview 11 Transaction Overview Strategic Rationale Become top 10 player in highly attractive Orlando MSA, largest Florida - based community bank in the market A top Florida market with a diverse growing economy, low unemployment and significant anticipated population growth Orlando becomes 2nd largest market for Seacoast after Port St. Lucie Acquisition of nearly 9,000 consumer and business banking households and BMO employees. Significant opportunity for cross sell Financially attractive with IRR in excess of 20%. Earnings accretion of 6% in 2016 (prior to realization of full synergies, excluding restructuring charge) Pro Forma Branch Map BMO Harris SBCF Past Acquisition Success Significant success in leveraging BankFirst customers and market following 2014 acquisition 2015 Orlando market Household growth rate running 7.5% annualized (following BankFIRST acquisition) compared to 6% for Seacoast Cross sell ratio for Orlando increasing at a rate nearly 4% greater than Seacoast

Third Quarter 2015 • About Seacoast • Florida Economic Updates • Acquisitions Update • Earnings Highlights • Balance Sheet Trends • Income Statement Highlights • Appendix 12
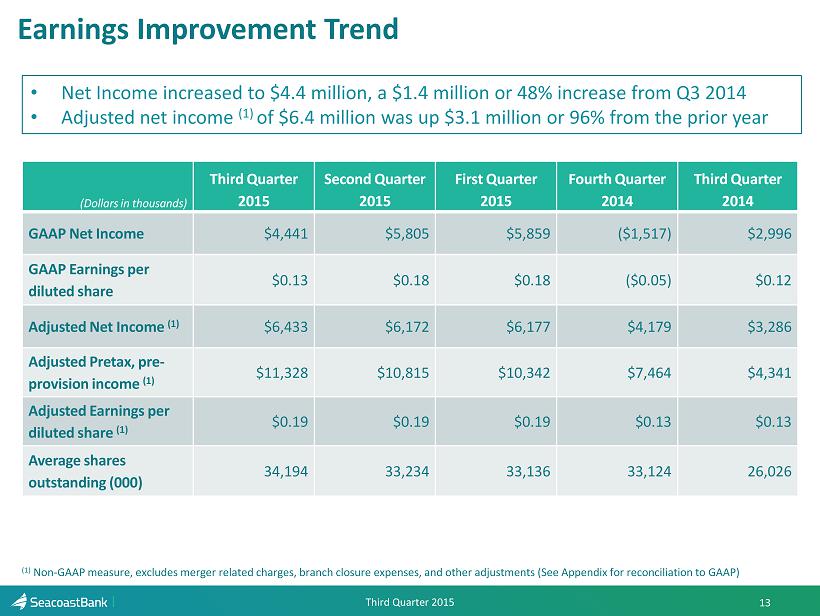
Third Quarter 2015 Earnings Improvement Trend 13 (1) Non - GAAP measure, excludes merger related charges, branch closure expenses, and other adjustments (See Appendix for reconciliation to GAA P) • Net Income increased to $4.4 million, a $1.4 million or 48% increase from Q3 2014 • Adjusted net income (1) of $6.4 million was up $3.1 million or 96% from the prior year (Dollars in thousands) Third Quarter 2015 Second Quarter 2015 First Quarter 2015 Fourth Quarter 2014 Third Quarter 2014 GAAP Net Income $4,441 $5,805 $5,859 ($1,517) $2,996 GAAP Earnings per diluted share $0.13 $ 0.18 $0.18 ($0.05) $ 0.12 Adjusted Net Income (1) $6,433 $ 6,172 $6,177 $4,179 $3,286 Adjusted Pretax, pre - provision income (1) $11,328 $ 10,815 $10,342 $7,464 $4,341 Adjusted Earnings per diluted share (1) $0.19 $0.19 $ 0.19 $0.13 $0.13 Average shares outstanding (000) 34,194 33,234 33,136 33,124 26,026

Third Quarter 2015 • About Seacoast • Florida Economic Updates • Acquisitions Update • Earnings Highlights • Balance Sheet Trends • Income Statement Highlights • Appendix 14
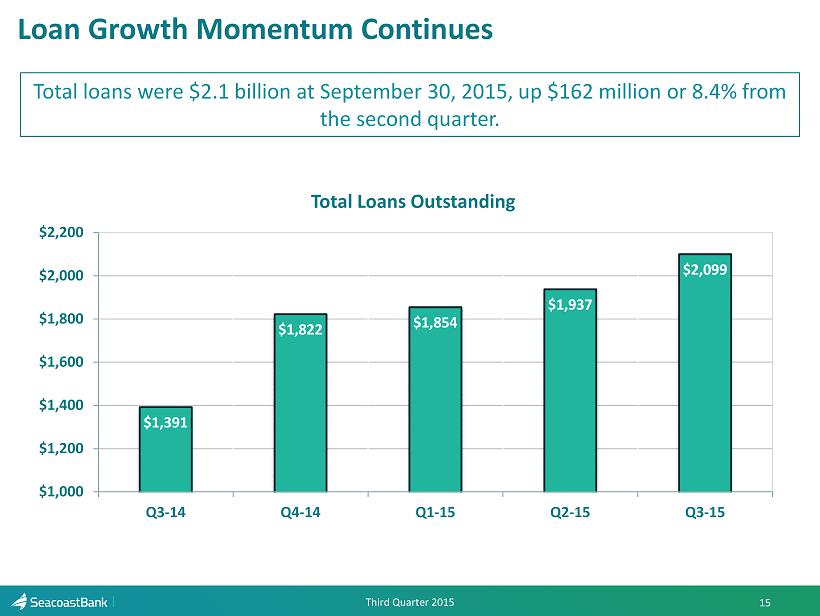
Third Quarter 2015 Loan Growth Momentum Continues 15 $1,391 $1,822 $1,854 $ 1,937 $2,099 $1,000 $1,200 $1,400 $1,600 $1,800 $2,000 $2,200 Q3-14 Q4-14 Q1-15 Q2-15 Q3-15 Total Loans Outstanding Total loans were $2.1 billion at September 30, 2015, up $162 million or 8.4% from the second quarter.
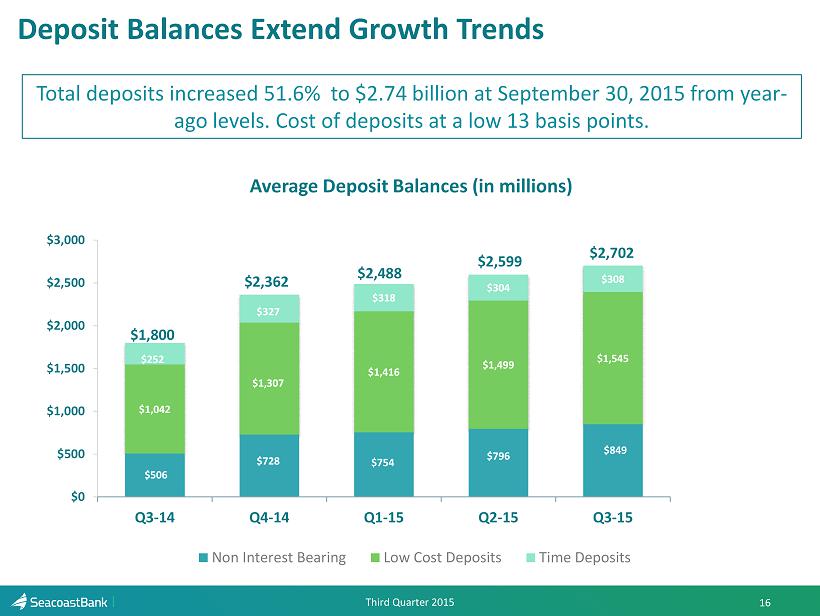
Third Quarter 2015 Deposit Balances Extend Growth Trends 16 $506 $728 $754 $796 $849 $1,042 $1,307 $1,416 $1,499 $1,545 $252 $327 $318 $304 $308 $0 $500 $1,000 $1,500 $2,000 $2,500 $3,000 Q3-14 Q4-14 Q1-15 Q2-15 Q3-15 Non Interest Bearing Low Cost Deposits Time Deposits Average Deposit Balances (in millions) $2,362 $2,488 $1,800 Total deposits increased 51.6% to $ 2.74 billion at September 30 , 2015 from year - ago levels. Cost of deposits at a low 13 basis points. $2,599 $2,702
Third Quarter 2015 • About Seacoast • Florida Economic Updates • Acquisitions Update • Earnings Highlights • Balance Sheet Trends • Income Statement Highlights • Appendix 17

Third Quarter 2015 Net Interest Income and Margin Expands from Acquisition and Core Growth Activity 18 $17,282 $24,883 $25,834 $25,788 $29,130 3.17% 3.56% 3.62% 3.50% 3.75% 3.00% 3.20% 3.40% 3.60% 3.80% 4.00% 4.20% $0 $5,000 $10,000 $15,000 $20,000 $25,000 $30,000 $35,000 Q3-14 Q4-14 Q1-15 Q2-15 Q3-15 Net Interest Income and Net Interest Margin ($ in thousands) • Net interest margin for the quarter increased to 3.75%, versus prior quarter of 3.50% and 3.17% in Q3 – 2014 • Net interest income for the quarter totaled $29.1 million, up $3.3 million versus prior quarter, excluding acquired loans, up 12% annualized
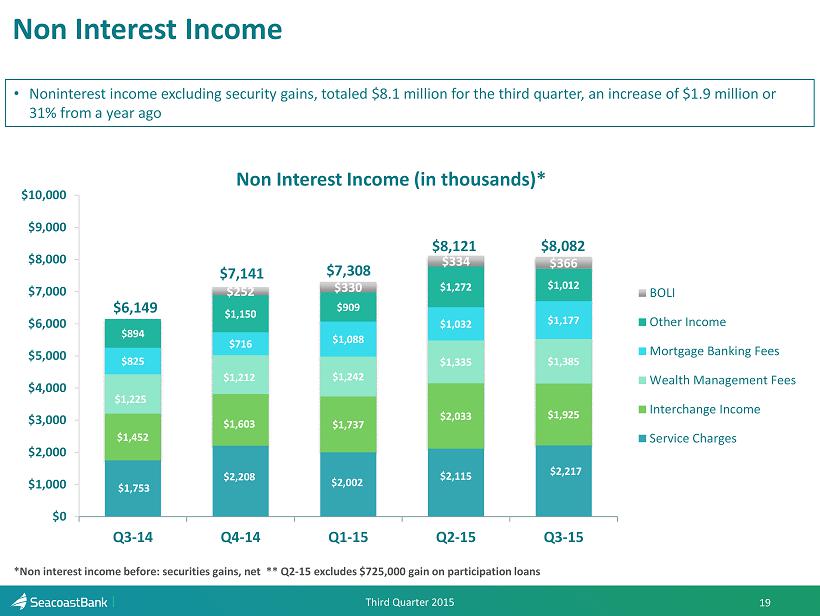
Third Quarter 2015 Non Interest Income 19 $1,753 $2,208 $2,002 $2,115 $2,217 $1,452 $1,603 $1,737 $2,033 $1,925 $1,225 $1,212 $1,242 $1,335 $1,385 $825 $716 $1,088 $1,032 $1,177 $894 $1,150 $909 $1,272 $1,012 $252 $330 $334 $366 $0 $1,000 $2,000 $3,000 $4,000 $5,000 $6,000 $7,000 $8,000 $9,000 $10,000 Q3-14 Q4-14 Q1-15 Q2-15 Q3-15 BOLI Other Income Mortgage Banking Fees Wealth Management Fees Interchange Income Service Charges Non Interest Income (in thousands)* $7,141 $7,308 $6,149 *Non interest income before: securities gains, net ** Q2 - 15 excludes $725,000 gain on participation loans • Noninterest income excluding security gains, totaled $8.1 million for the third quarter, an increase of $1.9 million or 31% from a year ago $8,121 $8,082
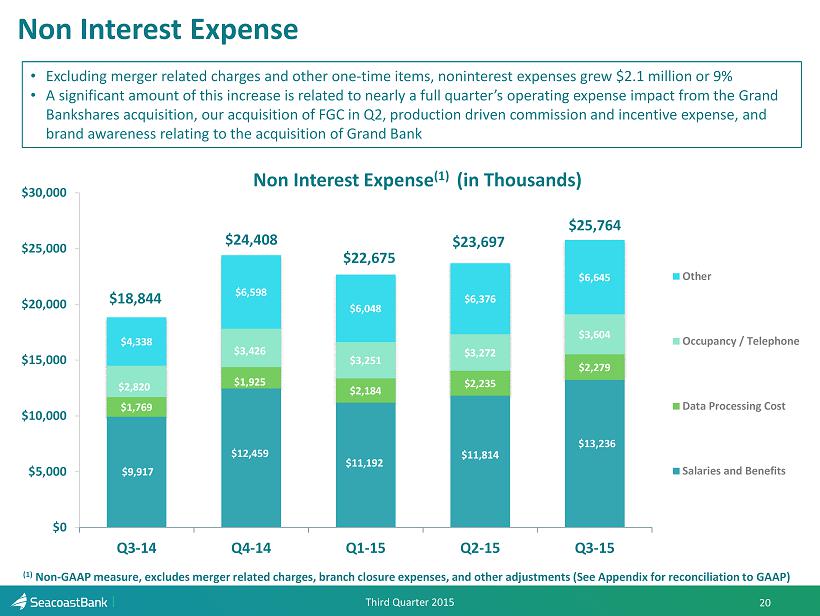
Third Quarter 2015 Non Interest Expense 20 $9,917 $12,459 $11,192 $11,814 $13,236 $1,769 $1,925 $2,184 $2,235 $2,279 $2,820 $3,426 $3,251 $3,272 $3,604 $4,338 $6,598 $6,048 $6,376 $6,645 $0 $5,000 $10,000 $15,000 $20,000 $25,000 $30,000 Q3-14 Q4-14 Q1-15 Q2-15 Q3-15 Other Occupancy / Telephone Data Processing Cost Salaries and Benefits Non Interest Expense (1) (in Thousands) $24,408 $22,675 $18,844 • Excluding merger related charges and other one - time items, noninterest expenses grew $ 2.1 million or 9 % • A significant amount of this increase is related to nearly a full quarter’s operating expense impact from the Grand Bankshares acquisition, our acquisition of FGC in Q2, production driven commission and incentive expense, and brand awareness relating to the acquisition of Grand Bank $23,697 $25,764 (1) Non - GAAP measure, excludes merger related charges, branch closure expenses, and other adjustments (See Appendix for reconciliation to GAA P)
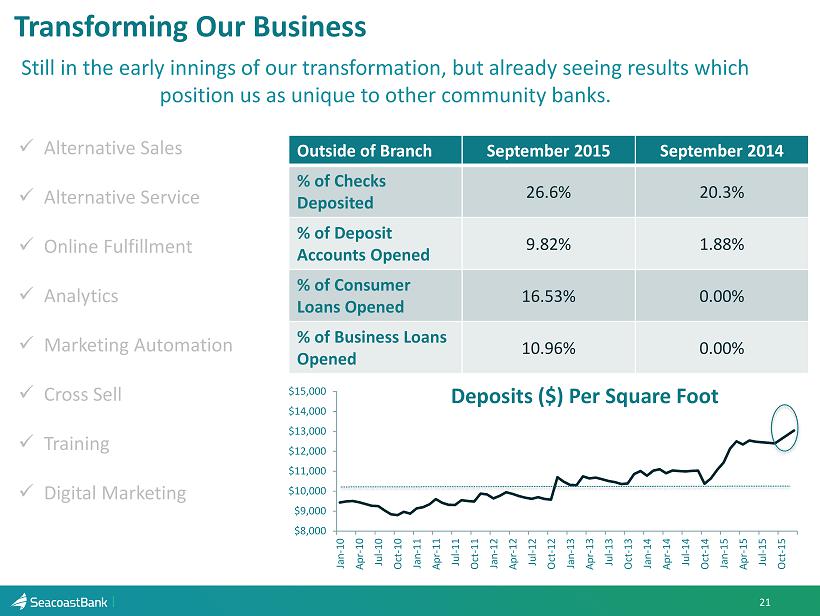
21 Transforming Our Business Outside of Branch September 2015 September 2014 % of Checks Deposited 26.6% 20.3% % of Deposit Accounts Opened 9.82% 1.88% % of Consumer Loans Opened 16.53% 0.00% % of Business Loans Opened 10.96% 0.00% Still in the early innings of our transformation, but already seeing results which position us as unique to other community banks. x Alternative Sales x Alternative Service x Online Fulfillment x Analytics x Marketing Automation x Cross Sell x Training x Digital Marketing $8,000 $9,000 $10,000 $11,000 $12,000 $13,000 $14,000 $15,000 Jan-10 Apr-10 Jul-10 Oct-10 Jan-11 Apr-11 Jul-11 Oct-11 Jan-12 Apr-12 Jul-12 Oct-12 Jan-13 Apr-13 Jul-13 Oct-13 Jan-14 Apr-14 Jul-14 Oct-14 Jan-15 Apr-15 Jul-15 Oct-15 Deposits ($) Per Square Foot
Third Quarter 2015 • About Seacoast • Florida Economic Updates • Acquisitions Update • Earnings Highlights • Balance Sheet Trends • Income Statement Highlights • Appendix 22

Explanation of Certain Unaudited Non - GAAP Financial M easures This presentation contains financial information determined by methods other than Generally Accepted Accounting Principles (“GAAP”) . The financial highlights provide reconciliations between GAAP net income and adjusted net income, GAAP income and adjusted pretax, preprovision income . Management uses these non - GAAP financial measures in its analysis of the Company’s performance and believes these presentations provide useful supplemental information, and a clearer understanding of the Company’s performance . The Company believes the non - GAAP measures enhance investors’ understanding of the Company’s business and performance . These measures are also useful in understanding performance trends and facilitate comparisons with the performance of other financial institutions . The limitations associated with operating measures are the risk that persons might disagree as to the appropriateness of items comprising these measures and that different companies might calculate these measures differently . The Company provides reconciliations between GAAP and these non - GAAP measures . These disclosures should not be considered an alternative to GAAP . 23 Investor Presentation

Net Income - GAAP to Non - GAAP Reconciliation (Q3 14 – Q3 15) Presented below is net income excluding adjustments for merger related charges, branch closure charges, and other non core expenses. The Company believes that these results of operations are a more meaningful depiction of the underlying fundamentals of its business and ove rall performance. (1) Non - GAAP measure, excludes merger related charges, branch closure expenses, and other adjustments (See Appendix for reconciliation to GAA P) 24 Investor Presentation (Dollars in thousands except per share data) Third Quarter 2015 Second Quarter 2015 First Quarter 2015 Fourth Quarter 2014 Third Quarter 2014 Net income $4,441 $5,805 $5,859 ($1,517) $2,996 Severance 98 29 12 478 328 Merger related charges 2,692 337 275 2,722 399 Branch closure charges and costs related to expense initiatives 121 0 0 4,261 68 Marketing and brand refresh expense 0 0 0 697 0 Stock compensation expense and other incentive costs related to improved outlook 0 0 0 1,213 0 Security (gains) (160) 0 0 (108) (344) Miscellaneous losses (gains) 112 0 0 119 (45) Recovery of nonaccrual loan interest 0 0 0 0 (192) Net loss on OREO and repossessed assets 262 53 81 9 156 Asset dispositions expense 77 173 143 103 139 Effective tax rate on adjustments (1,210) (225) (193) (3,798) (219) Adjusted Net Income (1) 6,433 6,172 6,177 4,179 3,286 Provision (recapture) for loan losses 987 855 433 118 (1,425) Income taxes 3,908 3,788 3,732 3,167 2,480 Adjusted pretax, pre-provision income (1) $11,328 $10,815 $10,342 $7,464 $4,341 Adjusted earnings per diluted share (1) $0.19 $0.19 $0.19 $0.13 $0.13 Average shares outstanding (000) 34,194 33,234 33,136 33,124 26,026
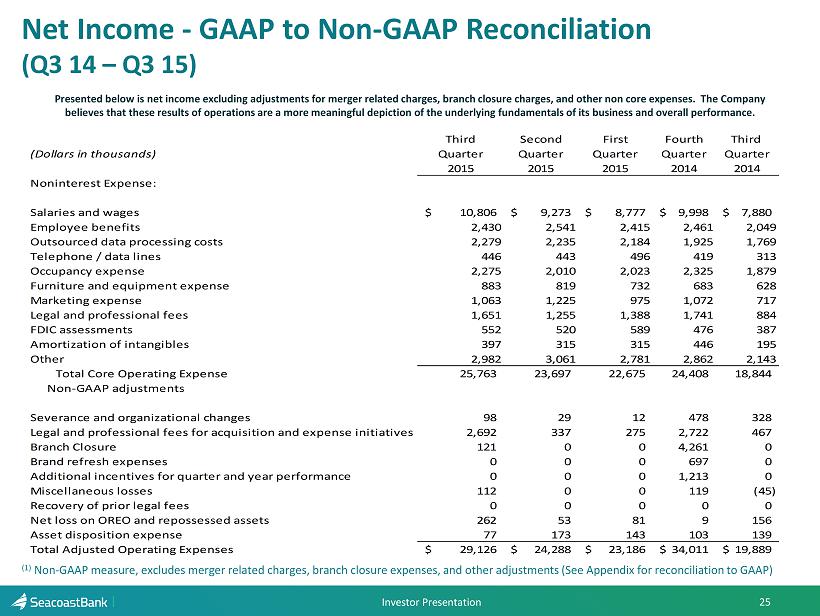
Net Income - GAAP to Non - GAAP Reconciliation (Q3 14 – Q3 15) Presented below is net income excluding adjustments for merger related charges, branch closure charges, and other non core expenses. The Company believes that these results of operations are a more meaningful depiction of the underlying fundamentals of its business and ove rall performance. (1) Non - GAAP measure, excludes merger related charges, branch closure expenses, and other adjustments (See Appendix for reconciliation to GAA P) 25 Investor Presentation Third Second First Fourth Third (Dollars in thousands) Quarter Quarter Quarter Quarter Quarter 2015 2015 2015 2014 2014 Noninterest Expense: Salaries and wages 10,806$ 9,273$ 8,777$ 9,998$ 7,880$ Employee benefits 2,430 2,541 2,415 2,461 2,049 Outsourced data processing costs 2,279 2,235 2,184 1,925 1,769 Telephone / data lines 446 443 496 419 313 Occupancy expense 2,275 2,010 2,023 2,325 1,879 Furniture and equipment expense 883 819 732 683 628 Marketing expense 1,063 1,225 975 1,072 717 Legal and professional fees 1,651 1,255 1,388 1,741 884 FDIC assessments 552 520 589 476 387 Amortization of intangibles 397 315 315 446 195 Other 2,982 3,061 2,781 2,862 2,143 Total Core Operating Expense 25,763 23,697 22,675 24,408 18,844 Non-GAAP adjustments Severance and organizational changes 98 29 12 478 328 Legal and professional fees for acquisition and expense initiatives 2,692 337 275 2,722 467 Branch Closure 121 0 0 4,261 0 Brand refresh expenses 0 0 0 697 0 Additional incentives for quarter and year performance 0 0 0 1,213 0 Miscellaneous losses 112 0 0 119 (45) Recovery of prior legal fees 0 0 0 0 0 Net loss on OREO and repossessed assets 262 53 81 9 156 Asset disposition expense 77 173 143 103 139 Total Adjusted Operating Expenses 29,126$ 24,288$ 23,186$ 34,011$ 19,889$