Attached files
| file | filename |
|---|---|
| EX-99.2 - EX-99.2 - SANDISK CORP | a15-21372_2ex99d2.htm |
| 8-K - 8-K - SANDISK CORP | a15-21372_28k.htm |
| EX-99.1 - EX-99.1 - SANDISK CORP | a15-21372_2ex99d1.htm |
Exhibit 99.3
October 21, 2015 SanDisk Third Quarter 2015 Results
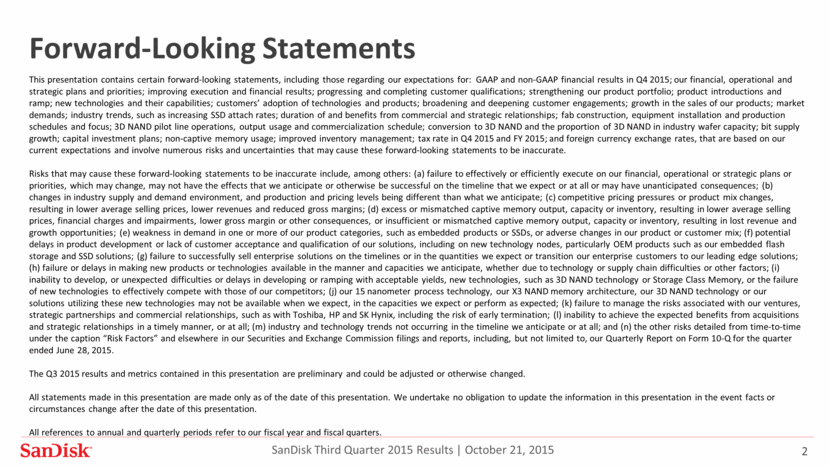
Forward-Looking Statements This presentation contains certain forward-looking statements, including those regarding our expectations for: GAAP and non-GAAP financial results in Q4 2015; our financial, operational and strategic plans and priorities; improving execution and financial results; progressing and completing customer qualifications; strengthening our product portfolio; product introductions and ramp; new technologies and their capabilities; customers’ adoption of technologies and products; broadening and deepening customer engagements; growth in the sales of our products; market demands; industry trends, such as increasing SSD attach rates; duration of and benefits from commercial and strategic relationships; fab construction, equipment installation and production schedules and focus; 3D NAND pilot line operations, output usage and commercialization schedule; conversion to 3D NAND and the proportion of 3D NAND in industry wafer capacity; bit supply growth; capital investment plans; non-captive memory usage; improved inventory management; tax rate in Q4 2015 and FY 2015; and foreign currency exchange rates, that are based on our current expectations and involve numerous risks and uncertainties that may cause these forward-looking statements to be inaccurate. Risks that may cause these forward-looking statements to be inaccurate include, among others: (a) failure to effectively or efficiently execute on our financial, operational or strategic plans or priorities, which may change, may not have the effects that we anticipate or otherwise be successful on the timeline that we expect or at all or may have unanticipated consequences; (b) changes in industry supply and demand environment, and production and pricing levels being different than what we anticipate; (c) competitive pricing pressures or product mix changes, resulting in lower average selling prices, lower revenues and reduced gross margins; (d) excess or mismatched captive memory output, capacity or inventory, resulting in lower average selling prices, financial charges and impairments, lower gross margin or other consequences, or insufficient or mismatched captive memory output, capacity or inventory, resulting in lost revenue and growth opportunities; (e) weakness in demand in one or more of our product categories, such as embedded products or SSDs, or adverse changes in our product or customer mix; (f) potential delays in product development or lack of customer acceptance and qualification of our solutions, including on new technology nodes, particularly OEM products such as our embedded flash storage and SSD solutions; (g) failure to successfully sell enterprise solutions on the timelines or in the quantities we expect or transition our enterprise customers to our leading edge solutions; (h) failure or delays in making new products or technologies available in the manner and capacities we anticipate, whether due to technology or supply chain difficulties or other factors; (i) inability to develop, or unexpected difficulties or delays in developing or ramping with acceptable yields, new technologies, such as 3D NAND technology or Storage Class Memory, or the failure of new technologies to effectively compete with those of our competitors; (j) our 15 nanometer process technology, our X3 NAND memory architecture, our 3D NAND technology or our solutions utilizing these new technologies may not be available when we expect, in the capacities we expect or perform as expected; (k) failure to manage the risks associated with our ventures, strategic partnerships and commercial relationships, such as with Toshiba, HP and SK Hynix, including the risk of early termination; (l) inability to achieve the expected benefits from acquisitions and strategic relationships in a timely manner, or at all; (m) industry and technology trends not occurring in the timeline we anticipate or at all; and (n) the other risks detailed from time-to-time under the caption “Risk Factors” and elsewhere in our Securities and Exchange Commission filings and reports, including, but not limited to, our Quarterly Report on Form 10-Q for the quarter ended June 28, 2015. The Q3 2015 results and metrics contained in this presentation are preliminary and could be adjusted or otherwise changed. All statements made in this presentation are made only as of the date of this presentation. We undertake no obligation to update the information in this presentation in the event facts or circumstances change after the date of this presentation. All references to annual and quarterly periods refer to our fiscal year and fiscal quarters. SanDisk Third Quarter 2015 Results October 21, 2015
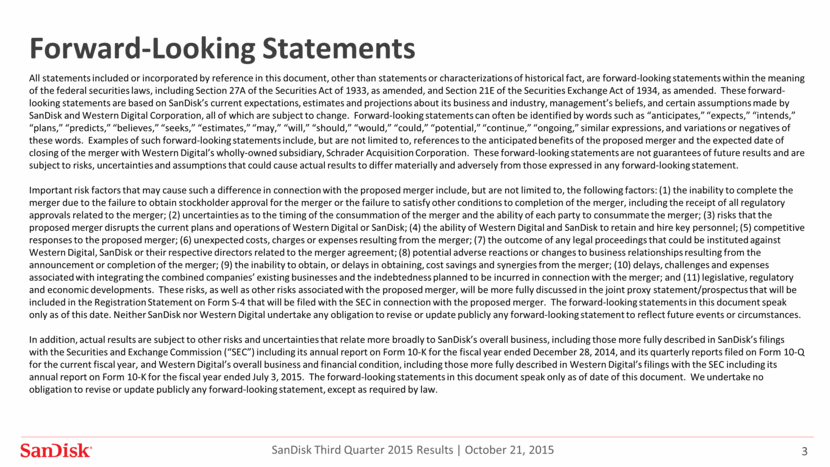
Forward-Looking Statements All statements included or incorporated by reference in this document, other than statements or characterizations of historical fact, are forward-looking statements within the meaning of the federal securities laws, including Section 27A of the Securities Act of 1933, as amended, and Section 21E of the Securities Exchange Act of 1934, as amended. These forward-looking statements are based on SanDisk’s current expectations, estimates and projections about its business and industry, management’s beliefs, and certain assumptions made by SanDisk and Western Digital Corporation, all of which are subject to change. Forward-looking statements can often be identified by words such as “anticipates,” “expects,” “intends,” “plans,” “predicts,” “believes,” “seeks,” “estimates,” “may,” “will,” “should,” “would,” “could,” “potential,” “continue,” “ongoing,” similar expressions, and variations or negatives of these words. Examples of such forward-looking statements include, but are not limited to, references to the anticipated benefits of the proposed merger and the expected date of closing of the merger with Western Digital’s wholly-owned subsidiary, Schrader Acquisition Corporation. These forward-looking statements are not guarantees of future results and are subject to risks, uncertainties and assumptions that could cause actual results to differ materially and adversely from those expressed in any forward-looking statement. Important risk factors that may cause such a difference in connection with the proposed merger include, but are not limited to, the following factors: (1) the inability to complete the merger due to the failure to obtain stockholder approval for the merger or the failure to satisfy other conditions to completion of the merger, including the receipt of all regulatory approvals related to the merger; (2) uncertainties as to the timing of the consummation of the merger and the ability of each party to consummate the merger; (3) risks that the proposed merger disrupts the current plans and operations of Western Digital or SanDisk; (4) the ability of Western Digital and SanDisk to retain and hire key personnel; (5) competitive responses to the proposed merger; (6) unexpected costs, charges or expenses resulting from the merger; (7) the outcome of any legal proceedings that could be instituted against Western Digital, SanDisk or their respective directors related to the merger agreement; (8) potential adverse reactions or changes to business relationships resulting from the announcement or completion of the merger; (9) the inability to obtain, or delays in obtaining, cost savings and synergies from the merger; (10) delays, challenges and expenses associated with integrating the combined companies’ existing businesses and the indebtedness planned to be incurred in connection with the merger; and (11) legislative, regulatory and economic developments. These risks, as well as other risks associated with the proposed merger, will be more fully discussed in the joint proxy statement/prospectus that will be included in the Registration Statement on Form S-4 that will be filed with the SEC in connection with the proposed merger. The forward-looking statements in this document speak only as of this date. Neither SanDisk nor Western Digital undertake any obligation to revise or update publicly any forward-looking statement to reflect future events or circumstances. In addition, actual results are subject to other risks and uncertainties that relate more broadly to SanDisk’s overall business, including those more fully described in SanDisk’s filings with the Securities and Exchange Commission (“SEC”) including its annual report on Form 10-K for the fiscal year ended December 28, 2014, and its quarterly reports filed on Form 10-Q for the current fiscal year, and Western Digital’s overall business and financial condition, including those more fully described in Western Digital’s filings with the SEC including its annual report on Form 10-K for the fiscal year ended July 3, 2015. The forward-looking statements in this document speak only as of date of this document. We undertake no obligation to revise or update publicly any forward-looking statement, except as required by law. SanDisk Third Quarter 2015 Results October 21, 2015
Additional Information And Where To Find It This communication does not constitute an offer to sell or the solicitation of an offer to buy any securities or a solicitation of any vote or approval nor shall there be any sale of securities in any jurisdiction in which such offer, solicitation or sale would be unlawful prior to registration or qualification under the securities laws of any such jurisdiction. Western Digital will file with the SEC a Registration Statement on Form S-4 that will include a joint proxy statement/prospectus of SanDisk and Western Digital. Each of SanDisk and Western Digital will provide the joint proxy statement/prospectus to their respective stockholders. SanDisk and Western Digital also plan to file other documents with the SEC regarding the proposed merger. This document is not a substitute for the joint proxy statement/prospectus or registration statement or any other document which SanDisk or Western Digital may file with the SEC in connection with the proposed merger. INVESTORS AND SECURITY HOLDERS OF SANDISK AND WESTERN DIGITAL ARE URGED TO READ THE JOINT PROXY STATEMENT/PROSPECTUS AND ANY OTHER RELEVANT DOCUMENTS THAT WILL BE FILED WITH THE SEC CAREFULLY AND IN THEIR ENTIRETY WHEN THEY BECOME AVAILABLE BECAUSE THEY WILL CONTAIN IMPORTANT INFORMATION ABOUT THE PROPOSED MERGER. You may obtain copies of all documents filed with the SEC regarding this merger, free of charge, at the SEC’s website (www.sec.gov). In addition, copies of the documents filed with the SEC by SanDisk will be available free of charge on SanDisk’s website at http://www.sandisk.com. Copies of the documents filed with the SEC by Western Digital will be available free of charge on Western Digital’s website at http://www.westerndigital.com. SanDisk, Western Digital, and certain of their respective directors, executive officers and other members of management and employees, under SEC rules may be deemed to be participants in the solicitation of proxies from SanDisk and Western Digital stockholders in connection with the proposed merger. You can find more detailed information about SanDisk’s executive officers and directors in its definitive proxy statement filed with the SEC on April 27, 2015. You can find more detailed information about Western Digital’s executive officers and directors in its definitive proxy statement filed with the SEC on September 23, 2015. Information regarding the persons who may, under the rules of the SEC, be deemed participants in the solicitation of stockholders in connection with the proposed merger will be set forth in the joint proxy statement/prospectus when it is filed with the SEC. Additional information about SanDisk’s executive officers and directors and Western Digital’s executive officers and directors can be found in the joint proxy statement/prospectus regarding the proposed merger when it is filed with the SEC. SanDisk Third Quarter 2015 Results October 21, 2015 Participants in the Solicitation
Q3 2015 Results & Metrics
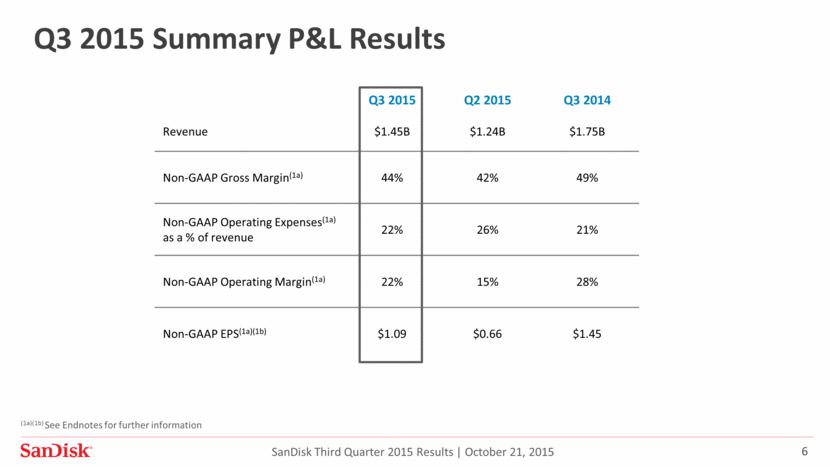
Q3 2015 Summary P&L Results Q3 2015 Q2 2015 Q3 2014 Revenue $1.45B $1.24B $1.75B Non-GAAP Gross Margin(1a) 44% 42% 49% Non-GAAP Operating Expenses(1a) as a % of revenue 22% 26% 21% Non-GAAP Operating Margin(1a) 22% 15% 28% Non-GAAP EPS(1a)(1b) $1.09 $0.66 $1.45 (1a)(1b) See Endnotes for further information SanDisk Third Quarter 2015 Results October 21, 2015
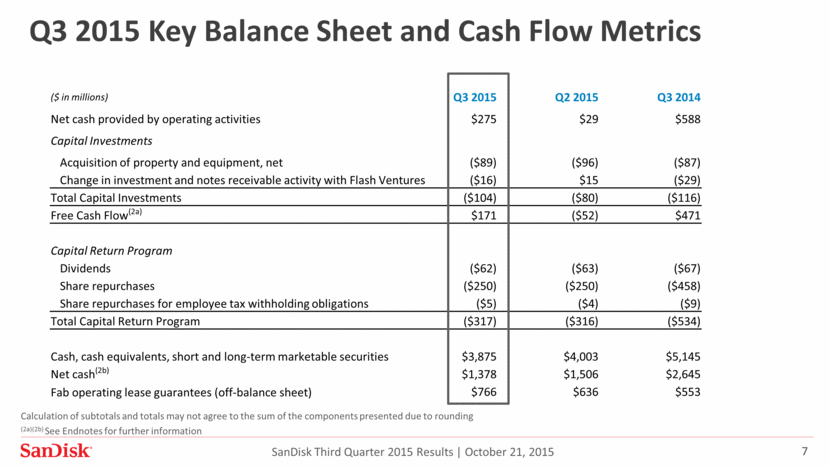
($ in millions) Q3 2015 Q2 2015 Q3 2014 Net cash provided by operating activities $275 $29 $588 Capital Investments Acquisition of property and equipment, net ($89) ($96) ($87) Change in investment and notes receivable activity with Flash Ventures ($16) $15 ($29) Total Capital Investments ($104) ($80) ($116) Free Cash Flow(2a) $171 ($52) $471 Capital Return Program Dividends ($62) ($63) ($67) Share repurchases ($250) ($250) ($458) Share repurchases for employee tax withholding obligations ($5) ($4) ($9) Total Capital Return Program ($317) ($316) ($534) Cash, cash equivalents, short and long-term marketable securities $3,875 $4,003 $5,145 Net cash(2b) $1,378 $1,506 $2,645 Fab operating lease guarantees (off-balance sheet) $766 $636 $553 Q3 2015 Key Balance Sheet and Cash Flow Metrics SanDisk Third Quarter 2015 Results October 21, 2015 Calculation of subtotals and totals may not agree to the sum of the components presented due to rounding (2a)(2b) See Endnotes for further information
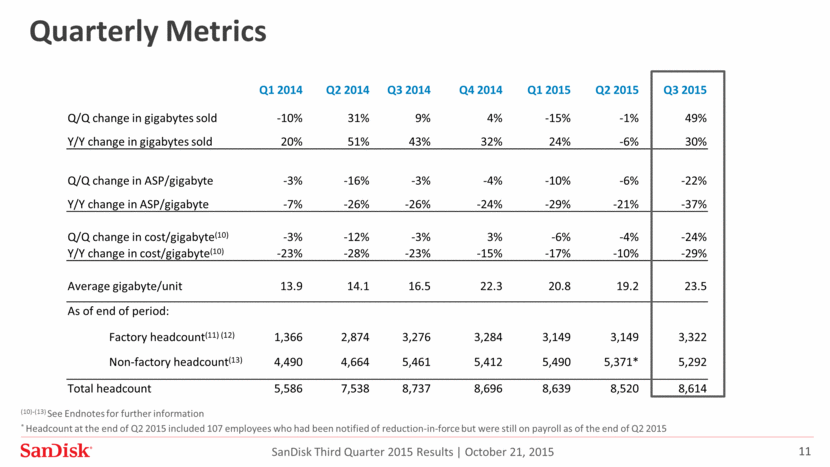
Outlook(a) Q4 2015 Non-GAAP GAAP Revenue $1,400 - $1,475 $1,400 - $1,475 Gross Margin* 40% - 43% 37% - 40% Operating Expenses* $335 - $345 $390 - $400 Other Income (Expense)* ~$0 ~($26) Tax rate* 30.4% 42% SanDisk Third Quarter 2015 Results October 21, 2015 (a) This guidance is exclusive of one-time transactions and does not reflect the effect of any acquisitions, divestitures or other transactions that may be completed after October 21, 2015. In addition, this Q4'15 guidance does not reflect expenses or other potential impacts of the pending acquisition of SanDisk Corporation by Western Digital Corporation. * See Appendices for Non-GAAP to GAAP outlook reconciliation ($ in millions, except percentages)
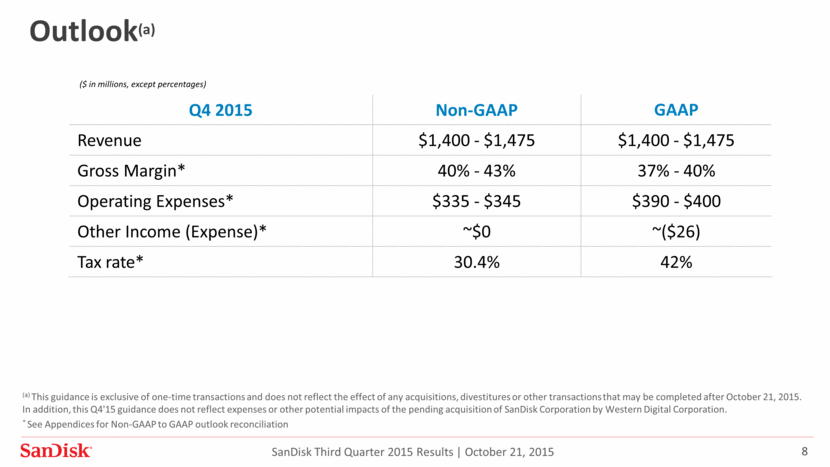
Revenue Mix(3) by Category % of Revenue Percentages may not add to 100% due to rounding (3)-(8) See Endnotes for further information. SanDisk Third Quarter 2015 Results October 21, 2015 (4) (5) (6) (7) (8) 20% 19% 24% 26% 25% 20% 27% 40% 40% 38% 33% 38% 44% 37% 22% 21% 17% 16% 13% 10% 10% 6% 8% 10% 15% 14% 14% 11% 11% 12% 11% 10% 10% 11% 15% 0% 10% 20% 30% 40% 50% 60% 70% 80% 90% 100% Q1 2014 Q2 2014 Q3 2014 Q4 2014 Q1 2015 Q2 2015 Q3 2015 Embedded Removable Cient SSD Solutions Enterprise Solutions Other
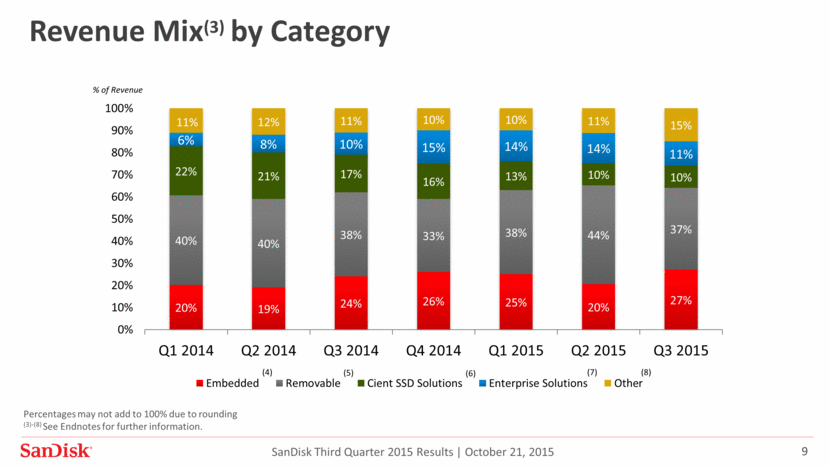
Revenue Mix(3) by Channel (9) (3)(9) See Endnotes for further information SanDisk Third Quarter 2015 Results October 21, 2015 % of Revenue 35% 33% 32% 31% 35% 39% 33% 65% 67% 68% 69% 65% 61% 67% 0% 10% 20% 30% 40% 50% 60% 70% 80% Q1 2014 Q2 2014 Q3 2014 Q4 2014 Q1 2015 Q2 2015 Q3 2015 Retail Commercial
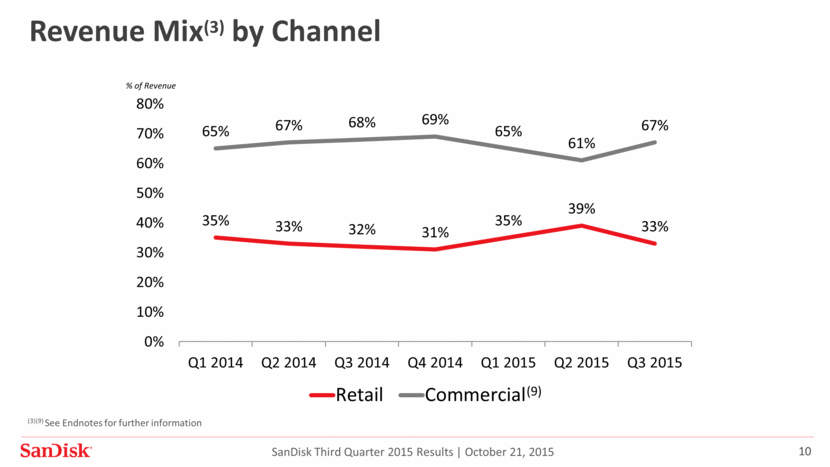
Quarterly Metrics Q1 2014 Q2 2014 Q3 2014 Q4 2014 Q1 2015 Q2 2015 Q3 2015 Q/Q change in gigabytes sold -10% 31% 9% 4% -15% -1% 49% Y/Y change in gigabytes sold 20% 51% 43% 32% 24% -6% 30% Q/Q change in ASP/gigabyte -3% -16% -3% -4% -10% -6% -22% Y/Y change in ASP/gigabyte -7% -26% -26% -24% -29% -21% -37% Q/Q change in cost/gigabyte(10) -3% -12% -3% 3% -6% -4% -24% Y/Y change in cost/gigabyte(10) -23% -28% -23% -15% -17% -10% -29% Average gigabyte/unit 13.9 14.1 16.5 22.3 20.8 19.2 23.5 As of end of period: Factory headcount(11) (12) 1,366 2,874 3,276 3,284 3,149 3,149 3,322 Non-factory headcount(13) 4,490 4,664 5,461 5,412 5,490 5,371* 5,292 Total headcount 5,586 7,538 8,737 8,696 8,639 8,520 8,614 SanDisk Third Quarter 2015 Results October 21, 2015 (10)-(13) See Endnotes for further information * Headcount at the end of Q2 2015 included 107 employees who had been notified of reduction-in-force but were still on payroll as of the end of Q2 2015
Q3 2015 Business Review
Product Updates Embedded Solutions Qualified two 15 nanometer (nm) X3 mobile custom embedded solutions, shipments began in Q3 2015 Completed re-qualification of an embedded solution for customer’s SSD application, shipments began Q3 2015 Announced, qualified and shipped 15nm X3 technology based iNAND® products to LG for inclusion in their flagship V10 smartphone launch Enterprise SSDs Qualified captive NAND based PCIe application accelerator with a large OEM storage provider in Q3 2015; additional qualifications progressing well Qualified 15nm 2 terabyte enterprise SATA SSD with a hyperscale customer; qualifications underway at other customers CloudSpeed EcoTM Gen II SSDs achieved industry’s best uncorrectable bit error rate (UBER) of 10-18 Developing 15nm 12 gigabit per second enterprise SAS SSDs, for introduction in 2016 Developing “converged platform” for enterprise SSD solution targeted for 2017 SanDisk Third Quarter 2015 Results October 21, 2015
Client SSDs Achieved #1 share of client SSD at a large PC OEM Generated numerous design wins for 15nm Z400s in the commercial sales channel, expect to ramp shipments in Q4 2015 Well positioned with OEMs for the upcoming ramp of PCs with the Skylake platform Retail Shipped 2 billionth microSDTM card SanDisk iXpandTM and Dual USB Drive mobile flash drives selling well, demonstrate continued SanDisk innovation in consumer offerings Product Updates SanDisk Third Quarter 2015 Results October 21, 2015
Technology & Manufacturing Updates 2D NAND Mix of 15nm technology nearly 60% of total bit supply 3D NAND SanDisk and Toshiba announced the start of equipment installation in the New Fab 2 facility at Yokkaichi Operations Demonstrated USB and client SSD products manufactured on 48-layer 256Gb, X3 architecture at Flash Memory Summit in August Began 3D NAND pilot line operations with initial output to be used for internal product development and validation Expect 3D NAND commercialization beginning in 2016 Supply 2015 Y/Y industry bit supply growth expected to increase in the mid-40% range 2015 Y/Y SanDisk captive bit supply growth expected to be in-line with industry 2016 Y/Y industry bit supply growth expected to be in the mid-30% range, given: 2D NAND scaling reaches its limits 3D NAND is expected to be no more than 20% of industry wafer capacity exiting 2016 2016 Y/Y SanDisk captive bit supply growth expected to be somewhat lower than industry bit supply growth SanDisk Third Quarter 2015 Results October 21, 2015
Strategic Agreements SK Hynix Signed multi-year IP licensing and DRAM supply agreements HP Entered into a long-term partnership to collaborate on a new technology within the Storage Class Memory category Partnering to enhance data center solutions with SSDs Toshiba Signed definitive agreements for joint manufacturing of 3D NAND and investment in New Fab 2 SanDisk Third Quarter 2015 Results October 21, 2015
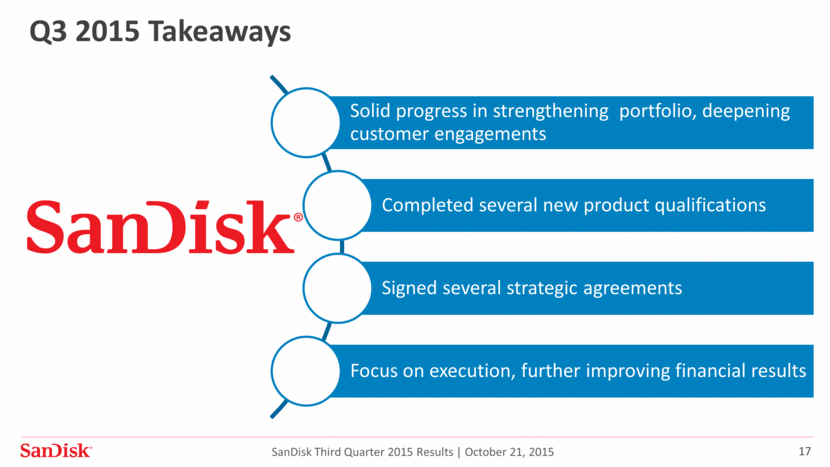
Q3 2015 Takeaways SanDisk Third Quarter 2015 Results October 21, 2015 Solid progress in strengthening portfolio, deepening customer engagements Completed several new product qualifications Signed several strategic agreements Focus on execution, further improving financial results
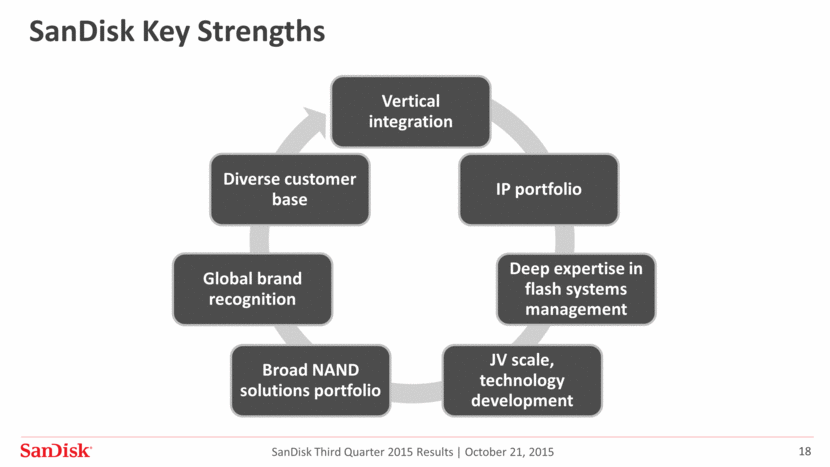
SanDisk Key Strengths SanDisk Third Quarter 2015 Results October 21, 2015 Vertical integration Broad NAND solutions portfolio JV scale, technology development Global brand recognition Diverse customer base IP portfolio Deep expertise in flash systems management
Endnotes, Appendices Endnotes Basis of presentation for Non-GAAP to GAAP Operating Results Reconciliations of Non-GAAP to GAAP Statements of Operations Reconciliation of GAAP to Non-GAAP Cost of Revenue Reconciliation of GAAP Condensed Consolidated Cash Flows from Operations to Free Cash Flow Reconciliation of Non-GAAP to GAAP Outlook
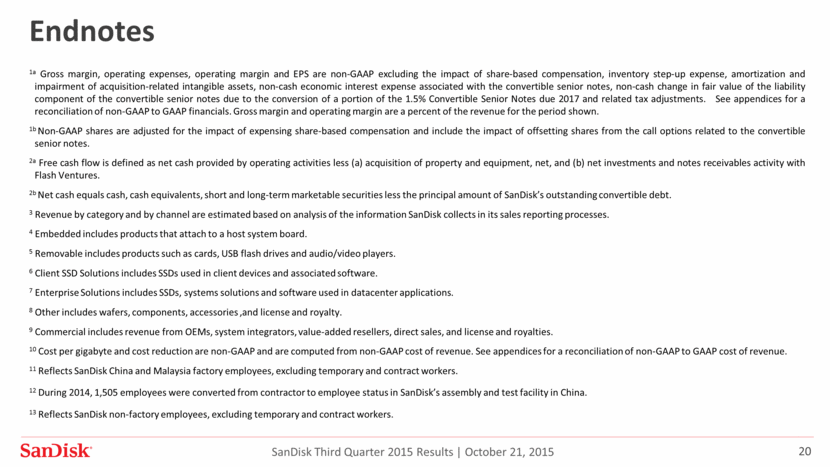
Endnotes 1a Gross margin, operating expenses, operating margin and EPS are non-GAAP excluding the impact of share-based compensation, inventory step-up expense, amortization and impairment of acquisition-related intangible assets, non-cash economic interest expense associated with the convertible senior notes, non-cash change in fair value of the liability component of the convertible senior notes due to the conversion of a portion of the 1.5% Convertible Senior Notes due 2017 and related tax adjustments. See appendices for a reconciliation of non-GAAP to GAAP financials. Gross margin and operating margin are a percent of the revenue for the period shown. 1b Non-GAAP shares are adjusted for the impact of expensing share-based compensation and include the impact of offsetting shares from the call options related to the convertible senior notes. 2a Free cash flow is defined as net cash provided by operating activities less (a) acquisition of property and equipment, net, and (b) net investments and notes receivables activity with Flash Ventures. 2b Net cash equals cash, cash equivalents, short and long-term marketable securities less the principal amount of SanDisk’s outstanding convertible debt. 3 Revenue by category and by channel are estimated based on analysis of the information SanDisk collects in its sales reporting processes. 4 Embedded includes products that attach to a host system board. 5 Removable includes products such as cards, USB flash drives and audio/video players. 6 Client SSD Solutions includes SSDs used in client devices and associated software. 7 Enterprise Solutions includes SSDs, systems solutions and software used in datacenter applications. 8 Other includes wafers, components, accessories ,and license and royalty. 9 Commercial includes revenue from OEMs, system integrators, value-added resellers, direct sales, and license and royalties. 10 Cost per gigabyte and cost reduction are non-GAAP and are computed from non-GAAP cost of revenue. See appendices for a reconciliation of non-GAAP to GAAP cost of revenue. 11 Reflects SanDisk China and Malaysia factory employees, excluding temporary and contract workers. 12 During 2014, 1,505 employees were converted from contractor to employee status in SanDisk’s assembly and test facility in China. 13 Reflects SanDisk non-factory employees, excluding temporary and contract workers. SanDisk Third Quarter 2015 Results October 21, 2015
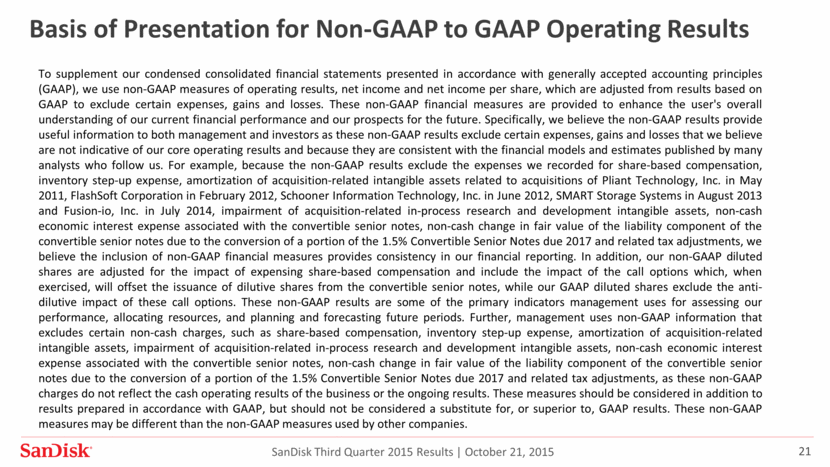
Basis of Presentation for Non-GAAP to GAAP Operating Results To supplement our condensed consolidated financial statements presented in accordance with generally accepted accounting principles (GAAP), we use non-GAAP measures of operating results, net income and net income per share, which are adjusted from results based on GAAP to exclude certain expenses, gains and losses. These non-GAAP financial measures are provided to enhance the user's overall understanding of our current financial performance and our prospects for the future. Specifically, we believe the non-GAAP results provide useful information to both management and investors as these non-GAAP results exclude certain expenses, gains and losses that we believe are not indicative of our core operating results and because they are consistent with the financial models and estimates published by many analysts who follow us. For example, because the non-GAAP results exclude the expenses we recorded for share-based compensation, inventory step-up expense, amortization of acquisition-related intangible assets related to acquisitions of Pliant Technology, Inc. in May 2011, FlashSoft Corporation in February 2012, Schooner Information Technology, Inc. in June 2012, SMART Storage Systems in August 2013 and Fusion-io, Inc. in July 2014, impairment of acquisition-related in-process research and development intangible assets, non-cash economic interest expense associated with the convertible senior notes, non-cash change in fair value of the liability component of the convertible senior notes due to the conversion of a portion of the 1.5% Convertible Senior Notes due 2017 and related tax adjustments, we believe the inclusion of non-GAAP financial measures provides consistency in our financial reporting. In addition, our non-GAAP diluted shares are adjusted for the impact of expensing share-based compensation and include the impact of the call options which, when exercised, will offset the issuance of dilutive shares from the convertible senior notes, while our GAAP diluted shares exclude the anti-dilutive impact of these call options. These non-GAAP results are some of the primary indicators management uses for assessing our performance, allocating resources, and planning and forecasting future periods. Further, management uses non-GAAP information that excludes certain non-cash charges, such as share-based compensation, inventory step-up expense, amortization of acquisition-related intangible assets, impairment of acquisition-related in-process research and development intangible assets, non-cash economic interest expense associated with the convertible senior notes, non-cash change in fair value of the liability component of the convertible senior notes due to the conversion of a portion of the 1.5% Convertible Senior Notes due 2017 and related tax adjustments, as these non-GAAP charges do not reflect the cash operating results of the business or the ongoing results. These measures should be considered in addition to results prepared in accordance with GAAP, but should not be considered a substitute for, or superior to, GAAP results. These non-GAAP measures may be different than the non-GAAP measures used by other companies. SanDisk Third Quarter 2015 Results October 21, 2015
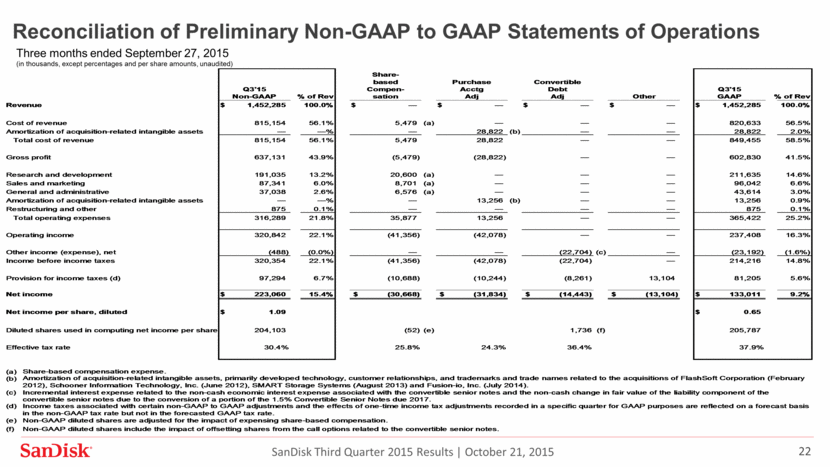
Reconciliation of Preliminary Non-GAAP to GAAP Statements of Operations Three months ended September 27, 2015 (in thousands, except percentages and per share amounts, unaudited) SanDisk Third Quarter 2015 Results October 21, 2015 % of Rev Other % of Rev Revenue 1,452,285 $ 100.0% ? $ ? $ ? $ ? $ 1,452,285 $ 100.0% Cost of revenue 815,154 56.1% 5,479 (a) ? ? ? 820,633 56.5% Amortization of acquisition-related intangible assets ? ?% ? 28,822 (b) ? ? 28,822 2.0% Total cost of revenue 815,154 56.1% 5,479 28,822 ? ? 849,455 58.5% Gross profit 637,131 43.9% (5,479) (28,822) ? ? 602,830 41.5% Research and development 191,035 13.2% 20,600 (a) ? ? ? 211,635 14.6% Sales and marketing 87,341 6.0% 8,701 (a) ? ? ? 96,042 6.6% General and administrative 37,038 2.6% 6,576 (a) ? ? ? 43,614 3.0% Amortization of acquisition-related intangible assets ? ?% ? 13,256 (b) ? ? 13,256 0.9% Restructuring and other 875 0.1% ? ? ? ? 875 0.1% Total operating expenses 316,289 21.8% 35,877 13,256 ? ? 365,422 25.2% Operating income 320,842 22.1% (41,356) (42,078) ? ? 237,408 16.3% Other income (expense), net (488) (0.0%) ? ? (22,704) (c) ? (23,192) (1.6%) Income before income taxes 320,354 22.1% (41,356) (42,078) (22,704) ? 214,216 14.8% Provision for income taxes (d) 97,294 6.7% (10,688) (10,244) (8,261) 13,104 81,205 5.6% Net income 223,060 $ 15.4% (30,668) $ (31,834) $ (14,443) $ (13,104) $ 133,011 $ 9.2% Net income per share, diluted 1.09 $ 0.65 $ Diluted shares used in computing net income per share 204,103 (52) (e) 1,736 (f) 205,787 Effective tax rate 30.4% 25.8% 24.3% 36.4% 37.9% (a) (b) (c) (d) (e) Non-GAAP diluted shares are adjusted for the impact of expensing share-based compensation. (f) Non-GAAP diluted shares include the impact of offsetting shares from the call options related to the convertible senior notes. Purchase Acctg Adj Convertible Debt Adj Q3'15 GAAP Income taxes associated with certain non-GAAP to GAAP adjustments and the effects of one-time income tax adjustments recorded in a specific quarter for GAAP purposes are reflected on a forecast basis in the non-GAAP tax rate but not in the forecasted GAAP tax rate. Share-based compensation expense. Amortization of acquisition-related intangible assets, primarily developed technology, customer relationships, and trademarks and trade names related to the acquisitions of FlashSoft Corporation (February 2012), Schooner Information Technology, Inc. (June 2012), SMART Storage Systems (August 2013) and Fusion-io, Inc. (July 2014). Incremental interest expense related to the non-cash economic interest expense associated with the convertible senior notes and the non-cash change in fair value of the liability component of the convertible senior notes due to the conversion of a portion of the 1.5% Convertible Senior Notes due 2017. Q3'15 Non-GAAP Share- based Compen- sation
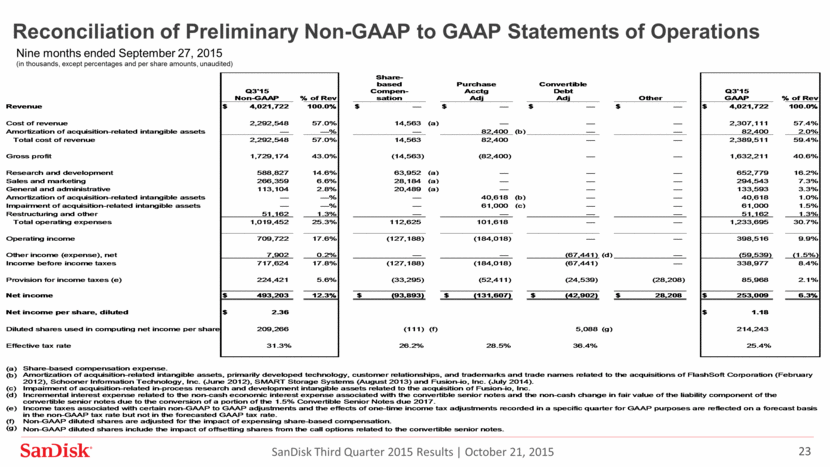
Reconciliation of Preliminary Non-GAAP to GAAP Statements of Operations Nine months ended September 27, 2015 (in thousands, except percentages and per share amounts, unaudited) SanDisk Third Quarter 2015 Results October 21, 2015 % of Rev Other % of Rev Revenue 4,021,722 $ 100.0% ? $ ? $ ? $ ? $ 4,021,722 $ 100.0% Cost of revenue 2,292,548 57.0% 14,563 (a) ? ? ? 2,307,111 57.4% Amortization of acquisition-related intangible assets ? ?% ? 82,400 (b) ? ? 82,400 2.0% Total cost of revenue 2,292,548 57.0% 14,563 82,400 ? ? 2,389,511 59.4% Gross profit 1,729,174 43.0% (14,563) (82,400) ? ? 1,632,211 40.6% Research and development 588,827 14.6% 63,952 (a) ? ? ? 652,779 16.2% Sales and marketing 266,359 6.6% 28,184 (a) ? ? ? 294,543 7.3% General and administrative 113,104 2.8% 20,489 (a) ? ? ? 133,593 3.3% Amortization of acquisition-related intangible assets ? ?% ? 40,618 (b) ? ? 40,618 1.0% Impairment of acquisition-related intangible assets ? ?% ? 61,000 (c) ? ? 61,000 1.5% Restructuring and other 51,162 1.3% ? ? ? ? 51,162 1.3% Total operating expenses 1,019,452 25.3% 112,625 101,618 ? ? 1,233,695 30.7% Operating income 709,722 17.6% (127,188) (184,018) ? ? 398,516 9.9% Other income (expense), net 7,902 0.2% ? ? (67,441) (d) ? (59,539) (1.5%) Income before income taxes 717,624 17.8% (127,188) (184,018) (67,441) ? 338,977 8.4% Provision for income taxes (e) 224,421 5.6% (33,295) (52,411) (24,539) (28,208) 85,968 2.1% Net income 493,203 $ 12.3% (93,893) $ (131,607) $ (42,902) $ 28,208 $ 253,009 $ 6.3% Net income per share, diluted 2.36 $ 1.18 $ Diluted shares used in computing net income per share 209,266 (111) (f) 5,088 (g) 214,243 Effective tax rate 31.3% 26.2% 28.5% 36.4% 25.4% (a) (b) (c) (d) (e) (f) Non-GAAP diluted shares are adjusted for the impact of expensing share-based compensation. (g) Non-GAAP diluted shares include the impact of offsetting shares from the call options related to the convertible senior notes. Income taxes associated with certain non-GAAP to GAAP adjustments and the effects of one-time income tax adjustments recorded in a specific quarter for GAAP purposes are reflected on a forecast basis in the non-GAAP tax rate but not in the forecasted GAAP tax rate. Impairment of acquisition-related in-process research and development intangible assets related to the acquisition of Fusion-io, Inc. Share-based compensation expense. Incremental interest expense related to the non-cash economic interest expense associated with the convertible senior notes and the non-cash change in fair value of the liability component of the convertible senior notes due to the conversion of a portion of the 1.5% Convertible Senior Notes due 2017. Amortization of acquisition-related intangible assets, primarily developed technology, customer relationships, and trademarks and trade names related to the acquisitions of FlashSoft Corporation (February 2012), Schooner Information Technology, Inc. (June 2012), SMART Storage Systems (August 2013) and Fusion-io, Inc. (July 2014). Q3'15 GAAP Q3'15 Non-GAAP Share- based Compen- sation Purchase Acctg Adj Convertible Debt Adj
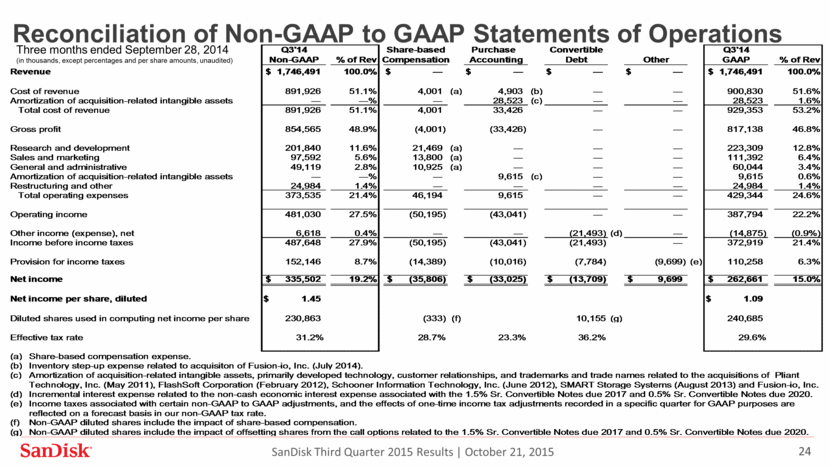
Reconciliation of Non-GAAP to GAAP Statements of Operations Three months ended September 28, 2014 (in thousands, except percentages and per share amounts, unaudited) SanDisk Third Quarter 2015 Results October 21, 2015 Q3'14 Share-based Purchase Convertible Q3'14 Non-GAAP % of Rev Compensation Accounting Debt Other GAAP % of Rev Revenue 1,746,491 $ 100.0% ? $ ? $ ? $ ? $ 1,746,491 $ 100.0% Cost of revenue 891,926 51.1% 4,001 (a) 4,903 (b) ? ? 900,830 51.6% Amortization of acquisition-related intangible assets ? ? % ? 28,523 (c) ? ? 28,523 1.6% Total cost of revenue 891,926 51.1% 4,001 33,426 ? ? 929,353 53.2% Gross profit 854,565 48.9% (4,001) (33,426) ? ? 817,138 46.8% Research and development 201,840 11.6% 21,469 (a) ? ? ? 223,309 12.8% Sales and marketing 97,592 5.6% 13,800 (a) ? ? ? 111,392 6.4% General and administrative 49,119 2.8% 10,925 (a) ? ? ? 60,044 3.4% Amortization of acquisition-related intangible assets ? ? % ? 9,615 (c) ? ? 9,615 0.6% Restructuring and other 24,984 1.4% ? ? ? ? 24,984 1.4% Total operating expenses 373,535 21.4% 46,194 9,615 ? ? 429,344 24.6% Operating income 481,030 27.5% (50,195) (43,041) ? ? 387,794 22.2% Other income (expense), net 6,618 0.4% ? ? (21,493) (d) ? (14,875) (0.9%) Income before income taxes 487,648 27.9% (50,195) (43,041) (21,493) ? 372,919 21.4% Provision for income taxes 152,146 8.7% (14,389) (10,016) (7,784) (9,699) (e) 110,258 6.3% Net income 335,502 $ 19.2% (35,806) $ (33,025) $ (13,709) $ 9,699 $ 262,661 $ 15.0% Net income per share, diluted 1.45 $ 1.09 $ Diluted shares used in computing net income per share 230,863 (333) (f) 10,155 (g) 240,685 Effective tax rate 31.2% 28.7% 23.3% 36.2% 29.6% (a) (b) Inventory step-up expense related to acquisiton of Fusion-io, Inc. (July 2014). (c) (d) Incremental interest expense related to the non-cash economic interest expense associated with the 1.5% Sr. Convertible Notes due 2017 and 0.5% Sr. Convertible Notes due 2020. (e) (f) Non-GAAP diluted shares include the impact of share-based compensation. (g) Non-GAAP diluted shares include the impact of offsetting shares from the call options related to the 1.5% Sr. Convertible Notes due 2017 and 0.5% Sr. Convertible Notes due 2020. Income taxes associated with certain non-GAAP to GAAP adjustments, and the effects of one-time income tax adjustments recorded in a specific quarter for GAAP purposes are reflected on a forecast basis in our non-GAAP tax rate. Share-based compensation expense. Amortization of acquisition-related intangible assets, primarily developed technology, customer relationships, and trademarks and trade names related to the acquisitions of Pliant Technology, Inc. (May 2011), FlashSoft Corporation (February 2012), Schooner Information Technology, Inc. (June 2012), SMART Storage Systems (August 2013) and Fusion-io, Inc.
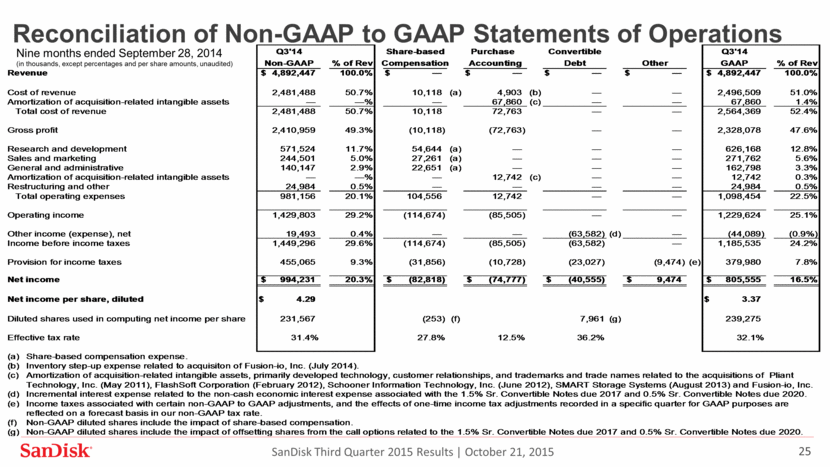
Reconciliation of Non-GAAP to GAAP Statements of Operations Nine months ended September 28, 2014 (in thousands, except percentages and per share amounts, unaudited) SanDisk Third Quarter 2015 Results October 21, 2015 Q3'14 Share-based Purchase Convertible Q3'14 Non-GAAP % of Rev Compensation Accounting Debt Other GAAP % of Rev Revenue 4,892,447 $ 100.0% ? $ ? $ ? $ ? $ 4,892,447 $ 100.0% Cost of revenue 2,481,488 50.7% 10,118 (a) 4,903 (b) ? ? 2,496,509 51.0% Amortization of acquisition-related intangible assets ? ? % ? 67,860 (c) ? ? 67,860 1.4% Total cost of revenue 2,481,488 50.7% 10,118 72,763 ? ? 2,564,369 52.4% Gross profit 2,410,959 49.3% (10,118) (72,763) ? ? 2,328,078 47.6% Research and development 571,524 11.7% 54,644 (a) ? ? ? 626,168 12.8% Sales and marketing 244,501 5.0% 27,261 (a) ? ? ? 271,762 5.6% General and administrative 140,147 2.9% 22,651 (a) ? ? ? 162,798 3.3% Amortization of acquisition-related intangible assets ? ? % ? 12,742 (c) ? ? 12,742 0.3% Restructuring and other 24,984 0.5% ? ? ? ? 24,984 0.5% Total operating expenses 981,156 20.1% 104,556 12,742 ? ? 1,098,454 22.5% Operating income 1,429,803 29.2% (114,674) (85,505) ? ? 1,229,624 25.1% Other income (expense), net 19,493 0.4% ? ? (63,582) (d) ? (44,089) (0.9%) Income before income taxes 1,449,296 29.6% (114,674) (85,505) (63,582) ? 1,185,535 24.2% Provision for income taxes 455,065 9.3% (31,856) (10,728) (23,027) (9,474) (e) 379,980 7.8% Net income 994,231 $ 20.3% (82,818) $ (74,777) $ (40,555) $ 9,474 $ 805,555 $ 16.5% Net income per share, diluted 4.29 $ 3.37 $ Diluted shares used in computing net income per share 231,567 (253) (f) 7,961 (g) 239,275 Effective tax rate 31.4% 27.8% 12.5% 36.2% 32.1% (a) (b) Inventory step-up expense related to acquisiton of Fusion-io, Inc. (July 2014). (c) (d) Incremental interest expense related to the non-cash economic interest expense associated with the 1.5% Sr. Convertible Notes due 2017 and 0.5% Sr. Convertible Notes due 2020. (e) (f) Non-GAAP diluted shares include the impact of share-based compensation. (g) Non-GAAP diluted shares include the impact of offsetting shares from the call options related to the 1.5% Sr. Convertible Notes due 2017 and 0.5% Sr. Convertible Notes due 2020. Income taxes associated with certain non-GAAP to GAAP adjustments, and the effects of one-time income tax adjustments recorded in a specific quarter for GAAP purposes are reflected on a forecast basis in our non-GAAP tax rate. Share-based compensation expense. Amortization of acquisition-related intangible assets, primarily developed technology, customer relationships, and trademarks and trade names related to the acquisitions of Pliant Technology, Inc. (May 2011), FlashSoft Corporation (February 2012), Schooner Information Technology, Inc. (June 2012), SMART Storage Systems (August 2013) and Fusion-io, Inc.
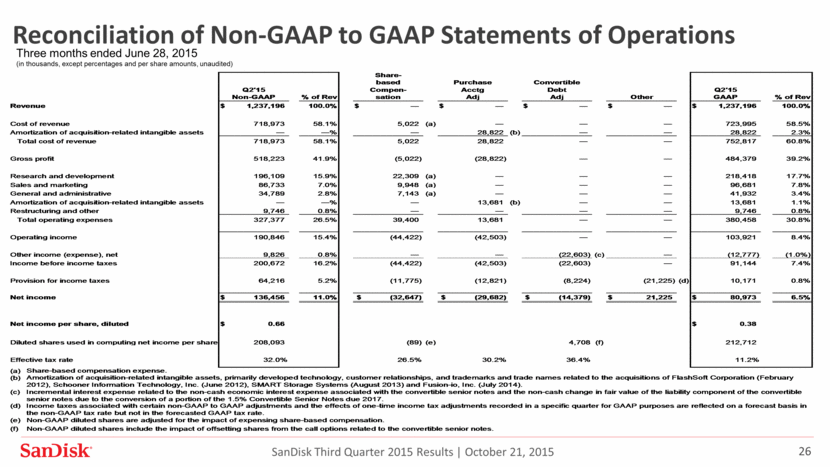
Reconciliation of Non-GAAP to GAAP Statements of Operations Three months ended June 28, 2015 (in thousands, except percentages and per share amounts, unaudited) SanDisk Third Quarter 2015 Results October 21, 2015 % of Rev Other % of Rev Revenue 1,237,196 $ 100.0% ? $ ? $ ? $ ? $ 1,237,196 $ 100.0% Cost of revenue 718,973 58.1% 5,022 (a) ? ? ? 723,995 58.5% Amortization of acquisition-related intangible assets ? ? % ? 28,822 (b) ? ? 28,822 2.3% Total cost of revenue 718,973 58.1% 5,022 28,822 ? ? 752,817 60.8% Gross profit 518,223 41.9% (5,022) (28,822) ? ? 484,379 39.2% Research and development 196,109 15.9% 22,309 (a) ? ? ? 218,418 17.7% Sales and marketing 86,733 7.0% 9,948 (a) ? ? ? 96,681 7.8% General and administrative 34,789 2.8% 7,143 (a) ? ? ? 41,932 3.4% Amortization of acquisition-related intangible assets ? ? % ? 13,681 (b) ? ? 13,681 1.1% Restructuring and other 9,746 0.8% ? ? ? ? 9,746 0.8% Total operating expenses 327,377 26.5% 39,400 13,681 ? ? 380,458 30.8% Operating income 190,846 15.4% (44,422) (42,503) ? ? 103,921 8.4% Other income (expense), net 9,826 0.8% ? ? (22,603) (c) ? (12,777) (1.0%) Income before income taxes 200,672 16.2% (44,422) (42,503) (22,603) ? 91,144 7.4% Provision for income taxes 64,216 5.2% (11,775) (12,821) (8,224) (21,225) (d) 10,171 0.8% Net income 136,456 $ 11.0% (32,647) $ (29,682) $ (14,379) $ 21,225 $ 80,973 $ 6.5% Net income per share, diluted 0.66 $ 0.38 $ Diluted shares used in computing net income per share 208,093 (89) (e) 4,708 (f) 212,712 Effective tax rate 32.0% 26.5% 30.2% 36.4% 11.2% (a) (b) (c) (d) (e) Non-GAAP diluted shares are adjusted for the impact of expensing share-based compensation. (f) Non-GAAP diluted shares include the impact of offsetting shares from the call options related to the convertible senior notes. Q2'15 Non-GAAP Share- based Compen- sation Purchase Acctg Adj Convertible Debt Adj Q2'15 GAAP Income taxes associated with certain non-GAAP to GAAP adjustments and the effects of one-time income tax adjustments recorded in a specific quarter for GAAP purposes are reflected on a forecast basis in the non-GAAP tax rate but not in the forecasted GAAP tax rate. Share-based compensation expense. Amortization of acquisition-related intangible assets, primarily developed technology, customer relationships, and trademarks and trade names related to the acquisitions of FlashSoft Corporation (February 2012), Schooner Information Technology, Inc. (June 2012), SMART Storage Systems (August 2013) and Fusion-io, Inc. (July 2014). Incremental interest expense related to the non-cash economic interest expense associated with the convertible senior notes and the non-cash change in fair value of the liability component of the convertible senior notes due to the conversion of a portion of the 1.5% Convertible Senior Notes due 2017.
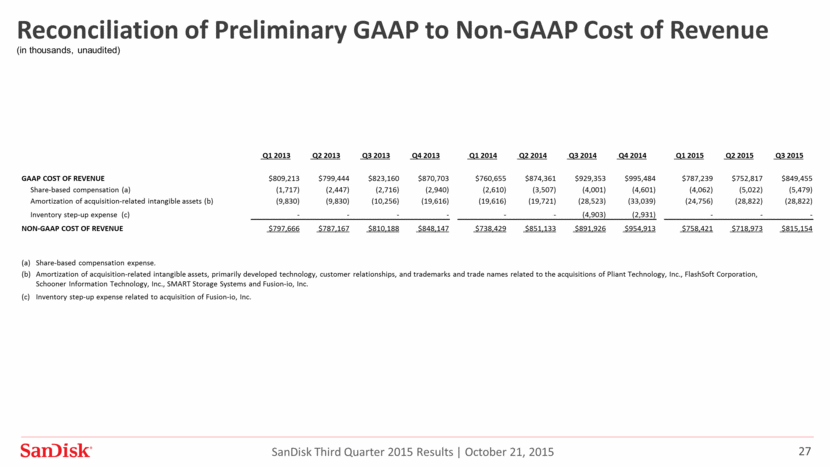
Reconciliation of Preliminary GAAP to Non-GAAP Cost of Revenue (in thousands, unaudited) SanDisk Third Quarter 2015 Results October 21, 2015 2013 Q1 2013 Q2 2013 Q3 2013 Q4 2013 Q1 2014 Q2 2014 Q3 2014 Q4 2014 Q1 2015 Q2 2015 Q3 2015 GAAP COST OF REVENUE $809,213 $799,444 $823,160 $870,703 $760,655 $874,361 $929,353 $995,484 $787,239 $752,817 $849,455 Share-based compensation (a) (1,717) (2,447) (2,716) (2,940) (2,610) (3,507) (4,001) (4,601) (4,062) (5,022) (5,479) Amortization of acquisition-related intangible assets (b) (9,830) (9,830) (10,256) (19,616) (19,616) (19,721) (28,523) (33,039) (24,756) (28,822) (28,822) Inventory step-up expense (c) - - - - - - (4,903) (2,931) - - - NON-GAAP COST OF REVENUE $797,666 $787,167 $810,188 $848,147 $738,429 $851,133 $891,926 $954,913 $758,421 $718,973 $815,154 (a) Share-based compensation expense. (b) Amortization of acquisition-related intangible assets, primarily developed technology, customer relationships, and trademarks and trade names related to the acquisitions of Pliant Technology, Inc., FlashSoft Corporation, Schooner Information Technology, Inc., SMART Storage Systems and Fusion-io, Inc. (c) Inventory step-up expense related to acquisition of Fusion-io, Inc.
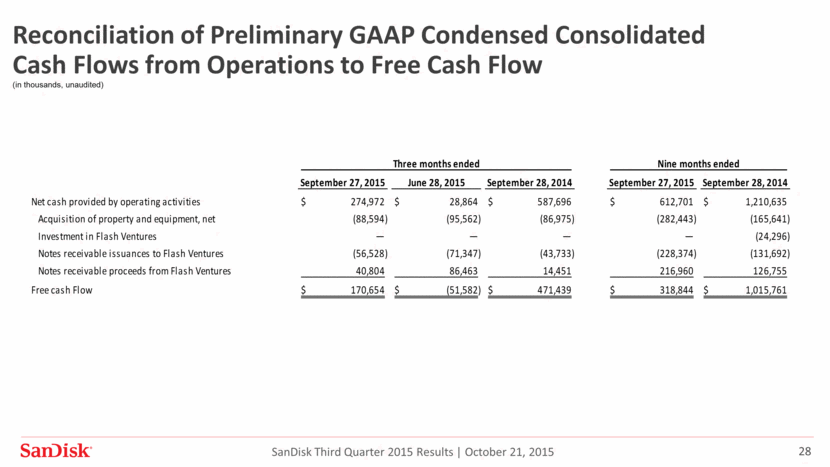
Reconciliation of Preliminary GAAP Condensed Consolidated Cash Flows from Operations to Free Cash Flow (in thousands, unaudited) SanDisk Third Quarter 2015 Results October 21, 2015 September 27, 2015 June 28, 2015 September 28, 2014 September 27, 2015 September 28, 2014 Net cash provided by operating activities 274,972 $ 28,864 $ 587,696 $ 612,701 $ 1,210,635 $ Acquisition of property and equipment, net (88,594) (95,562) (86,975) (282,443) (165,641) Investment in Flash Ventures — — — — (24,296) Notes receivable issuances to Flash Ventures (56,528) (71,347) (43,733) (228,374) (131,692) Notes receivable proceeds from Flash Ventures 40,804 86,463 14,451 216,960 126,755 Free cash Flow 170,654 $ (51,582) $ 471,439 $ 318,844 $ 1,015,761 $ Three months ended Nine months ended
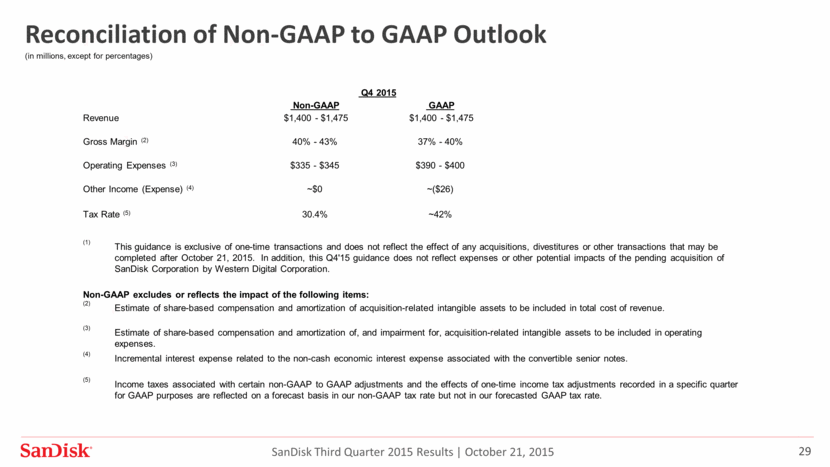
Reconciliation of Non-GAAP to GAAP Outlook (in millions, except for percentages) SanDisk Third Quarter 2015 Results October 21, 2015 Q4 2015 Non-GAAP GAAP Revenue $1,400 - $1,475 $1,400 - $1,475 Gross Margin (2) 40% - 43% 37% - 40% Operating Expenses (3) $335 - $345 $390 - $400 Other Income (Expense) (4) ~$0 ~($26) Tax Rate (5) 30.4% ~42% (1) This guidance is exclusive of one-time transactions and does not reflect the effect of any acquisitions, divestitures or other transactions that may be completed after October 21, 2015. In addition, this Q4'15 guidance does not reflect expenses or other potential impacts of the pending acquisition of SanDisk Corporation by Western Digital Corporation. Non-GAAP excludes or reflects the impact of the following items: (2) Estimate of share-based compensation and amortization of acquisition-related intangible assets to be included in total cost of revenue. (3) Estimate of share-based compensation and amortization of, and impairment for, acquisition-related intangible assets to be included in operating expenses. (4) Incremental interest expense related to the non-cash economic interest expense associated with the convertible senior notes. (5) Income taxes associated with certain non-GAAP to GAAP adjustments and the effects of one-time income tax adjustments recorded in a specific quarter for GAAP purposes are reflected on a forecast basis in our non-GAAP tax rate but not in our forecasted GAAP tax rate.
SanDisk and iNAND are trademarks of SanDisk Corporation, registered in the United States and other countries. CloudSpeed Eco and iXpand are trademarks of SanDisk Corporation. microSD is a trademark of SD-3C, LLC. Other brand names mentioned herein are for identification purposes only and may be the trademark(s) of their respective holder(s). ©2015 SanDisk Corporation. All rights reserved. SanDisk Third Quarter 2015 Results October 21, 2015
