Attached files
UNITED
STATES SECURITIES AND EXCHANGE COMMISSION
WASHINGTON,
D.C. 20549
FORM
10-K
|
(Mark
One)
|
|
|
þ
|
ANNUAL
REPORT PURSUANT TO SECTION 13 OR 15(d) OF THE SECURITIES EXCHANGE ACT OF
1934
|
For the
fiscal year ended January 3,
2010
OR
|
o
|
TRANSITION
REPORT PURSUANT TO SECTION 13 OR 15(d) OF THE SECURITIES EXCHANGE ACT OF
1934
|
For the transition period
from to
Commission
file number: 0000-26734

SANDISK
CORPORATION
(Exact
name of registrant as specified in its charter)
|
Delaware
|
77-0191793
|
|
|
(State
or other jurisdiction of
incorporation
or organization)
|
(I.R.S. Employer
Identification
No.)
|
|
|
601
McCarthy Blvd.
Milpitas,
California
|
95035
|
|
|
(Address
of principal executive offices)
|
(Zip
Code)
|
(408)
801-1000
(Registrant’s
telephone number, including area code)
|
Securities
registered pursuant to Section 12(b) of the Act:
|
||
|
Title of each class
|
Name of each exchange on which
registered
|
|
|
Common
Stock, $0.001 par value;
Rights
to Purchase Series A Junior Participating Preferred Stock
|
NASDAQ
Global Select Market
|
|
Securities
registered pursuant to Section 12(g) of the Act: None
Indicate by check mark if the registrant
is a well-known seasoned issuer, as defined in Rule 405 of the Securities
Act. Yes þ No ¨
Indicate by check mark if the registrant
is not required to file reports pursuant to Section 13 or Section 15(d) of the
Exchange Act. Yes ¨ No þ
Indicate
by check mark whether the registrant (1) has filed all reports required to be
filed by Section 13 or 15(d) of the Securities Exchange Act of 1934 during the
preceding 12 months (or for such shorter period that the registrant was required
to file such reports), and (2) has been subject to such filing requirements for
the past 90 days. Yes þ No ¨
Indicate
by check mark whether the registrant has submitted electronically and posted on
its corporate Website, if any, every Interactive Data File required to be
submitted and posted pursuant to Rule 405 of Regulation S-T during the preceding
12 months (or for such shorter period that the registrant was required to submit
and post such files). Yes ¨ No ¨
Indicate
by check mark if disclosure of delinquent filers pursuant to Item 405 of
Regulation S-K is not contained herein, and will not be contained, to the best
of registrant's knowledge, in definitive proxy or information statements
incorporated by reference in Part III of this Form 10-K or any amendment to
this Form 10-K. ¨
Indicate
by check mark whether the registrant is a large accelerated filer, an
accelerated filer, a non-accelerated filer, or a smaller reporting
company. See definitions of “large accelerated filer,” “accelerated
filer,” and “smaller reporting company” in Rule 12b-2 of the Exchange
Act. (Check one):
|
Large
accelerated filer þ
|
Accelerated
filer ¨
|
Non
accelerated filer ¨
|
Smaller
reporting company ¨
|
(Do
not check if a smaller reporting company)
Indicate
by check mark whether the registrant is a shell company (as defined in Rule
12b-2 of the Exchange Act). Yes ¨ No þ
As
of June 28, 2009, the aggregate market value of the registrant’s common
stock held by non-affiliates of the registrant was $2,499,682,911 based on the
closing sale price as reported on the NASDAQ Global Select Market.
Indicate
the number of shares outstanding of each of the issuer’s classes of common
stock, as of the latest practicable date.
|
Class
|
Outstanding at February 1,
2010
|
|
Common
Stock, $0.001 par value per share
|
228,717,982
shares
|
DOCUMENTS
INCORPORATED BY REFERENCE
|
Document
|
Parts Into Which
Incorporated
|
|
Annual
Report to Stockholders for the Fiscal Year Ended January 3, 2010
(Annual Report)
|
Parts
I, II, and IV
|
|
Proxy
Statement for the Annual Meeting of Stockholders to be held June
2, 2010 (Proxy Statement)
|
Part
III
|
SANDISK
CORPORATION
|
|
Page
No.
|
|
|
PART
I
|
||
|
Item
1.
|
3
|
|
|
Item
1A.
|
13
|
|
|
Item
1B.
|
33
|
|
|
Item
2.
|
33
|
|
|
Item
3.
|
33
|
|
|
Item
4.
|
33
|
|
|
PART
II
|
||
|
Item
5.
|
34
|
|
|
Item
6.
|
36
|
|
|
Item
7.
|
37
|
|
|
Item
7A.
|
54
|
|
|
Item
8.
|
55
|
|
|
Item
9.
|
55
|
|
|
Item
9A.
|
56
|
|
|
Item
9B.
|
56
|
|
|
PART
III
|
||
|
Item
10.
|
57
|
|
|
Item
11.
|
57
|
|
|
Item
12.
|
57
|
|
|
Item
13.
|
57
|
|
|
Item
14.
|
57
|
|
|
PART
IV
|
||
|
Item
15.
|
58
|
|
|
OTHER
|
||
|
F-1
|
||
|
S-1
|
||
PART
I
|
BUSINESS
|
Statements
in this report, which are not historical facts, are forward-looking statements
within the meaning of the federal securities laws. These statements
may contain words such as “expects,” “anticipates,” “intends,” “plans,”
“believes,” “seeks,” “estimates” or other wording indicating future results or
expectations. Forward-looking statements are subject to risks and
uncertainties. Our actual results may differ materially from the
results discussed in these forward-looking statements. Factors that
could cause our actual results to differ materially include, but are not limited
to, those discussed in “Risk Factors” in Item 1A, and elsewhere in this
report. Our business, financial condition or results of operations
could be materially adversely affected by any of these factors. We
undertake no obligation to revise or update any forward-looking statements to
reflect any event or circumstance that arises after the date of this
report. References in this report to “SanDisk®,”
“we,” “our,” and “us,” collectively refer to SanDisk Corporation, a Delaware
corporation, and its subsidiaries. All references to years or annual
periods are references to our fiscal years, which consisted of 53 weeks in 2009
and 52 weeks in 2008 and 2007.
Overview
Who We
Are. SanDisk Corporation, a global technology company, is the
inventor and largest supplier of NAND flash storage card
products. Flash storage technology allows digital information to be
stored in a durable, compact format that retains the data even after the power
has been switched off. Our products are used in a variety of large
markets, and we distribute our products globally through retail and original
equipment manufacturer, or OEM, channels. Our goal is to provide
simple, reliable, and affordable storage solutions for consumer use in a wide
variety of formats and devices. We were incorporated in Delaware in
June 1988 under the name SunDisk Corporation and changed our name to
SanDisk Corporation in August 1995. Since 2006, we have been an
S&P 500 company.
What We
Do. We design, develop and manufacture data storage solutions
in a variety of form factors using our flash memory, proprietary controller and
firmware technologies. Our solutions include removable cards,
embedded products, universal serial bus, or USB drives, digital media players,
wafers and components. Our removable card products are used in a wide
range of consumer electronics devices such as mobile phones, digital cameras,
gaming devices and laptop computers. Our embedded flash products are
used in mobile phones, navigation devices, gaming systems, imaging devices and
computing platforms. For computing platforms, we provide high-speed,
high-capacity storage solutions known as solid-state drives, or SSDs, that can
be used in lieu of hard disk drives in a variety of computing
devices.
Most of
our products are manufactured by combining NAND flash memory with a controller
chip. We purchase the vast majority of our NAND flash memory supply
requirements through our significant flash venture relationships with Toshiba
Corporation, or Toshiba, which produce and provide us with leading-edge,
low-cost memory wafers. From time-to-time, we also purchase flash
memory on a foundry basis from NAND flash manufacturers including Toshiba,
Samsung Electronics Co., Ltd., or Samsung, and Hynix Semiconductor, Inc., or
Hynix. We generally design our controllers in-house and have them
manufactured at third-party foundries.
Industry
Background
We
operate in the flash memory semiconductor industry, which is comprised of NOR
and NAND technologies. These technologies are also referred to as
non-volatile memory, which retains data even after the power is switched
off. NAND flash memory is the current mainstream technology for mass
data storage applications and is traditionally used for embedded and removable
data storage. NAND flash memory is characterized by fast write speeds
and high capacities. The NAND flash memory industry has been
characterized by rapid technology transitions which have reduced the cost per
bit by increasing the density of the memory chips on the wafer.
Our
Strategy
Our
strategy is to be an industry-leading supplier of NAND flash storage solutions
and to develop large scale markets for NAND-based storage
products. We maintain our technology leadership by investing in
advanced technologies and NAND flash memory fabrication capacity in order to
produce leading-edge, low-cost NAND memory for use in a variety of end-products,
including consumer and computing devices. We are a one-stop-shop for
our retail and OEM customers, selling in high volumes all major NAND flash
storage card formats for our target markets. Our revenues are driven
by product sales as well as the licensing of our intellectual
property.
We
believe the market for flash storage is price elastic, meaning that a decrease
in the price per megabyte results in demand for higher capacity and the
emergence of new applications for flash storage. We continuously
reduce the cost of NAND flash memory, which we believe over time, will enable
new markets and expand existing markets and allow us to achieve higher overall
revenue.
We create
new markets for NAND flash memory through our design and development of NAND
applications and products. We are founders or co-founders of most
major form factors of flash storage cards in the market today. We
pioneered the Secure Digital, or SD™,
card, together with a subsidiary of Toshiba and Panasonic Corporation, or
Panasonic. The SD card is currently the most popular form factor of
flash storage cards used in digital cameras. Subsequent to pioneering
the SD card, we worked with mobile network operators and handset manufacturers
to develop the miniSD™ card
and microSD™ card
to satisfy the need for even smaller form factor memory cards. The
microSD card has become the leading card format for mobile
phones. With Sony Corporation, or Sony, we co-own the Memory Stick
PRO™
format and co-developed the SxS memory card specification for high-capacity and
high-speed file transfer in flash-based professional video
cameras. We also worked with Canon, Inc. to co-found the
CompactFlash®, or
CF, standard. Through our internal development and technology
obtained through acquisitions, we also hold key intellectual property for USB
drives and SSDs. We plan to continue to work with a variety of
leading companies in various end markets to develop new markets for flash
storage products.
Our team
has a deep understanding of flash memory technology and we develop and own
leading-edge technology and patents for the design, manufacture and operation of
flash memory and data storage cards. One of the key technologies that
we have patented and successfully commercialized is multi-level cell technology,
or MLC, which allows a flash memory cell to be programmed to store two or more
bits of data in approximately the same area of silicon that is typically
required to store one bit of data. We have an extensive patent
portfolio that has been licensed by several leading semiconductor companies and
other companies in the flash memory business. Our cumulative license
and royalty revenues over the last three fiscal years were approximately
$1.37 billion.
We have
invested with Toshiba in high volume, state-of-the-art NAND flash manufacturing
facilities in Japan. Our commitment takes the form of capital
investments and loans to the flash ventures with Toshiba, credit enhancements of
these ventures’ leases of semiconductor manufacturing equipment, take-or-pay
commitments to purchase up to 50% of the output of these flash ventures with
Toshiba at manufacturing cost plus a mark-up and sharing in the cost of
SanDisk-Toshiba joint research and development activities related to flash
memory. We refer to the flash memory which we purchase from the
SanDisk-Toshiba ventures as captive memory. Our strategy is to have a
mix of captive and non-captive supply and we have, from time-to-time,
supplemented our sourcing of captive flash memory with purchases of non-captive
memory, primarily from Hynix, Toshiba and Samsung.
In
addition to flash memory, our products include controllers that interface
between the flash memory and digital consumer devices. We design our
own memory controllers and have them manufactured at wafer foundry
companies. Our finished flash memory products, which include the NAND
flash memory, controller and outer casing, are assembled at our in-house
assembly and test facility in Shanghai, China, and through our network of
contract manufacturers.
We sell
our products globally to retail and OEM customers. We continue to
expand our retail customer base to new geographic regions as well as to outlets
such as mobile storefronts, supermarkets and drug stores. We also
sell directly and through distributors to OEM customers. These OEM
customers either bundle or embed our memory solutions with products such as
mobile phones, digital cameras, gaming devices, computers and navigation
devices, or resell our memory solutions under their brand into retail
channels. This strategy allows us to leverage the market position,
geographic footprint and brand strength of our customers to achieve broad market
penetration for our products.
Our
Products
Our
products are sold in a wide variety of form factors and include the
following:
-
Removable Cards. Our removable data storage solutions are available in a variety of consumer form factors. For example, our ultra-small microSD removable cards, available in capacities up to 16 gigabytes, are designed for use in mobile phones. Our CompactFlash removable cards, available in capacities up to 64 gigabytes, are well-suited for a range of consumer applications, including digital cameras. Our professional products include the SanDisk Ultra® and SanDisk Extreme® product lines which are designed for additional performance and reliability.
-
Embedded Products. Our embedded products include our iNAND™ embedded flash product line, with capacities up to 64 gigabytes, which is designed to respond to the increasing demand for embedded storage for mobile phones and other portable devices. We also offer high-capacity SSDs targeted for the personal computing and server markets in capacities up to 64 gigabytes.
-
USB Drives. Our Cruzer® line of USB Flash Drives, or UFDs, are used in the computing and consumer markets, are available in capacities up to 64 gigabytes, are highly-reliable and are designed for high-performance. Our Cruzer products provide the user with the ability to carry files and application software on a portable USB drive. Our Professional and Enterprise line of UFDs are geared towards the corporate user and are specifically designed to support secure and authorized access to corporate information.
-
Digital Media Players. Sansa® is our branded line of flash-based digital media players for the digital audio and video player market. Many of our Sansa models offer a removable card slot for storage capacity expansion and easy transportability of content between devices. Features within our Sansa line of products include FM radio, voice recording and support for a variety of audio and video download and subscription services. Sansa media players are available in capacities up to 16 gigabytes. We also sell slotMusic™ and slotRadio™ products that greatly simplify music content availability for consumers.
-
Wafers and Components. In addition to finished products listed above, from time-to-time, we also sell raw memory wafers and memory components in packaged format.
Our Primary End
Markets
Our
products are sold to three primary large end markets:
-
Mobile Phones. We provide embedded and removable storage for mobile phones. We are a leading supplier of the microSD and Memory Stick® Micro product lines of removable storage cards used in mobile phones. Multimedia features in mobile phones, such as camera functionality, audio/MP3, games, video and internet access, have been gaining in popularity. In addition, there has been increasing usage of native and downloaded applications in mobile phones. The usage of multimedia features and applications are driving demand for additional NAND flash memory storage in mobile phones.
-
Consumer. We provide flash storage products to multiple consumer markets, including imaging, gaming, audio/video and global positioning system, or GPS. Flash storage cards are used as the film for all major brands of digital cameras. Our cards are also used to store video in solid-state digital camcorders and to store digital data in many other devices, such as maps in GPS devices. In addition, portable game devices now include advanced features that require high capacity memory storage cards and we provide SD cards and Memory Stick PRO Duo™ cards that are all specifically packaged for the gaming market. We also sell a line of digital media players with both embedded and removable memory under our Sansa brand with varying combinations of audio and video capabilities. We also sell slotMusic cards and slotRadio which are preloaded with music content and can be used in a wide variety of mobile phones and digital media players. Primary card formats for consumer devices include CF, SD, Memory Stick and xD-Picture Card™.
-
Computing. We provide multiple flash storage devices and solutions for the computing market. USB flash drives allow consumers to store computer files, pictures and music on keychain-sized devices and then quickly and easily transfer these files between laptops, notebooks, desktops and other devices that incorporate a USB connection. USB flash drives are easy to use, have replaced floppy disks and other types of external storage media, and are evolving into intelligent storage devices. In addition, we sell modular SSDs, which we call pSSD™, that are flash-based embedded storage devices with capacities of up to 64 gigabytes for the netbook computer market. We are currently developing SSDs for the mainstream notebook and desktop computer markets and we believe that SSDs will become a major application for NAND flash memory over the next several years as they are increasingly likely to replace hard disk drives in a variety of computing solutions.
Our
Sales Channels
Our
products are delivered to end-users through worldwide retail storefronts and
also by bundling data storage cards with host products or by embedding our data
storage products in host devices sold by our OEM customers.
Our sales
are made through the following channels:
-
Retail. We sell SanDisk branded products directly or through distributors to consumer electronics stores, office superstores, photo retailers, mobile phone stores, mass merchants, catalog and mail order companies, internet and e-commerce retailers, drug stores, supermarkets and convenience stores.
We
support our retail sales channels with both direct sales representatives and
independent manufacturers’ representatives. Our sales activities are
organized into four regional territories: Americas; Europe, Middle East and
Africa, or EMEA; Asia Pacific, or APAC; and Japan.
-
OEM. We sell our products through OEM customers who bundle or embed our products in a large variety of digital consumer devices, including mobile phones, digital cameras, personal computers, or PCs, navigation devices and gaming products. We also sell products to OEM customers that offer the products under their own brand name in retail channels. We sell directly to OEMs and through distributors. We support our OEM customers through our direct sales representatives as well as through independent manufacturers’ representatives.
As of the
end of fiscal years 2009 and 2008, our backlog was $268 million and
$169 million, respectively. Because our customers can change or
cancel orders with limited or no penalty and limited advance notice prior to
shipment, we do not believe that backlog, as of any particular date, is
indicative of future sales.
Because
our products are primarily destined for consumers, our revenue is generally
highest in our fourth quarter due to the holiday buying season. In
addition, our revenue is generally lowest in the first quarter of the fiscal
year.
In fiscal
years 2009, 2008 and 2007, revenues from our top 10 customers and licensees
accounted for approximately 42%, 48% and 46% of our total revenues,
respectively. All customers were individually less than 10% of our
total revenues in fiscal years 2009 and 2007. In fiscal year 2008,
Samsung accounted for 13% of our total revenues through a combination of license
and royalty and product revenues. The composition of our major
customer base has changed over time, and we expect this pattern to continue as
our markets and strategies evolve. Sales to our customers are
generally made pursuant to purchase orders rather than long-term
contracts.
Technology
Since our
inception, we have focused our research, development and standardization efforts
on developing highly reliable, high-performance, cost-effective flash memory
storage products in small form factors to address a variety of emerging
markets. We have been actively involved in all aspects of this
development, including flash memory process development, module integration,
chip design, controller development and system-level integration, to help ensure
the creation of fully-integrated, broadly interoperable products that are
compatible with both existing and newly developed system
platforms. We successfully developed and commercialized 2-bits/cell
flash MLC, or X2, which enabled significant cost reduction and growth in NAND
flash supply. In addition, we have recently developed and
successfully commercialized 3-bits/cell flash MLC, or X3, and 4-bits/cell flash
MLC, or X4 technology. In addition, we are investing in the
development of three-dimensional, or 3D, memory architecture with multiple
read-write capabilities. We have also initiated, defined and
developed standards to meet new market needs and to promote wide acceptance of
these standards through interoperability and ease-of-use. We believe
our core technical competencies are in:
-
high-density flash memory process, module integration, device design and reliability;
-
securing data on a flash memory device;
-
controller design;
-
system-level integration;
-
compact packaging; and
-
low-cost system testing.
To
achieve compatibility with various electronic platforms regardless of the host
processors or operating systems used, we developed new capabilities in flash
memory chip design and created intelligent controllers. We also
developed an architecture that can leverage advances in process technology
designed for scalable, high-yielding, cost-effective and highly reliable
manufacturing processes. We design our products to be compatible with
industry-standard interfaces used in standard operating systems for PCs, mobile
phones, gaming devices, digital media players and other consumer and industrial
products.
Our
patented intelligent controller technology, with its advanced defect management
system, permits our flash storage card products to achieve a high level of
reliability and longevity. Each one of our flash devices
contains millions of flash memory cells. A failure in any one of
these cells can result in loss of data such as picture files, and this can occur
several years into the life of a flash storage card. The controller
chip inside our cards is designed to detect such defects and recover data under
most standard conditions.
Patents
and Licenses
We rely
on a combination of patents, trademarks, copyright and trade secret laws,
confidentiality procedures and licensing arrangements to protect our
intellectual property rights. See Item 1A, “Risk
Factors.”
As of the
end of fiscal year 2009, we owned, or had rights to, more than 1,400 United
States, or U.S., patents and more than 700 foreign patents. We had
more than 1,350 patent applications pending in the U.S., and had foreign
counterparts pending on many of the applications in multiple
jurisdictions. We continually seek additional U.S. and international
patents on our technology.
We have
various patent licenses with several companies including, among others, Hynix,
Intel Corporation, or Intel, Lexar Media, Inc., or Lexar, a subsidiary of Micron
Technology, Inc., or Micron, Panasonic, Renesas Technology Corporation, or
Renesas, Samsung, Sharp Electronics KK, or Sharp, Sony and
Toshiba. From time-to-time, we enter into discussions with other
companies regarding potential license agreements for our patents. In
the three years ended January 3, 2010, we have generated $1.37 billion in
revenue from license agreements.
Trade
secrets and other confidential information are also important to our
business. We protect our trade secrets through confidentiality and
invention assignment agreements.
Supply Chain
Our
supply chain is an important competitive advantage and is comprised of the
following:
-
Silicon Sourcing. All of our flash memory card products require silicon chips for the memory and controller components. The majority of our memory is supplied from the flash ventures with Toshiba. This represents captive memory supply and we are obligated to take our share of the output from the flash ventures with Toshiba or pay the fixed costs associated with that capacity. See “Ventures with Toshiba.” From time-to-time, we also purchase non-captive NAND memory supply primarily from Toshiba, Samsung and Hynix. We source our 3D one-time programmable, memory on a foundry basis at Taiwan Semiconductor Manufacturing Company, Ltd., or TSMC. We are guaranteed a certain amount of the output from Toshiba, Samsung and Hynix if we provide orders within a required lead time; however we are not obligated to purchase the guaranteed supply unless we provide an order for future purchases. Our controller wafers are currently supplied by Semiconductor Manufacturing International Corporation, or SMIC, TSMC, Tower Semiconductor Ltd., or Tower, and United Microelectronics Corporation, or UMC.
-
Assembly and Testing. We sort and test our wafers at Toshiba in Yokkaichi, Japan, and Ardentec Corporation in Taiwan. Our flash memory products are assembled in both our in-house assembly and test facility in Shanghai, China, and through our network of contract manufacturers, including STATS ChipPAC Ltd., or STATS ChipPAC, in China, and Siliconware Precision Industries Co., Ltd., or SPIL, in Taiwan. Our packaged memory final test, card assembly and card test is performed at our in-house facility and at subcontractors such as SPIL and United Test and Assembly Center Ltd., in Taiwan, and Beautiful Enterprise Co., Ltd., Flextronics International Ltd., or Flextronics, Global Brands Manufacture Ltd. and STATS ChipPAC, in China. We believe the use of both our in-house assembly and test facility as well as subcontractors reduces the cost of our operations, provides flexibility and gives us access to increased production capacity.
Ventures
with Toshiba
We and
Toshiba have successfully partnered in several flash memory manufacturing
business ventures, which provide us leading edge, cost competitive NAND wafers
for our end products. From May 2000 to May 2008, FlashVision Ltd., or
FlashVision, operated and produced 200-millimeter NAND flash memory
wafers. In September 2004, we and Toshiba formed Flash Partners
Ltd., or Flash Partners, which produces 300-millimeter NAND flash wafers in
Toshiba’s Fab 3. In July 2006, we and Toshiba formed Flash
Alliance Ltd., or Flash Alliance, a 300-millimeter wafer fabrication facility
which began initial production in the third quarter of fiscal year 2007 in
Toshiba’s Fab 4.
With the Flash Partners and Flash Alliance ventures,
hereinafter collectively referred to as Flash Ventures, located at Toshiba’s Yokkaichi Japan operations, we
and Toshiba collaborate in the development and manufacture of NAND-based flash
memory wafers using the semiconductor manufacturing equipment owned or leased by
each venture entity. We hold a 49.9% ownership position in each of
the current Toshiba and SanDisk venture entities. Each venture entity
purchases wafers from Toshiba at cost and then resells those wafers to us and
Toshiba at cost plus a mark-up. We are committed to purchase half of
each venture’s NAND wafer supply or pay for half of the venture’s fixed costs
regardless of the output we choose to purchase. We are also committed
to fund 49.9% of each venture’s costs to the extent that the venture’s revenues
from wafer sales to us and Toshiba are insufficient to cover these
costs. The investments in each venture entity are shared equally
between us and Toshiba. Our committed capacity from Flash Ventures
was approximately 1.5 million wafers per year as of the end of fiscal year
2009. In addition, we have the right to purchase a certain amount of
wafers from Toshiba on a foundry basis.
Competition
We face
competition from numerous flash memory semiconductor manufacturers and
manufacturers and resellers of flash memory cards, USB drives and digital audio
players. We also face competition from manufacturers of hard disk
drives and from new technologies.
We
believe that our ability to compete successfully depends on a number of factors,
including:
-
price, quality and on-time delivery of products;
-
product performance, availability and differentiation;
-
success in developing new applications and new market segments;
-
sufficient availability of cost-efficient supply;
-
efficiency of production;
-
ownership and monetization of intellectual property rights;
-
timing of new product announcements or introductions;
-
the development of industry standards and formats;
-
the number and nature of competitors in a given market; and
-
general market and economic conditions.
We
believe our key competitive advantages are:
-
our tradition of technological innovation and standards creation which enables us to grow the overall market for flash memory;
-
our intellectual property ownership, in particular our patents and MLC manufacturing know-how, provides us with license and royalty revenue as well as certain cost advantages;
-
Flash Ventures provide us with leading edge, low-cost flash memory;
-
we market and sell a broader range of card formats than any of our competitors, which gives us an advantage in obtaining strong retail and OEM distribution;
-
we have global retail distribution of our products through worldwide retail storefronts; and
-
we have worldwide leading market share in removable flash cards and UFDs.
Our
competitors include:
Flash Memory Semiconductor
Manufacturers. Our
primary semiconductor competitors include Hynix, Intel, Micron, Samsung, and
Toshiba.
Flash Memory Card and USB Drive
Manufacturers. Our
primary card and USB drive competitors include, among others, A-DATA Technology
Co., Ltd., or A-DATA, Buffalo, Inc., or Buffalo, Chips and More GmbH, or
CnMemory, Dane-Elec Memory, or Dane-Elec, Eastman Kodak Company, or Kodak,
Elecom Co., Ltd., or Elecom, FUJIFILM Corporation, or FUJI, Gemalto N.V., or
Gemalto, Hagiwara Sys-Com Co., Ltd., or Hagiwara, Hama GmbH & Co. KG, or
Hama, Hynix, Imation Corporation, or Imation, and its division Memorex Products,
Inc., or Memorex, I-O Data Device, Inc., or I-O Data, Kingmax Digital, Inc., or
Kingmax, Kingston Technology Company, Inc., or Kingston, Lexar, Micron, Netac
Technology Co., Ltd., or Netac, Panasonic, PNY Technologies, Inc., or PNY, Power
Quotient International Co., Ltd., or PQI, RITEK Corporation, or RITEK, Samsung,
Sony, STMicroelectronics N.V., or STMicroelectronics, Toshiba, Transcend
Information, Inc., or Transcend, and Verbatim Americas LLC, or
Verbatim.
Solid-State Drive and Hard Disk
Drive Manufacturers. Our SSDs face competition from other
manufacturers of SSDs, including Intel, Kingston, Micron, Samsung, STEC, Inc.,
or STEC, Toshiba, and others such as OCZ Technology Group, Inc. Our
SSDs also face competition from hard disk drives, which are offered by companies
including, among others, Seagate Technology LLC, or Seagate, Samsung and Western
Digital Corporation, or Western Digital.
Digital Audio/Video Player
Manufacturers. Our
digital audio/video players face strong competition from products offered by
companies, including Apple Inc., or Apple, ARCHOS Technology, or ARCHOS, Coby
Electronics Corporation, or Coby, Creative Technology Ltd., or Creative,
Koninklijke Philips Electronics N.V., or Royal Philips Electronics, Microsoft
Corporation, or Microsoft, Samsung and Sony.
Other Technologies. Other
technologies compete with our product offerings and many companies are
attempting to develop memory cells that use different designs and materials in
order to reduce memory costs. These potential competitive
technologies include several types of 3D memory, a version of which we are
jointly developing with Toshiba, phase-change, ReRAM, vertical or stacked NAND
and charge-trap flash technologies.
Additional
Information
We file
reports and other information with the Securities and Exchange Commission, or
SEC, including annual reports on Form 10-K, quarterly reports on Form 10-Q,
current reports on Form 8-K and proxy or information
statements. Those reports and statements and all amendments to those
documents filed or furnished pursuant to Section 13(a) or 15(d) of the
Securities Exchange Act (1) may be read and copied at the SEC’s Public Reference
Room at 100 F Street, N.E., Washington, D.C. 20549, (2) are available at the
SEC’s internet site (http://www.sec.gov), which contains reports, proxy and
information statements and other information regarding issuers that file
electronically with the SEC and (3) are available free of charge through our
website as soon as reasonably practicable after electronic filing with, or
furnishing to, the SEC. Information regarding the operation of the
SEC’s Public Reference Room may be obtained by calling the SEC at
1-800-SEC-0330. Our website address is
www.sandisk.com. Information on our website is not incorporated by
reference nor otherwise included in this report. Our principal
executive offices are located at 601 McCarthy Blvd., Milpitas, CA 95035, and our
telephone number is (408) 801-1000. SanDisk is a trademark of
SanDisk Corporation, and is registered in the U.S. and other
countries. Other brand names mentioned herein are for identification
purposes only and may be the trademarks of their respective
holder(s).
We have a
corporate governance webpage. You can access information about
SanDisk’s corporate governance at http://investor.sandisk.com by clicking on the
“Corporate Governance” link found along the left pane of the
webpage. We also have a corporate social responsibility, or CSR,
webpage. You can access information about SanDisk’s CSR policies and
initiatives at
http://www.sandisk.com/about-sandisk/corporate-social-responsibility.
Employees
As of
January 3, 2010, we had 3,267 full-time employees, including 1,236 in
research and development, 443 in sales and marketing, 398 in general and
administration, and 1,190 in operations. None of our employees are
represented by a collective bargaining agreement and we have never experienced
any work stoppage. We believe that our employee relations are
satisfactory.
Executive
Officers
Our
executive officers, who are elected by and serve at the discretion of our board
of directors, are as follows (all ages are as of
February 15, 2010):
|
Name
|
Age
|
Position
|
||
|
Eli
Harari
|
64
|
Chairman
of the Board and Chief Executive Officer
|
||
|
Sanjay
Mehrotra
|
51
|
President
and Chief Operating Officer
|
||
|
Judy
Bruner
|
51
|
Executive
Vice President, Administration and Chief Financial
Officer
|
||
|
Yoram
Cedar
|
57
|
Executive
Vice President, OEM Business and Corporate
Engineering
|
Dr. Eli
Harari, the founder of SanDisk, has served as Chief Executive Officer and as a
director of SanDisk since June 1988. He was appointed Chairman
of the Board in June 2006. Dr. Harari also served as President
from June 1988 to June 2006. From 1973 to 1988, Dr. Harari
held various technical and management positions with Waferscale Integration,
Inc., Honeywell Inc., Intel Corporation and Hughes Microelectronics
Ltd. Dr. Harari holds a Ph.D. in Solid State Sciences from Princeton
University and has more than 100 patents issued in the field of non-volatile
memories and storage systems. Dr. Harari currently serves on the
board of directors of Telegent Systems, Inc.
Sanjay
Mehrotra co-founded SanDisk in 1988 and has been our President since
June 2006. He continues to serve as our Chief Operating Officer,
a position he has held since 2001, and he has previously served as our Executive
Vice President, Vice President of Engineering, Vice President of Product
Development, and Director of Memory Design and Product
Engineering. Mr. Mehrotra has 30 years of experience in the
non-volatile semiconductor memory industry including engineering and management
positions at SanDisk, Integrated Device Technology, Inc., SEEQ Technology, Inc.,
Intel Corporation and Atmel Corporation. Mr. Mehrotra earned B.S. and
M.S. degrees in Electrical Engineering and Computer Sciences from the University
of California, Berkeley. He also holds several patents and has
published articles in the area of non-volatile memory design and flash memory
systems. Mr. Mehrotra currently serves on the board of directors of
Cavium Networks and on the Engineering Advisory Board of the University of
California, Berkeley.
Judy
Bruner has been our Chief Financial Officer and Executive Vice President,
Administration since June 2004. She served as a member of our
board of directors from July 2002 to July 2004. Ms. Bruner
has 30 years of financial management experience, including serving as Senior
Vice President and Chief Financial Officer of Palm, Inc., a provider of handheld
computing and communications solutions, from September 1999 until
June 2004. Prior to Palm, Inc., Ms. Bruner held financial
management positions with 3Com Corporation, Ridge Computers and Hewlett-Packard
Company. Since January 2009, Ms. Bruner has served on the board
of directors and the audit committee of Brocade Communications Systems,
Inc. Ms. Bruner holds a B.A. degree in Economics from the University
of California, Los Angeles and an M.B.A. degree from Santa Clara
University.
Yoram
Cedar is our Executive Vice President, OEM Business and Corporate
Engineering. Prior to October 2005, Mr. Cedar served as our
Senior Vice President of Engineering and Emerging Market Business
Development. Mr. Cedar began his career at SanDisk in 1998 when he
joined as Vice President of Systems Engineering. He has extensive
experience working in product definition, marketing and development of systems
and embedded flash-based semiconductors. Prior to SanDisk, he was the
Vice President of New Business Development at Waferscale Integration, Inc. and
has more than 30 years of experience in design and engineering management of
electronic systems. Mr. Cedar earned B.S. and M.S. degrees in
Electrical Engineering and Computer Architecture from Technion, Israel Institute
of Technology, Haifa, Israel.
|
RISK
FACTORS
|
Our operating
results may fluctuate significantly, which may adversely affect our financial
condition and our stock price. Our quarterly and annual
operating results have fluctuated significantly in the past and we expect that
they will continue to fluctuate in the future. Our results of
operations are subject to fluctuations and other risks, including, among
others:
-
competitive pricing pressures, resulting in lower average selling prices and lower or negative product gross margins;
-
expansion of supply from existing competitors and ourselves creating excess market supply, causing our average selling prices to decline faster than our costs;
-
unpredictable or changing demand for our products, particularly for certain form factors or capacities;
-
excess captive memory output or capacity which could result in write-downs for excess inventory, the application of lower of cost or market charges, fixed costs associated with under-utilized capacity, or other consequences;
-
inability to maintain or grow sales through our new channels to which we are selling private label products, wafers and components or potential loss of branded product sales as a result;
-
insufficient non-memory materials or capacity from our suppliers and contract manufacturers to meet demand; or increases in cost of non-memory materials or capacity;
-
price increases which could result in lower unit and gigabyte demand, potentially leading to reduced revenue and/or excess inventory;
-
less than anticipated demand, including a general economic weakness in our markets;
-
insufficient supply from captive flash memory sources and inability to obtain non-captive flash memory supply in the time frame necessary to meet demand;
-
increased purchases of non-captive flash memory, which typically cost more than captive flash memory and may be of less consistent quality;
-
increased memory component and other costs as a result of currency exchange rate fluctuations to the U.S. dollar, particularly with respect to the Japanese yen;
-
inability to adequately invest in future technologies and products while controlling operating expenses;
-
our license and royalty revenues may fluctuate or decline significantly in the future due to license agreement renewals, non-renewals or if licensees fail to perform on a portion or all of their contractual obligations;
-
inability to develop or unexpected difficulties or delays in developing, manufacturing with acceptable yields, or ramping, new technologies such as 32-nanometer or next generation process technology, 3-bits and 4-bits per cell NAND memory architecture, 3-Dimensional Read/Write, or 3D Read/Write, or other advanced, alternative technologies;
-
insufficient assembly and test capacity from our Shanghai facility or our contract manufacturers or disruptions in operations at any of these facilities;
-
difficulty in forecasting and managing inventory levels due to noncancelable contractual obligations to purchase materials, such as custom non-memory materials, and the need to build finished product in advance of customer purchase orders;
-
timing, volume and cost of wafer production from Flash Ventures as impacted by fab start-up delays and costs, technology transitions, yields or production interruptions;
-
disruption in the manufacturing operations of suppliers, including suppliers of sole-sourced components;
-
potential delays in the emergence of new markets and products for NAND-based flash memory and acceptance of our products in these markets;
-
timing of sell-through and the financial liquidity and strength of our distributors and retail customers;
-
errors or defects in our products caused by, among other things, errors or defects in the memory or controller components, including memory and non-memory components we procure from third-party suppliers; and
-
the other factors described under “Risk Factors” and elsewhere in this report.
Competitive pricing
pressures and excess supply have resulted in lower average selling prices and
negative product gross margins in the past and, if we do not experience adequate
price elasticity, our revenues may decline. For more than a
year through 2008, the NAND flash memory industry was characterized by supply
exceeding demand, which led to significant declines in average selling
prices. Price declines exceeded our cost declines in fiscal years
2008, 2007 and 2006. Significant price declines resulted in negative
product gross margins in fiscal year 2008 and the first quarter of fiscal year
2009. Price declines may be influenced by, among other factors,
supply exceeding demand, macroeconomic factors, technology transitions,
conversion of industry DRAM capacity to NAND and new technologies or other
strategic actions taken by us or our competitors to gain market
share. If our technology transitions take longer or are more costly
than anticipated to complete, or our cost reductions fail to keep pace with the
rate of price declines, our product gross margins and operating results will be
negatively impacted, which could lead to quarterly or annual net
losses.
Over our
history, price decreases have generally been more than offset by increased unit
demand and demand for products with increased storage
capacity. However, in fiscal year 2008 and the first half of 2009,
price declines outpaced unit and megabyte growth resulting in reduced revenue as
compared to prior comparable periods. There can be no assurance that
current and future price reductions will result in sufficient demand for
increased product capacity or unit sales, which could harm our revenue and
margins.
Price increases
could reduce our overall product revenues and harm our financial
position. In the first half of fiscal year 2009, we increased
prices in order to improve profitability. Price increases can result
in reduced growth in gigabyte demand or even an absolute reduction in gigabyte
demand. For example, in the second quarter of fiscal year 2009, our
average selling price per gigabyte increased 12% and our gigabytes sold
decreased 7%, both on a sequential quarter basis. If we continue to
raise prices in order to improve our profit margins, our product revenues may be
harmed and we may have excess inventory.
We require an
adequate level of product gross margins to continue to invest in our
business. We experienced negative product gross margins for
fiscal year 2008 and the first quarter of fiscal year 2009 due to sustained
aggressive industry price declines as well as inventory charges primarily due to
lower of cost or market write downs. While product gross margins
improved in fiscal year 2009, our ability to sustain sufficient product gross
margin and profitability on a quarterly or annual basis in the future depends in
part on industry and our supply/demand balance, our ability to reduce cost per
gigabyte at an equal or higher rate than price decline per gigabyte, our ability
to develop new products and technologies, the rate of growth of our target
markets, the competitive position of our products, the continued acceptance of
our products by our customers, and our ability to manage expenses. If
we fail to maintain adequate product gross margins and profitability, our
business and financial condition would be harmed and we may have to reduce,
curtail or terminate certain business activities.
Sales to a small
number of customers represent a significant portion of our revenues, and if we
were to lose one of our major licensees or customers, or experience any material
reduction in orders from any of our customers, our revenues and operating
results would suffer. In fiscal years
2009, 2008 and 2007, revenues from our top 10 customers or licensees accounted
for approximately 42%, 48% and 46% of our revenues. All customers
were individually less than 10% of our total revenues in fiscal years 2009 and
2007. In fiscal year
2008, Samsung accounted for 13% of our total revenues through a combination of
license and royalty and product revenues. The composition of our
major customer base has changed over time, including shifts between OEM and
retail-based customers, and we expect fluctuations to continue as our markets
and strategies evolve, which could make our revenues less predictable from
period-to-period. If we were to lose one of our major customers or
licensees, or experience any material reduction in orders from any of our
customers or in sales of licensed products by our licensees, our revenues and
operating results would suffer. Our non-compliance with the
contractual terms of significant customer contracts may harm the business
covered under these contracts and our financial
results. Additionally, our license and royalty revenues may decline
significantly in the future as our existing license agreements and patents
expire or if licensees fail to perform on a portion or all of their contractual
obligations. As an example, we expect our license and royalty
revenues will decline in fiscal year 2010 due to a new license agreement with an
existing licensee at a lower effective royalty rate as compared to the previous
license agreement. Our sales are generally made from standard
purchase orders rather than long-term contracts. Accordingly, our
customers may generally terminate or reduce their purchases from us at any time
without notice or penalty.
Our revenues depend
in part on the success of products sold by our OEM
customers. A significant portion of our sales are to OEMs,
which either bundle or embed our flash memory products with their products, such
as mobile phones, GPS devices and computers. Our sales to these
customers are dependent upon the OEMs choosing our products over those of our
competitors and on the OEMs’ ability to create, introduce, market and sell their
products successfully in their markets. Should our OEM customers be
unsuccessful in selling their current or future products that include our
products, or should they decide to not use our products, our results of
operations and financial condition could be harmed. In 2009, we added
OEMs to whom we are selling private label products, wafers and
components. The sales to these OEMs could be more variable than the
sales to our historical customer base, and these OEMs may be more inclined to
switch to an alternative supplier based on short-term price
fluctuations. Sales to these OEMs could also cause a decline in our
branded product sales. In addition, we are selling certain customized
products and if the intended customer does not purchase these products as
scheduled, we may incur excess inventory or rework costs.
Our business depends
significantly upon sales through retailers and distributors, and if our
retailers and distributors are not successful, we could experience reduced
sales, substantial product returns or increased price protection, any of which
would negatively impact our business, financial condition and results of
operations. A significant
portion of our sales are made through retailers, either directly or through
distributors. Sales through these channels typically include rights
to return unsold inventory and protection against price declines, as well as
participation in various cooperative marketing programs. As a result,
we do not recognize revenue until after the product has been sold through to the
end user, in the case of sales to retailers, or to our distributors’ customers,
in the case of sales to distributors. Price protection against
declines in our selling prices has the effect of reducing our deferred revenues
and eventually, our revenues. If our retailers and distributors are
not successful, due to weak consumer retail demand caused by an economic
downturn, decline in consumer confidence, or other factors, we could continue to
experience reduced sales as well as substantial product returns or price
protection claims, which would harm our business, financial condition and
results of operations. Except in limited circumstances, we do not
have exclusive relationships with our retailers or distributors, and therefore,
must rely on them to effectively sell our products over those of our
competitors. Certain of our retail and distributor partners are
experiencing financial difficulty and prolonged negative economic conditions
could cause liquidity issues for our retail and distributor customers and
channels. For example, two of our North American retail customers,
Circuit City Stores, Inc. and Ritz Camera Centers, Inc., filed for bankruptcy
protection in 2008 and 2009, respectively. Negative changes in
customer credit worthiness; the ability of our customers to access credit; or
the bankruptcy or shutdown of any of our significant retail or distribution
partners would harm our revenue and our ability to collect outstanding
receivable balances. In addition, we have certain retail customers to
which we provide inventory on a consigned basis, and a bankruptcy or shutdown of
these customers could preclude us from taking possession of our consigned
inventory, which could result in inventory charges.
The future growth of
our business depends on the development and performance of new markets and
products for NAND-based flash memory. Our future growth is
dependent on development of new markets, new applications and new products for
NAND-based flash memory. Historically, the digital camera market
provided the majority of our revenues, but it is now a more mature market, and
the mobile handset market has emerged as the largest segment of our
revenues. Other markets for flash memory include digital audio and
video players, USB drives and SSDs. We cannot assure you that the use
of flash memory in mobile handsets or other existing markets and products will
develop and grow fast enough, or that new markets will adopt NAND flash
technologies in general or our products in particular, to enable us to
grow. Our revenue and future growth is also significantly dependent
on international markets, and we may face difficulties entering or maintaining
sales in some international markets. Some international markets are
subject to a higher degree of commodity pricing or tariffs and import taxes than
in the U.S., subjecting us to increased risk of pricing and margin
pressure.
Our strategy of
investing in captive manufacturing sources could harm us if our competitors are
able to produce products at lower costs or if industry supply exceeds
demand. We secure captive sources of NAND through our
significant investments in manufacturing capacity. We believe that by
investing in captive sources of NAND, we are able to develop and obtain supply
at the lowest cost and access supply during periods of high
demand. Our significant investments in manufacturing capacity require
us to obtain and guarantee capital equipment leases and use available cash,
which could be used for other corporate purposes. To the extent we
secure manufacturing capacity and supply that is in excess of demand, or our
cost is not competitive with other NAND suppliers, we may not achieve an
adequate return on our significant investments and our revenues, gross margins
and related market share may be harmed. We may also incur increased
inventory or impairment charges related to our captive manufacturing investments
and may not be able to exit those investments without significant cost to
us. For example, we recorded charges of $121 million and
$63 million in fiscal year 2008 and the first quarter of fiscal year 2009,
respectively, for adverse purchase commitments associated with under utilization
of Flash Ventures’ capacity for the 90-day period in which we had non-cancelable
production plans utilizing less than our share of Flash Ventures’ full
capacity.
Our business and the
markets we address are subject to significant fluctuations in supply and demand
and our commitments to Flash Ventures may result in periods of significant
excess inventory. The start of production by Flash Alliance at
the end of fiscal year 2007 and the ramp of production in fiscal year 2008
increased our captive supply and resulted in excess inventory. While
we restructured and reduced our total capacity at Flash Ventures in the first
quarter of fiscal year 2009, our obligation to purchase 50% of the supply or pay
50% of the costs from Flash Ventures could continue to harm our business and
results of operations if our committed supply exceeds demand for our
products. The adverse effects could include, among other things,
significant decreases in our product prices, and significant excess, obsolete or
lower of cost or market inventory write-downs, or under-utilization charges such
as those we experienced in fiscal year 2008, which would harm our gross margins
and could result in the impairment of our investments in Flash
Ventures.
We continually seek
to develop new applications, products, technologies and standards, which may not
be widely adopted by consumers or, if adopted, may reduce demand for our older
products; and our competitors seek to develop new standards which could reduce
demand for our products. We continually devote significant
resources to the development of new applications, products and standards and the
enhancement of existing products and standards with higher memory capacities and
other enhanced features. Any new applications, products,
technologies, standards or enhancements we develop may not be commercially
successful. The success of new product introductions is dependent on
a number of factors, including market acceptance, our ability to manage risks
associated with new products and production ramp issues. New
applications, such as the adoption of flash-based SSDs that are designed to
replace hard disk drives in devices such as notebook and desktop computers, can
take several years to develop. We cannot guarantee that manufacturers
will adopt SSDs or that this market will grow as we anticipate. For
the SSD market to become sizeable, the cost of flash memory must decline
significantly from current levels so that the product cost for the end consumers
is compelling. We believe this will require us to implement
multi-level cell, or MLC, technology into our SSDs, and that will require us to
develop highly capable controllers. There can be no assurance that
our MLC-based SSDs will complete development, will be able to meet the
specifications required to gain customer qualification and acceptance or will be
delivered to the market on a timely basis. For example, in July 2009,
we communicated that we were late to the market with our G3 SSD
product. Other new products, such as slotMusic™,
slotRadio™ and
our pre-loaded flash memory cards, may not gain market acceptance, and we may
not be successful in penetrating the new markets that we
target. Sony’s recent announcement that it intends to transition its
future devices from the Memory Stick®
format to the SD format could negatively impact our market share or margins
since there are a greater number of competitors selling SD
products.
New
applications may require significant up-front investment with no assurance of
long-term commercial success or profitability. As we introduce new
standards or technologies, it can take time for these new standards or
technologies to be adopted, for consumers to accept and transition to these new
standards or technologies and for significant sales to be generated, if at
all.
Competitors
or other market participants could seek to develop new standards for flash
memory products that, if accepted by device manufacturers or consumers, could
reduce demand for our products. For example, certain handset
manufacturers and flash memory chip producers are currently advocating and
developing a new standard, referred to as Universal Flash Storage, or UFS, for
flash memory cards used in mobile phones. Intel Corporation, or
Intel, and Micron Technology, Inc., or Micron, have also developed a new
specification for a NAND flash interface, called Open NAND Flash Interface, or
ONFI, which would be used primarily in computing devices. Broad
acceptance of new standards, technologies or products may reduce demand for some
of our products that may be based on different standards. If this
decreased demand is not offset by increased demand for new form factors or
products that we offer, our results of operations would be harmed.
Alternative
storage solutions such as high bandwidth wireless or internet-based storage,
including cloud computing, could reduce the need for physical flash storage
within electronic devices. These alternative technologies could
negatively impact the overall market for flash-based products, which could
seriously harm our results of operations.
Consumer
devices that use NAND-based flash memory do so in either a removable card or an
embedded format. We offer NAND-based flash memory products in both
categories; however, our market share is strongest for removable flash memory
products. If designers and manufacturers of consumer devices,
including mobile phones, increase their usage of embedded flash memory, we may
not be able to sustain our market share. In addition, if NAND-based
flash memory is used in an embedded format, we would have less opportunity to
influence the capacity of the NAND-based flash products and we would not have
the opportunity for additional after-market retail sales related to these
consumer devices or mobile phones. Any loss of market share or
reduction in the average capacity of our product sales or any loss in our retail
after-market opportunity could harm our operating results and business
condition.
In
addition, we are investing in future alternative technologies, particularly our
3D semiconductor memory. We are investing significant resources to
develop this technology for multiple read-write applications; however, there can
be no assurance that we will be successful in developing this or other
technologies or that we will be able to achieve the yields, quality or
capacities to be cost competitive with existing or other alternative
technologies.
We face competition
from numerous manufacturers and marketers of products using flash memory, as
well as from manufacturers of new and alternative technologies, and if we cannot
compete effectively, our results of operations and financial condition will
suffer. Our competitors include many large companies that may
have greater advanced wafer manufacturing capacity, substantially greater
financial, technical, marketing and other resources and more diversified
businesses than we do, which may allow them to produce flash memory chips in
high volumes at low costs and to sell these flash memory chips themselves or to
our flash card competitors at a low cost. Some of our competitors may
sell their flash memory chips at or below their true manufacturing costs to gain
market share and to cover their fixed costs. Such practices occurred
in the DRAM industry during periods of excess supply and resulted in substantial
losses in the DRAM industry. Our primary semiconductor competitors
include Hynix Semiconductor, Inc., or Hynix, Intel, Micron, Samsung and
Toshiba. These current and future competitors produce or could
produce alternative flash or other memory technologies that compete against our
NAND-based flash memory technology or our alternative technologies, which may
reduce demand or accelerate price declines for NAND. Furthermore, the
future rate of scaling of the NAND-based flash technology design that we employ
may slow down significantly, which would slow down cost reductions that are
fundamental to the adoption of flash memory technology in new
applications. If the scaling of NAND-based flash technology slows
down or alternative technologies prove to be more economical, our business would
be harmed, and our investments in captive fabrication facilities could be
impaired. Our cost reduction activities are dependent in part on the
purchase of new specialized manufacturing equipment, and if this equipment is
not generally available or is allocated to our competitors, our ability to
reduce costs could be limited.
We also
compete with flash memory card manufacturers and resellers. These
companies purchase or have a captive supply of flash memory components and
assemble memory cards. Our primary competitors currently include,
among others, A-DATA, Buffalo, CnMemory, Dane-Elec Memory, Kodak, Elecom, FUJI,
Gemalto, Hagiwara, Hama, Imation, Memorex, I-O Data, Kingmax, Kingston, Lexar,
Micron, Netac, Panasonic, PNY, PQI, RITEK, Samsung, Sony, STMicroelectronics,
Toshiba, Transcend and Verbatim.
Some of
our competitors have substantially greater resources than we do, have well
recognized brand names or have the ability to operate their business on lower
margins than we do. The success of our competitors may adversely
affect our future revenues or margins and may result in the loss of our key
customers. For example, Toshiba and other manufacturers have
increased their market share of flash memory cards for mobile phones, including
the microSD™ card, which have been a significant driver of our
growth. In the digital audio market, we face competition from well
established companies such as Apple, ARCHOS, Coby, Creative, Royal Philips
Electronics, Microsoft, Samsung and Sony. In the USB flash drive
market, we face competition from a large number of competitors, including Hynix,
Imation, Kingston, Lexar, Memorex, PNY, Sony and Verbatim. In the
market for SSDs, we face competition from large NAND flash producers such as
Intel, Samsung and Toshiba, as well as from hard drive manufacturers, such as
Seagate, Samsung, Western Digital and others, who have established relationships
with computer manufacturers. We also face competition from
third-party solid-state drive solutions providers such as A-DATA, Kingston,
Phison Electronics Corporation, STEC and Transcend.
We sell
flash memory in the form of white label cards, wafers or components to certain
companies who sell flash products that may ultimately compete with SanDisk
branded products in the retail or OEM channels. This could harm the
SanDisk branded market share and reduce our sales and profits.
Furthermore,
many companies are pursuing new or alternative technologies or alternative forms
of NAND, such as phase-change and charge-trap flash technologies which may
compete with NAND-based flash memory. New or alternative
technologies, if successfully developed by our competitors, and if we are unable
to scale our technology on an equivalent basis, could provide an advantage to
these competitors.
These new
or alternative technologies may enable products that are smaller, have a higher
capacity, lower cost, lower power consumption or have other
advantages. If we cannot compete effectively, our results of
operations and financial condition will suffer.
We
believe that our ability to compete successfully depends on a number of factors,
including:
-
price, quality and on-time delivery of products;
-
product performance, availability and differentiation;
-
success in developing new applications and new market segments;
-
sufficient availability of cost-efficient supply;
-
efficiency of production;
-
ownership and monetization of intellectual property rights;
-
timing of new product announcements or introductions;
-
the development of industry standards and formats;
-
the number and nature of competitors in a given market; and
-
general market and economic conditions.
There can
be no assurance that we will be able to compete successfully in the
future.
Our financial
performance can depend significantly on worldwide economic conditions and the
related impact on levels of consumer spending, which have deteriorated in many
countries and regions, including the U.S., and may not recover in the
foreseeable future. Demand for our products is adversely
affected by negative macroeconomic factors affecting consumer
spending. The tightening of consumer credit, low level of consumer
liquidity, and volatility in credit and equity markets have weakened consumer
confidence and decreased consumer spending. These and other economic
factors have reduced demand growth for our products and harmed our business,
financial condition and results of operations, and to the extent such economic
conditions continue, they could cause further harm to our business, financial
condition and results of operations.
Our license and
royalty revenues may fluctuate or decline significantly in the future due to
license agreement renewals or if licensees fail to perform on a portion or all
of their contractual obligations. If our existing licensees do
not renew their licenses upon expiration and we are not successful in signing
new licensees in the future, our license revenue, profitability, and cash
provided by operating activities would be harmed. For example, in the
fourth quarter of fiscal year 2009, our license and royalty revenues declined
due to a new license agreement with an existing licensee at a lower effective
royalty rate as compared to the previous license agreement. To the
extent that we are unable to renew license agreements under similar terms or at
all, our financial results would be adversely impacted by the reduced license
and royalty revenue and we may incur significant patent litigation costs to
enforce our patents against these licensees. If our licensees fail to
perform on a portion or all of their contractual obligations, we may incur costs
to enforce the terms of our licenses and there can be no assurance that our
enforcement and collection efforts will be effective. In addition, we
may be subject to disputes, claims or other disagreements on the timing, amount
or collection of royalties or license payments under our existing license
agreements.
Under certain
conditions, a portion or the entire outstanding lease obligations related to
Flash Ventures’ master equipment lease agreements could be accelerated, which
would harm our business, results of operations, cash flows, and liquidity.
Flash
Ventures’ master lease agreements contain customary covenants for Japanese lease
facilities. In addition to containing customary events of default
related to Flash Ventures that could result in an acceleration of Flash
Ventures’ obligations, the master lease agreements contain an acceleration
clause for certain events of default related to us as guarantor, including,
among other things, our failure to maintain a minimum stockholders’ equity of at
least $1.51 billion, and our failure to maintain a minimum corporate rating
of either BB- from Standard & Poors, or S&P, or Moody’s Corporation, or
a minimum corporate rating of BB+ from Rating & Investment Information,
Inc., or R&I. As of January 3, 2010, Flash Ventures were in
compliance with all of their master lease covenants. While our
S&P credit rating was B, two levels below the required minimum corporate
rating threshold from S&P, our R&I credit rating was BBB-, one level
above the required minimum corporate rating threshold from R&I.
If
R&I were to downgrade our credit rating below the minimum corporate rating
threshold, Flash Ventures would become non-compliant with certain covenants
under its master equipment lease agreements and would be required to negotiate a
resolution to the non-compliance to avoid acceleration of the obligations under
such agreements. Such resolution could include, among other things,
supplementary security to be supplied by us, as guarantor, or increased interest
rates or waiver fees, should the lessors decide they need additional collateral
or financial consideration. If an event of default occurs and if we
failed to reach a resolution, we may be required to pay a portion or the entire
outstanding lease obligations up to $1.07 billion, based upon the exchange
rate at January 3, 2010, covered by our guarantee under the Flash
Ventures master lease agreements, which would significantly reduce our cash
position and may force us to seek additional financing, which may or may not be
available.
The semiconductor
industry is subject to significant downturns that have harmed our business,
financial condition and results of operations in the past and may do so in the
future. The semiconductor industry is highly cyclical and is
characterized by constant and rapid technological change, rapid product
obsolescence, price declines, evolving standards, short product life cycles and
wide fluctuations in product supply and demand. The industry has
experienced significant downturns, often in connection with, or in anticipation
of, maturing product cycles of both semiconductor companies and their customers’
products and declines in general economic conditions. The flash
memory industry has recently experienced significant excess supply, reduced
demand, high inventory levels, and accelerated declines in selling
prices. If we again experience oversupply of NAND-based flash
products, we may be forced to hold excessive inventory, sell our inventory below
cost, and record inventory write-downs, all of which would place additional
pressure on our results of operation and our cash position.
We depend on Flash
Ventures and third parties for silicon supply and any disruption or shortage in
our supply from these sources will reduce our revenues, earnings and gross
margins. All of our flash memory products require silicon
supply for the memory and controller components. The substantial
majority of our flash memory is currently supplied by Flash Ventures and to a
much lesser extent by third-party silicon suppliers. Any disruption
or shortage in supply of flash memory from our captive or non-captive sources
would harm our operating results. The risks of supply disruption are
magnified at Toshiba’s Yokkaichi, Japan operations, where Flash Ventures are
operated and Toshiba’s foundry capacity is located. Earthquakes and
power outages have resulted in production line stoppages and loss of wafers in
Yokkaichi and similar stoppages and losses may occur in the
future. For example, in the first quarter of fiscal year 2006, a
brief power outage occurred at Fab 3, which resulted in a loss of wafers and
significant costs associated with bringing the fab back on line. In
addition, the Yokkaichi location is often subject to earthquakes, which could
result in production stoppage, a loss of wafers and the incurrence of
significant costs. Moreover, Toshiba’s employees that produce Flash
Ventures’ products are covered by collective bargaining agreements and any
strike or other job action by those employees could interrupt our wafer supply
from Flash Ventures. If we have disruption in our captive wafer
supply or if our non-captive sources fail to supply wafers in the amounts and at
the times we expect, or we do not place orders with sufficient lead time to
receive non-captive supply, we may not have sufficient supply to meet demand and
our operating results could be harmed.
Currently,
our controller wafers are manufactured by SMIC, TSMC and UMC. Any
disruption in the manufacturing operations of our controller wafer vendors would
result in delivery delays, adversely affect our ability to make timely shipments
of our products and harm our operating results until we could qualify an
alternate source of supply for our controller wafers, which could take several
quarters to complete. In times of significant growth in global demand
for flash memory, demand from our customers may outstrip the supply of flash
memory and controllers available to us from our current sources. If
our silicon vendors are unable to satisfy our requirements on competitive terms
or at all, we may lose potential sales and market share, and our business,
financial condition and operating results may suffer. Any disruption
or delay in supply from our silicon sources could significantly harm our
business, financial condition and results of operations.
If actual
manufacturing yields are lower than our expectations, this may result in
increased costs and product shortages. The fabrication of our
products requires wafers to be produced in a highly controlled and ultra clean
environment. Semiconductor manufacturing yields and product
reliability are a function of both design and manufacturing process technology
and production delays may be caused by equipment malfunctions, fabrication
facility accidents or human error. Yield problems may not be
identified or improved until an actual product is manufactured and can be
tested. As a result, yield problems may not be identified until the
wafers are well into the production process. We have, from
time-to-time, experienced yields that have adversely affected our business and
results of operations. We have experienced adverse yields on more
than one occasion when we have transitioned to new generations of
products. If actual yields are low, we will experience higher costs
and reduced product supply, which could harm our business, financial condition
and results of operations. For example, if the production ramp and/or
yield of 32-nanometer 2-bits per cell and 3-bits per cell NAND technology wafers
does not increase as expected, our cost competitiveness would be harmed, we may
not have adequate supply or the right product mix to meet demand, and our
business, financial condition and results of operations will be
harmed.
We depend on our
captive assembly and test manufacturing facility in China and our business could
be harmed if this facility does not perform as planned. Our
reliance on our captive assembly and test manufacturing facility near Shanghai,
China has increased significantly and we now utilize this factory to satisfy a
significant portion of our assembly and test requirements, and also to produce
products with leading-edge technologies such as multi-stack die
packages. Any delays or interruptions in the production ramp or
targeted yields or any quality issues at our captive facility could harm our
results of operations and financial condition.
We depend on our
third-party subcontractors and our business could be harmed if our
subcontractors do not perform as planned. We rely on
third-party subcontractors for a portion of our wafer testing, IC assembly,
product assembly, product testing and order fulfillment. From
time-to-time, our subcontractors have experienced difficulty meeting our
requirements. If we are unable to increase the capacity of our
current subcontractors or qualify and engage additional subcontractors, we may
not be able to meet demand for our products. We do not have long-term
contracts with our existing subcontractors nor do we expect to have long-term
contracts with any new subcontractors. We do not have exclusive
relationships with any of our subcontractors, and therefore, cannot guarantee
that they will devote sufficient resources to manufacturing our
products. We are not able to directly control product delivery
schedules. Furthermore, we manufacture on a turnkey basis with some
of our subcontractors. In these arrangements, we do not have
visibility and control of their inventories of purchased parts necessary to
build our products or of the progress of our products through their assembly
line. Any significant problems that occur at our subcontractors, or
their failure to perform at the level we expect, could lead to product shortages
or quality assurance problems, either of which would have adverse effects on our
operating results.
In transitioning to
new processes, products and silicon sources, we face production and market
acceptance risks that may cause significant product delays, cost overruns or
performance issues that could harm our business. Successive
generations of our products have incorporated semiconductors with greater memory
capacity per chip. The transition to new generations of products,
such as products containing 32-nanometer process technologies and/or 3-bits per
cell and 4-bits per cell NAND technologies, is highly complex and requires new
controllers, new test procedures, potentially new equipment and
modifications to numerous aspects of any manufacturing processes, as well as
extensive qualification of the new products by our OEM customers and
us. There can be no assurance that these transitions or other future
technology transitions will occur on schedule or at the yields or costs that we
anticipate. If Flash Ventures encounters difficulties in
transitioning to new technologies, our cost per gigabyte may not remain
competitive with the costs achieved by other flash memory producers, which would
harm our gross margins and financial results. In addition, we could
face design, manufacturing and equipment challenges when transitioning to the
next generation of technologies beyond NAND. Any material delay in a
development or qualification schedule could delay deliveries and harm our
operating results. We have periodically experienced significant
delays in the development and volume production ramp-up of our
products. Similar delays could occur in the future and could harm our
business, financial condition and results of operations.
Our products may
contain errors or defects, which could result in the rejection of our products,
product recalls, damage to our reputation, lost revenues, diverted development
resources and increased service costs and warranty claims and
litigation. Our products are complex, must meet stringent user
requirements, may contain errors or defects and the majority of our products are
warrantied for up to ten years. Generally, our OEM customers have
more stringent requirements than other customers and increases in OEM product
revenue could require additional cost to test products or increase service costs
and warranty claims. Errors or defects in our products may be caused
by, among other things, errors or defects in the memory or controller
components, including components we procure from non-captive
sources. In addition, the substantial majority of our flash memory is
supplied by Flash Ventures, and if the wafers contain errors or defects, our
overall supply could be adversely affected. These factors could
result in the rejection of our products, damage to our reputation, lost
revenues, diverted development resources, increased customer service and support
costs, indemnification of our customer’s product recall costs, warranty claims
and litigation. We record an allowance for warranty and similar costs
in connection with sales of our products, but actual warranty and similar costs
may be significantly higher than our recorded estimate and result in an adverse
effect on our results of operations and financial condition.
Our new
products have, from time-to-time, been introduced with design and production
errors at a rate higher than the error rate in our established
products. We must estimate warranty and similar costs for new
products without historical information and actual costs may significantly
exceed our recorded estimates. Warranty and similar costs may be even
more difficult to estimate as we increase our use of non-captive
supply. Underestimation of our warranty and similar costs would have
an adverse effect on our results of operations and financial
condition.
From time-to-time,
we overestimate our requirements and build excess inventory, or underestimate
our requirements and have a shortage of supply, either of which harm our
financial results. The majority of our products are sold
directly or indirectly into consumer markets, which are difficult to accurately
forecast. Also, a substantial majority of our quarterly sales are
from orders received and fulfilled in that quarter. Additionally, we
depend upon timely reporting from our retail and distributor customers as to
their inventory levels and sales of our products in order to forecast demand for
our products. We have in the past significantly over-forecasted or
under-forecasted actual demand for our products. The failure to
accurately forecast demand for our products will result in lost sales or excess
inventory, both of which will harm our business, financial condition and results
of operations. In addition, we may increase our inventory in
anticipation of increased demand or as captive wafer capacity
ramps. If demand does not materialize, we may be forced to write-down
excess inventory or write-down inventory to the lower of cost or market, as was
the case in fiscal year 2008, which may harm our financial condition and results
of operations.
During
periods of excess supply in the market for our flash memory products, we may
lose market share to competitors who aggressively lower their
prices. In order to remain competitive, we may be forced to sell
inventory below cost. If we lose market share due to price
competition or if we must write-down inventory, our results of operations and
financial condition could be harmed. Conversely, under conditions of
tight flash memory supply, we may be unable to adequately increase our
production volumes or secure sufficient supply in order to maintain our market
share. In addition, longer than anticipated lead times for advanced
semiconductor manufacturing equipment or higher than expected equipment costs
could negatively impact our ability to meet our supply requirements or to reduce
future production costs. If we are unable to maintain market share,
our results of operations and financial condition could be harmed.
Our
ability to respond to changes in market conditions from our forecast is limited
by our purchasing arrangements with our silicon sources. Some of
these arrangements provide that the first three months of our rolling six-month
projected supply requirements are fixed and we may make only limited percentage
changes in the second three months of the period covered by our supply
requirement projections.
We have
some non-silicon components which have long-lead times requiring us to place
orders several months in advance of our anticipated demand. The
extended period of time to secure these long-lead time parts increases our risk
that forecasts will vary substantially from actual demand, which could lead to
excess inventory or loss of sales.
We rely on our
suppliers and contract manufacturers, some of which are the sole source of
supply for our non-memory components, and capacity limitations or the absence of
a back-up supplier exposes our supply chain to unanticipated disruptions or
potential additional costs. We do not have long-term supply
agreements with most of these vendors. From time-to-time, certain
materials may become difficult or more expensive to obtain which could impact
our ability to meet demand and could harm our profitability. Our
business, financial condition and operating results could be significantly
harmed by delays or reductions in shipments if we are unable to obtain
sufficient quantities of these components or develop alternative sources of
supply in a timely manner or at all.
Our global
operations and operations at Flash Ventures and third-party subcontractors are
subject to risks for which we may not be adequately
insured. Our global operations are subject to many risks
including errors and omissions, infrastructure disruptions, such as large-scale
outages or interruptions of service from utilities or telecommunications
providers, supply chain interruptions, third-party liabilities and fires or
natural disasters. No assurance can be given that we will not incur
losses beyond the limits of, or outside the scope of, coverage of our insurance
policies. From time-to-time, various types of insurance have not been
available on commercially acceptable terms or, in some cases at
all. We cannot assure you that in the future we will be able to
maintain existing insurance coverage or that premiums will not increase
substantially. We maintain limited insurance coverage and in some
cases no coverage for natural disasters and sudden and accidental environmental
damages as these types of insurance are sometimes not available or available
only at a prohibitive cost. For example, our test and assembly
facility in Shanghai, China, on which we have significant dependence, may not be
adequately insured against all potential losses. Accordingly, we may
be subject to an uninsured or under-insured loss in such
situations. We depend upon Toshiba to obtain and maintain sufficient
property, business interruption and other insurance for Flash
Ventures. If Toshiba fails to do so, we could suffer significant
unreimbursable losses, and such failure could also cause Flash Ventures to
breach various financing covenants. In addition, we insure against
property loss and business interruption resulting from the risks incurred at our
third-party subcontractors; however, we have limited control as to how those
sub-contractors run their operations and manage their risks, and as a result, we
may not be adequately insured.
We are exposed to
foreign currency exchange rate fluctuations that could negatively impact our
business, results of operations and financial condition. A
significant portion of our business is conducted in currencies other than the
U.S. dollar, which exposes us to adverse changes in foreign currency exchange
rates. These exposures may change over time as our business and
business practices evolve, and they could harm our financial results and cash
flows. Our most significant exposure is related to our purchases of
NAND flash memory from Flash Ventures, which are denominated in Japanese
yen. For example, in the last year, the Japanese yen has
significantly appreciated relative to the U.S. dollar and this has increased our
costs of NAND flash wafers, negatively impacting our gross margins and results
of operations. In addition, our investments in Flash Ventures are
denominated in Japanese yen and adverse changes in the exchange rate could
increase the cost to us of future funding or increase our exposure to asset
impairments. We also have foreign currency exposures related to
certain non-U.S. dollar-denominated revenue and operating expenses in Europe and
Asia. Additionally, we have exposures to emerging market currencies,
which can be extremely volatile. An increase in the value of the U.S.
dollar could increase the real cost to our customers of our products in those
markets outside the U.S. where we sell in dollars, and a weakened U.S. dollar
could increase local operating expenses and the cost of raw materials to the
extent purchased in foreign currencies. We also have significant
monetary assets and liabilities that are denominated in non-functional
currencies.
We enter
into foreign exchange forward and cross currency swap contracts to reduce the
impact of foreign currency fluctuations on certain foreign currency assets and
liabilities. In addition, we hedge certain anticipated foreign
currency cash flows with foreign exchange forward and option
contracts. We generally have not hedged our future investments and
distributions denominated in Japanese yen related to Flash
Ventures.
Our
attempts to hedge against currency risks may not be successful, resulting in an
adverse impact on our results of operations. In addition, if we do
not successfully manage our hedging program in accordance with current
accounting guidelines, we may be subject to adverse accounting treatment of our
hedging program, which could harm our results of operations. There
can be no assurance that this hedging program will be economically beneficial to
us. Further, the ability to enter into foreign exchange contracts
with financial institutions is based upon our available credit from such
institutions and compliance with covenants and/or other
restrictions. Operating losses, third party downgrades of our credit
rating or instability in the worldwide financial markets could impact our
ability to effectively manage our foreign currency exchange rate fluctuation
risk, which could negatively impact our business, results of operations and
financial condition.
We may need to raise
additional financing, which could be difficult to obtain, and which if not
obtained in satisfactory amounts may prevent us from funding Flash Ventures,
developing or enhancing our products, taking advantage of future opportunities,
growing our business or responding to competitive pressures or unanticipated
industry changes, any of which could harm our business. We
currently believe that we have sufficient cash resources to fund our operations
as well as our anticipated investments in Flash Ventures for at least the next
twelve months; however, we may decide to raise additional funds to maintain the
strength of our balance sheet, and we cannot be certain that we will be able to
obtain additional financing on favorable terms, if at all. The
current worldwide financing environment is challenging, which could make it more
difficult for us to raise funds on reasonable terms, or at all. From
time-to-time, we may decide to raise additional funds through equity, public or
private debt, or lease financings. If we issue additional equity
securities, our stockholders will experience dilution and the new equity
securities may have rights, preferences or privileges senior to those of
existing holders of common stock. If we raise funds through debt or
lease financing, we will have to pay interest and may be subject to restrictive
covenants, which could harm our business. If we cannot raise funds on
acceptable terms, if and when needed, our credit rating may be downgraded, and
we may not be able to develop or enhance our technology or products, fulfill our
obligations to Flash Ventures, take advantage of future opportunities, grow our
business or respond to competitive pressures or unanticipated industry changes,
any of which could harm our business.
We may be unable to
protect our intellectual property rights, which would harm our business,
financial condition and results of operations. We rely on a
combination of patents, trademarks, copyright and trade secret laws,
confidentiality procedures and licensing arrangements to protect our
intellectual property rights. In the past, we have been involved in
significant and expensive disputes regarding our intellectual property rights
and those of others, including claims that we may be infringing third-parties’
patents, trademarks and other intellectual property rights. We expect
that we will be involved in similar disputes in the future.
We cannot
assure you that:
-
any of our existing patents will continue to be held valid, if challenged;
-
patents will be issued for any of our pending applications;
-
any claims allowed from existing or pending patents will have sufficient scope or strength;
-
our patents will be issued in the primary countries where our products are sold in order to protect our rights and potential commercial advantage; or
-
any of our products or technologies do not infringe on the patents of other companies.
In
addition, our competitors may be able to design their products around our
patents and other proprietary rights. We also have patent
cross-license agreements with several of our leading
competitors. Under these agreements, we have enabled competitors to
manufacture and sell products that incorporate technology covered by our
patents. While we obtain license and royalty revenue or other
consideration for these licenses, if we continue to license our patents to our
competitors, competition may increase and may harm our business, financial
condition and results of operations.
There are
both flash memory producers and flash memory card manufacturers who we believe
may require a license from us. Enforcement of our rights often
requires litigation. If we bring a patent infringement action and are
not successful, our competitors would be able to use similar technology to
compete with us. Moreover, the defendant in such an action may
successfully countersue us for infringement of their patents or assert a
counterclaim that our patents are invalid or unenforceable. If we do
not prevail in the defense of patent infringement claims, we could be required
to pay substantial damages, cease the manufacture, use and sale of infringing
products, expend significant resources to develop non-infringing technology,
discontinue the use of specific processes, or obtain licenses to the technology
infringed.
For
example, on October 24, 2007, we initiated two patent infringement actions in
the United States District Court for the Western District of Wisconsin and one
action in the United States International Trade Commission, or ITC, against
certain companies that manufacture, sell and import USB flash drives,
CompactFlash®
cards, multimedia cards, MP3/media players and/or other removable flash
storage products. In this ITC action, an Initial Determination was
issued in April 2009 and a Final Determination was issued in October 2009
finding non-infringement of certain accused flash memory
products. There can be no assurance that we will be successful in
future patent infringement actions or that the validity of the asserted patents
will be preserved or that we will not face counterclaims of the nature described
above.
We and certain of
our officers are currently and may in the future be involved in litigation,
including litigation regarding our intellectual property rights or those of
third parties, which may be costly, may divert the efforts of our key personnel
and could result in adverse court rulings, which could materially harm our
business. We are involved in a
number of lawsuits, including among others, several cases involving our patents
and the patents of third parties. We are the plaintiff in some of
these actions and the defendant in other of these actions. Some of
the actions seek injunctions against the sale of our products and/or substantial
monetary damages, which if granted or awarded, could have a material adverse
effect on our business, financial condition and results of
operations.
We and
numerous other companies have been sued in the United States District Court of
the Northern District of California in purported consumer class actions alleging
a conspiracy to fix, raise, maintain or stabilize the pricing of flash memory,
and concealment thereof, in violation of state and federal laws. The
lawsuits purport to be on behalf of classes of purchasers of flash
memory. The lawsuits seek restitution, injunction and damages,
including treble damages, in an unspecified amount. We are unable to
predict the outcome of these lawsuits and investigations. The cost of
discovery and defense in these actions as well as the final resolution of these
alleged violations of antitrust laws could result in significant liability and
expense and may harm our business, financial condition and results of
operations.
Litigation
is subject to inherent risks and uncertainties that may cause actual results to
differ materially from our expectations. Factors that could cause
litigation results to differ include, but are not limited to, the discovery of
previously unknown facts, changes in the law or in the interpretation of laws,
and uncertainties associated with the judicial decision-making
process. If we receive an adverse judgment in any litigation, we
could be required to pay substantial damages and/or cease the manufacture, use
and sale of products. Litigation, including intellectual property
litigation, can be complex, can extend for a protracted period of time, can be
very expensive, and the expense can be unpredictable. Litigation
initiated by us could also result in counter-claims against us, which could
increase the costs associated with the litigation and result in our payment of
damages or other judgments against us. In addition, litigation may
divert the efforts and attention of some of our key personnel.
From
time-to-time, we have sued, and may in the future sue, third parties in order to
protect our intellectual property rights. Parties that we have sued
and that we may sue for patent infringement may
countersue us for infringing their patents. If we are held to
infringe the intellectual property or related rights of others, we may need to
spend significant resources to develop non-infringing technology or obtain
licenses from third parties, but we may not be able to develop such technology or acquire such licenses on
terms acceptable to us, or at all. We may also be required to pay
significant damages and/or discontinue the use of certain manufacturing or
design processes. In addition, we or our suppliers could be enjoined
from selling some or all of our respective products in one or more geographic
locations. If we or our suppliers are enjoined from selling any of
our respective products, or if we are required to develop new technologies or
pay significant monetary damages or are required to make substantial royalty
payments, our business would be harmed.
We may be
obligated to indemnify our current or former directors or employees, or former
directors or employees of companies that we have acquired, in connection with
litigation or regulatory investigations. These liabilities could be
substantial and may include, among other things, the costs of defending lawsuits
against these individuals; the cost of defending shareholder derivative suits;
the cost of governmental, law enforcement or regulatory investigations; civil or
criminal fines and penalties; legal and other expenses; and expenses associated
with the remedial measures, if any, which may be imposed.
We
continually evaluate and explore strategic opportunities as they arise,
including business combinations, strategic partnerships, collaborations, capital
investments and the purchase, licensing or sale of assets. Potential
continuing uncertainty surrounding these activities may result in legal
proceedings and claims against us, including class and derivative lawsuits on
behalf of our stockholders. We may be required to expend significant
resources, including management time, to defend these actions and could be
subject to damages or settlement costs related to these actions.
Moreover,
from time-to-time, we agree to indemnify certain of our suppliers and customers
for alleged patent infringement. The scope of such indemnity varies
but generally includes indemnification for direct and consequential damages and
expenses, including attorneys’ fees. We may, from time-to-time, be
engaged in litigation as a result of these indemnification
obligations. Third-party claims for patent infringement are excluded
from coverage under our insurance policies. A future obligation to
indemnify our customers or suppliers may have a material adverse effect on our
business, financial condition and results of operations.
For
additional information concerning legal proceedings, including the examples set
forth above, see Part I, Item 3, “Legal Proceedings.”
We may be unable to
license intellectual property to or from third parties as needed, which could
expose us to liability for damages, increase our costs or limit or prohibit us
from selling products. If we incorporate third-party
technology into our products or if we are found to infringe others’ intellectual
property, we could be required to license intellectual property from a third
party. We may also need to license some of our intellectual property
to others in order to enable us to obtain important cross-licenses to
third-party patents. We cannot be certain that licenses will be
offered when we need them, that the terms offered will be acceptable, or that
these licenses will help our business. If we do obtain licenses from
third parties, we may be required to pay license fees or royalty
payments. In addition, if we are unable to obtain a license that is
necessary to manufacture our products, we could be required to suspend the
manufacture of products or stop our product suppliers from using processes that
may infringe the rights of third parties. We may not be successful in
redesigning our products, or the necessary licenses may not be available under
reasonable terms.
Seasonality in our
business may result in our inability to accurately forecast our product purchase
requirements. Sales of our products in the consumer
electronics market are subject to seasonality. For example, sales
have typically increased significantly in the fourth quarter of each fiscal
year, sometimes followed by significant declines in the first quarter of the
following fiscal year. This seasonality makes it more difficult for
us to forecast our business, especially in the current global economic
environment and its corresponding decline in consumer confidence, which may
impact typical seasonal trends. If our forecasts are inaccurate, we
may lose market share or procure excess inventory or inappropriately increase or
decrease our operating expenses, any of which could harm our business, financial
condition and results of operations. This seasonality also may lead
to higher volatility in our stock price, the need for significant working
capital investments in receivables and inventory and our need to build inventory
levels in advance of our most active selling seasons.
Because of our
international business and operations, we must comply with numerous
international laws and regulations, and we are vulnerable to political
instability and other risks related to international
operations. Currently, a large portion of our revenues is
derived from our international operations, and all of our products are produced
overseas in China, Japan and Taiwan. We are, therefore, affected by
the political, economic, labor, environmental, public health and military
conditions in these countries.
For
example, China does not currently have a comprehensive and highly developed
legal system, particularly with respect to the protection of intellectual
property rights. This results, among other things, in the prevalence
of counterfeit goods in China. The enforcement of existing and future
laws and contracts remains uncertain, and the implementation and interpretation
of such laws may be inconsistent. Such inconsistency could lead to
piracy and degradation of our intellectual property
protection. Although we engage in efforts to prevent counterfeit
products from entering the market, those efforts may not be
successful. Our results of operations and financial condition could
be harmed by the sale of counterfeit products.
Our
international business activities could also be limited or disrupted by any of
the following factors:
-
the need to comply with foreign government regulation;
-
changes in diplomatic and trade relationships;
-
reduced sales to our customers or interruption to our manufacturing processes in the Pacific Rim that may arise from regional issues in Asia;
-
imposition of regulatory requirements, tariffs, import and export restrictions and other barriers and restrictions;
-
changes in, or the particular application of, government regulations;
-
duties and/or fees related to customs entries for our products, which are all manufactured offshore;
-
longer payment cycles and greater difficulty in accounts receivable collection;
-
adverse tax rules and regulations;
-
weak protection of our intellectual property rights;
-
delays in product shipments due to local customs restrictions; and
-
delays in research and development that may arise from political unrest at our development centers in Israel.
Our stock price and
convertible notes price have been, and may continue to be, volatile, which could
result in investors losing all or part of their investments. The market prices of
our stock and convertible notes have fluctuated significantly in the past and
may continue to fluctuate in the future. We believe that such
fluctuations will continue as a result of many factors, including financing
plans, future announcements concerning us, our competitors or our principal
customers regarding financial results or expectations, technological
innovations, industry supply or demand dynamics, new product introductions,
governmental regulations, the commencement or results of litigation or changes
in earnings estimates by analysts. In addition, in recent years the
stock market has experienced significant price and volume fluctuations and the
market prices of the securities of high-technology and semiconductor companies
have been especially volatile, often for reasons outside the control of the
particular companies. These fluctuations as well as general economic,
political and market conditions may have an adverse affect on the market price
of our common stock as well as the price of our outstanding convertible
notes.
We may engage in
business combinations that are dilutive to existing stockholders, result in
unanticipated accounting charges or otherwise harm our results of operations,
and result in difficulties in assimilating and integrating the operations,
personnel, technologies, products and information systems of acquired companies
or businesses. We continually evaluate and explore strategic
opportunities as they arise, including business combinations, strategic
partnerships, collaborations, capital investments and the purchase, licensing or
sale of assets. If we issue equity securities in connection with an
acquisition, the issuance may be dilutive to our existing
stockholders. Alternatively, acquisitions made entirely or partially
for cash would reduce our cash reserves.
Acquisitions
may require significant capital infusions, typically entail many risks and could
result in difficulties in assimilating and integrating the operations,
personnel, technologies, products and information systems of acquired
companies. We may experience delays in the timing and successful
integration of acquired technologies and product development through volume
production, unanticipated costs and expenditures, changing relationships with
customers, suppliers and strategic partners, or contractual, intellectual
property or employment issues. In addition, key personnel of an
acquired company may decide not to work for us. The acquisition of
another company or its products and technologies may also result in our entering
into a geographic or business market in which we have little or no prior
experience. These challenges could disrupt our ongoing business,
distract our management and employees, harm our reputation, subject us to an
increased risk of intellectual property and other litigation and increase our
expenses. These challenges are magnified as the size of the
acquisition increases, and we cannot assure you that we will realize the
intended benefits of any acquisition. Acquisitions may require large
one-time charges and can result in increased debt or contingent liabilities,
adverse tax consequences, substantial depreciation or deferred compensation
charges, the amortization of identifiable purchased intangible assets or
impairment of goodwill, any of which could have a material adverse effect on our
business, financial condition or results of operations.
Mergers
and acquisitions of high-technology companies are inherently risky and subject
to many factors outside of our control, and no assurance can be given that our
previous or future acquisitions will be successful and will not materially
adversely affect our business, operating results, or financial
condition. Failure to manage and successfully integrate acquisitions
could materially harm our business and operating results. Even when
an acquired company has already developed and marketed products, there can be no
assurance that such products will be successful after the closing, will not
cannibalize sales of our existing products, that product enhancements will be
made in a timely fashion or that pre-acquisition due diligence will have
identified all possible issues that might arise with respect to such
company. Failed business combinations, or the efforts to create a
business combination, can also result in litigation.
Our success depends
on our key personnel, including our executive officers, the loss of whom could
disrupt our business. Our success greatly depends on the
continued contributions of our senior management and other key research and
development, sales, marketing and operations personnel, including Dr. Eli
Harari, our founder, chairman and chief executive officer. We do not
have employment agreements with any of our executive officers and they are free
to terminate their employment with us at any time. Our success will
also depend on our ability to recruit additional highly skilled
personnel. Historically, a significant portion of our employee
compensation has been dependent on equity compensation, which is directly tied
to our stock price. Our employees continue to hold a number of equity
incentive awards that are underwater, and as a result, a significant portion of
our equity compensation has little or no retention value. We did not
pay any bonus in
2009 related to fiscal
year 2008. Furthermore, in 2009, we canceled our annual merit salary
increases, instituted forced shutdown days, and reduced certain employee
benefits to reduce costs. These actions or any further reduction in
compensation elements may make it more difficult for us to hire or retain key
personnel.
Terrorist attacks,
war, threats of war and government responses thereto may negatively impact our
operations, revenues, costs and stock price. Terrorist
attacks, U.S. military responses to these attacks, war, threats of war and any
corresponding decline in consumer confidence could have a negative impact on
consumer demand. Any of these events may disrupt our operations or
those of our customers and suppliers and may affect the availability of
materials needed to manufacture our products or the means to transport those
materials to manufacturing facilities and finished products to
customers. Any of these events could also increase volatility in the
U.S. and world financial markets, which could harm our stock price and may limit
the capital resources available to us and our customers or suppliers, or
adversely affect consumer confidence. We have substantial operations
in Israel including a development center in Northern Israel, near the border
with Lebanon, and a research center in Omer, Israel, which is near the Gaza
Strip, areas that have experienced significant violence and political
unrest. Turmoil and unrest in Israel or the Middle East could cause
delays in the development or production of our products. This could
harm our business and results of operations.
Natural disasters or
epidemics in the countries in which we or our suppliers or subcontractors
operate could negatively impact our operations. Our
operations, including those of our suppliers and subcontractors, are
concentrated in Milpitas, California; Raleigh, North Carolina; Brno, Czech
Republic; Astugi and Yokkaichi, Japan; Hsinchu and Taichung, Taiwan; and
Dongguan, Futian, Shanghai and Shenzen, China. In the past, these
areas have been affected by natural disasters such as earthquakes, tsunamis,
floods and typhoons, and some areas have been affected by epidemics, such as
avian flu or H1N1 flu. If a natural disaster or epidemic were to
occur in one or more of these areas, our operations could be significantly
impaired and our business may be harmed. This is magnified by the
fact that we do not have insurance for most natural disasters, including
earthquakes. This could harm our business and results of
operations.
We have recently
upgraded our enterprise-wide information systems and related controls, processes
and procedures, and any issues with the new systems could materially impact our
business operations and/or financial results. At the beginning
of the third quarter of fiscal year 2009, we implemented a new enterprise
resource planning, or ERP, system. Any ERP system problems, quality
issues or programming errors could impact our continued ability to successfully
operate our business or to timely and accurately report our financial
results. In addition, any distraction of our workforce due to the new
systems could harm our business or results of operations.
Anti-takeover
provisions in our charter documents, stockholder rights plan and in Delaware law
could discourage or delay a change in control and, as a result, negatively
impact our stockholders. We have taken a number of actions
that could have the effect of discouraging a takeover attempt. For
example, we have a stockholders’ rights plan that would cause substantial
dilution to a stockholder, and substantially increase the cost paid by a
stockholder, who attempts to acquire us on terms not approved by our board of
directors. This could discourage an acquisition of us. In
addition, our certificate of incorporation grants our board of directors the
authority to fix the rights, preferences and privileges of and issue up to
4,000,000 shares of preferred stock without stockholder action (2,000,000 of
which have already been reserved under our stockholder rights
plan). Issuing preferred stock could have the effect of making it
more difficult and less attractive for a third party to acquire a majority of
our outstanding voting stock. Preferred stock may also have other
rights, including economic rights senior to our common stock that could have a
material adverse effect on the market value of our common stock. In
addition, we are subject to the anti-takeover provisions of Section 203 of the
Delaware General Corporation Law. This section provides that a
corporation may not engage in any business combination with any interested
stockholder, defined broadly as a beneficial owner of 15% or more of that
corporation’s voting stock, during the three-year period following the time that
a stockholder became an interested stockholder. This provision could
have the effect of delaying or discouraging a change of control of
SanDisk.
Unanticipated
changes in our tax provisions or exposure to additional income tax liabilities
could affect our profitability. We are subject to income tax
in the U.S. and numerous foreign jurisdictions. Our tax liabilities
are affected by the amounts we charge for inventory, services, licenses, funding
and other items in intercompany transactions. We are subject to
ongoing tax audits in various jurisdictions. Tax authorities may
disagree with our intercompany charges or other matters and assess additional
taxes. For example, we are currently under a federal income tax audit
by the Internal Revenue Service, or IRS, for fiscal years 2005 through
2008. While we regularly assess the likely outcomes of these audits
in order to determine the appropriateness of our tax provision, examinations are
inherently uncertain and an unfavorable outcome could occur. An
unanticipated unfavorable outcome in any specific period could harm our results
of operations for that period or future periods. The financial cost
and our attention and time devoted to defending income tax positions may divert
resources from our business operations, which could harm our business and
profitability. The IRS audit may also impact the timing and/or amount
of our refund claim. In addition, our effective tax rate in the
future could be adversely affected by changes in the mix of earnings in
countries with differing statutory tax rates, changes in the valuation of
deferred tax assets and liabilities, changes in tax laws, and the discovery of
new information in the course of our tax return preparation
process. In particular, the carrying value of deferred tax assets,
which are predominantly in the U.S., is dependent on our ability to generate
future taxable income in the U.S. Any of these changes could affect
our profitability.
We may be subject to
risks associated with environmental regulations. Production
and marketing of products in certain states and countries may subject us to
environmental and other regulations including, in some instances, the
responsibility for environmentally safe disposal or recycling. Such
laws and regulations have recently been passed in several jurisdictions in which
we operate, including Japan and certain states within the
U.S. Although we do not anticipate any material adverse effects in
the future based on the nature of our operations and the focus of such laws,
there is no assurance such existing laws or future laws will not harm our
financial condition, liquidity or results of operations.
In the event we are
unable to satisfy regulatory requirements relating to internal controls, or if
our internal control over financial reporting is not effective, our business
could suffer. In connection with our certification process
under Section 404 of the Sarbanes-Oxley Act, we have identified in the past and
will, from time-to-time, identify deficiencies in our internal control over
financial reporting. We cannot assure you that individually or in the
aggregate these deficiencies would not be deemed to be a material weakness or
significant deficiency. A material weakness or significant deficiency
in internal control over financial reporting could materially impact our
reported financial results and the market price of our stock could significantly
decline. Additionally, adverse publicity related to the disclosure of
a material weakness in internal controls could have a negative impact on our
reputation, business and stock price. Any internal control or
procedure, no matter how well designed and operated, can only provide reasonable
assurance of achieving desired control objectives and cannot prevent human
error, intentional misconduct or fraud.
Our debt obligations
may adversely affect us. Our indebtedness could
have significant negative consequences. For example, it
could:
-
increase our vulnerability to general adverse economic and industry conditions;
-
limit our ability to obtain additional financing;
-
require the dedication of a substantial portion of any cash flow from operations to the payment of principal of our indebtedness, thereby reducing the availability of such cash flow to fund our growth strategy, working capital, capital expenditures and other general corporate purposes;
-
limit our flexibility in planning for, or reacting to, changes in our business and our industry;
-
place us at a competitive disadvantage relative to our competitors with less debt; and
-
increase our risk of credit rating downgrades.
We have significant
financial obligations related to Flash Ventures, which could impact our ability
to comply with our obligations under our 1% Senior Convertible Notes due 2013
and our 1% Convertible Notes due 2035. We have entered into
agreements to guarantee or provide financial support with respect to lease and
certain other obligations of Flash Ventures in which we have a 49.9% ownership
interest. In addition, we may enter into future agreements to
increase manufacturing capacity, including the expansion of Fab 4. As
of January 3, 2010 we had guarantee obligations for Flash Ventures’ master
lease agreements of approximately $1.07 billion. In addition, we
have significant commitments for the future fixed costs of Flash
Ventures. Due to these and our other commitments, we may not have
sufficient funds to make payments under or repay the notes.
The settlement of
the 1% Senior Convertible Notes due 2013 may have adverse
consequences. The 1% Senior Convertible Notes due 2013 are
subject to net share settlement, which means that we will satisfy our conversion
obligation to holders by paying a combination of cash and shares of our common
stock in settlement thereof, in an amount of cash equal to the principal amount
of the 1% Convertible Notes due 2013 plus an amount of shares of our common
stock, if any, equal to the excess of the daily conversion values over the cash
amount of the 1% Senior Convertible Notes due 2013 being converted.
Our
failure to convert the 1% Senior Convertible Notes due 2013 into cash or a
combination of cash and common stock upon exercise of a holder’s conversion
right in accordance with the provisions of the indenture would constitute a
default under the indenture. We may not have the financial resources
or be able to arrange for financing to pay such principal amount in connection
with the surrender of the 1% Senior Convertible Notes due 2013. While
we do not have other agreements that would restrict our ability to pay the
principal amount of any convertible notes in cash, we may enter into such an
agreement in the future, which may limit or prohibit our ability to make any
such payment. In addition, a default under the indenture could lead
to a default under existing and future agreements governing our
indebtedness. If, due to a default, the repayment of related
indebtedness were to be accelerated after any applicable notice or grace
periods, we may not have sufficient funds to repay such indebtedness and amounts
owing in respect of the conversion, maturity, or put of any convertible
notes.
The convertible note
hedge transactions and the warrant option transactions may affect the value of
the notes and our common stock. We have entered into
convertible note hedge transactions with Morgan Stanley & Co. International
Limited and Goldman, Sachs & Co., or the dealers. These
transactions are expected to reduce the potential dilution upon conversion of
the 1% Senior Convertible Notes due 2013. We used approximately
$67.3 million of the net proceeds of funds received from the 1% Senior
Convertible Notes due 2013 to pay the net cost of the convertible note hedge in
excess of the warrant transactions. These transactions were accounted
for as an adjustment to our stockholders’ equity. In connection with
hedging these transactions, the dealers or their affiliates:
-
have entered into various over-the-counter cash-settled derivative transactions with respect to our common stock, concurrently with, and shortly after, the pricing of the notes; and
-
may enter into, or may unwind, various over-the-counter derivatives and/or purchase or sell our common stock in secondary market transactions following the pricing of the notes, including during any observation period related to a conversion of notes.
The
dealers or their affiliates are likely to modify their hedge positions, from
time-to-time, prior to conversion or maturity of the notes by purchasing and
selling shares of our common stock, our securities or other instruments they may
wish to use in connection with such hedging. In particular, such
hedging modification may occur during any observation period for a conversion of
the 1% Senior Convertible Notes due 2013, which may have a negative effect on
the value of the consideration received in relation to the conversion of those
notes. In addition, we intend to exercise options we hold under the
convertible note hedge transactions whenever notes are converted. To
unwind their hedge positions with respect to those exercised options, the
dealers or their affiliates expect to sell shares of our common stock in
secondary market transactions or unwind various over-the-counter derivative
transactions with respect to our common stock during the observation period, if
any, for the converted notes.
The
effect of any of these transactions on the market price of our common stock or
the 1% Senior Convertible Notes due 2013 will depend in part on market
conditions and cannot be ascertained at this time. However, any of
these activities could adversely affect the value of our common stock and the
value of the 1% Senior Convertible Notes due 2013, and consequently affect the
amount of cash and the number of shares of common stock the holders will receive
upon the conversion of the notes.
|
UNRESOLVED STAFF
COMMENTS
|
Not
applicable.
Our
principal facilities are located in Milpitas, California. We lease
four adjacent buildings comprising approximately 444,000 square
feet. These facilities house our corporate offices, the majority of
our engineering team, as well as a portion of our sales, marketing, operations
and corporate services organizations. We occupy this space under
lease agreements that expire in 2011 and 2013. In addition, we own
two buildings comprising approximately 157,000 square feet located in Kfar Saba,
Israel, that house administrative offices and research and development
facilities. The buildings are located on a 99-year land lease, which
we have 83 years remaining, of approximately 268,000 square feet of
which approximately 70,000 square feet is vacant land for future
expansion. We have 48
years remaining on a 50-year land lease in Tefen, Israel of
approximately 87,000 square feet of vacant land for future
expansion.
We have
47 years remaining on a 50-year land lease in Shanghai, China of approximately
653,000 square feet on which we own an advanced testing and assembly facility of
approximately 363,000 square feet.
We also
lease sales and marketing offices in the U.S., China, France, Germany, India,
Ireland, Israel, Japan, Korea, Russia, Scotland, Spain, Sweden, Taiwan and the
United Arab Emirates; operation support offices in Taichung, Taiwan; Hong Kong,
Shanghai and Shenzhen, China; and New Delhi, India; and design centers in Omer
and Tefen, Israel; Edinburgh, Scotland; and Bangalore, India.
|
LEGAL
PROCEEDINGS
|
See Note
16, “Litigation,” of the Notes to Consolidated Financial Statements of this Form
10-K included in Item 8 of this report.
No
matters were submitted to a vote of security holders during the fourth quarter
of fiscal year 2009.
PART
II
|
MARKET FOR REGISTRANT’S COMMON
EQUITY, RELATED STOCKHOLDER MATTERS AND ISSUER PURCHASES OF EQUITY
SECURITIES
|
Market For Our
Common Stock. Our common stock is traded on the NASDAQ Global
Select Market, or NASDAQ, under the symbol “SNDK.” The following
table summarizes the high and low sale prices for our common stock as reported
by the NASDAQ.
|
|
High
|
Low
|
||||||
|
2008
|
||||||||
|
First
quarter
|
$ | 33.73 | $ | 19.54 | ||||
|
Second
quarter
|
$ | 33.17 | $ | 18.95 | ||||
|
Third
quarter
|
$ | 23.50 | $ | 13.06 | ||||
|
Fourth
quarter
|
$ | 21.82 | $ | 5.07 | ||||
|
2009
|
||||||||
|
First
quarter
|
$ | 13.50 | $ | 7.53 | ||||
|
Second
quarter
|
$ | 16.72 | $ | 11.87 | ||||
|
Third
quarter
|
$ | 23.20 | $ | 13.02 | ||||
|
Fourth
quarter
|
$ | 31.18 | $ | 19.18 | ||||
Holders. As
of February 1, 2010, we had approximately 389 stockholders of
record.
Dividends. We
have never declared or paid any cash dividends on our common stock and do not
expect to pay cash dividends on our common stock in the foreseeable
future.
Stock
Performance Graph *
Five-Year
Stockholder Return Comparison. The following graph compares
the cumulative total stockholder return on our common stock with that of the
Standard & Poors (“S&P”) 500 Stock Index, a broad market index
published by S&P, a selected S&P Semiconductor Company stock index
compiled by Morgan Stanley & Co. Incorporated and the Philadelphia, or
PHLX, Semiconductor Index for the five-year period ended January 3,
2010. These indices, which reflect formulas for dividend reinvestment
and weighting of individual stocks, do not necessarily reflect returns that
could be achieved by an individual investor.
The
comparison for each of the periods assumes that $100 was invested on
December 31, 2004 in our common stock, the stocks included in the S&P
500 Stock Index, the stocks included in the S&P Semiconductor Company Stock
Index and the stocks included in the PHLX Semiconductor Index, and assumes all
dividends are reinvested. For each reported year, the reported dates
are the last trading dates of our fiscal quarters (which end on the Sunday
closest to March 31, June 30 and September 30, respectively) and year (which
ends on the Sunday closest to December 31).
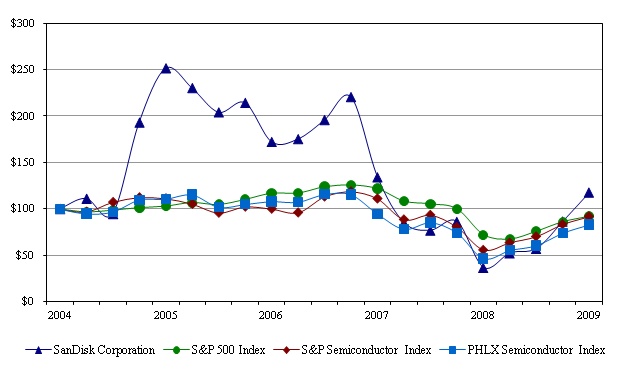
|
2004
|
2005
|
2006
|
2007
|
2008
|
2009
|
|||||||||||||||||||
|
SanDisk
Corporation
|
$ | 100.00 | $ | 251.58 | $ | 172.33 | $ | 134.32 | $ | 36.76 | $ | 117.90 | ||||||||||||
|
S&P
500 Index
|
100.00 | 103.00 | 117.03 | 122.00 | 72.02 | 92.01 | ||||||||||||||||||
|
S&P
Semiconductor Stock Index
|
100.00 | 111.18 | 100.12 | 111.02 | 56.18 | 92.01 | ||||||||||||||||||
|
PHLX
Semiconductor Index
|
100.00 | 110.66 | 107.99 | 94.62 | 46.62 | 83.06 | ||||||||||||||||||
|
|
*
|
The material in this report is
not deemed “filed” with the SEC and is not to be incorporated by reference
into any of our filings under the Securities Act of 1933 or the Securities
Exchange Act of 1934, whether made before or after the date hereof and
irrespective of any general incorporation language in any such
filing.
|
|
SELECTED FINANCIAL
DATA
|
|
|
Fiscal
Years Ended
|
|||||||||||||||||||
|
January 3,
2010(1)
|
December 28,
2008(2)
|
December 30,
2007(3)
|
December 31,
2006(4)
|
January 1,
2006(5)
|
||||||||||||||||
|
(In thousands, except per share
data)
|
||||||||||||||||||||
|
Revenues
|
||||||||||||||||||||
|
Product
|
$ | 3,154,314 | $ | 2,843,243 | $ | 3,446,125 | $ | 2,926,472 | $ | 2,066,607 | ||||||||||
|
License
and royalty
|
412,492 | 508,109 | 450,241 | 331,053 | 239,462 | |||||||||||||||
|
Total
revenues
|
3,566,806 | 3,351,352 | 3,896,366 | 3,257,525 | 2,306,069 | |||||||||||||||
|
Cost
of product revenues
|
2,282,180 | 3,288,265 | 2,693,647 | 2,018,052 | 1,333,335 | |||||||||||||||
|
Gross
profit
|
1,284,626 | 63,087 | 1,202,719 | 1,239,473 | 972,734 | |||||||||||||||
|
Operating
income (loss)
|
519,390 | (1,973,480 | ) | 276,514 | 326,334 | 576,582 | ||||||||||||||
|
Net
income (loss) attributable to common stockholders
|
$ | 415,310 | $ | (1,986,624 | ) | $ | 190,616 | $ | 180,393 | $ | 386,384 | |||||||||
| Net income (loss) attributable to common stockholders per share: | ||||||||||||||||||||
|
Basic
|
$ | 1.83 | $ | (8.82 | ) | $ | 0.84 | $ | 0.91 | $ | 2.11 | |||||||||
|
Diluted
|
$ | 1.79 | $ | (8.82 | ) | $ | 0.81 | $ | 0.87 | $ | 2.00 | |||||||||
|
Shares
used in computing net income (loss) attributable to common stockholders
per share:
|
||||||||||||||||||||
|
Basic
|
227,435 | 225,292 | 227,744 | 198,929 | 183,008 | |||||||||||||||
|
Diluted
|
231,959 | 225,292 | 235,857 | 207,451 | 193,016 | |||||||||||||||
|
At
|
||||||||||||||||||||
|
January 3,
2010
|
December 28,
2008
|
December 30,
2007
|
December 31,
2006
|
January 1,
2006
|
||||||||||||||||
|
(In
thousands)
|
||||||||||||||||||||
|
Working
capital
|
$ | 2,043,664 | $ | 1,450,675 | $ | 2,377,399 | $ | 3,335,858 | $ | 2,004,598 | ||||||||||
|
Total
assets
|
6,001,719 | 5,932,140 | 7,107,472 | 6,850,491 | 3,120,187 | |||||||||||||||
|
Convertible
long-term debt
|
934,722 | 954,094 | 903,580 | 856,595 | — | |||||||||||||||
|
Total
equity
|
3,908,409 | 3,440,721 | 5,156,303 | 4,997,470 | 2,523,791 | |||||||||||||||
(1) Includes
share-based compensation of ($95.6) million, amortization of
acquisition-related intangible assets of ($13.7) million and
other-than-temporary impairment charges of ($7.9) million related to our
investment in FlashVision.
(2) Includes
impairment charges related to goodwill of ($845.5) million,
acquisition-related intangible assets of ($175.8) million, investments in
our flash ventures with Toshiba of ($93.4) million, and our investment in
Tower Semiconductor Ltd., or Tower, of ($18.9) million. Also
includes share-based compensation of ($97.8) million, amortization of
acquisition-related intangible assets of ($71.6) million and restructuring
and other charges of ($35.5) million.
(3) Includes
share-based compensation of ($133.0) million and amortization of
acquisition-related intangible assets of ($90.1) million. Also
includes other-than-temporary impairment charges of ($10.0) million related
to our investment in FlashVision.
(4) Includes
acquired in-process technology charges of ($225.6) million related to
acquisitions of Matrix Semiconductor Inc., or Matrix, in January 2006 and
msystems Ltd., or msystems, in November 2006, share-based compensation of
($100.6) million and amortization of acquisition-related intangible assets
of ($27.8) million.
(5) Includes
other-than-temporary impairment charges of ($10.1) million related to our
investment in Tower.
|
MANAGEMENT’S DISCUSSION AND
ANALYSIS OF FINANCIAL CONDITION AND RESULTS OF
OPERATION
|
Overview
|
|
Fiscal
Years Ended
|
|||||||||||||||||||||||
|
January 3,
2010
|
%
of
Revenue
|
December 28,
2008
|
%
of
Revenue
|
December 30,
2007
|
%
of
Revenue
|
|||||||||||||||||||
|
(In
thousands, except percentages)
|
||||||||||||||||||||||||
|
Product
revenues
|
$ | 3,154,314 | 88.4 | % | $ | 2,843,243 | 84.8 | % | $ | 3,446,125 | 88.4 | % | ||||||||||||
|
License
and royalty revenues
|
412,492 | 11.6 | % | 508,109 | 15.2 | % | 450,241 | 11.6 | % | |||||||||||||||
|
Total
revenues
|
3,566,806 | 100.0 | % | 3,351,352 | 100.0 | % | 3,896,366 | 100.0 | % | |||||||||||||||
|
Cost
of product revenues
|
2,282,180 | 64.0 | % | 3,288,265 | 98.1 | % | 2,693,647 | 69.1 | % | |||||||||||||||
|
Gross
profit
|
1,284,626 | 36.0 | % | 63,087 | 1.9 | % | 1,202,719 | 30.9 | % | |||||||||||||||
|
Operating
expenses
|
||||||||||||||||||||||||
|
Research
and development
|
384,158 | 10.8 | % | 429,949 | 12.8 | % | 418,066 | 10.7 | % | |||||||||||||||
|
Sales
and marketing
|
208,514 | 5.8 | % | 328,079 | 9.8 | % | 294,594 | 7.6 | % | |||||||||||||||
|
General
and administrative
|
171,359 | 4.8 | % | 204,765 | 6.1 | % | 181,509 | 4.7 | % | |||||||||||||||
|
Impairment
of goodwill
|
— | — | 845,453 | 25.2 | % | — | — | |||||||||||||||||
|
Impairment
of acquisition-related intangible assets
|
— | — | 175,785 | 5.3 | % | — | — | |||||||||||||||||
|
Amortization
of acquisition-related intangible assets
|
1,167 | 0.0 | % | 17,069 | 0.5 | % | 25,308 | 0.6 | % | |||||||||||||||
|
Restructuring
and other
|
38 | 0.0 | % | 35,467 | 1.1 | % | 6,728 | 0.2 | % | |||||||||||||||
|
Total
operating expenses
|
765,236 | 21.4 | % | 2,036,567 | 60.8 | % | 926,205 | 23.8 | % | |||||||||||||||
|
Operating
income (loss)
|
519,390 | 14.6 | % | (1,973,480 | ) | (58.9 | )% | 276,514 | 7.1 | % | ||||||||||||||
|
Other
income (expense), net
|
(15,589 | ) | ( 0.5 | )% | 21,106 | 0.6 | % | 76,144 | 2.0 | % | ||||||||||||||
|
Income
(loss) before provision for taxes
|
503,801 | 14.1 | % | (1,952,374 | ) | (58.3 | )% | 352,658 | 9.1 | % | ||||||||||||||
|
Provision
for income taxes
|
88,491 | 2.5 | % | 34,250 | 1.0 | % | 156,831 | 4.1 | % | |||||||||||||||
|
Net
income (loss)
|
415,310 | 11.6 | % | (1,986,624 | ) | (59.3 | )% | 195,827 | 5.0 | % | ||||||||||||||
|
Less:
Net income attributable to non-controlling interests
|
— | — | — | — | 5,211 | 0.1 | % | |||||||||||||||||
|
Net
income (loss) attributable to common stockholders
|
$ | 415,310 | 11.6 | % | $ | (1,986,624 | ) | (59.3 | )% | $ | 190,616 | 4.9 | % | |||||||||||
General
We are
the inventor of and largest supplier of NAND flash storage card
products. Our mission is to provide simple, reliable and affordable
storage for consumer use in portable devices. We sell our products
globally through broad retail and OEM distribution channels.
We
design, develop and manufacture data storage products and solutions in a variety
of form factors using our flash memory, proprietary controller and firmware
technologies. We purchase the vast majority of our NAND flash memory
supply requirements through our significant flash venture relationships with
Toshiba which provide us with leading-edge, low-cost memory
wafers. Our removable card products are used in a wide range of
consumer electronics devices such as mobile phones, digital cameras, gaming
devices and laptop computers. Our embedded flash products are used in
mobile phones, navigation devices, gaming systems, imaging devices and computing
platforms. For computing platforms, we provide high-speed,
high-capacity storage solutions known as SSDs that can be used in lieu of hard
disk drives in a variety of computing devices.
Our
results are primarily driven by worldwide demand for flash storage devices,
which in turn depends on end-user demand for electronic products. We
believe the market for flash storage is generally price
elastic. Accordingly, we expect that as we reduce the price of our
flash devices, consumers will demand an increasing number of gigabytes and/or
units of memory and that over time, new markets will emerge. In order
to profitably capitalize on price elasticity of demand in the market for flash
storage products, we must reduce our cost per gigabyte at a rate similar to the
change in selling price per gigabyte, and the average capacity and/or the number
of units of our products must grow enough to offset price
declines. We seek to achieve these cost reductions through technology
improvements, primarily by increasing the amount of memory stored in a given
area of silicon.
Effective
December 29, 2008, we implemented a change in accounting and have
separately accounted for the liability and equity components of our 1% Senior
Convertible Note due 2013 that may be settled in cash upon conversion (including
partial cash settlement) in a manner that reflects our economic interest
cost. Accordingly, we bifurcated the debt into debt and equity
components and are amortizing the debt discount (the “economic interest cost”)
in our Consolidated Statements of Operations. We have retrospectively
applied the change in accounting to all periods presented, and have recast the
Consolidated Financial Statements for fiscal years 2008 and 2007 presented in
this report.
Effective
December 29, 2008, we implemented a change in accounting and have
reclassified for all periods presented non-controlling interests, formerly
called a minority interest, to a component of equity in the Consolidated Balance
Sheets, and the net income (loss) attributable to non-controlling interests has
been separately identified in the Consolidated Statements of Operations and the
Consolidated Statements of Equity. The Company has also reclassified
certain distributions to non-controlling interests from cash flows from
operating activities to cash flows from investing activities for fiscal years
ended December 28, 2008 and December 30, 2007.
In the
fourth quarter of fiscal year 2009, we identified that our third party equity
software contained a feature that resulted in incorrect share-based compensation
expense. This software feature affected our share-based compensation
expense reported for the nine months ended September 27, 2009 and the three
fiscal years ended December 28, 2008. We determined that the
impact of the underreported share-based compensation expense was not
material to any of the previously issued annual or interim financial
statements. Accordingly, the fourth quarter and full fiscal year 2009
include a cumulative non-cash adjustment of $16.2 million to increase
share-based compensation, allocated to multiple expense categories.
Fiscal
year 2009 included 53 weeks as compared to 52 weeks in fiscal years 2008 and
2007.
Critical
Accounting Policies & Estimates
Our
discussion and analysis of our financial condition and results of operations is
based upon our Consolidated Financial Statements, which have been prepared in
accordance with accounting principles generally accepted in the United States,
or U.S. GAAP.
Use of
Estimates. The preparation of these financial statements
requires us to make estimates and judgments that affect the reported amounts of
assets, liabilities, revenues and expenses, and related disclosure of contingent
liabilities. On an ongoing basis, we evaluate our estimates,
including, among others, those related to customer programs and incentives,
product returns, bad debts, inventories and related reserves, investments,
long-lived assets, income taxes, warranty obligations, restructuring,
contingencies, share-based compensation, and litigation. We base our
estimates on historical experience and on other assumptions that we believe are
reasonable under the circumstances, the results of which form the basis for our
judgments about the carrying values of assets and liabilities when those values
are not readily apparent from other sources. Estimates have
historically approximated actual results. However, future results
will differ from these estimates under different assumptions and
conditions.
Revenue
Recognition, Sales Returns and Allowances and Sales Incentive
Programs. We recognize revenues when the earnings process is
complete, as evidenced by an agreement with the customer, there is transfer of
title and acceptance, if applicable, fixed pricing and reasonable assurance of
realization. Revenue is generally recognized at the time of shipment
for customers not eligible for price protection and/or a right of
return. Sales made to distributors and retailers are generally under
agreements allowing price protection and/or right of return and, therefore, the
sales and related costs of these transactions are deferred until the retailers
or distributors sell the merchandise to their end customer, or the rights of
return expire. At January 3, 2010 and December 28, 2008,
deferred income from sales to distributors and retailers was $177.7 million
and $75.7 million, respectively. Estimated sales returns are
provided for as a reduction to product revenues and deferred revenues and were
not material for any period presented in our Consolidated Financial
Statements.
We record
estimated reductions to revenues or to deferred revenues for customer and
distributor incentive programs and offerings, including price protection,
promotions, co-op advertising, and other volume-based incentives and expected
returns. Additionally, we have incentive programs that require us to
estimate, based on historical experience, the number of customers who will
actually redeem the incentive. All sales incentive programs are
recorded as an offset to product revenues or deferred revenues. In
calculating the value of sales incentive programs, actual and estimated activity
is used based upon reported weekly sell-through data from our
customers. The timing and resolution of these claims could materially
impact product revenues or deferred revenues. In addition, actual
returns and rebates in any future period could differ from our estimates, which
could impact the revenue we report.
Inventories and
Inventory Valuation. Inventories are stated at the lower of
cost (first-in, first-out) or market. Market value is based upon an
estimated average selling price reduced by estimated costs of
disposal. The determination of market value involves numerous
judgments including estimating average selling prices based upon recent sales,
industry trends, existing customer orders, current contract prices, industry
analysis of supply and demand and seasonal factors. Should actual
market conditions differ from our estimates, our future results of operations
could be materially affected. The valuation of inventory also
requires us to estimate obsolete or excess inventory. The
determination of obsolete or excess inventory requires us to estimate the future
demand for our products within specific time horizons, generally six to twelve
months. To the extent our demand forecast for specific products is
less than both our product on-hand and on noncancelable orders, we could be
required to record additional inventory reserves, which would have a negative
impact on our gross margin.
Deferred Tax
Assets. We must make certain estimates in determining income
tax expense for financial statement purposes. These estimates occur
in the calculation of certain tax assets and liabilities, which arise from
differences in the timing of recognition of revenue and expense for tax and
financial statement purposes. We have recorded a valuation allowance
against a significant portion of our U.S. and certain foreign net deferred tax
assets as there was substantial uncertainty as to the realizability of the
deferred tax assets in future periods. In determining the need for
and amount of our valuation allowance, we assess the likelihood that we will be
able to recover our deferred tax assets using historical levels of income,
estimates of future income and tax planning strategies. Our estimates
of future income include our internal projections and various internal estimates
and certain external sources which we believe to be reasonable but that are
unpredictable and inherently uncertain.
Our
estimates for tax uncertainties require substantial judgment based upon the
period of occurrence, complexity of the matter, available federal tax case law,
interpretation of foreign laws and regulations and other
estimates. There is no assurance that domestic or international tax
authorities will agree with the tax positions we have taken which could
materially impact future results.
Valuation of
Long-Lived Assets, Intangible Assets and Equity Method Investments. We perform tests for
impairment of long-lived and intangible assets and equity method investments
whenever events or circumstances suggest that other long-lived assets may not be
recoverable. An impairment of long-lived and intangible assets are
only deemed to have occurred if the sum of the forecasted undiscounted future
cash flows related to the assets are less than the carrying value of the asset
we are testing for impairment. If the forecasted cash flows are less
than the carrying value, then we must write down the carrying value to its
estimated fair value based primarily upon forecasted discounted cash
flows. An impairment of an equity method investment is deemed to
occur if the fair value, based upon quoted market prices if available or
forecasted discounted cash flows, is less than the carrying
value. Substantially all of our equity method investments are not
actively traded and we rely on discounted cash flows to estimate fair
value. These forecasted discounted cash flows include estimates and
assumptions related to revenue growth rates and operating margins, risk-adjusted
discount rates based on our weighted average cost of capital, future economic
and market conditions and determination of appropriate market
comparables. Our estimates of market segment growth and our market
segment share and costs are based on historical data, various internal estimates
and certain external sources, and are based on assumptions that are consistent
with the plans and estimates we are using to manage the underlying
business. Our business consists of both established and emerging
technologies and our forecasts for emerging technologies are based upon internal
estimates and external sources rather than historical information. If
future forecasts are revised, they may indicate or require future impairment
charges. We base our fair value estimates on assumptions we believe
to be reasonable but that are unpredictable and inherently
uncertain. Actual future results may differ from those
estimates.
Fair Value of
Investments in Debt Instruments. There are three levels of
inputs that may be used to measure fair value (see Note 3, “Investments and Fair
Value Measurements” in the Notes to the Consolidated Financial Statements
included in Item 8 of this report). Each level of input has different
levels of subjectivity and difficulty involved in determining fair
value. Level 1 securities represent quoted prices in active markets,
and therefore do not require significant management judgment. Our
Level 2 securities are primarily valued using quoted market prices for similar
instruments and nonbinding market prices that are corroborated by observable
market data. We use inputs such as actual trade data, benchmark
yields, broker/dealer quotes, and other similar data, which are obtained from
independent pricing vendors, quoted market prices, or other sources to determine
the ultimate fair value of our assets and liabilities. The inputs and
fair value are reviewed for reasonableness, may be further validated by
comparison to publicly available information, compared to multiple independent
valuation sources and could be adjusted based on market indices or other
information. In the current market environment, the assessment of
fair value can be difficult and subjective. However, given the
relative reliability of the inputs we use to value our investment portfolio, and
because substantially all of our valuation inputs are obtained using quoted
market prices for similar or identical assets, we do not believe that the nature
of estimates and assumptions was material to the valuation of our cash
equivalents, short and long-term marketable securities. We currently
do not have any investments that use Level 3 inputs.
Results
of Operations
Product
Revenues.
|
FY
2009
|
Percent
Change
|
FY
2008
|
Percent
Change
|
FY
2007
|
||||||||||||||||
|
(In millions,
except percentages)
|
||||||||||||||||||||
|
Retail
|
$ | 1,567.5 | (14 | )% | $ | 1,812.9 | (16 | )% | $ | 2,162.5 | ||||||||||
|
OEM
|
1,586.8 | 54 | % | 1,030.3 | (20 | )% | 1,283.6 | |||||||||||||
|
Product
revenues
|
$ | 3,154.3 | 11 | % | $ | 2,843.2 | (17 | )% | $ | 3,446.1 | ||||||||||
The
increase in our fiscal year 2009 product revenues compared to fiscal year 2008
reflected a 116% increase in the number of gigabytes sold, partially offset by a
48% reduction in average selling price per gigabyte. The increase in
number of gigabytes sold was the result of an increase in average capacity of
71% and an increase in memory units sold of 26%. The decline in
retail product revenues in fiscal year 2009 compared to fiscal year 2008 was
primarily attributable to a weak worldwide consumer spending environment through
all of 2009. The increase in OEM product revenues in fiscal year 2009
compared to fiscal year 2008 was due to increased sales of cards and embedded
products primarily in the mobile phone markets and increased sales to new OEM
channels, including the sale of private label cards, wafers and
components.
The
decrease in our fiscal year 2008 product revenues compared to fiscal year 2007
reflected a 62% reduction in average selling price per gigabyte, partially
offset by a 125% increase in the number of gigabytes sold, which reflected 15%
growth in memory product units sold and 96% growth in average
capacity. The decline in retail product revenues in fiscal year 2008
compared to fiscal year 2007 was due to aggressive price declines partially
offset by a 116% increase in gigabytes sold. The decline in OEM
product revenues in fiscal year 2008 compared to fiscal year 2007 was due to
aggressive price declines, partially offset by a 135% increase in gigabytes
sold, and the discontinuation of TwinSys Data Storage Limited Partnership, or
TwinSys, operations on March 31, 2007, which contributed $53 million of
product revenues in the first quarter of fiscal year 2007 prior to ceasing
operations. Unit growth of 15% in fiscal year 2008 was below the 75%
unit growth in fiscal year 2007 due primarily to deteriorating worldwide
economic conditions.
Geographical
Product Revenues.
|
FY
2009
|
FY
2008
|
FY
2007
|
||||||||||||||||||||||
|
Revenue
|
Percent
of
Total
|
Revenue
|
Percent
of
Total
|
Revenue
|
Percent
of
Total
|
|||||||||||||||||||
|
(In millions,
except percentages)
|
||||||||||||||||||||||||
|
United
States
|
$ | 916.3 | 29 | % | $ | 1,006.7 | 35 | % | $ | 1,193.6 | 35 | % | ||||||||||||
|
Asia-Pacific
|
1,447.7 | 46 | % | 1,013.1 | 36 | % | 1,228.5 | 36 | % | |||||||||||||||
|
Europe,
Middle East and Africa
|
707.7 | 22 | % | 752.6 | 26 | % | 889.7 | 26 | % | |||||||||||||||
|
Other
foreign countries
|
82.6 | 3 | % | 70.8 | 3 | % | 134.3 | 3 | % | |||||||||||||||
|
Product
revenues
|
$ | 3,154.3 | 100 | % | $ | 2,843.2 | 100 | % | $ | 3,446.1 | 100 | % | ||||||||||||
Product
revenues in Asia-Pacific, which now includes Japan, increased on a
year-over-year basis due to growth in our OEM channel sales for the mobile phone
market and growth in the sale of private label cards, wafers and
components. Product revenues in fiscal year 2009 compared to fiscal
year 2008 decreased in the United States and Europe, Middle East and Africa, or
EMEA, primarily due to a weak consumer spending environment.
Product
revenues in fiscal year 2008 compared to fiscal year 2007 decreased in all
geographical regions due to aggressive industry price declines partially offset
by unit sales growth in all regions. The decline in Asia-Pacific
revenue also included the discontinuation of TwinSys operations on
March 31, 2007, which contributed $53 million of product revenues
in the first quarter of fiscal year 2007 prior to ceasing
operations.
License
and Royalty Revenues.
|
FY
2009
|
Percent
Change
|
FY
2008
|
Percent
Change
|
FY
2007
|
||||||||||||||||
|
(In millions,
except percentages)
|
||||||||||||||||||||
|
License
and royalty revenues
|
$ | 412.5 | (19 | )% | $ | 508.1 | 13 | % | $ | 450.2 | ||||||||||
The
decrease in our fiscal year 2009 license and royalty revenues was due to lower
flash memory revenues reported by our licensees and a new license agreement with
an existing licensee at a lower effective royalty rate as compared to the
previous license agreement. These declines were partially offset by
fiscal year 2009 including a full year of royalty revenue for new licensees
added in fiscal year 2008.
The
increase in our fiscal year 2008 license and royalty revenues was primarily due
to the addition of new licensees.
Gross
Margins.
|
FY
2009
|
Percent
Change
|
FY
2008
|
Percent
Change
|
FY
2007
|
||||||||||||||||
|
(In millions,
except percentages)
|
||||||||||||||||||||
|
Product
gross profit (loss)
|
$ | 872.1 | 296 | % | $ | (445.0 | ) | (159 | )% | $ | 752.5 | |||||||||
|
Product
gross margins (as a percent of product revenue)
|
27.6 | % | (15.7 | )% | 21.8 | % | ||||||||||||||
|
Total
gross margins (as a percent of total revenue)
|
36.0 | % | 1.9 | % | 30.9 | % | ||||||||||||||
Product
gross margins in fiscal year 2009 increased 43.3 percentage points compared to
fiscal year 2008 due to manufacturing costs declining faster than prices and a
net benefit of $364 million, primarily from the sale of inventory which had
been previously partially reserved in fiscal year 2008 to reflect the market
value of certain inventory which was determined to be below cost. The
increase in product gross margin in fiscal year 2009 as compared with fiscal
year 2008 was also due to charges in 2008 for the impairment of our investments
in Flash Ventures of $83 million and for adverse purchase commitments of $121
million associated with under-utilization of Flash Ventures
capacity. The rate of decline in average selling price per gigabyte
slowed in fiscal year 2009 due to an improved balance between supply and demand,
impacted in part by our actions in early fiscal year 2009 to sell a portion of
our manufacturing capacity in Flash Ventures to Toshiba, and hold the remaining
wafer output capacity constant. The rate of cost decline of our
memory products was similar in fiscal years 2009 and 2008.
Product
gross margins in fiscal year 2008 decreased 37.5 percentage points compared
to fiscal year 2007 primarily due to aggressive industry price declines
resulting in the sale of products at negative gross margins and related
charges. The related charges in fiscal year 2008
included:
-
Inventory reserves primarily to reduce the carrying value to the lower-of-cost-or-market for both inventory on-hand and in the channel of $394 million.
-
Charges of $121 million for adverse purchase commitments associated with under-utilization of Flash Ventures capacity for the 90-day period in which we have non-cancellable orders.
-
Impairment in our investments in Flash Partners and Flash Alliance of $83 million.
Research
and Development.
|
FY
2009
|
Percent
Change
|
FY
2008
|
Percent
Change
|
FY
2007
|
||||||||||||||||
|
(In millions,
except percentages)
|
||||||||||||||||||||
|
Research
and development
|
$ | 384.2 | (11 | )% | $ | 429.9 | 3 | % | $ | 418.1 | ||||||||||
|
Percent
of revenue
|
10.8 | % | 12.8 | % | 10.7 | % | ||||||||||||||
Our
fiscal year 2009 research and development expense was reduced from the
comparable period in fiscal year 2008 primarily due to lower usage of
third-party engineering services of ($36.6) million and lower
employee-related costs of ($3.4) million due to decreased headcount and
lower share-based compensation expense.
Our
fiscal year 2008 research and development expense growth was primarily due to an
increase in payroll, payroll-related expenses and headcount-related expenses of
approximately $21 million, an increase in consulting and material and
equipment costs of $6 million, partially offset by lower share-based
compensation expense of ($10) million and lower Flash Venture related costs
of ($7) million. The growth in fiscal year 2008 research and
development expense reflects parallel investment in NAND X2, X3 and X4 storage
technologies, and 3D Read/Write memory architecture technology.
Sales
and Marketing.
|
FY
2009
|
Percent
Change
|
FY
2008
|
Percent
Change
|
FY
2007
|
||||||||||||||||
|
(In millions,
except percentages)
|
||||||||||||||||||||
|
Sales
and marketing
|
$ | 208.5 | (36 | )% | $ | 328.1 | 11 | % | $ | 294.6 | ||||||||||
|
Percent
of revenue
|
5.8 | % | 9.8 | % | 7.6 | % | ||||||||||||||
Our
fiscal year 2009 sales and marketing expense was reduced from the comparable
period in fiscal year 2008 primarily due to decreased branding and merchandising
costs of ($99) million and lower outside service costs of
($19) million.
Our
fiscal year 2008 sales and marketing expense growth over the comparable period
in fiscal year 2007 was primarily due to increased branding and merchandising
costs of $34 million and increased employee-related costs of
$13 million, partially offset by lower share-based compensation expense of
($12) million. The growth in branding and merchandising and
employee-related costs primarily reflected expansion of our international sales
channels.
General
and Administrative.
|
FY
2009
|
Percent
Change
|
FY
2008
|
Percent
Change
|
FY
2007
|
||||||||||||||||
|
(In millions,
except percentages)
|
||||||||||||||||||||
|
General
and administrative
|
$ | 171.4 | (16 | )% | $ | 204.8 | 13 | % | $ | 181.5 | ||||||||||
|
Percent
of revenue
|
4.8 | % | 6.1 | % | 4.7 | % | ||||||||||||||
Our
fiscal year 2009 general and administrative expense was reduced over the
comparable period in fiscal year 2008 primarily due to lower intellectual
property legal costs of ($29) million and lower bad debt expense of
($9) million, partially offset by an increase in employee-related costs of
$5 million.
Our
fiscal year 2008 general and administrative expense growth over the comparable
period in fiscal year 2007 was primarily related to increased legal and outside
advisor costs of $30 million and bad debt expense of $5 million,
partially offset by lower share-based compensation costs of ($9) million
and payroll and employee-related costs of ($3) million. Our
legal and outside advisor costs increased in fiscal year 2008 as compared to
fiscal year 2007 primarily due to increased patent and anti-trust litigation
expenses as well as expenses incurred in connection with strategic
initiatives.
Impairment
of Goodwill.
|
FY
2009
|
Percent
Change
|
FY
2008
|
Percent
Change
|
FY
2007
|
||||||||||||||||
|
(In millions,
except percentages)
|
||||||||||||||||||||
|
Impairment
of goodwill
|
n/a | n/a | $ | 845.5 | n/a | n/a | ||||||||||||||
|
Percent
of revenue
|
n/a | 25.2 | % | n/a | ||||||||||||||||
In the
fourth quarter of fiscal year 2008, we concluded that there were sufficient
indicators based on a combination of factors, including the economic
environment, current and forecasted operating results, NAND-industry pricing
conditions and a sustained decline in our market capitalization, to require an
interim goodwill impairment analysis. As a result of the interim
goodwill impairment analysis, we recognized an impairment charge of
$846 million. As of December 28, 2008, we have no goodwill
remaining on our Consolidated Balance Sheet.
Impairment
of Acquisition-Related Intangible Assets.
|
FY
2009
|
Percent
Change
|
FY
2008
|
Percent
Change
|
FY
2007
|
||||||||||||||||
|
(In millions,
except percentages)
|
||||||||||||||||||||
|
Impairment
of acquisition-related intangible assets
|
n/a | n/a | $ | 175.8 | n/a | n/a | ||||||||||||||
|
Percent
of revenue
|
n/a | 5.3 | % | n/a | ||||||||||||||||
In the
fourth quarter of fiscal year 2008, we recorded a $176 million impairment
on acquisition-related intangible assets. This impairment was based
upon forecasted discounted cash flows which considered factors including a
reduced business outlook primarily due to NAND-industry pricing
conditions. There were no such impairments or impairment indicators
in fiscal years 2009 and 2007.
Amortization
of Acquisition-Related Intangible Assets.
|
FY
2009
|
Percent
Change
|
FY
2008
|
Percent
Change
|
FY
2007
|
||||||||||||||||
|
(In millions,
except percentages)
|
||||||||||||||||||||
|
Amortization
of acquisition-related intangible assets
|
$ | 1.2 | (93 | )% | $ | 17.1 | (32 | )% | $ | 25.3 | ||||||||||
|
Percent
of revenue
|
0.0 | % | 0.5 | % | 0.6 | % | ||||||||||||||
Amortization
of acquisition-related intangible assets in fiscal year 2009 compared to fiscal
year 2008 was lower due to the impairment of certain Matrix and msystems
acquisition-related intangible assets in the fourth quarter of fiscal year
2008.
Amortization
of acquisition-related intangible assets in fiscal year 2008 compared to fiscal
year 2007 was lower due to intangible assets that were fully amortized in fiscal
year 2007. Our expense from the amortization of acquisition-related
intangible assets was primarily related to our acquisitions of Matrix in
January 2006 and msystems in November 2006.
Restructuring
Charges and Other.
|
FY
2009
|
Percent
Change
|
FY
2008
|
Percent
Change
|
FY
2007
|
||||||||||||||||
|
(In millions,
except percentages)
|
||||||||||||||||||||
|
Restructuring
and other
|
$ | ─ | (100 | )% | $ | 35.5 | 430 | % | $ | 6.7 | ||||||||||
|
Percent
of revenue
|
0.0 | % | 1.1 | % | 0.2 | % | ||||||||||||||
During
fiscal years 2008 and 2007, we implemented several restructuring plans which
included reductions of our workforce and consolidation of
operations. We recorded negligible restructuring charges and other in
fiscal year 2009 compared to $36 million and $7 million in fiscal
years 2008 and 2007, respectively. The goal of these restructuring
and other charges was to bring our operational expenses to more appropriate
levels relative to our net revenues, while simultaneously implementing extensive
company-wide expense-control programs. All expenses, including
adjustments, associated with our restructuring plans are included in
Restructuring and Other in the Consolidated Statements of
Operations. For further discussion of our restructuring plans, refer
to Note 10, “Restructuring Plans,” of the Notes to Consolidated Financial
Statements of this Form 10-K included in Item 8 of this
report.
Other
Income (Expense), net.
|
FY
2009
|
Percent
Change
|
FY
2008
|
Percent
Change
|
FY
2007
|
||||||||||||||||
|
(In millions,
except percentages)
|
||||||||||||||||||||
|
Interest
income
|
$ | 63.3 | (33 | )% | $ | 94.4 | (29 | )% | $ | 133.4 | ||||||||||
|
Interest
expense
|
(68.6 | ) | 4 | % | (65.8 | ) | 5 | % | (62.7 | ) | ||||||||||
|
Loss
on equity investments
|
(1.6 | ) | (96 | )% | (39.6 | ) | 300 | % | (9.9 | ) | ||||||||||
|
Other
income (expense), net
|
(8.7 | ) | (127 | )% | 32.1 | 110 | % | 15.3 | ||||||||||||
|
Total
other income (expense), net
|
$ | (15.6 | ) | (174 | )% | $ | 21.1 | (72 | )% | $ | 76.1 | |||||||||
Our
fiscal year 2009 “Total other income (expense), net” decreased compared to
fiscal year 2008 primarily due to lower foreign currency gains and transaction
costs incurred in fiscal year 2009 related to the sale of equipment and transfer
of lease obligations resulting from the restructuring of Flash Ventures,
reflected in “Other income (expense), net.” In addition, interest
income in fiscal year 2009 declined by ($31) million compared to fiscal
year 2008, reflecting lower interest rates and lower average cash balances
during the year.
Our
fiscal year 2008 “Total other income (expense), net” decrease compared to fiscal
year 2007 was primarily due to lower interest income in fiscal year 2008
reflecting reduced interest rates and lower cash and investment balances,
impairment of our equity investment in Tower of ($19) million, and an
impairment of our investment in FlashVision of ($10) million.
Provision
for Income Taxes.
|
FY
2009
|
Percent
Change
|
FY
2008
|
Percent
Change
|
FY
2007
|
||||||||||||||||
|
(in millions,
except percentages)
|
||||||||||||||||||||
|
Provision
for income taxes
|
$ | 88.5 | 158 | % | $ | 34.3 | (78 | )% | $ | 156.8 | ||||||||||
|
Effective
income tax rates
|
17.6 | % | (1.8 | )% | 44.5 | % | ||||||||||||||
Our
fiscal year 2009 effective tax rate was primarily related to withholding taxes
on license and royalty income from certain foreign licensees and income tax
provisions recorded by foreign subsidiaries while income taxes for federal and
state were substantially offset by the reduction of valuation allowance related
to the utilization of tax credits.
Our
fiscal year 2008 provision for income taxes was lower than the statutory rate
primarily due to the non-deductibility of the goodwill impairment charge and a
valuation allowance recorded on certain U.S. and foreign gross deferred tax
assets. The valuation allowance significantly increased due primarily
to the size of the fiscal year 2008 net loss and that it is not more likely than
not that certain U.S. and foreign deferred tax assets will be realized in the
future. Fiscal year 2007 provision for income taxes was higher than
the statutory rate primarily due to non-deductible share-based compensation
expenses and certain foreign losses partially offset by foreign earnings taxed
at other than U.S. rates and tax-exempt interest.
Our
reserve for unrecognized tax benefits increased by $60 million and
$69 million in fiscal years 2009 and 2008, respectively. In
October 2009, the Internal Revenue Service commenced an examination of our
federal income tax returns for fiscal years 2005 through 2008. We do
not expect a resolution to be reached during the next twelve
months. In addition, we are currently under audit by various state
and international tax authorities. We cannot reasonably estimate that
the outcome of these examinations will not have a material effect on our
financial position, results of operations or liquidity.
Non-GAAP
Financial Measures
Reconciliation
of Net Income (Loss).
|
Twelve
months ended
|
||||||||||||
|
January 3,
2010
|
December 28,
2008
|
December 30,
2007
|
||||||||||
|
(In
thousands except per share amounts)
|
||||||||||||
|
Net
income (loss) attributable to common stockholders
|
$ | 415,310 | $ | (1,986,624 | ) | $ | 190,616 | |||||
|
Share-based
compensation
|
95,560 | 97,799 | 133,010 | |||||||||
|
Impairment
of goodwill and acquisition-related intangible assets
|
─
|
1,021,238 |
─
|
|||||||||
|
Amortization
of acquisition-related intangible assets
|
13,696 | 71,581 | 90,117 | |||||||||
|
Inventory
step-up expense related to msystems acquisition
|
─
|
─
|
7,066 | |||||||||
|
Convertible
debt interest
|
54,454 | 49,340 | 45,758 | |||||||||
|
Income
tax adjustments
|
(151,813 | ) | 280,692 | (58,458 | ) | |||||||
|
Non-GAAP
net income (loss) attributable to common stockholders
|
$ | 427,207 | $ | (465,974 | ) | $ | 408,109 | |||||
|
Diluted
net income (loss) attributable to common stockholders per
share:
|
$ | 1.79 | $ | (8.82 | ) | $ | 0.81 | |||||
|
Share-based
compensation
|
0.41 | 0.43 | 0.56 | |||||||||
|
Impairment
of goodwill and acquisition-related intangible assets
|
─
|
4.53 |
─
|
|||||||||
|
Amortization
of acquisition-related intangible assets
|
0.06 | 0.32 | 0.38 | |||||||||
|
Inventory
step-up expense related to msystems acquisition
|
─
|
─
|
0.03 | |||||||||
|
Convertible
debt interest
|
0.23 | 0.22 | 0.19 | |||||||||
|
Income
tax adjustments
|
(0.65 | ) | 1.25 | (0.24 | ) | |||||||
|
Non-GAAP
diluted net income (loss) attributable to common stockholders per
share:
|
$ | 1.84 | $ | (2.07 | ) | $ | 1.73 | |||||
|
Shares
used in computing diluted net income (loss) attributable to common
stockholders per share:
|
||||||||||||
|
GAAP
|
231,959 | 225,292 | 235,857 | |||||||||
|
Non-GAAP
|
232,300 | 225,292 | 236,614 | |||||||||
Management
believes that providing this additional information is useful to the investor to
better assess and understand operating performance, especially when comparing
results with previous periods or forecasting performance for future periods,
primarily because management typically monitors the business excluding these
items. Management also uses these non-GAAP measures to establish
operational goals and for measuring performance for compensation
purposes. However, analysis of results on a non-GAAP basis should be
used as a complement to, and in conjunction with, and not as a replacement for,
data presented in accordance with GAAP.
Management
believes that the presentation of non-GAAP measures, including net income (loss)
and non-GAAP net income (loss) per diluted share, provides important
supplemental information to management and investors about financial and
business trends relating to the company’s results of
operations. Management believes that the use of these non-GAAP
financial measures also provides consistency and comparability with our past
financial reports.
Management
has historically used these non-GAAP measures when evaluating operating
performance because we believe that the inclusion or exclusion of the items
described below provides an additional measure of our core operating results and
facilitates comparisons of our core operating performance against prior periods
and our business model objectives. We have chosen to provide this
information to investors to enable them to perform additional analyses of past,
present and future operating performance and as a supplemental means to evaluate
our ongoing core operations. Externally, we believe that these
non-GAAP measures continue to be useful to investors in their assessment of our
operating performance and their valuation of the company.
Internally,
these non-GAAP measures are significant measures used by management for purposes
of:
-
evaluating the core operating performance of the company;
-
establishing internal budgets;
-
setting and determining variable compensation levels;
-
calculating return on investment for development programs and growth initiatives;
-
comparing performance with internal forecasts and targeted business models;
-
strategic planning; and
-
benchmarking performance externally against our competitors.
We
exclude the following items from our non-GAAP measures:
Share-based Compensation
Expense. These expenses consist primarily of expenses for employee
stock options, employee restricted stock units and the employee stock purchase
plan. Although share-based compensation is an important aspect of the
compensation of SanDisk’s employees and executives, we exclude share-based
compensation expenses from our non-GAAP measures primarily because they are
non-cash expenses that we do not believe are reflective of ongoing operating
results. Further, we believe that it is useful to exclude share-based
compensation expense for investors to better understand the long-term
performance of our core business and to facilitate comparison of our results to
those of peer companies.
Impairment of Goodwill and
Acquisition-related Intangible Assets. This item reflects the
write-down of goodwill and other intangible assets to their fair
values. Because of the infrequent nature of this charge, management
does not include this type of item in internal operating forecasts and
models. Excluding this data provides investors with a basis to
compare our core operating results in different periods without this
variability.
Amortization of Acquisition-related
Intangible Assets. We incur amortization of intangible assets in
connection with acquisitions. Since we do not acquire businesses on a
predictable cycle, we exclude these items in order to provide investors and
others with a consistent basis for comparison across accounting
periods.
Inventory Step-up Expense Related to
msystems Acquisition. This is an acquisition-related
charge. It results from marking to fair value an acquired company’s
inventory at the time of acquisition. This charge is not factored
into management’s evaluation of potential acquisitions or our performance after
completion of acquisitions, because it is not related to our core operating
performance, and the frequency and amount of this type of charge can vary
significantly based on the size and timing of our
acquisitions. Excluding this data provides investors with a basis to
compare the company against the performance of other companies without this
variability.
Convertible Debt
Interest. This is the non-cash economic interest expense
relating to the implied value of the equity conversion component of the
convertible debt. The value of the equity conversion component is
treated as a debt discount and amortized to interest expense over the life of
the note using the effective interest rate method. We exclude this
non-cash interest expense as it does not represent the semi-annual cash interest
payments made to our note holders.
Income Tax
Adjustments. This amount is used to present each of the
amounts described above on an after-tax basis, considering jurisdictional tax
rates, consistent with the presentation of non-GAAP net income. It
also represents the amount of tax expense or benefit that we would record,
considering jurisdictional tax rates, if we did not have any valuation allowance
on our net deferred tax assets.
From
time-to-time in the future, there may be other items that we may exclude if we
believe that doing so is consistent with the goal of providing useful
information to investors and management.
Limitations
of Relying on Non-GAAP Financial Measures.
We have
incurred and will incur in the future, many of the costs excluded from the
non-GAAP measures, including share-based compensation expense, impairment of
goodwill and acquisition-related intangible assets, amortization of
acquisition-related intangible assets and other acquisition-related costs,
convertible debt interest expense and income tax adjustments. These
measures should be considered in addition to results prepared in accordance with
GAAP, but should not be considered a substitute for, or superior to, GAAP
results. These non-GAAP measures may be different than the non-GAAP
measures used by other companies.
Liquidity
and Capital Resources
Cash
Flows. Our cash flows were as follows:
|
FY
2009
|
Percent
Change
|
FY
2008
|
Percent
Change
|
FY
2007
|
||||||||||||||||
|
(In millions,
except percentages)
|
||||||||||||||||||||
|
Net
cash provided by operating activities
|
$ | 487.8 | 456 | % | $ | 87.7 | (87 | )% | $ | 653.0 | ||||||||||
|
Net
cash provided by (used in) investing activities
|
(374.8 | ) | (1379 | )% | 29.3 | 102 | % | (1,218.4 | ) | |||||||||||
|
Net
cash provided by (used in) financing activities
|
20.9 | 90 | % | 11.0 | 106 | % | (181.1 | ) | ||||||||||||
|
Effect
of changes in foreign currency exchange rates on cash
|
4.4 | 1367 | % | 0.3 | 160 | % | (0.5 | ) | ||||||||||||
|
Net
increase (decrease) in cash and cash equivalents
|
$ | 138.3 | 8 | % | $ | 128.3 | 117 | % | $ | (747.0 | ) | |||||||||
Operating
Activities. Cash provided by operating activities is generated
by net income (loss) adjusted for certain non-cash items and changes in assets
and liabilities. Cash provided by operations was $488 million
for fiscal year 2009 as compared to cash provided by operations of
$88 million for fiscal year 2008. The increase in cash provided
by operations in fiscal year 2009 compared to fiscal year 2008 resulted
primarily from our net income of $415 million compared with a net loss of
($1.99) billion, which included non-cash impairment charges, in the comparable
period of the prior year. Cash flow from accounts receivable
decreased, as reflected by higher accounts receivable levels in fiscal year 2009
compared with the prior year, due to increased revenue in fiscal year
2009. Cash used for inventory decreased primarily due to higher
sales. Cash flow from other assets increased compared with the prior
year primarily due to a tax refund received in the first quarter of fiscal year
2009 related to carryback claims from the fiscal year 2008 net
loss. Accounts payable trade and accounts payable from related
parties decreased primarily due to the reduction of gross inventory, operating
expenses and the timing of Flash Ventures payments as compared to the prior
year, resulting in a decrease in cash provided. Cash flow from other
liabilities in fiscal year 2009 decreased as compared to the prior year as a
result of settlements in hedge contracts and the elimination of liabilities for
Flash Ventures adverse purchase commitments associated with under utilization of
Flash Ventures’ capacity.
Cash
provided by operations was $88 million for
fiscal year 2008 as compared to cash provided by operations of $653 million
for fiscal year 2007. The decline in cash provided by operations in
fiscal year 2008 compared to fiscal year 2007 resulted primarily from our net
loss of $1.99 billion
offset by non-cash impairments. Cash flow from accounts receivable in
fiscal year 2008 was positively impacted by increased collection efforts and by
reduced product accounts receivable levels as compared with the prior year
period. The increase in inventory was related primarily to the
expansion of capacity and production at Flash Ventures while revenue from our
products declined from fiscal year 2007 to fiscal year 2008. The
increase in other assets was due to the increase in tax receivables related to
tax refunds expected on carryback claims due to the fiscal year 2008 net
loss. Within operating activities for fiscal year 2008, there was an
increase in cash provided primarily related to an increase in related parties
payables due to timing of Flash Ventures payments at fiscal year 2008 year end,
an increase in other liabilities related to Flash Ventures capacity under
utilization accrual, timing of the cash settlement of outstanding hedge
contracts, and lower deferred income on shipments to distributors and retailers
related to lower revenue levels.
Investing
Activities. Cash used in investing activities for fiscal year
2009 was ($375) million as compared to cash provided by investing
activities of $29 million in fiscal year 2008. The increase in
cash used in investing activities was primarily related to lower proceeds from
sale and maturities of short and long-term marketable securities, offset by a
reduction in the net loans made to Flash Ventures and a reduced investment in
property and equipment. During fiscal year 2009, we loaned
$378 million to Flash Ventures for equipment purchases and received
$387 million on the collection of outstanding notes receivable from Flash
Ventures for the sale of a portion of our production capacity and the return of
excess cash from Flash Partners. This resulted in a net loan
repayment from Flash Ventures of $9 million in fiscal year 2009 compared to
a loan of $384 million to Flash Ventures for equipment purchases in fiscal
year 2008.
Cash
provided by investing activities for fiscal year 2008 was $29 million as
compared to cash used in investing activities of ($1.12) billion in fiscal
year 2007. The increase in cash provided by investing was primarily
related to reduced purchases of short and long-term marketable securities due to
our higher liquidity requirements and the return of $103 million on our
investment in FlashVision and $40 million from the sale of 200-millimeter
fab equipment that we owned directly as compared to the return of
$38 million from FlashVision in the fiscal year 2007. Usage of
cash for investments in and loans to Flash Partners and Flash Alliance was
($384) million in fiscal year 2008 compared to ($651) million in
fiscal year 2007.
Financing
Activities. Net cash provided by financing activities for
fiscal year 2009 of $21 million as compared to cash provided by financing
activities of $11 million in fiscal year 2008 was primarily due to the
repayment of debt financing in fiscal year 2008 of
($10) million.
Net cash
provided by financing activities for fiscal year 2008 of $11 million as
compared to cash used in financing activities of ($181) million in fiscal
year 2007 was primarily related to lower cash proceeds from employee stock
programs and repayment of debt financing in fiscal year 2008 offset by the
termination of the share repurchase programs which used cash in fiscal year
2007.
Liquid
Assets. At January 3, 2010, we had cash, cash equivalents
and short-term marketable securities of $1.92 billion. We have
$1.10 billion of long-term marketable securities which we believe are also
liquid assets, but are classified as long-term marketable securities due to the
remaining maturity of the marketable security being greater than one
year.
Short-Term
Liquidity. As of January 3, 2010, our working capital
balance was $2.04 billion. We expect our loans to Flash Ventures
as well as our investments in property, plant and equipment to be approximately
$300 million to $400 million in fiscal year 2010.
On
February 11, 2010, we notified the holders of our 1% Convertible Notes due 2035
that we would exercise our option to redeem the $75 million outstanding on
March 15, 2010. The redemption price will be $1,000 per $1,000
principal amount of the debentures, plus accrued interest, for an aggregate cash
expenditure of $75 million plus accrued interest of
$0.4 million.
Our
short-term liquidity is impacted in part by our ability to maintain compliance
with covenants in the outstanding Flash Ventures master lease
agreements. The Flash Ventures master lease agreements contain
customary covenants for Japanese lease facilities as well as an acceleration
clause for certain events of default related to us as guarantor, including,
among other things, our failure to maintain a minimum shareholder equity of at
least $1.51 billion, and our failure to maintain a minimum corporate rating
of BB- from S&P, or Moody’s Corporation, or a minimum corporate rating of
BB+ from R&I. As of January 3, 2010, Flash Ventures was in
compliance with all of its master lease covenants. While our S&P
credit rating was B, two levels below the required minimum corporate rating
threshold from S&P, our R&I credit rating was BBB-, one level above the
required minimum corporate rating threshold from R&I.
If
R&I were to downgrade our credit rating below the minimum corporate rating
threshold, Flash Ventures would become non-compliant with certain covenants
under its master equipment lease agreements and would be required to negotiate a
resolution to the non-compliance to avoid acceleration of the obligations under
such agreements. Such resolution could include, among other things,
supplementary security to be supplied by us, as guarantor, or increased interest
rates or waiver fees, should the lessors decide they need additional collateral
or financial consideration under the circumstances. If a resolution
was unsuccessful, we could be required to pay a portion or up to the entire
$1.07 billion outstanding lease obligations covered by our guarantee under
such Flash Ventures master lease agreements, based upon the exchange rate at
January 3, 2010, which could negatively impact our short-term
liquidity.
Long-Term
Requirements. Depending on the demand for our products, we may
decide to make additional investments, which could be substantial, in wafer
fabrication foundry capacity and assembly and test manufacturing equipment to
support our business in the future. We may also make equity
investments in other companies or engage in merger or acquisition
transactions. These activities may require us to raise additional
financing, which could be difficult to obtain, and which if not obtained in
satisfactory amounts could prevent us from funding Flash Ventures; increasing
our wafer supply; developing or enhancing our products; taking advantage of
future opportunities; engaging in investments in or acquisitions of companies;
growing our business or responding to competitive pressures or unanticipated
industry changes; any of which could harm our business.
Financing
Arrangements. At January 3, 2010, we had
$1.23 billion of aggregate principal amount in convertible notes
outstanding, consisting of $1.15 billion in aggregate principal amount of
our 1% Senior Convertible Notes due 2013 and $75.0 million in aggregate
principal amount of our 1% Convertible Notes due 2035. Our 1%
Convertible Notes due 2035 may be redeemed in whole or in part by the holders
thereof at a redemption price equal to 100% of the principal amount of the notes
to be redeemed, plus accrued and unpaid interest on March 15, 2010 and
various dates thereafter. On February 11, 2010, we notified the
holders of our 1% Convertible Notes due 2035 that we would exercise our option
to redeem the $75 million outstanding on March 15, 2010. The
redemption price will be $1,000 per $1,000 principal amount of the debentures,
plus accrued interest, for an aggregate cash expenditure of $75 million plus
accrued interest of $0.4 million.
Concurrent
with the issuance of the 1% Senior Convertible Notes due 2013, we sold warrants
to acquire shares of our common stock at an exercise price of $95.03 per
share. As of January 3, 2010, the warrants had an expected life
of approximately 3.6 years and expire in August 2013. At
expiration, we may, at our option, elect to settle the warrants on a net share
basis. As of January 3, 2010, the warrants had not been
exercised and remain outstanding. In addition, counterparties agreed
to sell to us up to approximately 14.0 million shares of our common stock,
which is the number of shares initially issuable upon conversion of the 1%
Senior Convertible Notes due 2013 in full, at a conversion price of $82.36 per
share. The convertible bond hedge transaction will be settled in net
shares and will terminate upon the earlier of the maturity date of the 1% Senior
Convertible Notes due 2013 or the first day that none of the 1% Senior
Convertible Notes due 2013 remain outstanding due to conversion or
otherwise. Settlement of the convertible bond hedge in net shares on
the expiration date would result in us receiving net shares equivalent to the
number of shares issuable by us upon conversion of the 1% Senior Convertible
Notes due 2013. As of January 3, 2010, we had not purchased any
shares under this convertible bond hedge agreement. See Note 7,
“Financing Arrangements,” of the Notes to Consolidated Financial Statements of
this Form 10-K included in Item 8 of this report.
Flash Partners
and Flash Alliance Ventures with Toshiba. We are a 49.9% owner
in both Flash Partners and Flash Alliance, or hereinafter collectively referred
to as Flash Ventures, our business ventures with Toshiba to develop and
manufacture NAND flash memory products. These NAND flash memory
products are manufactured by Toshiba at Toshiba’s Yokkaichi, Japan operations
using the semiconductor manufacturing equipment owned or leased by Flash
Ventures. This equipment is funded or will be funded by investments
in or loans to the Flash Ventures from us and Toshiba as well as through
operating leases received by Flash Ventures from third-party banks and
guaranteed by us and Toshiba. Flash Ventures purchase wafers from
Toshiba at cost and then resells those wafers to us and Toshiba at cost plus a
markup. We are contractually obligated to purchase half of Flash
Ventures’ NAND wafer supply or to pay for 50% of the fixed costs of Flash
Ventures. We are not able to estimate our total wafer purchase
obligations beyond our rolling three month purchase commitment because the price
is determined by reference to the future cost to produce the
wafers. See Note 14, “Related Parties and Strategic Investments,” of
the Notes to Consolidated Financial Statements of this Form 10-K included in
Item 8 of this report.
The cost
of the wafers we purchase from Flash Ventures is recorded in inventory and
ultimately cost of product revenues. Flash Ventures are variable
interest entities; however, we are not the primary beneficiary of these ventures
because we are entitled to less than a majority of expected gains and losses
with respect to each venture. Accordingly, we account for our
investments under the equity method and do not consolidate.
Under
Flash Ventures’ agreements, we agreed to share in Toshiba’s costs associated
with NAND product development and our common semiconductor research and
development activities. We and Toshiba each pay the cost of our own
design teams and 50% of the wafer processing and similar costs associated with
this direct design and development of flash memory. In the fourth
quarter of fiscal year 2008, our requirement to fund common research and
development activities ended and final funding was completed in the second
quarter of fiscal year 2009. As of January 3, 2010 and
December 28, 2008, we accrued liabilities related to these expenses of zero
and $4.0 million, respectively. We continue to participate in
other common research and development activities with Toshiba but are not
committed to any minimum funding level.
For
semiconductor fixed assets that are leased by Flash Ventures, we and Toshiba
jointly guarantee on an unsecured and several basis, 50% of the outstanding
Flash Ventures’ lease obligations under master lease agreements entered into
from December 2004 through December 2008. These master
lease obligations are denominated in Japanese yen and are
noncancelable. Our total master lease obligation guarantee, net of
lease payments, as of January 3, 2010, was 98.9 billion Japanese yen,
or approximately $1.07 billion based upon the exchange rate at
January 3, 2010.
In our
fiscal year 2009, we and Toshiba restructured Flash Ventures by selling more
than 20% of Flash Ventures’ capacity to Toshiba. The restructuring
resulted in us receiving value of 79.3 billion Japanese yen of which
26.1 billion Japanese yen, or $277 million, was received in cash,
reducing outstanding notes receivable from Flash Ventures and 53.2 billion
Japanese yen of value reflected the transfer of off-balance sheet equipment
lease guarantee obligations from us to Toshiba. The restructuring was
completed in a series of closings beginning in January 2009 and extending
through March 31, 2009. In the first quarter of fiscal year
2009, transaction costs of $10.9 million related to the sale and transfer
of equipment and lease obligations were expensed.
From
time-to-time, we and Toshiba mutually approve the purchase of equipment in the
Flash Ventures for conversion to new process technologies or the addition of
wafer capacity. Flash Partners has reached full wafer
capacity. Flash Alliance’s production output ramped in fiscal year
2008 to more than 50% of its estimated full wafer capacity. During
fiscal year 2010, we expect our portion of capital investments in Flash Ventures
for new process technologies and additional wafer capacity to be between $600
million to $800 million, which we expect will be funded through additional loans
to Flash Ventures, working capital contributions from Flash Ventures and
equipment operating leases.
FlashVision
Venture with Toshiba. In the second quarter of fiscal year
2008, we and Toshiba determined that production of NAND flash memory products
utilizing 200-millimeter wafers was no longer cost effective relative to market
prices for NAND flash memory and decided to wind-down the FlashVision
venture. As part of the ongoing wind-down of FlashVision, Toshiba
purchased certain assets of FlashVision. The existing master
equipment lease agreement between FlashVision and a consortium of financial
institutions has been retired, thereby releasing us from our contingent
indemnification obligation with Toshiba. In fiscal year 2009, we
received distributions of $12.7 million, released $43.3 million of
cumulative translation adjustments recorded in accumulated OCI and impaired the
remaining $7.9 million relating to our investment in
FlashVision.
Contractual
Obligations and Off-Balance Sheet Arrangements
Our
contractual obligations and off-balance sheet arrangements at January 3,
2010, and the effect those contractual obligations are expected to have on our
liquidity and cash flow over the next five years are presented in textual and
tabular format in Note 13, “Commitments, Contingencies and Guarantees,” of the
Notes to Consolidated Financial Statements of this Form 10-K included in Item 8
of this report.
Impact
of Currency Exchange Rates
Exchange
rate fluctuations could have a material adverse effect on our business,
financial condition and results of operations. Our most significant
foreign currency exposure is to the Japanese yen in which we purchase the vast
majority of our NAND flash wafers. In addition, we also have
significant costs denominated in the Chinese renminbi and the Israeli new
shekel, and we have revenue denominated in the European euro and the British
pound. We do not enter into derivatives for speculative or trading
purposes. We use foreign currency forward and cross currency swap
contracts to mitigate transaction gains and losses generated by certain monetary
assets and liabilities denominated in currencies other than the U.S.
dollar. We use foreign currency forward contracts and options to
partially hedge our future Japanese yen costs for NAND flash
wafers. Our derivative instruments are recorded at fair value in
assets or liabilities with final gains or losses recorded in other income
(expense) or as a component of accumulated OCI and subsequently reclassified
into cost of product revenues in the same period or periods in which the cost of
product revenues is recognized. These foreign currency exchange
exposures may change over time as our business and business practices evolve,
and they could harm our financial results and cash flows. See Note 4,
“Derivatives and Hedging Activities,” of the Notes to Consolidated Financial
Statements of this Form 10-K included in Item 8 of this report.
For a
discussion of foreign operating risks and foreign currency risks, see Item 1A,
“Risk Factors.”
Recent
Accounting Pronouncements
See Note
2, “Recent Accounting Pronouncements,” of the Notes to Consolidated Financial
Statements of this Form 10-K included in Item 8 of this report.
|
QUANTITATIVE AND QUALITATIVE
DISCLOSURES ABOUT MARKET
RISK
|
We are
exposed to financial market risks, including changes in interest rates, foreign
currency exchange rates and marketable equity security prices.
Interest Rate
Risk. Our exposure to market risk for changes in interest
rates relates primarily to our investment portfolio. The primary
objective of our investment activities is to preserve principal while maximizing
yields without significantly increasing risk. This is accomplished by
investing in widely diversified investment grade marketable
securities. As of January 3, 2010, a hypothetical 50 basis point
increase in interest rates would result in an approximate $12 million
decline (less than 0.68%) in the fair value of our available-for-sale debt
securities.
Foreign Currency
Risk. The majority of our revenues are transacted in the U.S.
dollar, with some revenues transacted in the European euro, the British pound,
and the Japanese yen. Our flash memory costs, which represent the
largest portion of our cost of revenues, are denominated in the Japanese
yen. We also have some cost of revenues denominated in Chinese
renminbi. The majority of our operating expenses are denominated in
the U.S. dollar; however, we have expenses denominated in the Israeli new shekel
and numerous other currencies. On the balance sheet, we have numerous
foreign currency denominated monetary assets and liabilities, with the largest
monetary exposure being our notes receivable from Flash Ventures, which are
denominated in Japanese yen.
We enter
into foreign currency forward contracts to hedge the gains or losses generated
by the remeasurement of our significant foreign currency denominated monetary
assets and liabilities. The fair value of these contracts is
reflected as other current assets or other current liabilities and the change in
fair value of these balance sheet hedge contracts is recorded into earnings as a
component of other income (expense) to largely offset the change in fair value
of the foreign currency denominated monetary assets and liabilities which is
also recorded in other income (expense).
We use
foreign currency forward contracts and option contracts to partially hedge our
future Japanese yen flash memory costs. These contracts are
designated as cash flow hedges and are carried on our balance sheet at fair
value with the effective portion of the contracts’ gains or losses included in
accumulated OCI and subsequently recognized in cost of product revenues in the
same period the hedged cost of product revenues is recognized.
At
January 3, 2010, we had foreign currency forward exchange and cross
currency swap contracts in place that amounted to a net sale in U.S. dollar
equivalent of approximately $250 million in foreign currencies to hedge our
foreign currency denominated monetary net asset position. The
maturities of these contracts were 36 months or less.
At
January 3, 2010 we had no foreign currency forward exchange contracts and
option contracts in place to partially hedge our expected future wafer purchases
in Japanese yen due to the low exchange rate of the U.S. dollar against the
Japanese yen relative to historical levels.
The
notional amount and unrealized gain of our outstanding cross currency swap and
foreign currency forward contracts that are non-designated (balance sheet
hedges) as of January 3, 2010 is shown in the table below. In
addition, this table shows the change in fair value of these balance sheet
hedges assuming a hypothetical adverse foreign currency exchange rate movement
of 10 percent. These changes in fair values would be largely offset
in other income (expense) by corresponding changes in the fair values of the
foreign currency denominated monetary assets and liabilities.
|
Notional
Amount
|
Unrealized
Gain (Loss) as of January 3, 2010
|
Change
in Fair Value Due to 10% Adverse Rate Movement
|
||||||||||
|
(In
thousands)
|
||||||||||||
|
Balance
sheet hedges:
|
||||||||||||
|
Cross
currency swap contracts entered
|
$ | (412,610 | ) | $ | (18,175 | ) | $ | (60,271 | ) | |||
|
Forward
contracts sold
|
(97,578 | ) | 2,779 | (7,216 | ) | |||||||
|
Forward
contracts purchased
|
260,195 | (4,142 | ) | 24,746 | ||||||||
|
Total
net outstanding contracts
|
$ | (249,993 | ) | $ | (19,538 | ) | $ | (42,741 | ) | |||
Notwithstanding
our efforts to mitigate some foreign exchange risks, we do not hedge all of our
foreign currency exposures, and there can be no assurances that our mitigating
activities related to the exposures that we do hedge will adequately protect us
against risks associated with foreign currency fluctuations.
Market
Risk. We also hold available-for-sale equity securities in
semiconductor wafer manufacturing companies. As of January 3,
2010, a reduction in price of 10% of these marketable equity securities would
result in a decrease in the fair value of our investments in marketable equity
securities of approximately $1 million.
All of
the potential changes noted above are based on sensitivity analysis performed on
our financial position at January 3, 2010. Actual results may
differ materially.
|
ITEM
8.
|
FINANCIAL STATEMENTS AND
SUPPLEMENTARY DATA
|
The
information required by this item is set forth beginning at page
F-1.
|
CHANGES IN AND DISAGREEMENTS
WITH ACCOUNTANTS ON ACCOUNTING AND FINANCIAL
DISCLOSURE
|
Not
applicable.
|
CONTROLS AND
PROCEDURES
|
Evaluation of
Disclosure Controls and Procedures. Under the supervision and
with the participation of our management, including our principal executive
officer and principal financial officer, we conducted an evaluation of the
effectiveness of the design and operation of our disclosure controls and
procedures, as defined in Rules 13a-15(e) and 15d-15(e) under the Securities
Exchange Act of 1934 as of the end of the period covered by this report (the
“Evaluation Date”). Based upon the evaluation, our principal
executive officer and principal financial officer concluded as of the Evaluation
Date that our disclosure controls and procedures were
effective. Disclosure controls are controls and procedures designed
to reasonably ensure that information required to be disclosed in our reports
filed under the Exchange Act, such as this report, is recorded, processed,
summarized and reported within the time periods specified in the SEC’s rules and
forms. Disclosure controls include controls and procedures designed
to reasonably ensure that such information is accumulated and communicated to
our management, including our chief executive officer and chief financial
officer, as appropriate to allow timely decisions regarding required
disclosure. Our quarterly evaluation of disclosure controls and
procedures includes an evaluation of some components of our internal control
over financial reporting, and internal control over financial reporting is also
separately evaluated on an annual basis for purposes of providing the management
report which is set forth below.
Report of
Management on Internal Control Over Financial Reporting. Our
management is responsible for establishing and maintaining a comprehensive
system of internal control over financial reporting to provide reasonable
assurance of the proper authorization of transactions, the safeguarding of
assets and the reliability of the financial records. Our internal
control system was designed to provide reasonable assurance to our management
and board of directors regarding the preparation and fair presentation of
published financial statements. The system of internal control over
financial reporting provides for appropriate division of responsibility and is
documented by written policies and procedures that are communicated to
employees. The framework upon which management relied in evaluating
the effectiveness of our internal control over financial reporting was set forth
in Internal Controls —
Integrated Framework published by the Committee of Sponsoring
Organizations of the Treadway Commission.
Based on
the results of our evaluation, our management concluded that our internal
control over financial reporting was effective as of January 3,
2010.
However,
projections of any evaluation of effectiveness to future periods are subject to
the risk that controls may become inadequate because of changes in our business
or other conditions, or that the degree of compliance with our policies or
procedures may deteriorate.
Our
independent registered public accounting firm has audited the financial
statements included in Item 8 of this report and has issued an attestation
report on our internal control over financial reporting which is included at
page F-3.
Inherent
Limitations of Disclosure Controls and Procedures and Internal Control over
Financial Reporting. It should be noted that any system of
controls, however well designed and operated, can provide only reasonable, and
not absolute, assurance that the objectives of the system will be
met. In addition, the design of any control system is based in part
upon certain assumptions about the likelihood of future events.
Changes in
Internal Control over Financial Reporting. There were no
changes in our internal control over financial reporting (as defined in Exchange
Act Rule 13a-15(f)) during the quarter ended January 3, 2010 that have
materially affected, or are reasonably likely to materially affect, our internal
control over financial reporting.
|
OTHER
INFORMATION
|
Not
applicable.
PART
III
|
DIRECTORS, EXECUTIVE OFFICERS
AND CORPORATE GOVERNANCE
|
The
information required by this item is set forth under “Business-Executive
Officers” in this report and under “Election of Directors” and “Compliance with
Section 16(a) of the Securities Exchange Act of 1934” in our Proxy Statement for
our 2010 Annual Meeting of Stockholders, and is incorporated herein by
reference.
We have
adopted a code of ethics that applies to our principal executive officer and
principal financial and accounting officer. This code of ethics,
which consists of the “SanDisk Code of Ethics for Financial Executives” section
of our code of ethics, that applies to employees generally, is posted on our
website at
“www.sandisk.com/about-sandisk/corporate-social-responsibility/corporate-responsibility/labor-and-ethics.” From
this webpage, click on “SanDisk Worldwide Code of Business Conduct and
Ethics.”
We intend
to satisfy the disclosure requirement under Item 5.05 of Form 8-K regarding an
amendment to, or waiver from, a provision of this code of ethics by posting the
required information on our website, at the address and location specified
above.
|
EXECUTIVE
COMPENSATION
|
The
information required by this item is set forth under “Director Compensation-
Fiscal 2009,” “Report of the Compensation Committee,” “Compensation Discussion
and Analysis,” “Summary Compensation Table- Fiscal 2009,” “Outstanding Equity
Awards at Fiscal 2009 Year-End” and “Option Exercises and Stock Vested in Fiscal
2009” in our Proxy Statement for our 2010 Annual Meeting of Stockholders, and is
incorporated herein by reference.
|
SECURITY OWNERSHIP OF CERTAIN
BENEFICIAL OWNERS AND MANAGEMENT AND RELATED STOCKHOLDER
MATTERS
|
The
information required by this item is set forth under “Security Ownership of
Certain Beneficial Owners and Management and Related Stockholder Matters” and
“Equity Compensation Information for Plans or Individual Arrangements with
Employees and Non-Employees” in our Proxy Statement for our 2010 Annual Meeting
of Stockholders, and is incorporated herein by reference.
|
CERTAIN RELATIONSHIPS AND
RELATED TRANSACTIONS, AND DIRECTOR
INDEPENDENCE
|
The
information required by this item is set forth under “Compensation Committee
Interlocks and Insider Participation,” “Certain Transactions and Relationships,”
and under “Election of Directors” in our Proxy Statement for our 2010 Annual
Meeting of Stockholders, and is incorporated herein by reference.
|
PRINCIPAL ACCOUNTANT FEES AND
SERVICES
|
The
information required by this item is set forth under the caption “Principal
Accountant Fees and Services” and “Report of the Audit Committee” in our Proxy
Statement for our 2010 Annual Meeting of Stockholders, and is incorporated
herein by reference.
PART
IV
|
EXHIBITS AND FINANCIAL
STATEMENT SCHEDULES
|
(a) Documents
filed as part of this report
1) All financial
statements
|
Index to Financial
Statements
|
Page
|
|
F-2
|
|
|
F-4
|
|
|
F-5
|
|
|
F-6
|
|
|
F-7
|
|
|
F-8
|
All other
schedules have been omitted because the required information is not present or
not present in amounts sufficient to require submission of the schedules, or
because the information required is included in the Consolidated Financial
Statements or notes thereto.
2) Exhibits required by Item 601 of
Regulation S-K
The
information required by this item is set forth on the exhibit index which
follows the signature page of this report.
|
Page
|
|
|
F-2
|
|
|
F-4
|
|
|
F-5
|
|
|
F-6
|
|
|
F-7
|
|
|
F-8
|
PUBLIC
ACCOUNTING FIRM
The Board
of Directors and Stockholders of
SanDisk
Corporation
We have
audited the accompanying Consolidated Balance Sheets of SanDisk Corporation as
of January 3, 2010 and December 28, 2008, and the related Consolidated
Statements of Operations, Equity, and Cash Flows for each of the three years in
the period ended January 3, 2010. These financial statements are the
responsibility of the company’s management. Our responsibility is to
express an opinion on these financial statements based on our
audits.
We
conducted our audits in accordance with the standards of the Public Company
Accounting Oversight Board (United States). Those standards require
that we plan and perform the audit to obtain reasonable assurance about whether
the financial statements are free of material misstatement. An audit
includes examining, on a test basis, evidence supporting the amounts and
disclosures in the financial statements. An audit also includes
assessing the accounting principles used and significant estimates made by
management, as well as evaluating the overall financial statement
presentation. We believe that our audits provide a reasonable basis
for our opinion.
In our
opinion, the financial statements referred to above present fairly, in all
material respects, the consolidated financial position of SanDisk Corporation at
January 3, 2010 and December 28, 2008, and the consolidated results of its
operations and its cash flows for each of the three years in the period ended
January 3, 2010, in conformity with U.S. generally accepted accounting
principles.
We also
have audited, in accordance with the standards of the Public Company Accounting
Oversight Board (United States), SanDisk Corporation’s internal control over
financial reporting as of January 3, 2010, based on criteria
established in Internal Control — Integrated Framework issued by the Committee
of Sponsoring Organizations of the Treadway Commission and our report dated
February 25, 2010 expressed an unqualified opinion
thereon.
/s/ Ernst
& Young LLP
San Jose,
California
February 25,
2010
REPORT
OF INDEPENDENT REGISTERED
PUBLIC
ACCOUNTING FIRM
The Board
of Directors and Stockholders of
SanDisk
Corporation
We have
audited SanDisk Corporation’s internal control over financial reporting as of
January 3, 2010, based on criteria established in Internal Control —
Integrated Framework issued by the Committee of Sponsoring Organizations of the
Treadway Commission (the “COSO criteria”). SanDisk Corporation’s
management is responsible for maintaining effective internal control over
financial reporting and for its assessment of the effectiveness of internal
control over financial reporting included in the accompanying Report of
Management on Internal Control Over Financial Reporting. Our
responsibility is to express an opinion on the company’s internal control over
financial reporting based on our audit.
We
conducted our audit in accordance with the standards of the Public Company
Accounting Oversight Board (United States). Those standards require
that we plan and perform the audit to obtain reasonable assurance about whether
effective internal control over financial reporting was maintained in all
material respects. Our audit included obtaining an understanding of
internal control over financial reporting, assessing the risk that a material
weakness exists, testing and evaluating the design and operating effectiveness
of internal control based on the assessed risk, and performing such other
procedures as we considered necessary in the circumstances. We
believe that our audit provides a reasonable basis for our opinion.
A
company’s internal control over financial reporting is a process designed to
provide reasonable assurance regarding the reliability of financial reporting
and the preparation of financial statements for external purposes in accordance
with generally accepted accounting principles. A company’s internal
control over financial reporting includes those policies and procedures that (1)
pertain to the maintenance of records that, in reasonable detail, accurately and
fairly reflect the transactions and dispositions of the assets of the company;
(2) provide reasonable assurance that transactions are recorded as necessary to
permit preparation of financial statements in accordance with generally accepted
accounting principles, and that receipts and expenditures of the company are
being made only in accordance with authorizations of management and directors of
the company; and (3) provide reasonable assurance regarding prevention or timely
detection of unauthorized acquisition, use, or disposition of the company’s
assets that could have a material effect on the financial
statements.
Because
of its inherent limitations, internal control over financial reporting may not
prevent or detect misstatements. Also, projections of any evaluation
of effectiveness to future periods are subject to the risk that controls may
become inadequate because of changes in conditions, or that the degree of
compliance with the policies or procedures may deteriorate.
In our
opinion, SanDisk Corporation maintained, in all material respects, effective
internal control over financial reporting as of January 3, 2010, based on the
COSO criteria.
We also
have audited, in accordance with the standards of the Public Company Accounting
Oversight Board (United States), the Consolidated Balance Sheets of SanDisk
Corporation as of January 3, 2010 and December 28, 2008, and the
related Consolidated Statements of Operations, Equity, and Cash Flows for each
of the three years in the period ended January 3, 2010 and our report
dated February 25, 2010 expressed an unqualified opinion
thereon.
/s/ Ernst & Young LLP
San Jose,
California
February 25,
2010
CONSOLIDATED
BALANCE SHEETS
|
January 3,
2010
|
December 28,
2008
|
|||||||
|
(In
thousands, except for share and per share amounts)
|
||||||||
|
ASSETS
|
||||||||
|
Current
assets:
|
||||||||
|
Cash
and cash equivalents
|
$ | 1,100,364 | $ | 962,061 | ||||
|
Short-term
marketable securities
|
819,002 | 477,296 | ||||||
|
Accounts
receivable from product revenues, net of allowance for doubtful accounts
of $12,348 in fiscal year 2009 and $13,881 in fiscal year
2008
|
234,407 | 122,092 | ||||||
|
Inventory
|
596,493 | 598,251 | ||||||
|
Deferred
taxes
|
66,869 | 84,023 | ||||||
|
Other
current assets
|
97,639 | 469,961 | ||||||
|
Total
current assets
|
2,914,774 | 2,713,684 | ||||||
|
Long-term
marketable securities
|
1,097,095 | 1,097,302 | ||||||
|
Property
and equipment, net
|
300,997 | 396,987 | ||||||
|
Notes
receivable and investments in flash ventures with Toshiba
|
1,507,550 | 1,602,291 | ||||||
|
Deferred
taxes
|
21,210 | 15,188 | ||||||
|
Intangible
assets, net
|
58,076 | 63,182 | ||||||
|
Other
non-current assets
|
102,017 | 43,506 | ||||||
|
Total
assets
|
$ | 6,001,719 | $ | 5,932,140 | ||||
|
LIABILITIES
|
||||||||
|
Current
liabilities:
|
||||||||
|
Accounts
payable trade
|
$ | 134,427 | $ | 240,985 | ||||
|
Accounts
payable to related parties
|
182,091 | 370,006 | ||||||
|
Convertible
short-term debt
|
75,000 | — | ||||||
|
Other
current accrued liabilities
|
234,079 | 502,443 | ||||||
|
Deferred
income on shipments to distributors and retailers and deferred
revenue
|
245,513 | 149,575 | ||||||
|
Total
current liabilities
|
871,110 | 1,263,009 | ||||||
|
Convertible
long-term debt
|
934,722 | 954,094 | ||||||
|
Non-current
liabilities
|
287,478 | 274,316 | ||||||
|
Total
liabilities
|
2,093,310 | 2,491,419 | ||||||
|
Commitments
and contingencies (see Note 13)
|
||||||||
|
EQUITY
|
||||||||
|
Stockholders’
equity:
|
||||||||
|
Preferred
stock, $0.001 par value, Authorized shares: 4,000,000, Issued and
outstanding: none
|
— | — | ||||||
|
Common
stock, $0.001 par value; Authorized shares: 800,000,000; Issued
and outstanding: 228,656,504 in fiscal year 2009 and 226,128,177 in fiscal
year 2008
|
229 | 226 | ||||||
|
Capital
in excess of par value
|
4,268,845 | 4,154,166 | ||||||
|
Accumulated
deficit
|
(487,489 | ) | (902,799 | ) | ||||
|
Accumulated
other comprehensive income
|
128,713 | 188,977 | ||||||
|
Total
stockholders’ equity
|
3,910,298 | 3,440,570 | ||||||
|
Non-controlling
interests
|
(1,889 | ) | 151 | |||||
|
Total
equity
|
3,908,409 | 3,440,721 | ||||||
|
Total
liabilities and equity
|
$ | 6,001,719 | $ | 5,932,140 | ||||
The
accompanying notes are an integral part of these consolidated financial
statements.
CONSOLIDATED
STATEMENTS OF OPERATIONS
|
Fiscal
Years Ended
|
||||||||||||
|
January 3,
2010
|
December 28,
2008
|
December 30,
2007
|
||||||||||
|
(In
thousands, except per share amounts)
|
||||||||||||
|
Revenues
|
||||||||||||
|
Product
|
$ | 3,154,314 | $ | 2,843,243 | $ | 3,446,125 | ||||||
|
License
and royalty
|
412,492 | 508,109 | 450,241 | |||||||||
|
Total
revenues
|
3,566,806 | 3,351,352 | 3,896,366 | |||||||||
|
Cost
of product revenues
|
2,269,651 | 3,233,753 | 2,628,838 | |||||||||
|
Amortization
of acquisition-related intangible assets
|
12,529 | 54,512 | 64,809 | |||||||||
|
Total
cost of product revenues
|
2,282,180 | 3,288,265 | 2,693,647 | |||||||||
|
Gross
profit
|
1,284,626 | 63,087 | 1,202,719 | |||||||||
|
Operating
expenses
|
||||||||||||
|
Research
and development
|
384,158 | 429,949 | 418,066 | |||||||||
|
Sales
and marketing
|
208,514 | 328,079 | 294,594 | |||||||||
|
General
and administrative
|
171,359 | 204,765 | 181,509 | |||||||||
|
Impairment
of goodwill
|
— | 845,453 | — | |||||||||
|
Impairment
of acquisition-related intangible assets
|
— | 175,785 | — | |||||||||
|
Amortization
of acquisition-related intangible assets
|
1,167 | 17,069 | 25,308 | |||||||||
|
Restructuring
and other
|
38 | 35,467 | 6,728 | |||||||||
|
Total
operating expenses
|
765,236 | 2,036,567 | 926,205 | |||||||||
|
Operating
income (loss)
|
519,390 | (1,973,480 | ) | 276,514 | ||||||||
|
Interest
income
|
63,273 | 94,417 | 133,355 | |||||||||
|
Loss
in equity investments
|
(1,646 | ) | (39,568 | ) | (9,949 | ) | ||||||
|
Interest
(expense) and other income (expense), net
|
(77,216 | ) | (33,743 | ) | (47,262 | ) | ||||||
|
Total
other income (expense), net
|
(15,589 | ) | 21,106 | 76,144 | ||||||||
|
Income
(loss) before provision for income taxes
|
503,801 | (1,952,374 | ) | 352,658 | ||||||||
|
Provision
for income taxes
|
88,491 | 34,250 | 156,831 | |||||||||
|
Net
income (loss)
|
415,310 | (1,986,624 | ) | 195,827 | ||||||||
|
Less:
Income attributable to non-controlling interests
|
— | — | 5,211 | |||||||||
|
Net
income (loss) attributable to common stockholders
|
$ | 415,310 | $ | (1,986,624 | ) | $ | 190,616 | |||||
|
Net
income (loss) attributable to common stockholders per
share:
|
||||||||||||
|
Basic
|
$ | 1.83 | $ | (8.82 | ) | $ | 0.84 | |||||
|
Diluted
|
$ | 1.79 | $ | (8.82 | ) | $ | 0.81 | |||||
|
Shares
used in computing net income (loss) attributable to common
stockholders per share:
|
||||||||||||
|
Basic
|
227,435 | 225,292 | 227,744 | |||||||||
|
Diluted
|
231,959 | 225,292 | 235,857 | |||||||||
The
accompanying notes are an integral part of these consolidated financial
statements.
CONSOLIDATED
STATEMENTS OF EQUITY
|
Common
Stock Shares
|
Common
Stock
Par
Value
|
Capital
in Excess of Par Value
|
Retained
Earnings (Accumulated Deficit)
|
Accumulated
Other Comprehensive
Income
|
Total
|
Non-controlling
Interests
|
Total
Equity
|
|||||||||||||||||||||||||
|
(In
thousands)
|
||||||||||||||||||||||||||||||||
|
Balance
at December 31, 2006
|
226,518 | $ | 226 | $ | 3,898,758 | $ | 1,087,017 | $ | 5,493 | $ | 4,991,494 | $ | 5,976 | $ | 4,997,470 | |||||||||||||||||
|
Net
income
|
— | — | — | 190,616 | — | 190,616 | 5,211 | 195,827 | ||||||||||||||||||||||||
|
Unrealized
gain on available-for-sale investments
|
— | — | — | — | 6,770 | 6,770 | — | 6,770 | ||||||||||||||||||||||||
|
Foreign
currency translation
|
— | — | — | — | 15,797 | 15,797 | — | 15,797 | ||||||||||||||||||||||||
|
Unrealized
gain on hedging activities
|
— | — | — | — | 4,415 | 4,415 | — | 4,415 | ||||||||||||||||||||||||
|
Comprehensive
income
|
217,598 | 5,211 | 222,809 | |||||||||||||||||||||||||||||
|
Distribution
to non-controlling interests
|
— | — | — | — | — | — | (10,120 | ) | (10,120 | ) | ||||||||||||||||||||||
|
Issuance
of shares pursuant to equity plans
|
4,724 | 5 | 87,010 | — | — | 87,015 | — | 87,015 | ||||||||||||||||||||||||
|
Issuance
of stock pursuant to employee stock purchase plan
|
386 | — | 13,296 | — | — | 13,296 | — | 13,296 | ||||||||||||||||||||||||
|
Income
tax benefit from stock options exercised
|
— | — | 18,442 | — | — | 18,442 | — | 18,442 | ||||||||||||||||||||||||
|
Share-based
compensation expense
|
— | — | 132,647 | — | — | 132,647 | — | 132,647 | ||||||||||||||||||||||||
|
Cumulative
effect to prior year related to unrecognized tax benefits upon adoption of
FIN 48
|
— | — | (4,756 | ) | (993 | ) | — | (5,749 | ) | — | (5,749 | ) | ||||||||||||||||||||
|
Share
repurchases
|
(7,461 | ) | (7 | ) | (106,785 | ) | (192,815 | ) | — | (299,607 | ) | — | (299,607 | ) | ||||||||||||||||||
|
Consolidated
venture capital contributions
|
— | — | 100 | — | — | 100 | — | 100 | ||||||||||||||||||||||||
|
Balance
at December 30, 2007
|
224,167 | 224 | 4,038,712 | 1,083,825 | 32,475 | 5,155,236 | 1,067 | 5,156,303 | ||||||||||||||||||||||||
|
Net
loss
|
— | — | — | (1,986,624 | ) | — | (1,986,624 | ) | — | (1,986,624 | ) | |||||||||||||||||||||
|
Unrealized
loss on available-for-sale investments
|
— | — | — | — | (22,650 | ) | (22,650 | ) | — | (22,650 | ) | |||||||||||||||||||||
|
Foreign
currency translation
|
— | — | — | — | 77,368 | 77,368 | — | 77,368 | ||||||||||||||||||||||||
|
Unrealized
gain on hedging activities
|
— | — | — | — | 101,784 | 101,784 | — | 101,784 | ||||||||||||||||||||||||
|
Comprehensive
loss
|
(1,830,122 | ) | — | (1,830,122 | ) | |||||||||||||||||||||||||||
|
Distribution
to non-controlling interests
|
— | — | — | — | — | — | (916 | ) | (916 | ) | ||||||||||||||||||||||
|
Issuance
of shares pursuant to equity plans
|
1,005 | 1 | 5,397 | — | — | 5,398 | — | 5,398 | ||||||||||||||||||||||||
|
Issuance
of stock pursuant to employee stock purchase plan
|
956 | 1 | 14,302 | — | — | 14,303 | — | 14,303 | ||||||||||||||||||||||||
|
Income
tax benefit from stock options exercised
|
— | — | (3,945 | ) | — | — | (3,945 | ) | — | (3,945 | ) | |||||||||||||||||||||
|
Share-based
compensation expense
|
— | — | 98,719 | — | — | 98,719 | — | 98,719 | ||||||||||||||||||||||||
|
Change
in unrecognized tax benefits as a result of settlement and expiration of
statute of limitations
|
— | — | 981 | — | — | 981 | — | 981 | ||||||||||||||||||||||||
|
Balance
at December 28, 2008
|
226,128 | 226 | 4,154,166 | (902,799 | ) | 188,977 | 3,440,570 | 151 | 3,440,721 | |||||||||||||||||||||||
|
Net
income
|
— | — | — | 415,310 | — | 415,310 | — | 415,310 | ||||||||||||||||||||||||
|
Unrealized
gain on available-for-sale investments
|
— | — | — | — | 45,328 | 45,328 | — | 45,328 | ||||||||||||||||||||||||
|
Foreign
currency translation
|
— | — | — | — | (2,762 | ) | (2,762 | ) | — | (2,762 | ) | |||||||||||||||||||||
|
Unrealized
loss on hedging activities
|
— | — | — | — | (102,830 | ) | (102,830 | ) | — | (102,830 | ) | |||||||||||||||||||||
|
Comprehensive
income
|
355,046 | — | 355,046 | |||||||||||||||||||||||||||||
|
Loss
on non-controlling interest
|
— | — | — | — | — | — | (2,040 | ) | (2,040 | ) | ||||||||||||||||||||||
|
Issuance
of shares pursuant to equity plans
|
1,370 | 2 | 9,712 | — | — | 9,714 | — | 9,714 | ||||||||||||||||||||||||
|
Issuance
of stock pursuant to employee stock purchase plan
|
1,159 | 1 | 11,163 | — | — | 11,164 | — | 11,164 | ||||||||||||||||||||||||
|
Share-based
compensation expense
|
— | — | 93,804 | — | — | 93,804 | — | 93,804 | ||||||||||||||||||||||||
|
Balance
at January 3, 2010
|
228,657 | $ | 229 | $ | 4,268,845 | $ | (487,489 | ) | $ | 128,713 | $ | 3,910,298 | $ | (1,889 | ) | $ | 3,908,409 | |||||||||||||||
CONSOLIDATED
STATEMENTS OF CASH FLOWS
|
Fiscal
Years Ended
|
||||||||||||
|
January 3,
2010
|
December 28,
2008
|
December 30,
2007
|
||||||||||
|
(In
thousands)
|
||||||||||||
|
Cash
flows from operating activities:
|
||||||||||||
|
Net
income (loss) attributable to common stockholders
|
$ | 415,310 | $ | (1,986,624 | ) | $ | 190,616 | |||||
|
Adjustments
to reconcile net income (loss) attributable to common stockholders to net
cash provided by operating activities:
|
||||||||||||
|
Deferred
and other taxes
|
(12,884 | ) | 146,141 | (53,205 | ) | |||||||
|
Depreciation
and amortization
|
230,696 | 306,729 | 301,501 | |||||||||
|
Provision
for doubtful accounts
|
(719 | ) | 8,778 | 3,530 | ||||||||
|
Share-based
compensation expense
|
95,560 | 97,799 | 133,010 | |||||||||
|
Excess
tax benefit from share-based compensation
|
— | (1,938 | ) | (18,375 | ) | |||||||
|
Impairment,
restructuring and other charges
|
4,293 | 1,146,407 | — | |||||||||
|
Other
non-cash charges (income)
|
(2,757 | ) | 19,856 | 12,721 | ||||||||
|
Changes
in operating assets and liabilities:
|
||||||||||||
|
Accounts
receivable from product revenues
|
(111,597 | ) | 332,113 | 145,657 | ||||||||
|
Inventory
|
(13,485 | ) | (42,969 | ) | (57,586 | ) | ||||||
|
Other
assets
|
324,981 | (320,593 | ) | (34,789 | ) | |||||||
|
Accounts
payable trade
|
(106,634 | ) | (48,727 | ) | 23,772 | |||||||
|
Accounts
payable to related parties
|
(187,915 | ) | 215,563 | 20,966 | ||||||||
|
Other
liabilities
|
(146,995 | ) | 215,189 | (14,751 | ) | |||||||
|
Total
adjustments
|
72,544 | 2,074,348 | 462,451 | |||||||||
|
Net
cash provided by operating activities
|
487,854 | 87,724 | 653,067 | |||||||||
|
Cash
flows from investing activities:
|
||||||||||||
|
Purchases
of short and long-term investments
|
(1,668,978 | ) | (1,986,338 | ) | (3,717,897 | ) | ||||||
|
Proceeds
from sales of short and long-term investments
|
1,137,734 | 1,697,052 | 2,033,871 | |||||||||
|
Proceeds
from maturities of short and long-term investments
|
205,874 | 744,322 | 1,365,712 | |||||||||
|
Proceeds
from sales of property and equipment
|
— | 39,680 | — | |||||||||
|
Acquisition
of property and equipment
|
(59,733 | ) | (184,033 | ) | (258,954 | ) | ||||||
|
Investment
in Flash Partners Ltd. and Flash Alliance Ltd.
|
— | (96,705 | ) | (125,547 | ) | |||||||
|
Distribution
from FlashVision Ltd.
|
12,713 | 102,530 | — | |||||||||
|
Notes
receivable proceeds, FlashVision Ltd.
|
— | — | 37,512 | |||||||||
|
Notes
receivable proceeds, Flash Partners Ltd. and Flash Alliance
Ltd.
|
387,278 | — | — | |||||||||
|
Notes
receivable proceeds, Tower Semiconductor Ltd.
|
— | 3,125 | 1,125 | |||||||||
|
Notes
receivable issuance, Flash Partners Ltd. and Flash Alliance
Ltd.
|
(377,923 | ) | (287,488 | ) | (525,252 | ) | ||||||
|
Purchased
technology and other assets
|
(11,790 | ) | 1,786 | (28,928 | ) | |||||||
|
Acquisition
of MusicGremlin, Inc.
|
— | (4,604 | ) | — | ||||||||
|
Net
cash provided by (used in) investing activities
|
(374,825 | ) | 29,327 | (1,218,358 | ) | |||||||
|
Cash
flows from financing activities:
|
||||||||||||
|
Proceeds
from employee stock programs
|
20,878 | 19,701 | 100,311 | |||||||||
|
Proceeds
from (repayment of) debt financing
|
— | (9,785 | ) | 9,803 | ||||||||
|
Distribution
to non-controlling interests, net
|
— | (916 | ) | (10,020 | ) | |||||||
|
Excess
tax benefit from share-based compensation
|
— | 1,938 | 18,375 | |||||||||
|
Share
repurchase programs
|
— | — | (299,607 | ) | ||||||||
|
Net
cash provided by (used in) financing activities
|
20,878 | 10,938 | (181,138 | ) | ||||||||
|
Effect
of changes in foreign currency exchange rates on cash
|
4,396 | 323 | (522 | ) | ||||||||
|
Net
increase (decrease) in cash and cash equivalents
|
138,303 | 128,312 | (746,951 | ) | ||||||||
|
Cash
and cash equivalents at beginning of the year
|
962,061 | 833,749 | 1,580,700 | |||||||||
|
Cash
and cash equivalents at end of the year
|
$ | 1,100,364 | $ | 962,061 | $ | 833,749 | ||||||
|
Supplemental
disclosure of cash flow information:
|
||||||||||||
|
Cash
refunded (paid) for income taxes
|
$ | 123,977 | $ | (129,141 | ) | $ | (193,300 | ) | ||||
|
Cash
paid for interest expense
|
$ | (13,001 | ) | $ | (12,386 | ) | $ | (15,168 | ) | |||
The
accompanying notes are an integral part of these consolidated financial
statements.
Notes
to Consolidated Financial Statements
Organization and
Nature of Operations. SanDisk Corporation (together with its
subsidiaries, the “Company”) was incorporated in Delaware on June 1,
1988. The Company designs, develops, markets and manufactures flash
storage card products used in a wide variety of consumer electronics
products. The Company operates in one segment, flash memory storage
products.
Basis of
Presentation. The Company’s fiscal year ends on the Sunday
closest to December 31. Fiscal year 2009 consisted of 53 weeks,
with the additional week included in the fourth quarter. Fiscal years
2008 and 2007 each consisted of 52 weeks. Certain prior period
amounts in the footnotes have been reclassified to conform to the current period
presentation. The Company has evaluated, recorded and disclosed
material subsequent events in the Notes to the Consolidated Financial
Statements, if any, that have occurred up to the date of the filing of this
annual report on Form 10-K on February 25, 2010. For accounting and
disclosure purposes, the exchange rate at January 3, 2010 of 92.46 was used to
convert Japanese yen to U.S. dollar. Throughout the Notes to
Consolidated Financial Statements, unless otherwise indicated, the reference to
Net Income (Loss) refers to Net Income (Loss) Attributable to Common
Stockholders.
Principles of
Consolidation. The Consolidated Financial Statements include
the accounts of the Company and its majority-owned subsidiaries. All
intercompany balances and transactions have been
eliminated. Non-controlling interest represents the minority
shareholders’ proportionate share of the net assets and results of operations of
the Company’s majority-owned subsidiaries. The Consolidated Financial
Statements also include the results of companies acquired by the Company from
the date of each acquisition.
Use of
Estimates. The preparation
of financial statements in conformity with generally accepted accounting
principles in the United States (“U.S. GAAP”) requires management to make
estimates and assumptions that affect the amounts reported in the financial
statements and accompanying notes. The estimates and judgments affect
the reported amounts of assets, liabilities, revenues and expenses, and related
disclosure of contingent liabilities. On an ongoing basis, the
Company evaluates its estimates, including those related to customer programs
and incentives, product returns, bad debts, inventories, investments, long-lived
assets, income taxes, warranty obligations, restructuring, contingencies,
share-based compensation and litigation. The Company bases its
estimates on historical experience and on other assumptions that its management
believes are reasonable under the circumstances. These estimates form
the basis for making judgments about the carrying values of assets and
liabilities when those values are not readily apparent from other
sources. Actual results could differ materially from these
estimates.
Revenue
Recognition, Sales Returns and Allowances and Sales Incentive
Programs. The Company recognizes revenues when the earnings
process is complete, as evidenced by an agreement with the customer, transfer of
title and acceptance, if applicable, fixed or determinable pricing and
reasonable assurance of realization. Revenue is generally recognized
at the time of shipment for customers not eligible for price protection and/or a
right of return. Sales made to distributors and retailers are
generally under agreements allowing price protection and/or a right of return
and, therefore, the revenues and related costs of these transactions are
deferred until the retailers or distributors sell-through the merchandise to
their end customer, or the rights of return expire. Estimated sales
returns are provided for as a reduction to product revenue and were not material
for any period presented in the accompanying Consolidated Financial
Statements. The cost of shipping products to customers is included in
cost of product revenues. The Company recognizes expenses related to
sales commissions in the period in which they are earned.
Revenue
from patent licensing arrangements is recognized when earned, estimable and
realizable. The timing of revenue recognition is dependent on the
terms of each license agreement and on the timing of sales of licensed
products. The Company generally recognizes royalty revenue when it is
reported to the Company by its licensees, which is generally one quarter in
arrears from the licensees’ sales. For licensing fees that are not
determined by the number of licensed units sold, the Company recognizes license
fee revenue on a straight-line basis over the life of the license.
The
Company records estimated reductions of revenue for customer and distributor
incentive programs and offerings, including price protection, promotions, co-op
advertising and other volume-based incentives and expected
returns. Additionally, the Company has incentive programs that
require it to estimate, the number of customers who will actually redeem the
incentive. All sales incentive programs are recorded as an offset to
product revenues or deferred revenues. Marketing development programs
are recorded as a reduction to revenue.
Accounts
Receivable and Allowance for Doubtful Accounts. Accounts
receivable include amounts owed by geographically dispersed distributors,
retailers and original equipment manufacturer (“OEM”) customers. No
collateral is required. Provisions are provided for sales returns and
credit losses.
The
Company estimates the collectibility of its accounts receivable based on a
combination of factors. In circumstances where the Company is aware
of a specific customer’s inability to meet its financial obligations to the
Company (e.g.,
bankruptcy filings or substantial downgrading of credit ratings), the Company
provides allowance for bad debts against amounts due to reduce the net
recognized receivable to the amount it reasonably believes will be
collected.
Income
Taxes. The Company accounts for income taxes using an asset
and liability approach, which requires recognition of deferred tax assets and
liabilities for the expected future tax consequences of events that have been
recognized in the Company’s Consolidated Financial Statements, but have not been
reflected in the Company's taxable income. A valuation allowance has
been established to reduce deferred tax assets to their estimated realizable
value. Therefore, the Company provides a valuation allowance to the
extent that the Company does not believe it is more likely than not that it will
generate sufficient taxable income in future periods to realize the benefit of
its deferred tax assets. The Company recognizes interest and
penalties related to unrecognized tax benefits in income tax
expense.
Foreign
Currency. The Company determines the functional currency for
its parent company and each of its subsidiaries by reviewing the currencies in
which their respective operating activities occur. Transaction gains
and losses arising from activities in other than the applicable functional
currency are calculated using average exchange rates for the applicable period
and reported in net income (loss) as a non-operating item in each
period. Non-monetary balance sheet items denominated in a currency
other than the applicable functional currency are translated using the exchange
rate in effect on the balance sheet date and any gains and losses are included
in cumulative translation adjustment. The Company continuously
evaluates its foreign currency exposures and may continue to enter into hedges
or other risk mitigating arrangements in the future. Aggregate gross
foreign currency transaction gain (loss) prior to consideration of the
offsetting hedges recorded to net income (loss) was ($90.0) million,
$181.3 million and $15.6 million in fiscal years 2009, 2008 and 2007,
respectively.
Cash Equivalents,
Short and Long-Term Marketable Securities. Cash equivalents
consist of short-term, highly liquid financial instruments with insignificant
interest rate risk that are readily convertible to cash and have maturities of
three months or less from the date of purchase. Marketable securities
with original maturities greater than three months and remaining maturities less
than one year are classified as short-term marketable
securities. Marketable securities with remaining maturities greater
than one year as of the balance sheet date are classified as long-term
marketable securities. Short and long-term fixed income investments
consist of commercial paper, United States (“U.S.”) treasuries, government
agency and government-sponsored agency obligations, corporate/municipal notes
and bonds, and variable rate demand notes. Both short and long-term
marketable securities also include investments in certain equity
securities. The fair market value, based on quoted market prices, of
cash equivalents, and short and long-term marketable securities at
January 3, 2010 approximated their carrying value. Cost of
securities sold is based on specific identification.
In
determining if and when a decline in market value below cost of these
investments is other-than-temporary, the Company evaluates both quantitative and
qualitative information including the market conditions, offering prices, trends
of earnings, price multiples and other key measures. For equity
securities, when such a decline in value is deemed to be other-than-temporary,
the Company recognizes an impairment loss in the current period operating
results to the extent of the decline. For debt securities, only the
decline in the credit rating element of an other-than-temporary impairment is
taken to the Consolidated Statement of Operations, unless the Company intends,
or more likely than not will be forced, to sell the security.
Property and
Equipment. Property and equipment are carried at cost less
accumulated depreciation and amortization. Depreciation and
amortization are computed using the straight-line method over the estimated
useful lives of the assets, ranging from two to twenty-five years, or the
remaining lease term, whichever is shorter.
Variable Interest
Entities. The Company evaluates its equity method investments
to determine whether any investee is a variable interest entity
(“VIE”). If the Company concludes that an investee is a variable
interest entity, the Company evaluates its expected gains and losses from such
investee to determine whether the Company is the primary beneficiary of the
investee. If the Company is the primary beneficiary of a variable
interest entity, the Company consolidates such entity and reflects the minority
interest of other beneficiaries of that entity. If the Company
concludes that an investee is not a variable interest entity, the Company does
not consolidate the investee.
Equity
Investments. The Company accounts for investments in equity
securities of other entities, including variable interest entities that are not
consolidated, under the cost method of accounting if investments in voting
equity interests of the investee are less than 20%. The equity method
of accounting is used if the Company’s investment in voting stock is greater
than or equal to 20% but less than a majority. In considering the
accounting method for investments less than 20%, the Company also considers
other factors such as its ability to exercise significant influence over
operating and financial policies of the investee. If certain factors
are present, the Company could account for investments for which it has less
than a 20% ownership under the equity method of accounting.
Investments
in public companies with restrictions of less than one year are classified as
available-for-sale and are adjusted to their fair market value with unrealized
gains and losses recorded as a component of accumulated other comprehensive
income. Investments in public companies with restrictions greater
than one year are carried at cost. Investments in public and
non-public companies are reviewed on a quarterly basis to determine if their
value has been impaired and adjustments are recorded as
necessary. Upon disposition of these investments, the specific
identification method is used to determine the cost basis in computing realized
gains or losses. Declines in value that are judged to be
other-than-temporary are reported in Other income (expense) or Cost of product
revenues in the accompanying Consolidated Statements of
Operations. See Note 5, “Balance Sheet Information - Notes Receivable
and Investments in Flash Ventures with Toshiba,” regarding impairment of equity
method investments in fiscal year 2008.
Inventories and
Inventory Valuation. Inventories are stated at the lower of
cost (first-in, first-out) or market. Market value is based upon an
estimated average selling price reduced by estimated costs of
disposal. Should actual market conditions differ from the Company’s
estimates, the Company’s future results of operations could be materially
affected. Reductions in inventory valuation are included in Cost of
product revenues in the accompanying Consolidated Statements of
Operations. Inventory impairment charges, when taken, permanently
establish a new cost basis and are not subsequently reversed to income even if
circumstances later suggest that increased carrying amounts are
recoverable. Rather these amounts are recognized in income only if,
as and when the inventory is sold.
The
Company reduces the carrying value of its inventory to a new basis for estimated
obsolescence or unmarketable inventory by an amount equal to the difference
between the cost of the inventory and the estimated market value based upon
assumptions about future demand and market conditions, including assumptions
about changes in average selling prices. If actual market conditions
are less favorable than those projected by management, additional reductions in
inventory valuation may be required.
The
Company’s finished goods inventory includes consigned inventory held at customer
locations as well as at third-party fulfillment centers and
subcontractors.
Other Long-Lived
Assets. Intangible
assets with definite useful lives and other long-lived assets are tested for
impairment if certain impairment indicators are identified. The Company
assesses the carrying value of long-lived assets, whenever events or changes in
circumstances indicate that the carrying value of these long-lived assets may
not be recoverable. Factors the Company considers important which
could result in an impairment review include: (1) significant under-performance
relative to the historical or projected future operating results; (2)
significant changes in the manner of use of assets; (3) significant negative
industry or economic trends; and (4) significant changes in the Company’s market
capitalization relative to net book value. Any changes in key
assumptions used by the Company including those set forth above, could result in
an impairment charge and such a charge could have a material adverse effect on
the Company’s consolidated results of operations. See Note 6,
“Intangible Assets and Goodwill,” regarding impairment of long-lived assets in
fiscal year 2008.
Fair Value of
Financial Instruments. For certain of the Company’s financial
instruments, including accounts receivable, short-term marketable securities and
accounts payable, the carrying amounts approximate fair value due to their short
maturities. See Note 3, “Investments and Fair Value Measurements,”
for financial assets and liabilities measured at fair value.
Advertising
Expenses. Marketing co-op development programs, where the
Company receives, or will receive, an identifiable benefit (e.g., goods or services) in
exchange for the amount paid to its customer and the Company can reasonably
estimate the fair value of the benefit it receives for the customer incentive
payment, are classified, when granted, as a marketing
expense. Advertising expenses not meeting this criteria are
classified as a reduction to product revenue. Any other advertising
expenses not meeting these conditions are expensed as
incurred. Advertising expenses were $7.0 million,
$39.9 million and $35.5 million in fiscal years 2009, 2008 and 2007,
respectively.
Research and
Development Expenses. Research and development expenditures
are expensed as incurred.
Note
2: Recent Accounting
Pronouncements
In June
2009, the Financial Accounting Standards Board (“FASB”) amended the existing
guidance on consolidation of variable interest entities to require an enterprise
to qualitatively assess the determination of the primary beneficiary of a
variable interest entity based on whether the entity has the power to direct
matters that most significantly impacts the VIE, and the obligation to absorb
losses or the right to receive benefits of the VIE that could be potentially
significant to the VIE. This amendment also requires the Company to
perform ongoing periodic reassessments of whether an enterprise is the primary
interest beneficiary of a VIE, rather than only when specific events have
occurred. This amendment is effective for the Company’s reporting
period that begins on January 4, 2010, and for interim periods within the
first annual reporting period. As a result of this new guidance,
management believes that Flash Partners Ltd. and Flash Alliance Ltd.
(hereinafter collectively referred to as “Flash Ventures”), will continue to be
accounted for as equity investments as the Company is not the primary
beneficiary. However, Solid State Storage Solutions LLC (“S4”) (see
Note 14, “Related Parties”), which is currently consolidated, is being evaluated
as to whether consolidation or equity method accounting is
appropriate.
In
October 2009, the FASB issued authoritative guidance to update the accounting
and reporting requirements for revenue arrangements with multiple
deliverables. This guidance established a selling price hierarchy,
which allows the use of an estimated selling price to determine the selling
price of a deliverable in cases where neither vendor-specific objective evidence
nor third-party evidence is available. The Company will early adopt
this standard beginning on January 4, 2010 and believes the impact of the
adoption on its financial condition and results of operations is
immaterial.
In
October 2009, the FASB issued authoritative guidance that clarifies which
revenue allocation and measurement guidance should be used for arrangements that
contain both tangible products and software, in cases where the software is more
than incidental to the tangible product as a whole. More
specifically, if the software sold with or embedded within the tangible product
is essential to the functionality of the tangible product, then this software as
well as undelivered software elements that relate to this software is excluded
from the scope of existing software revenue guidance. The Company
will early adopt this standard beginning on January 4, 2010 and believes
the impact of the adoption on its financial condition and results of operations
is immaterial.
Fair Value
Hierarchy. The Company categorizes the fair value of its
financial assets and liabilities according to the hierarchy established by the
FASB, which prioritizes the inputs to valuation techniques used to measure fair
value. The hierarchy gives the highest priority to unadjusted quoted
prices in active markets for identical assets or liabilities (Level 1
measurements) and the lowest priority to unobservable inputs (Level 3
measurements). The three levels of the fair value hierarchy are
described as follows:
|
Level
1
|
Valuations
based on quoted prices in active markets for identical assets or
liabilities that the Company has the ability to directly
access.
|
|
Level
2
|
Valuations
based on quoted prices for similar assets or liabilities; valuations for
interest-bearing securities based on non-daily quoted prices in active
markets; quoted prices in markets that are not active; or other inputs
that are observable or can be corroborated by observable data for
substantially the full term of the assets or
liabilities.
|
|
Level
3
|
Valuations
based on inputs that are supported by little or no market activity and
that are significant to the fair value of the assets or
liabilities.
|
A
financial instrument’s level within the fair value hierarchy is based on the
lowest level of any input that is significant to the fair value
measurement.
In
circumstances in which a quoted price in an active market for the identical
liability is not available, the Company is required to use the quoted price of
the identical liability when traded as an asset, quoted prices for similar
liabilities, or quoted prices for similar liabilities when traded as
assets. If these quoted prices are not available, the Company is
required to use another valuation technique, such as an income approach or a
market approach.
The
Company’s financial assets are measured at fair value on a recurring
basis. Instruments that are classified within Level 1 of the fair
value hierarchy generally include money market funds, U.S. Treasury securities
and equity securities. Instruments that are classified within Level 2
of the fair value hierarchy generally include government agency securities,
asset-backed securities, mortgage-backed securities, commercial paper, U.S.
corporate notes and bonds, and municipal obligations.
Financial
assets and liabilities measured at fair value on a recurring basis as of
January 3, 2010 were as follows (in thousands):
|
Total
|
Quoted
Prices in Active Markets for Identical Assets
(Level
1)
|
Significant
Other Observable Inputs
(Level
2)
|
Significant
Unobservable Inputs
(Level
3)
|
|||||||||||||
|
Money
market funds
|
$ | 869,643 | $ | 869,643 | $ | — | $ | — | ||||||||
|
Fixed
income securities
|
1,831,360 | 61,129 | 1,770,231 | — | ||||||||||||
|
Equity
securities
|
85,542 | 85,542 | — | — | ||||||||||||
|
Derivative
assets
|
4,433 | — | 4,433 | — | ||||||||||||
|
Other
|
3,395 | — | 3,395 | — | ||||||||||||
|
Total
financial assets
|
$ | 2,794,373 | $ | 1,016,314 | $ | 1,778,059 | $ | — | ||||||||
|
Derivative
liabilities
|
$ | 23,247 | $ | — | $ | 23,247 | $ | — | ||||||||
|
Total
financial liabilities
|
$ | 23,247 | $ | — | $ | 23,247 | $ | — | ||||||||
Financial
assets and liabilities measured at fair value on a recurring basis as of
December 28, 2008 were as follows (in thousands):
|
Total
|
Quoted
Prices in Active Markets for Identical Assets
(Level
1)
|
Significant
Other Observable Inputs
(Level
2)
|
Significant
Unobservable Inputs
(Level
3)
|
|||||||||||||
|
Money
market funds
|
$ | 317,081 | $ | 317,081 | $ | — | $ | — | ||||||||
|
Fixed
income securities
|
1,505,385 | — | 1,505,385 | — | ||||||||||||
|
Equity
securities
|
37,227 | 37,227 | — | — | ||||||||||||
|
Derivative
assets
|
105,133 | — | 105,133 | — | ||||||||||||
|
Other
|
2,889 | — | 2,889 | — | ||||||||||||
|
Total
financial assets
|
$ | 1,967,715 | $ | 354,308 | $ | 1,613,407 | $ | — | ||||||||
|
Derivative
liabilities
|
$ | 153,523 | $ | — | $ | 153,523 | $ | — | ||||||||
|
Total
financial liabilities
|
$ | 153,523 | $ | — | $ | 153,523 | $ | — | ||||||||
Assets
and liabilities measured at fair value on a recurring basis as of
January 3, 2010, were presented on the Company’s Consolidated Balance
Sheets as follows (in thousands):
|
Total
|
Quoted
Prices in Active Markets for Identical Assets
(Level
1)
|
Significant
Other Observable Inputs
(Level
2)
|
Significant
Unobservable Inputs
(Level
3)
|
|||||||||||||
|
Cash
equivalents(1)
|
$ | 871,173 | $ | 869,643 | $ | 1,530 | $ | — | ||||||||
|
Short-term
marketable securities
|
819,002 | 74,906 | 744,096 | — | ||||||||||||
|
Long-term
marketable securities
|
1,097,095 | 71,765 | 1,025,330 | — | ||||||||||||
|
Other
current assets and other non-current assets
|
7,103 | — | 7,103 | — | ||||||||||||
|
Total
assets
|
$ | 2,794,373 | $ | 1,016,314 | $ | 1,778,059 | $ | — | ||||||||
|
Other
current accrued liabilities
|
$ | 15,453 | $ | — | $ | 15,453 | $ | — | ||||||||
|
Non-current
liabilities
|
7,794 | — | 7,794 | — | ||||||||||||
|
Total
liabilities
|
$ | 23,247 | $ | — | $ | 23,247 | $ | — | ||||||||
|
|
(1)
|
Cash
equivalents exclude cash of $229.2 million included in Cash and cash
equivalents on the Consolidated Balance Sheets as of January 3,
2010.
|
Assets
and liabilities measured at fair value on a recurring basis as of
December 28, 2008 were presented on the Company’s Consolidated Balance
Sheets as follows (in thousands):
|
Total
|
Quoted
Prices in Active Markets for Identical Assets
(Level
1)
|
Significant
Other Observable Inputs
(Level
2)
|
Significant
Unobservable Inputs
(Level
3)
|
|||||||||||||
|
Cash
equivalents(1)
|
$ | 317,081 | $ | 317,081 | $ | — | $ | — | ||||||||
|
Short-term
marketable securities
|
477,296 | 2,062 | 475,234 | — | ||||||||||||
|
Long-term
marketable securities
|
1,097,302 | 35,165 | 1,062,137 | — | ||||||||||||
|
Other
current assets and other non-current assets
|
76,036 | — | 76,036 | — | ||||||||||||
|
Total
financial assets
|
$ | 1,967,715 | $ | 354,308 | $ | 1,613,407 | $ | — | ||||||||
|
Other
current accrued liabilities
|
$ | 153,523 | $ | — | $ | 153,523 | $ | — | ||||||||
|
Total
financial liabilities
|
$ | 153,523 | $ | — | $ | 153,523 | $ | — | ||||||||
|
|
(1)
|
Cash
equivalents exclude cash of $645.0 million included in Cash and cash
equivalents on the Consolidated Balance Sheets as of December 28,
2008.
|
As of
January 3, 2010, the Company did not elect the fair value option for any
financial assets and liabilities that were not required to be measured at fair
value.
Available-for-Sale
Investments. Available-for-sale investments as of
January 3, 2010 were as follows (in thousands):
|
Amortized
Cost
|
Gross
Unrealized
Gain
|
Gross
Unrealized
Loss
|
Fair
Value
|
|||||||||||||
|
Fixed
income securities:
|
||||||||||||||||
|
U.S.
Treasury and government agency securities
|
$ | 66,984 | $ | 90 | $ | (6 | ) | $ | 67,068 | |||||||
|
U.S.
government-sponsored agency securities
|
37,211 | 20 | (298 | ) | 36,933 | |||||||||||
|
Corporate
notes and bonds
|
251,510 | 1,103 | (664 | ) | 251,949 | |||||||||||
|
Asset-backed
securities
|
27,719 | 175 | — | 27,894 | ||||||||||||
|
Mortgage-backed
securities
|
4,986 | 20 | — | 5,006 | ||||||||||||
|
Municipal
notes and bonds
|
1,422,126 | 20,581 | (197 | ) | 1,442,510 | |||||||||||
| 1,810,536 | 21,989 | (1,165 | ) | 1,831,360 | ||||||||||||
|
Equity
investments
|
70,011 | 15,531 | — | 85,542 | ||||||||||||
|
Total
available-for-sale investments
|
$ | 1,880,547 | $ | 37,520 | $ | (1,165 | ) | $ | 1,916,902 | |||||||
Available-for-sale
investments as of December 28, 2008 were as follows
(in thousands):
|
Amortized
Cost
|
Gross
Unrealized
Gain
|
Gross
Unrealized
Loss
|
Fair
Value
|
|||||||||||||
|
Fixed
income securities:
|
||||||||||||||||
|
U.S.
government-sponsored agency securities
|
$ | 40,110 | $ | 476 | $ | — | $ | 40,586 | ||||||||
|
Corporate
notes and bonds
|
56,916 | 267 | (360 | ) | 56,823 | |||||||||||
|
Municipal
notes and bonds
|
1,387,592 | 21,714 | (1,330 | ) | 1,407,976 | |||||||||||
| 1,484,618 | 22,457 | (1,690 | ) | 1,505,385 | ||||||||||||
|
Equity
investments
|
70,226 | — | (32,999 | ) | 37,227 | |||||||||||
|
Total
available-for-sale investments
|
$ | 1,554,844 | $ | 22,457 | $ | (34,689 | ) | $ | 1,542,612 | |||||||
The fair
value and gross unrealized losses on the available-for-sale securities that have
been in an unrealized loss position, aggregated by type of investment
instrument, and the length of time that individual securities have been in a
continuous unrealized loss position as of January 3, 2010, are summarized
in the following table (in thousands). Available-for-sale
securities that were in an unrealized gain position have been excluded from the
table.
|
Less
than 12 months
|
Greater
than 12 months
|
|||||||||||||||
|
Fair
Value
|
Gross
Unrealized
Loss
|
Fair
Value
|
Gross
Unrealized
Loss
|
|||||||||||||
|
U.S.
Treasury and government agency securities
|
$ | 27,357 | $ | (6 | ) | $ | — | $ | — | |||||||
|
U.S.
government-sponsored agency securities
|
27,724 | (298 | ) | — | — | |||||||||||
|
Corporate
notes and bonds
|
115,696 | (664 | ) | — | — | |||||||||||
|
Municipal
notes and bonds
|
76,031 | (197 | ) | — | — | |||||||||||
|
Equity
investments
|
— | — | — | — | ||||||||||||
|
Total
|
$ | 246,808 | $ | (1,165 | ) | $ | — | $ | — | |||||||
The gross
unrealized loss related to U.S. Treasury and government agency securities, U.S.
government-sponsored agency securities, and U.S. corporate and municipal notes
and bonds was primarily due to changes in interest rates. Gross
unrealized loss on all available-for-sale fixed income securities at
January 3, 2010 was considered temporary in nature. Factors
considered in determining whether a loss is temporary include the length of time
and extent to which fair value has been less than the cost basis, the financial
condition and near-term prospects of the investee, and the Company’s intent and
ability to hold an investment for a period of time sufficient to allow for any
anticipated recovery in market value. For debt security investments,
the Company considered additional factors including the Company’s intent to sell
the investments or whether it is more likely than not the Company will be
required to sell the investments before the recovery of its amortized
cost.
The
following table shows the gross realized gains and (losses) on sales of
available-for-sale securities (in thousands).
|
Year
ended
|
||||||||||||
|
January 3,
2010
|
December 28,
2008
|
December 30,
2007
|
||||||||||
|
Gross
realized gains
|
$ | 13,997 | $ | 8,870 | $ | 336 | ||||||
|
Gross
realized (losses)
|
(576 | ) | (640 | ) | (237 | ) | ||||||
Fixed
income securities by contractual maturity as of January 3, 2010 are shown
below (in thousands). Actual maturities may differ from
contractual maturities because issuers of the securities may have the right to
prepay obligations.
|
Amortized
Cost
|
Fair
Value
|
|||||||
|
Due
in one year or less
|
$ | 801,569 | $ | 806,755 | ||||
|
Due
after one year through five years
|
1,008,967 | 1,024,605 | ||||||
|
Total
|
$ | 1,810,536 | $ | 1,831,360 | ||||
For
certain of the Company’s financial instruments, including accounts receivable,
short-term marketable securities and accounts payable, the carrying amounts
approximate fair value due to their short maturities. For those
financial instruments where the carrying amounts differ from fair value, the
following table represents the related costs and the fair values, which are
based on quoted market prices (in thousands).
|
As
of January 3, 2010
|
As
of December 28, 2008
|
|||||||||||||||
|
Carrying
Value
|
Fair
Value
|
Carrying
Value
|
Fair
Value
|
|||||||||||||
|
1%
Notes due 2013
|
$ | 934,722 | $ | 958,813 | $ | 879,094 | $ | 477,250 | ||||||||
|
1%
Notes due 2035
|
75,000 | 74,700 | 75,000 | 64,038 | ||||||||||||
The
Company uses derivative instruments primarily to manage exposures to foreign
currency and equity security price risks. The Company’s primary
objective in holding derivatives is to reduce the volatility of earnings and
cash flows associated with changes in foreign currency and equity security
prices. The program is not designated for trading or speculative
purposes. The Company’s derivatives expose the Company to credit risk
to the extent that the counterparties may be unable to meet the terms of the
agreement. The Company seeks to mitigate such risk by limiting its
counterparties to major financial institutions and by spreading the risk across
several major financial institutions. In addition, the potential risk
of loss with any one counterparty resulting from this type of credit risk is
monitored on an ongoing basis.
The
Company recognizes derivative instruments as either assets or liabilities on the
balance sheet at fair value and provides qualitative disclosures about
objectives and strategies for using derivatives, quantitative disclosures about
fair value amounts of and gains and losses on derivative instruments, and
disclosures about credit-risk-related contingent features in derivative
agreements. Changes in fair value (i.e., gains or losses) of the
derivatives are recorded as cost of product revenues or other income (expense),
or as accumulated other comprehensive income (“OCI”). The Company
does not offset or net the fair value amounts of derivative instruments and
separately discloses the fair value amounts of the derivative instruments as
either assets or liabilities.
Cash Flow
Hedges. The Company uses a combination of forward contracts
and options designated as cash flow hedges to hedge a portion of future
forecasted purchases in Japanese yen. The gain or loss on the
effective portion of a cash flow hedge is initially reported as a component of
accumulated OCI and subsequently reclassified into cost of product revenues in
the same period or periods in which the cost of product revenues is recognized,
or reclassified into other income (expense) if the hedged transaction becomes
probable of not occurring. Any gain or loss after a hedge is no
longer designated because it is no longer probable of occurring or it is related
to an ineffective portion of a hedge, as well as any amount excluded from the
Company’s hedge effectiveness, is recognized as other income or expense
immediately, and was a net loss of ($1.0) million, ($9.7) million and
zero for the fiscal years ended January 3, 2010, December 28, 2008 and
December 30, 2007, respectively. As of January 3,
2010, the Company had no forward contracts in place that hedged future
purchases.
The
Company has an outstanding cash flow hedge designated to mitigate equity risk
associated with certain available-for-sale investments in equity
securities. The gain or loss on the cash flow hedge is reported as a
component of accumulated OCI and will be reclassified into other income
(expense) in the same period that the equity securities are sold. The
securities had a fair value of $71.8 million and $35.2 million as of
January 3, 2010 and December 28, 2008, respectively. The
cash flow hedge designated to mitigate equity risk of these securities had a
fair value of $0.7 million and $32.0 million as of January 3,
2010 and December 28, 2008, respectively.
Other
Derivatives. Other derivatives that are non-designated consist
primarily of forward and cross currency swap contracts to minimize the risk
associated with the foreign exchange effects of revaluing monetary assets and
liabilities. Monetary assets and liabilities denominated in foreign
currencies and the associated outstanding forward and cross currency swap
contracts were marked-to-market at January 3, 2010 with realized and
unrealized gains and losses included in other income (expense). As of
January 3, 2010, the Company had foreign currency forward contracts hedging
exposures in European euros, Israeli new shekels, Japanese yen and Taiwanese
dollars. Foreign currency forward contracts were outstanding to buy
and (sell) U.S. dollar equivalent of approximately $260.2 million and
($97.6) million in foreign currencies, respectively, based upon the
exchange rates at January 3, 2010.
The Company has currency swap transactions with one counterparty
to exchange Japanese yen for U.S. dollars for a combined notional amount of
($412.6) million which require the Company to maintain a minimum liquidity
of $1.5 billion on, or prior to, June 30, 2010 and $1.0 billion after
June 30, 2010. Liquidity is defined as the sum of the Company’s cash
and cash equivalents, and short and long-term marketable
securities. The Company is in compliance with the covenant as
of January 3, 2010. Should the
Company fail to comply with this covenant, the Company may be required to settle
the unrealized gain or loss on the foreign exchange contracts prior to the
original maturity.
The
amounts in the tables below include fair value adjustments related to the
Company’s own credit risk and counterparty credit risk.
Fair Value of
Derivative Contracts. Fair value of derivative contracts were
as follows (in thousands):
|
Derivative
assets reported in
|
||||||||||||||||
|
Other
Current Assets
|
Long-term
Marketable Securities
|
|||||||||||||||
|
January 3,
2010
|
December 28,
2008
|
January 3,
2010
|
December 28,
2008
|
|||||||||||||
|
Designated
cash flow hedges
|
||||||||||||||||
|
Foreign
exchange contracts
|
$ | — | $ | 51,576 | $ | — | $ | — | ||||||||
|
Equity
market risk contract
|
— | — | 725 | 31,987 | ||||||||||||
| — | 51,576 | 725 | 31,987 | |||||||||||||
|
Foreign
exchange contracts not designated
|
3,708 | 21,570 | — | — | ||||||||||||
|
Total
derivatives
|
$ | 3,708 | $ | 73,146 | $ | 725 | $ | 31,987 | ||||||||
|
Derivative
liabilities reported in
|
||||||||||||||||
|
Other
Current Accrued Liabilities
|
Non-current
Liabilities
|
|||||||||||||||
|
January 3,
2010
|
December 28,
2008
|
January 3,
2010
|
December 28,
2008
|
|||||||||||||
|
Foreign
exchange contracts not designated
|
$ | 7,794 | $ | 153,523 | $ | 15,453 | $ | — | ||||||||
Foreign Exchange
and Equity Market Risk Contracts Designated as Cash Flow
Hedges. The effective portion of designated cash flow
derivative contracts on the results of operations was as follows
(in thousands):
|
Accumulated
OCI Balance at
|
Amount
of gain (loss) reclassified from OCI
to the Statements of Operations during the year
ended
|
|||||||||||||||
|
January 3,
2010
|
December 28,
2008
|
January 3,
2010
|
December 28,
2008
|
|||||||||||||
|
Foreign
exchange contracts
|
$ | (10,837 | ) | $ | 60,511 | $ | 60,730 | $ | (13,701 | ) | ||||||
|
Equity
market risk contract
|
(31,262 | ) | 27,572 | — | — | |||||||||||
Foreign
exchange contracts designated as cash flow hedges relate primarily to wafer
purchases and the associated gains and losses are expected to be recorded in
cost of product revenues when reclassified out of accumulated
OCI. Gains and losses from the equity market risk contract are
expected to be recorded in other income (expense) when reclassified out of
accumulated OCI. The Company expects to realize the accumulated OCI
balance related to foreign exchange contracts within the next twelve months and
realize the accumulated OCI balance related to the equity market risk contract
in fiscal year 2011.
The
impact of the ineffective portion and amount excluded from effectiveness testing
on designated cash flow derivative contracts on the Company’s results of
operations recognized in other income (expense) were as follows
(in thousands):
|
January 3,
2010
|
December 28,
2008
|
December
30,
2007
|
||||||||||
|
Foreign
exchange contracts
|
$ | (1,047 | ) | $ | (9,696 | ) | $ | ─ | ||||
|
Equity
market risk contract
|
─ | ─ | ─ | |||||||||
Effect of
Non-Designated Derivative Contracts on the Consolidated Statements of
Operations. The effect of non-designated derivative contracts
on the Company’s results of operations recognized in other income (expense) were
as follows (in thousands):
|
January 3,
2010
|
December 28,
2008
|
December
30,
2007
|
||||||||||
|
Gain
(loss) on foreign exchange contracts including forward point
income
|
$ | 92,291 | $ | (137,927 | ) | $ | ─ | |||||
|
Gain
(loss) from revaluation of foreign currency exposures by foreign exchange
contracts
|
(88,342 | ) | 180,466 | ─ | ||||||||
Note
5: Balance
Sheet Information
Accounts
Receivable from Product Revenues, net. Accounts receivable
from product revenues, net, were as follows (in thousands):
|
January 3,
2010
|
December 28,
2008
|
|||||||
|
Trade
accounts receivable
|
$ | 534,549 | $ | 584,262 | ||||
|
Allowance
for doubtful accounts
|
(12,348 | ) | (13,881 | ) | ||||
|
Price
protection, promotions and other activities
|
(287,794 | ) | (448,289 | ) | ||||
|
Total
accounts receivable from product revenues, net
|
$ | 234,407 | $ | 122,092 | ||||
Allowance for
Doubtful Accounts. The activity in the allowance for doubtful
accounts was as follows (in thousands):
|
January 3,
2010
|
December 28,
2008
|
December 30,
2007
|
||||||||||
|
Balance,
beginning of period
|
$ | 13,881 | $ | 13,790 | $ | 11,452 | ||||||
|
Additions
(reductions) charged to costs and expenses
|
(719 | ) | 8,778 | 3,519 | ||||||||
|
Deductions
(write-offs)
|
(814 | ) | (8,687 | ) | (1,181 | ) | ||||||
|
Balance,
end of period
|
$ | 12,348 | $ | 13,881 | $ | 13,790 | ||||||
During
the first quarter of fiscal year 2008, the Company recorded an additional
provision for doubtful accounts as well as a reversal of $12.0 million of
product revenues associated with receivable balances related to a customer
having severe financial difficulties.
Inventory. Inventory
was as follows (in thousands):
|
January 3,
2010
|
December 28,
2008
|
|||||||
|
Raw
material
|
$ | 329,966 | $ | 309,436 | ||||
|
Work-in-process
|
63,767 | 90,544 | ||||||
|
Finished
goods
|
202,760 | 198,271 | ||||||
|
Total
inventory
|
$ | 596,493 | $ | 598,251 | ||||
Other Current
Assets. Other current assets were as follows (in
thousands):
|
January 3,
2010
|
December 28,
2008
|
|||||||
|
Royalty
and other receivables
|
$ | 53,864 | $ | 81,451 | ||||
|
Prepaid
expenses
|
14,309 | 20,321 | ||||||
|
Tax
related receivables
|
25,758 | 294,906 | ||||||
|
Other
current assets
|
3,708 | 73,283 | ||||||
|
Total
other current assets
|
$ | 97,639 | $ | 469,961 | ||||
Property and
Equipment. Property and equipment consisted of the following
(in thousands):
|
January 3,
2010
|
December 28,
2008
|
|||||||
|
Machinery
and equipment
|
$ | 656,046 | $ | 659,881 | ||||
|
Software
|
136,558 | 113,190 | ||||||
|
Buildings
and building improvements
|
57,327 | 52,939 | ||||||
|
Capital
land lease
|
6,593 | 7,885 | ||||||
|
Furniture
and fixtures
|
7,223 | 6,766 | ||||||
|
Leasehold
improvements
|
23,998 | 25,131 | ||||||
|
Property
and equipment, at cost
|
887,745 | 865,792 | ||||||
|
Accumulated
depreciation and amortization
|
(586,748 | ) | (468,805 | ) | ||||
|
Property
and equipment, net
|
$ | 300,997 | $ | 396,987 | ||||
Depreciation
and amortization expense of property and equipment totaled $152.6 million,
$175.2 million and $146.8 million in fiscal years 2009, 2008 and 2007,
respectively.
Notes Receivable
and Investments in the Flash Ventures with Toshiba. Notes
receivable and investments in the flash ventures with Toshiba Corporation
(“Toshiba”) were as follows (in thousands):
|
January 3,
2010
|
December 28,
2008
|
|||||||
|
Notes
receivable, Flash Partners Ltd.
|
$ | 562,946 | $ | 843,380 | ||||
|
Notes
receivable, Flash Alliance Ltd.
|
520,225 | 276,518 | ||||||
|
Investment
in FlashVision Ltd.
|
─
|
63,965 | ||||||
|
Investment
in Flash Partners Ltd.
|
199,106 | 202,530 | ||||||
|
Investment
in Flash Alliance Ltd.
|
225,273 | 215,898 | ||||||
|
Total
notes receivable and investments in the flash ventures with
Toshiba
|
$ | 1,507,550 | $ | 1,602,291 | ||||
In the
third quarter of fiscal year 2008, the Company recorded a $10.4 million
impairment charge related to its equity investment in FlashVision Ltd.
(“FlashVision”) due to FlashVision’s difficulty in selling the remaining excess
capital equipment due to limited demand for 200-millimeter production
equipment. The FlashVision impairment was recorded in Loss on Equity
Investments as the impairments relate to the wind-down of the
venture. In the first quarter of fiscal year 2009, the Company
completed the wind-down of FlashVision and received distributions of
$12.7 million in cash, released $43.3 million of cumulative
translation adjustments recorded in accumulated OCI and impaired the remaining
$7.9 million relating to the Company’s investment in
FlashVision. See Note 13, “Commitments, Contingencies and Guarantees
– FlashVision” regarding equity method investments in fiscal year
2008.
In the
fourth quarter of fiscal year 2008, the Company recorded an impairment to the
equity investments in Flash Partners Ltd. (“Flash Partners”) and Flash Alliance
Ltd. (“Flash Alliance”) of $20.0 million and $63.0 million,
respectively, as the fair value of these investments was determined to be less
than the carrying value. These impairments were based upon a
comparison of the forecasted discounted cash flows to the carrying value of each
venture. The analyses considered several factors including the
volatility in foreign currencies resulting in an appreciation in the carrying
value of these Japanese yen denominated assets and a reduced business outlook
primarily due to NAND-industry pricing conditions. The impairment
analyses and measurement is a process that requires significant judgment and the
use of significant estimates related to valuation such as discount rates,
long-term growth rates, foreign currency rates, and the level and timing of
future cash flows. The Flash Partners and Flash Alliance impairments
were recorded in cost of product revenues due to the operational nature of the
ventures. See Note 13, “Commitments, Contingencies and Guarantees –
Flash Partners and Flash Alliance,” regarding equity method investments in
fiscal year 2009.
Other Current
Accrued Liabilities. Other current
accrued liabilities were as follows (in thousands):
|
January 3,
2010
|
December 28,
2008
|
|||||||
|
Accrued
payroll and related expenses
|
$ | 118,648 | $ | 54,516 | ||||
|
Accrued
restructuring
|
2,622 | 22,545 | ||||||
|
Research
and development liability, related party
|
─
|
4,000 | ||||||
|
Foreign
currency forward contract payables
|
7,794 | 153,523 | ||||||
|
Flash
Ventures adverse purchase commitments for underutilized
capacity
|
─
|
121,486 | ||||||
|
Other
accrued liabilities
|
105,015 | 146,373 | ||||||
|
Total
other current accrued liabilities
|
$ | 234,079 | $ | 502,443 | ||||
Non-current
liabilities. Non-current liabilities were as follows (in
thousands):
|
January 3,
2010
|
December 28,
2008
|
||||||||
|
Deferred
tax liability
|
$ | 35,470 | $ | 87,688 | |||||
|
Income
taxes payable
|
206,464 | 145,432 | |||||||
|
Accrued
restructuring
|
9,228 | 11,070 | |||||||
|
Other
non-current liabilities
|
36,316 | 30,126 | |||||||
|
Total
non-current liabilities
|
$ | 287,478 | $ | 274,316 | |||||
Warranties. The
liability for warranty expense is included in Other current accrued liabilities
and Non-current liabilities in the accompanying Consolidated Balance Sheets and
the activity was as follows (in thousands):
|
January 3,
2010
|
December 28,
2008
|
December 30,
2007
|
||||||||||
|
Balance,
beginning of period
|
$ | 36,469 | $ | 18,662 | $ | 15,338 | ||||||
|
Additions
and adjustments to cost of product revenues
|
23,129 | 74,282 | 48,424 | |||||||||
|
Usage
|
(33,689 | ) | (56,475 | ) | (45,100 | ) | ||||||
|
Balance,
end of period
|
$ | 25,909 | $ | 36,469 | $ | 18,662 | ||||||
The
majority of the Company’s products have a warranty ranging up to ten
years. A provision for the estimated future cost related to warranty
expense is recorded at the time of customer invoice. The Company’s
warranty liability is affected by customer and consumer returns, product
failures, number of units sold, and repair or replacement costs
incurred. Should actual product failure rates, or repair or
replacement costs differ from the Company’s estimates, increases or decreases to
its warranty liability would be required. Warranty usage for fiscal years
2008 and 2007 has been reclassified to current year presentation to reflect
gross additions and usage for certain warranty activity.
Accumulated Other
Comprehensive Income. Accumulated other comprehensive income
presented in the accompanying Consolidated Balance Sheets consists of foreign
currency translation, hedging activities, and unrealized gains and losses on
available-for-sale investments, net of taxes, for all periods presented (in
thousands):
|
January 3,
2010
|
December 28,
2008
|
|||||||
|
Accumulated
net unrealized gain (loss) on:
|
||||||||
|
Available-for-sale
investments
|
$ | 26,920 | $ | (18,408 | ) | |||
|
Foreign
currency translation
|
98,424 | 101,186 | ||||||
|
Hedging
activities
|
3,369 | 106,199 | ||||||
|
Total
accumulated other comprehensive income
|
$ | 128,713 | $ | 188,977 | ||||
The
amount of income tax expense allocated to unrealized gain (loss) on
available-for-sale investments and hedging activities was $6.8 million and
$4.2 million at January 3, 2010 and December 28, 2008,
respectively.
Note
6: Intangible Assets and
Goodwill
Intangible
Assets. Intangible asset
balances are presented below (in thousands):
|
January
3, 2010
|
||||||||||||||||
|
Gross
Carrying Amount
|
Impairment
|
Accumulated
Amortization
|
Net
Carrying Amount
|
|||||||||||||
|
Core
technology
|
$ | 315,301 | $ | (136,001 | ) | $ | (144,474 | ) | $ | 34,826 | ||||||
|
Developed
product technology
|
12,900 | — | (7,946 | ) | 4,954 | |||||||||||
|
Customer
relationships
|
80,100 | (39,784 | ) | (40,316 | ) | — | ||||||||||
|
Acquisition-related
intangible assets
|
408,301 | (175,785 | ) | (192,736 | ) | 39,780 | ||||||||||
|
Technology
licenses and patents
|
34,026 | — | (15,730 | ) | 18,296 | |||||||||||
|
Total
|
$ | 442,327 | $ | (175,785 | ) | $ | (208,466 | ) | $ | 58,076 | ||||||
|
December
28, 2008
|
||||||||||||||||
|
Gross
Carrying Amount
|
Impairment
|
Accumulated
Amortization
|
Net
Carrying
Amount
|
|||||||||||||
|
Core
technology
|
$ | 315,301 | $ | (136,001 | ) | $ | (132,407 | ) | $ | 46,893 | ||||||
|
Developed
product technology
|
12,900 | — | (6,318 | ) | 6,582 | |||||||||||
|
Customer
relationships
|
80,100 | (39,784 | ) | (40,316 | ) | — | ||||||||||
|
Acquisition-related
intangible assets
|
408,301 | (175,785 | ) | (179,041 | ) | 53,475 | ||||||||||
|
Technology
licenses and patents
|
18,926 | — | (9,219 | ) | 9,707 | |||||||||||
|
Total
|
$ | 427,227 | $ | (175,785 | ) | $ | (188,260 | ) | $ | 63,182 | ||||||
Technology
licenses and patents increased by $15.1 million in the fiscal year ended
January 3, 2010 from technology licenses and patents purchased from third
parties. Amortization expense of intangible assets totaled
$20.2 million, $78.8 million and $98.9 million in fiscal years
2009, 2008 and 2007, respectively. The Company recorded a
$175.8 million impairment on acquisition-related intangible assets in the
fourth quarter of fiscal year 2008. This impairment was based upon
forecasted discounted cash flows which considered factors including a reduced
business outlook primarily due to NAND-industry pricing conditions.
The
annual expected amortization expense of intangible assets as of January 3,
2010 is presented below (in thousands):
|
Estimated
Amortization Expenses
|
||||||||
|
Fiscal periods
|
Acquisition-related
Intangible Assets
|
Technology
Licenses and Patents
|
||||||
|
2010
|
$ | 13,695 | $ | 6,471 | ||||
|
2011
|
13,034 | 4,619 | ||||||
|
2012
|
12,528 | 3,971 | ||||||
|
2013
|
523 | 2,670 | ||||||
|
2014
|
— | 565 | ||||||
|
Total
|
$ | 39,780 | $ | 18,296 | ||||
Goodwill. Goodwill
is not amortized, but instead is reviewed and tested for impairment at least
annually and whenever events or circumstances occur which indicate that goodwill
might be impaired. Impairment of goodwill is tested at the Company’s
reporting unit level by comparing the carrying amount, including goodwill, to
the fair value. In performing the analysis, the Company uses the best
information available, including reasonable and supportable assumptions and
projections. If the carrying amount of the Company exceeds its
implied fair value, goodwill is considered impaired and a second step is
performed to measure the amount of impairment loss, if any. The
Company performed its annual impairment test on the first day of the fourth
quarter of fiscal year 2008 and determined that the goodwill was not
impaired. However, based on a combination of factors, including the
economic environment, current and forecasted operating results, NAND-industry
pricing conditions and a sustained decline in the Company’s market
capitalization, the Company concluded that there were sufficient indicators to
require an interim goodwill impairment analysis during the fourth quarter of
fiscal year 2008 and the Company recognized an impairment charge of
$845.5 million. There is no remaining Goodwill balance as of
January 3, 2010 and December 28, 2008.
Note
7: Financing Arrangements
The
following table reflects the carrying value of the Company’s convertible debt as
of January 3, 2010 and December 28, 2008
(in millions):
|
January 3,
2010
|
December 28,
2008
|
|||||||
|
1%
Notes due 2013
|
$ | 1,150.0 | $ | 1,150.0 | ||||
|
Less:
Unamortized bond discount
|
(215.3 | ) | (270.9 | ) | ||||
|
Net
carrying amount of 1% Notes due 2013
|
934.7 | 879.1 | ||||||
|
1%
Notes due 2035
|
75.0 | 75.0 | ||||||
|
Total
convertible debt
|
1,009.7 | 954.1 | ||||||
|
Less:
convertible short-term debt
|
(75.0 | ) | ─ | |||||
|
Convertible
long-term debt
|
$ | 934.7 | $ | 954.1 | ||||
1% Convertible
Senior Notes Due 2013. In May 2006, the Company issued and
sold $1.15 billion in aggregate principal amount of 1% Convertible Senior
Notes due 2013 (the “1% Notes due 2013”) at par. The 1% Notes due
2013 may be converted, under certain circumstances described below, based on an
initial conversion rate of 12.1426 shares of common stock per $1,000 principal
amount of notes (which represents an initial conversion price of approximately
$82.36 per share). The net proceeds to the Company from the offering
of the 1% Notes due 2013 were $1.13 billion.
The
Company separately accounts for the liability and equity components of the 1%
Notes due 2013. The principal amount of
the liability component ($753.5 million as of the date of issuance) was
recognized at the present value of its cash flows using a discount rate of 7.4%,
the Company’s borrowing rate at the date of the issuance for a similar debt
instrument without the conversion feature. The carrying value of the
equity component was $241.9 million as of January 3, 2010 and
December 28, 2008.
The
following table presents the amount of interest cost recognized for the periods
relating to both the contractual interest coupon and amortization of the
discount on the liability component of the 1% Notes due 2013
(in millions):
|
Fiscal
Years Ended
|
||||||||||||
|
January 3,
2010
|
December 28,
2008
|
December 30,
2007
|
||||||||||
|
Contractual
interest coupon
|
$ | 11.5 | $ | 11.5 | $ | 11.5 | ||||||
|
Amortization
of bond discount
|
55.6 | 50.5 | 47.0 | |||||||||
|
Total
interest cost recognized
|
$ | 67.1 | $ | 62.0 | $ | 58.5 | ||||||
The
remaining bond discount of the 1% Notes due 2013 of $215.3 million as of
January 3, 2010 will be amortized over the remaining life of approximately
3.3 years.
The 1%
Notes due 2013 may be converted prior to the close of business on the scheduled
trading day immediately preceding February 15, 2013, in multiples of
$1,000 principal amount at the option of the holder under any of the following
circumstances: 1) during the five business-day period after any five
consecutive trading-day period (the “measurement period”) in which the trading
price per note for each day of such measurement period was less than 98% of the
product of the last reported sale price of the Company’s common stock and the
conversion rate on each such day; 2) during any calendar quarter after the
calendar quarter ending June 30, 2006, if the last reported sale price
of the Company’s common stock for 20 or more trading days in a period of
30 consecutive trading days ending on the last trading day of the
immediately preceding calendar quarter exceeds 120% of the applicable conversion
price in effect on the last trading day of the immediately preceding calendar
quarter; or 3) upon the occurrence of specified corporate
transactions. On and after February 15, 2013 until the
close of business on the scheduled trading day immediately preceding the
maturity date of May 15, 2013, holders may convert their notes at any
time, regardless of the foregoing circumstances.
Upon
conversion, a holder will receive the conversion value of the 1% Notes due 2013
to be converted equal to the conversion rate multiplied by the volume weighted
average price of the Company’s common stock during a specified period following
the conversion date. The conversion value of each 1% Notes due 2013
will be paid in: 1) cash equal to the lesser of the principal amount of the
note or the conversion value, as defined, and 2) to the extent the
conversion value exceeds the principal amount of the note, a combination of
common stock and cash. The conversion price will be subject to
adjustment in some events but will not be adjusted for accrued
interest. In addition, upon a fundamental change at any time, as
defined, the holders may require the Company to repurchase for cash all or a
portion of their notes upon a “designated event” at a price equal to 100% of the
principal amount of the notes being repurchased plus accrued and unpaid
interest, if any.
The
Company pays cash interest at an annual rate of 1%, payable semi-annually on May
15 and November 15 of each year, beginning
November 15, 2006. Debt issuance costs were approximately
$24.5 million, of which $8.7 million was allocated to capital in
excess of par value and $15.8 million was allocated to deferred issuance
costs and is amortized to interest expense over the term of the 1% Notes due
2013.
Concurrently
with the issuance of the 1% Notes due 2013, the Company purchased a convertible
bond hedge and sold warrants. The separate convertible bond hedge and
warrant transactions are structured to reduce the potential future economic
dilution associated with the conversion of the 1% Notes due 2013 and to increase
the initial conversion price to $95.03 per share. Each of these
components are discussed separately below:
|
·
|
Convertible Bond
Hedge. Counterparties agreed to sell to the Company up
to approximately 14 million shares of the Company’s common stock,
which is the number of shares initially issuable upon conversion of the 1%
Notes due 2013 in full, at a price of $82.36 per
share. The convertible bond hedge transaction will be settled
in net shares and will terminate upon the earlier of the maturity date of
the 1% Notes due 2013 or the first day none of the 1% Notes due 2013
remain outstanding due to conversion or otherwise. Settlement
of the convertible bond hedge in net shares, based on the number of shares
issued upon conversion of the 1% Notes due 2013, on the expiration date
would result in the Company receiving net shares equivalent to the number
of shares issuable by the Company upon conversion of the 1% Notes due
2013. Should there be an early unwind of the convertible bond
hedge transaction, the number of net shares potentially received by the
Company will depend upon 1) the then existing overall market conditions,
2) the Company’s stock price, 3) the volatility of the Company’s stock,
and 4) the amount of time remaining before expiration of the convertible
bond hedge. The convertible bond hedge transaction cost of
$386.1 million has been accounted for as an equity
transaction. The Company initially recorded a tax benefit of
approximately $145.6 million in stockholders’ equity from the
deferred tax asset related to the convertible bond hedge at inception of
the transaction.
|
|
·
|
Sold
Warrants. The Company received $308.7 million from
the same counterparties from the sale of warrants to purchase up to
approximately 14 million shares of the Company's common stock at an
exercise price of $95.03 per share. As of January 3,
2010, the warrants had an expected life of 3.6 years and expire in
August 2013. At expiration, the Company may, at its
option, elect to settle the warrants on a net share basis. As
of January 3, 2010, the warrants had not been exercised and remained
outstanding. The value of the warrants has been classified as
equity.
|
1% Convertible
Notes Due 2035. In November 2006, the Company assumed the
aggregate principal amount of $75.0 million 1% Convertible Senior Notes due
March 2035 (the “1% Notes due 2035”) from msystems Ltd.
(“msystems”). The Company is obligated to pay interest on the 1%
Notes due 2035 semi-annually on March 15 and September 15 commencing
March 15, 2007.
The 1%
Notes due 2035 are convertible, at the option of the holders at any time before
the maturity date, into shares of the Company at a conversion rate of 26.8302
shares per one thousand dollars principal amount of the 1% Notes due 2035,
representing a conversion price of approximately $37.27 per share.
Beginning
on March 15, 2008 and until March 14, 2010, the Company may redeem for
cash the notes, in whole or in part at any time at a redemption price equal to
100% of the principal amount of the notes to be redeemed, plus accrued but
unpaid interest, if any, to but excluding the redemption date, if the last
reported sales price of the Company ordinary shares has exceeded 130% of the
conversion price for at least 20 trading days in any consecutive 30-day trading
period ending on the trading day prior to the date of mailing of the notice of
redemption.
At any
time on or after March 15, 2010, the Company may redeem the notes in whole
or in part at a redemption price equal to 100% of the principal amount of the
notes to be redeemed, plus accrued and unpaid interest, if any, to but excluding
the optional redemption date.
Holders
of the notes have the right to require the Company to purchase all or a portion
of their notes on March 15, 2010, March 15, 2015, March 15,
2020, March 15, 2025 and March 15, 2030. The purchase price
payable will be equal to 100% of the principal amount of the notes to be
purchased, plus accrued and unpaid interest, if any, to but excluding the
purchase date. Due to the short-term nature of the conversion rights,
the Company has reclassified the entire value of the 1% Notes due 2035 to
convertible short-term debt in the Consolidated Balance Sheet as of
January 3, 2010.
The
Company determined the existence of a substantial premium over par value for the
1% Notes due 2035 based upon quoted market prices at the msystems acquisition
date and recorded the notes at par value with the resulting excess of fair value
over par (the substantial premium) recorded in capital in excess of par value in
stockholders’ equity in the amount of $26.4 million.
On
February 11, 2010, the Company notified the holders of its 1% Convertible Notes
due 2035 that it would exercise its option to redeem the $75 million
outstanding on March 15, 2010. The redemption price will be $1,000
per $1,000 principal amount of the debentures, plus accrued interest, for an
aggregate cash expenditure of $75 million plus accrued interest of
$0.4 million.
Note
8: Concentrations
of Risk and Segment Information
Geographic
Information and Major Customers. The Company markets and sells
flash memory products in the U.S. and in foreign countries through its sales
personnel, dealers, distributors, retailers and subsidiaries. The
Company’s Chief Operating Decision Maker, the President and Chief Operating
Officer, evaluates performance of the Company and makes decisions regarding
allocation of resources based on total Company results. Since the
Company operates in one segment, all financial segment information can be found
in the accompanying Consolidated Financial Statements.
Other
than sales in the U.S., South Korea, Taiwan, Europe, Middle East and Africa, and
Other Asia-Pacific, which includes Japan, international sales were not material
individually in any other international locality. Intercompany sales
between geographic areas have been eliminated.
Revenue
by geographic areas for fiscal years 2009, 2008 and 2007 are as follows (in
thousands):
|
Fiscal
Years Ended
|
||||||||||||
|
January 3,
2010
|
December 28,
2008
|
December 30,
2007
|
||||||||||
|
Revenues:
|
||||||||||||
|
United
States
|
$ | 940,596 | $ | 1,047,045 | $ | 1,227,303 | ||||||
|
South
Korea
|
428,411 | 476,304 | 432,552 | |||||||||
|
Taiwan
|
397,338 | 178,751 | 213,788 | |||||||||
|
Other
Asia-Pacific
|
1,010,125 | 825,645 | 998,119 | |||||||||
|
Europe,
Middle East and Africa
|
707,758 | 752,849 | 890,340 | |||||||||
|
Other
foreign countries
|
82,578 | 70,758 | 134,264 | |||||||||
|
Total
|
$ | 3,566,806 | $ | 3,351,352 | $ | 3,896,366 | ||||||
Product
revenues from customers are based on the geographic location of where the
product is delivered. License and royalty revenue is attributed to
countries based upon the headquarters of the licensee.
Long-lived
assets by geographic area as of the end of fiscal years 2009 and 2008 are as
follows (in thousands):
|
As
of
|
||||||||
|
January 3,
2010
|
December 28,
2008
|
|||||||
|
Long-lived
assets:
|
||||||||
|
United
States
|
$ | 147,125 | $ | 205,022 | ||||
|
Japan
|
428,675 | 482,980 | ||||||
|
China
|
121,519 | 146,666 | ||||||
|
Other
foreign countries
|
33,055 | 44,712 | ||||||
|
Total
|
$ | 730,374 | $ | 879,380 | ||||
Long-lived
assets are attributed to the geographic location in which they are
located. The Company includes in long-lived assets property and
equipment, long-term investments in FlashVision, Flash Partners and Flash
Alliance, and equity investments, and attributes those investments to the
location of the investee’s primary operations.
Customer and
Supplier Concentrations. A limited number of customers or
licensees have accounted for a substantial portion of the Company’s
revenues. Revenues from the Company’s top 10 customers or licensees
accounted for approximately 42%, 48% and 46% of the Company’s revenues for the
fiscal years ended January 3, 2010, December 28, 2008 and
December 30, 2007, respectively. All customers were individually
less than 10% of the Company’s total revenues in fiscal years 2009 and
2007. In fiscal year 2008, Samsung Electronics Co., Ltd (“Samsung”)
accounted for 13% of the Company’s total revenues through a combination of
license and royalty and product revenues.
All of
the Company’s flash memory card products require silicon wafers for the memory
components and the controller components. The Company’s memory wafers
or components are currently supplied almost entirely from Flash
Ventures. The Company’s controller wafers are primarily manufactured
by Semiconductor Manufacturing International Corporation, Taiwan Semiconductor
Manufacturing Company, Ltd., and United Microelectronics
Corporation. The failure of any of these sources to deliver silicon
wafers could have a material adverse effect on the Company’s business, financial
condition and results of operations. Moreover, Toshiba’s employees
that produce Flash Ventures’ products are covered by collective bargaining
agreements and any strike or other job action by those employees could interrupt
the Company’s wafer supply from Toshiba’s Yokkaichi, Japan
operations.
In
addition, key components are purchased from single source vendors for which
alternative sources are currently not available. Shortages could
occur in these essential materials due to an interruption of supply or increased
demand in the industry. If the Company were unable to procure certain
of such materials, it would be required to reduce its manufacturing operations,
which could have a material adverse effect upon its results of
operations. The Company also relies on third-party subcontractors to
assemble and test a portion of its products. The Company has no
long-term contracts with these subcontractors and cannot directly control
product delivery schedules or manufacturing processes. This could
lead to product shortages or quality assurance problems that could increase the
manufacturing costs of its products and have material adverse effects on the
Company’s operating results.
Concentration of
Credit Risk. The Company’s concentration of credit risk
consists principally of cash, cash equivalents, short and long-term marketable
securities and trade receivables. The Company’s investment policy
restricts investments to high-credit quality investments and limits the amounts
invested with any one issuer. The Company sells to OEMs, retailers
and distributors in the U.S., Europe, Middle East and Africa (“EMEA”), and
Asia-Pacific (“APAC”), performs ongoing credit evaluations of its customers’
financial condition, and generally requires no collateral.
Off-Balance Sheet
Risk. The Company has off-balance sheet financial
obligations. See Note 13, “Commitments, Contingencies and
Guarantees.”
Note
9: Compensation and
Benefits
Share-Based
Benefit Plans
2005 Incentive
Plan. On May 27,
2005, the Company’s stockholders approved the 2005 Stock Incentive Plan, which
was amended in May 2006 and renamed the 2005 Incentive Plan (“2005
Plan”). Shares of the Company’s common stock may be issued under the
2005 Plan pursuant to three separate equity incentive programs: (i) the
discretionary grant program under which stock options and stock appreciation
rights may be granted to officers and other employees, non-employee board
members and independent consultants, (ii) the stock issuance program under which
shares may be awarded to such individuals through restricted stock or restricted
stock unit awards or as a stock bonus for services rendered to the Company, and
(iii) an automatic grant program for the non-employee board members pursuant to
which such individuals will receive option grants or other stock awards at
designated intervals over their period of board service. The 2005
Plan also includes a performance-based cash bonus awards program for employees
classified under Section 16. Grants and awards under the
discretionary grant program generally vest as follows: 25% of the shares will
vest on the first anniversary of the vesting commencement date and the remaining
75% will vest proportionately each quarter over the next 36 months of continued
service. Awards under the stock issuance program generally vest in
equal annual installments over a 4-year period. Grants under the
automatic grant program will vest in accordance with the specific vesting
provisions set forth in that program. A total of 27,924,938 shares of
the Company’s common stock have been reserved for issuance under this
plan. The share reserve may increase by up to 10,000,000 shares of
common stock to the extent that outstanding options under the 1995 Stock Option
Plan and the 1995 Non-Employee Directors Stock Option Plan expire or terminate
unexercised, of which as of January 3, 2010, 2,224,938 shares of common
stock had been added to the 2005 Plan reserve. All options granted
under the 2005 Plan were granted with an exercise price equal to the fair market
value of the common stock on the date of grant and will expire seven years from
the date of grant.
1995 Stock Option
Plan and 1995 Non-Employee Directors Stock Option Plan. Both
of these plans terminated on May 27, 2005, and no further option
grants were made under the plans after that date. However, options
that were outstanding under these plans on May 27, 2005 continue to be governed
by their existing terms and may be exercised for shares of the Company’s common
stock at any time prior to the expiration of the ten-year option term or any
earlier termination of those options in connection with the optionee’s cessation
of service with the Company. Grants and awards under these plans
generally vest as follows: 25% of the shares will vest on the first anniversary
of the vesting commencement date and the remaining 75% will vest proportionately
each quarter over the next 36 months of continued service.
2005 Employee
Stock Purchase Plan. The 2005 Employee Stock Purchase Plan
(“ESPP”) was approved by the stockholders on May 27, 2005. The ESPP
consists of two components: a component for employees residing in the U.S. and
an international component for employees who are non-U.S.
residents. The ESPP allows eligible employees to purchase shares of
the Company’s common stock at the end of each six-month offering period at a
purchase price equal to 85% of the lower of the fair market value per share on
the start date of the offering period or the fair market value per share on the
purchase date. The ESPP had an original authorization of 5,000,000
shares to be issued, of which 2,233,939 shares were available to be issued as of
January 3, 2010. In the fiscal years ended January 3, 2010,
December 28, 2008 and December 30, 2007, a total of
1,158,909, 956,187 and 385,989 shares of common stock, respectively, have been
issued under this plan.
msystems Ltd.
1996 Section 102 Stock Option/Stock Purchase Plan and 2003 Stock Option and
Restricted Stock Incentive Plan. The
msystems Ltd. 1996 Section 102 Stock Option/Stock Purchase Plan and 2003 Stock
Option and Restricted Stock Incentive Plan acquired through the Company’s
acquisition of msystems, were terminated on November 19, 2006, and no
further grants were made under these plans after that date. However,
award grants that were outstanding under these plans on
November 19, 2006 continue to be governed by their existing terms and
may be exercised for shares of the Company’s common stock at any time prior to
the expiration of the ten-year option term or any earlier termination of those
options in connection with the optionee’s cessation of service with the
Company. Awards granted under these plans generally vest as
follows: 50% of the shares will vest on the second anniversary of the
vesting commencement date and the remaining 50% will vest proportionately each
quarter over the next 24 months of continued service.
Matrix
Semiconductor, Inc. 2005 Stock Incentive Plan, 1999 Stock Plan and 1998
Long-term Incentive Plan. The Matrix Semiconductor, Inc. 2005
Stock Incentive Plan, 1999 Stock Plan and the Rhombus, Inc. 1998 Long-term
Incentive Plan (“Matrix Stock Plans”), acquired through SanDisk’s acquisition of
Matrix Semiconductor, Inc. (“Matrix”), were terminated on
January 13, 2006, and no further option grants were made under these
plans after that date. However, award grants that were outstanding
under these plans on January 13, 2006 continue to be governed by their
existing terms and may be exercised for shares of the Company’s common stock at
any time prior to the expiration of the ten-year option term or any earlier
termination of those options in connection with the optionee’s cessation of
service with the Company. Awards granted under these plans generally
vest as follows: 1/48 of the shares will vest proportionately each month over
the next 48 months of continued service or 1/60 of the shares will vest
proportionately each month over the next 60 months of continued
service.
Accounting
for Share-Based Compensation Expense
For
share-based awards expected to vest, compensation cost includes the following:
(a) compensation cost, based on the grant-date estimated fair value and
expense attribution method related to any share-based awards granted through,
but not yet vested as of January 1, 2006, and (b) compensation
cost for any share-based awards granted on or subsequent to
January 2, 2006, based on the grant-date fair value. The
Company recognizes compensation expense for the fair values of these awards,
which have graded vesting, on a straight-line basis over the requisite service
period of each of these awards, net of estimated forfeitures.
The
Company estimates the fair value of stock options granted using the
Black-Scholes-Merton option-pricing formula and a single-option award
approach. The Company’s expected term represents the period that the
Company’s share-based awards are expected to be outstanding and was determined
based on historical experience regarding similar awards, giving consideration to
the contractual terms of the share-based awards. The Company’s
expected volatility is based on the implied volatility of its traded
options. The Company has historically not paid dividends and has no
foreseeable plans to issue dividends. The risk-free interest rate is
based on the yield from U.S. Treasury zero-coupon bonds with an equivalent
term.
Valuation
Assumptions. The fair value of the Company’s stock options
granted to employees, officers and non-employee board members and ESPP shares
granted to employees for the years ended January 3, 2010, December 28,
2008 and December 30, 2007 was estimated using the following weighted
average assumptions:
|
January 3,
2010
|
December 28,
2008
|
December 30,
2007
|
|||
|
Option
Plan Shares
|
|||||
|
Dividend
yield
|
None
|
None
|
None
|
||
|
Expected
volatility
|
0.85
|
0.52
|
0.44
|
||
|
Risk-free
interest rate
|
1.41%
|
2.50%
|
4.44%
|
||
|
Expected
lives
|
3.6
years
|
3.5
years
|
3.4
years
|
||
|
Estimated
annual forfeiture rate
|
9.07%
|
7.59%
|
|||
|
Weighted
average fair value at grant date
|
$5.36
|
$8.40
|
$15.84
|
||
|
Employee
Stock Purchase Plan Shares
|
|||||
|
Dividend
yield
|
None
|
None
|
None
|
||
|
Expected
volatility
|
0.73
|
0.60
|
0.43
|
||
|
Risk-free
interest rate
|
0.35%
|
1.97%
|
5.08%
|
||
|
Expected
lives
|
½
year
|
½
year
|
½
year
|
||
|
Weighted
average fair value at exercise date
|
$4.82
|
$6.00
|
$12.75
|
Stock Options and
SARs. A summary of stock options and stock appreciation rights
(“SARs”) activity under all of the Company’s share-based compensation plans as
of January 3, 2010 and changes during the fiscal year ended January 3,
2010 is presented below:
|
|
Shares
|
Weighted
Average Exercise Price
|
Weighted
Average Remaining Contractual Term (Years)
|
Aggregate
Intrinsic Value
|
||||||||||||
|
(In thousands, except exercise
price and contractual term)
|
||||||||||||||||
|
Options
and SARs outstanding at January 1, 2007
|
26,392 | $ | 31.97 | 6.7 | $ | 392,469 | ||||||||||
|
Granted
|
5,848 | 43.65 | ||||||||||||||
|
Exercised
|
(4,678 | ) | 20.24 | 124,816 | ||||||||||||
|
Forfeited
|
(1,728 | ) | 45.99 | |||||||||||||
|
Expired
|
(277 | ) | 56.03 | |||||||||||||
|
Options
and SARs outstanding at December 30, 2007
|
25,557 | 35.59 | 5.8 | 165,185 | ||||||||||||
|
Granted
|
3,616 | 21.29 | ||||||||||||||
|
Exercised
|
(895 | ) | 7.77 | 11,751 | ||||||||||||
|
Forfeited
|
(1,927 | ) | 42.47 | |||||||||||||
|
Expired
|
(1,294 | ) | 43.35 | |||||||||||||
|
Options
and SARs outstanding at December 28, 2008
|
25,057 | 33.59 | 4.9 | 5,284 | ||||||||||||
|
Granted
|
4,242 | 9.41 | ||||||||||||||
|
Exercised
|
(964 | ) | 12.60 | 5,807 | ||||||||||||
|
Forfeited
|
(1,376 | ) | 32.94 | |||||||||||||
|
Expired
|
(2,063 | ) | 38.97 | |||||||||||||
|
Options
and SARs outstanding at January 3, 2010
|
24,896 | 29.87 | 4.4 | 180,834 | ||||||||||||
|
Options
and SARs vested and expected to vest after January 3, 2010, net of
forfeitures
|
23,212 | 30.31 | 4.3 | 162,902 | ||||||||||||
|
Options
and SARs exercisable at January 3, 2010
|
17,290 | 33.74 | 3.9 | 88,180 | ||||||||||||
At January 3, 2010, the total compensation cost
related to options and SARs granted to employees under the Company’s
share-based compensation plans but not yet
recognized was approximately $62.4 million, net of estimated forfeitures. This cost
will be amortized on a straight-line basis over a weighted average period of
approximately 2.5 years.
Restricted Stock
Units. Restricted stock units (“RSUs”) are converted into
shares of the Company’s common stock upon vesting on a one-for-one
basis. Typically, vesting of RSUs is subject to the employee’s
continuing service to the Company. The cost of these awards is
determined using the fair value of the Company’s common stock on the date of the
grant, and compensation is recognized on a straight-line basis over the
requisite vesting period.
A summary
of the changes in RSUs outstanding under the Company’s share-based compensation
plan during the fiscal year ended January 3, 2010 is as
follows:
|
Shares
|
Weighted
Average Grant Date Fair Value
|
Aggregate
Intrinsic Value
|
||||||||||
|
(In
thousands, except for weighted average grant date fair
value)
|
||||||||||||
|
Non-vested
share units at January 1, 2007
|
598 | $ | 58.71 | $ | 25,740 | |||||||
|
Granted
|
132 | 44.86 | ||||||||||
|
Vested
|
(184 | ) | 56.21 | 8,136 | ||||||||
|
Forfeited
|
(47 | ) | 67.10 | |||||||||
|
Non-vested
share units at December 30, 2007
|
499 | 55.20 | 16,735 | |||||||||
|
Granted
|
1,338 | 18.79 | ||||||||||
|
Vested
|
(173 | ) | 54.41 | 4,149 | ||||||||
|
Forfeited
|
(141 | ) | 32.22 | |||||||||
|
Non-vested
share units at December 28, 2008
|
1,523 | 25.38 | 13,983 | |||||||||
|
Granted
|
95 | 15.12 | ||||||||||
|
Vested
|
(559 | ) | 26.40 | 7,977 | ||||||||
|
Forfeited
|
(215 | ) | 20.86 | |||||||||
|
Non-vested
share units at January 3, 2010
|
844 | 24.69 | 24,476 | |||||||||
As of
January 3, 2010, the Company had $10.6 million of total unrecognized
compensation expense, net of estimated forfeitures, related to RSUs, which will
be recognized over a weighted average estimated remaining life of
1.3 years.
Employee Stock
Purchase Plan. At January 3, 2010, there was
$0.6 million of total unrecognized compensation cost related to ESPP that
is expected to be recognized over a period of approximately
0.1 years.
Share-Based
Compensation Expense. The
Company recorded $95.6 million, $97.8 million and
$133.0 million of share-based compensation
expense for the fiscal years ended January 3, 2010, December 28, 2008
and December 30, 2007, respectively, that included the
following:
|
January 3,
2010
|
December 28,
2008
|
December 30,
2007
|
||||||||||
|
(In
thousands)
|
||||||||||||
|
Share-based
compensation expense by caption:
|
||||||||||||
|
Cost
of product revenues
|
$ | 12,427 | $ | 10,775 | $ | 14,743 | ||||||
|
Research
and development
|
36,399 | 38,854 | 49,194 | |||||||||
|
Sales
and marketing
|
19,247 | 20,067 | 31,722 | |||||||||
|
General
and administrative
|
27,487 | 28,103 | 37,351 | |||||||||
|
Total
share-based compensation expense
|
$ | 95,560 | $ | 97,799 | $ | 133,010 | ||||||
|
Share-based
compensation expense by type of award:
|
||||||||||||
|
Stock
options and SARs
|
$ | 79,859 | $ | 77,015 | $ | 111,360 | ||||||
|
Restricted
stock units
|
11,922 | 14,753 | 16,674 | |||||||||
|
Employee
stock purchase plans
|
3,779 | 6,031 | 4,976 | |||||||||
|
Total
share-based compensation expense
|
$ | 95,560 | $ | 97,799 | $ | 133,010 | ||||||
Share-based compensation of $2.3 million and
$3.4 million related to manufacturing personnel was capitalized into
inventory as of January 3, 2010 and December 28, 2008,
respectively.
In the
fourth quarter of fiscal year 2009, the Company identified that its third party
equity software contained a feature that resulted in incorrect share-based
compensation expense. This software feature affected the Company’s
share-based compensation expense reported for the nine months ended
September 27, 2009 and the three fiscal years ended December 28,
2008. The Company determined that the impact of
the underreported share-based compensation expense was not material to any
of the previously issued annual or interim financial
statements. Accordingly, the fourth quarter and full fiscal year 2009
include a cumulative non-cash adjustment of $16.2 million to increase
share-based compensation, allocated to multiple expense
categories. The Company has modified its implementation of the
software to prevent this error going forward.
Note
10: Restructuring
Plans
The
Company implemented several restructuring plans during fiscal years 2008 and
2007, and recorded negligible restructuring charges in fiscal year 2009 and
restructuring charges of $35.5 million and $6.7 million in fiscal
years 2008 and 2007, respectively. The goal of these plans was to
better align the Company’s cost structure with its anticipated revenue stream
and to improve the Company’s results of operations and cash flows.
Second Quarter of
Fiscal 2008 Restructuring Plan. In the second quarter ended
June 28, 2008, the Company initiated restructuring actions in an effort to
better align its cost structure with its anticipated revenue stream and to
improve the Company’s results of operations and cash flows (“Second Quarter of
Fiscal 2008 Restructuring Plan”). The cost of $4.1 million was
for severance and benefits related to the involuntary termination of
approximately 131 employees in all functions, primarily in the U.S. and
Israel.
The
following table sets forth the activity in the accrued restructuring balances
related to the Second Quarter of Fiscal 2008 Restructuring Plan
(in millions).
|
Severance
and Benefits
|
||||
|
Restructuring
provision
|
$ | 4.1 | ||
|
Cash
paid
|
(3.1 | ) | ||
|
Accrual
balance at December 28, 2008
|
1.0 | |||
|
Accrual
adjustments
|
(0.8 | ) | ||
|
Accrual
balance at January 3, 2010
|
$ | 0.2 | ||
During
fiscal year 2009, the Company recorded a reduction of ($0.8) million
related to lower employee severance and benefits costs than was originally
estimated. The remaining restructuring accrual balance is reflected
in Other current accrued liabilities in the Consolidated Balance Sheets and is
expected to be utilized in fiscal year 2010.
Fourth Quarter of
Fiscal 2008 Restructuring Plan and Other. In the fourth
quarter ended December 28, 2008, the Company initiated additional
restructuring actions in an effort to better align its cost structure with
business operation levels (“Fourth Quarter of Fiscal 2008 Restructuring Plan and
Other”). Under this plan, the Company recorded costs of
$12.6 million related to the involuntary termination of 428 employees and
51 employees in fiscal years 2008 and 2009, respectively, in all functions,
primarily in the U.S., Israel and Spain. Contract termination fees
and other charges of $21.0 million included restructuring charges for
marketing contract termination costs, technology license impairments and fixed
asset impairments related to outsourcing certain manufacturing
activities. In addition to the restructuring charge, Contract
termination fees and other charges include an accrual for unrelated litigation
settlements.
The
following table sets forth the activity in the accrued restructuring balances
related to the Fourth Quarter of Fiscal 2008 Restructuring Plan and Other
(in millions).
|
Severance
and Benefits
|
Contract
Termination Fees and Other Charges
|
Total
|
||||||||||
|
Restructuring
and other provisions
|
$ | 10.4 | $ | 21.0 | $ | 31.4 | ||||||
|
Cash
paid
|
(4.1 | ) | (2.4 | ) | (6.5 | ) | ||||||
|
Non-cash
utilization
|
― | (4.6 | ) | (4.6 | ) | |||||||
|
Accrual
balance at December 28, 2008
|
6.3 | 14.0 | 20.3 | |||||||||
|
Restructuring
|
2.2 | ― | 2.2 | |||||||||
|
Cash
paid
|
(7.9 | ) | (13.1 | ) | (21.0 | ) | ||||||
|
Accrual
adjustments
|
(0.5 | ) | (0.9 | ) | (1.4 | ) | ||||||
|
Accrual
balance at January 3, 2010
|
$ | 0.1 | $ | ― | $ | 0.1 | ||||||
During
fiscal year 2009, the Company recorded additional employee restructuring costs
of $2.2 million to reflect employees terminated in fiscal year
2009. In addition, employee severance and benefits was reduced by
($0.5) million to reflect lower employee severance and benefits costs than
originally estimated, and contract termination fees and other charges was
reduced by ($0.9) million to reflect lower negotiated contract termination
costs. The Company anticipates that the remaining restructuring
accrual balance of $0.1 million will be paid out or utilized in fiscal year
2010.
Fiscal 2007
Restructuring Plan. In the first quarter of fiscal year 2007,
the Company initiated a restructuring plan to better align its organizational
workforce and close redundant facilities in order to reduce the Company’s cost
structure. The Company incurred a total cost of $6.7 million, of
which $6.0 million was related to involuntary termination of 149 employees
in all functions in the U.S. and Israel. Substantially all of the
fiscal year 2007 restructuring plan was paid out in cash during fiscal year
2007. The Company anticipates that the remaining accrued
restructuring balance of $0.7 million will be substantially paid out in
cash through the first quarter of fiscal year 2010, in connection with long-term
facility leases. The remaining restructuring accrual balance is
reflected in Other current accrued liabilities in the Consolidated Balance
Sheets.
Note
11: Income Taxes
The
provision for income taxes consists of the following (in
thousands):
|
Fiscal
Years Ended
|
||||||||||||
|
January 3,
2010
|
December 28,
2008
|
December 30,
2007
|
||||||||||
|
Current:
|
||||||||||||
|
Federal
|
$ | 15,531 | $ | (245,361 | ) | $ | 108,636 | |||||
|
State
|
7,354 | 7,246 | 19,958 | |||||||||
|
Foreign
|
78,490 | 46,925 | 81,442 | |||||||||
| 101,375 | (191,190 | ) | 210,036 | |||||||||
|
Deferred:
|
||||||||||||
|
Federal
|
(11,271 | ) | 213,980 | (38,686 | ) | |||||||
|
State
|
139 | 36,655 | (2,655 | ) | ||||||||
|
Foreign
|
(1,752 | ) | (25,195 | ) | (11,864 | ) | ||||||
| (12,884 | ) | 225,440 | (53,205 | ) | ||||||||
|
Provision
for income taxes
|
$ | 88,491 | $ | 34,250 | $ | 156,831 | ||||||
Income
(loss) before provision for income taxes consisted of the following (in
thousands):
|
Fiscal
Years Ended
|
||||||||||||
|
January 3,
2010
|
December 28,
2008
|
December 30,
2007
|
||||||||||
|
United
States
|
$ | 412,646 | $ | (1,908,020 | ) | $ | 408,389 | |||||
|
International
|
91,155 | (44,354 | ) | (55,731 | ) | |||||||
|
Total
|
$ | 503,801 | $ | (1,952,374 | ) | $ | 352,658 | |||||
The
Company’s provision for income taxes differs from the amount computed by
applying the federal statutory rates to income (loss) before taxes as
follows:
|
Fiscal
Years Ended
|
||||||||||||
|
January 3,
2010
|
December 28,
2008
|
December 30,
2007
|
||||||||||
|
U.S.
federal statutory rate
|
35.0 | % | 35.0 | % | 35.0 | % | ||||||
|
State
taxes, net of federal benefit
|
0.8 | 0.5 | 3.6 | |||||||||
|
Non-deductible
share-based compensation expense
|
1.9 | (0.7 | ) | 5.7 | ||||||||
|
Impairment
of goodwill
|
— | (17.9 | ) | — | ||||||||
|
Valuation
allowance
|
(8.0 | ) | (18.5 | ) | — | |||||||
|
Tax-exempt
interest income
|
(2.2 | ) | 1.1 | (6.4 | ) | |||||||
|
Foreign
earnings at other than U.S. rates
|
(10.8 | ) | (1.0 | ) | (4.5 | ) | ||||||
|
Foreign
losses not benefited
|
— | — | 8.8 | |||||||||
|
Other
|
0.9 | (0.3 | ) | 2.3 | ||||||||
|
Effective
income tax rates
|
17.6 | % | (1.8 | )% | 44.5 | % | ||||||
Deferred
income taxes reflect the net tax effects of temporary differences between the
carrying amounts of assets and liabilities for financial reporting purposes and
the amounts used for income tax return reporting
purposes. Significant components of the Company’s net deferred tax
assets as of January 3, 2010 and December 28, 2008 were as follows (in
thousands):
|
January 3,
2010
|
December 28,
2008
|
|||||||
|
Deferred
tax assets:
|
||||||||
|
Deferred
income on shipments to distributors and retailers and deferred revenue
recognized for tax purposes
|
$ | 25,975 | $ | 35,908 | ||||
|
Accruals
and reserves not currently deductible
|
125,112 | 149,582 | ||||||
|
Depreciation
and amortization not currently deductible
|
56,141 | 60,406 | ||||||
|
Deductible
share-based compensation
|
65,281 | 50,465 | ||||||
|
Unrealized
loss on investments
|
36,189 | 52,138 | ||||||
|
Unrealized
foreign exchange loss
|
71,478 | 58,131 | ||||||
|
Net
operating loss carryforwards
|
26,083 | 52,553 | ||||||
|
Tax
credit carryforward
|
26,681 | 149,785 | ||||||
|
Other
|
27,359 | 17,139 | ||||||
|
Gross
deferred tax assets
|
460,299 | 626,107 | ||||||
|
Valuation
allowance
|
(287,498 | ) | (430,817 | ) | ||||
|
Deferred
tax assets, net of valuation allowance
|
172,801 | 195,290 | ||||||
|
Deferred
tax liabilities:
|
||||||||
|
Acquired
intangible assets
|
(11,152 | ) | (15,816 | ) | ||||
|
Unrealized
gain on investments
|
(25,852 | ) | (72,302 | ) | ||||
|
Unrealized
foreign exchange gain
|
(56,920 | ) | (78,031 | ) | ||||
|
U.S.
taxes provided on unremitted earnings of foreign
subsidiaries
|
(26,338 | ) | (17,619 | ) | ||||
|
Total
deferred tax liabilities
|
(120,262 | ) | (183,768 | ) | ||||
|
Net
deferred tax assets
|
$ | 52,539 | $ | 11,522 | ||||
The
Company continues to be in a cumulative loss position over recent years and
based on all available evidence determined it is more likely than not that net
deferred tax assets in the US and certain foreign jurisdictions will not be
realized. The valuation allowance decreased ($143.3) million in
fiscal year 2009 from fiscal year 2008, due primarily to utilization of credits
and reversals of temporary differences in the U.S. The future release
of the valuation allowance will continue to benefit the provision for income
taxes. The fiscal year 2008 taxable loss in the U.S. was carried back
to prior years and a tax refund of $178.8 million has been received and
$64.7 million remains outstanding.
The
Emergency Economic Stabilization Act of 2008 enacted October 3, 2008
retroactively extended the research credit for the fiscal years through
2009. As a result, the current year credit of $1.7 million, if
not utilized, will be carried forward and is subject to a valuation
allowance.
The
Company has federal, state, and foreign net operating loss carryforwards of
approximately $49 million, $169 million and $22 million,
respectively. The net operating losses will begin to expire in fiscal
year 2013, if not utilized. The Company also has federal and
California research credit carryforwards of approximately $4 million and
$15 million, respectively. The credit carryforwards will begin
to expire in fiscal year 2013, if not utilized. Some of these
carryforwards are subject to annual limitations, including Section 382 and
Section 383 of the Internal Revenue Code of 1986, as amended, for U.S. tax
purposes and similar state provisions.
No
provision has been made for U.S. income taxes or foreign withholding taxes on
approximately $56 million of cumulative unremitted earnings of certain
foreign subsidiaries as of January 3, 2010, since the Company intends to
indefinitely reinvest these earnings outside the U.S. If these
earnings were distributed to the U.S., the Company would be subject to
additional U.S. income taxes and foreign withholding taxes (subject to
adjustment for foreign tax credits). As of January 3, 2010, the
unrecognized deferred tax liability for these earnings was approximately
$17 million.
The tax
benefit (charge) associated with the exercise of stock options was applied to
capital in excess of par value in the amount of zero, ($3.9) million and
$18.4 million in fiscal years 2009, 2008 and 2007,
respectively. The tax benefit associated with the exercise of stock
options credited to goodwill in fiscal years 2009 and 2008 was zero and fiscal
year 2007 was $0.6 million.
A
reconciliation of the beginning and ending amount of unrecognized tax benefits
is as follows (in thousands):
|
Balance
at December 31, 2007
|
$ | 70,194 | ||
|
Additions:
|
||||
|
Tax
positions related to current year
|
26,342 | |||
|
Tax
positions related to prior years
|
44,247 | |||
|
Reductions:
|
||||
|
Tax
positions related to prior years
|
(13,501 | ) | ||
|
Expiration
of statute of limitations
|
(2,845 | ) | ||
|
Balance
at December 28, 2008
|
124,437 | |||
|
Additions:
|
||||
|
Tax
positions related to current year
|
29,263 | |||
|
Tax
positions related to prior years
|
26,064 | |||
|
Balance
at January 3, 2010
|
$ | 179,764 |
The total
amount of unrecognized tax benefits that would impact the effective tax rate is
approximately $98 million at January 3, 2010. The Company
recognizes interest and penalties related to unrecognized tax benefits in income
tax expense. The liability related to unrecognized tax benefits
included accrued interest and penalties of approximately $31.9 million, and
$24.3 million at January 3, 2010 and December 28, 2008,
respectively. Tax expense for the years ended January 3, 2010
and December 28, 2008 included interest and penalties of $6.4 million
and $12.3 million, respectively.
It is
reasonably possible that the unrecognized tax benefits could decrease by
approximately $3.0 million within the next 12 months as a result of the
expiration of statutes of limitation. The Company is currently under
audit by several tax authorities. Because timing of the resolution
and/or closure of these audits is highly uncertain it is not possible to
estimate other changes to the amount of unrecognized tax benefits for positions
existing at January 3, 2010.
The
Company is subject to U.S. federal income tax as well as income taxes in many
state and foreign jurisdictions. In October 2009, the Internal
Revenue Service commenced an examination of our federal income tax returns for
fiscal years 2005 through 2008. We do not expect a resolution to be
reached during the next twelve months. In addition, we are currently
under audit by various state and international tax authorities. We
cannot reasonably estimate that the outcome of these examinations will not have
a material effect on our financial position, results of operations or
liquidity. The statutes of limitation in state jurisdictions remain
open in general from tax years 2002 through 2008. The major foreign
jurisdictions remain open for examination in general for tax years 2003 through
2008.
Note
12: Net Income (Loss) per Share
The
following table sets forth the computation of basic and diluted net income
(loss) per share (in thousands, except per share amounts):
|
Fiscal
Years Ended
|
||||||||||||
|
|
January 3,
2010
|
December 28,
2008
|
December 30,
2007
|
|||||||||
|
Numerator
for basic net income (loss) per share:
|
||||||||||||
|
Net
income (loss)
|
$ | 415,310 | $ | (1,986,624 | ) | $ | 190,616 | |||||
|
Denominator
for basic net income (loss) per share:
|
||||||||||||
|
Weighted
average common shares outstanding
|
227,435 | 225,292 | 227,744 | |||||||||
|
Basic
net income (loss) per share
|
$ | 1.83 | $ | (8.82 | ) | $ | 0.84 | |||||
|
Numerator
for diluted net income (loss) per share:
|
||||||||||||
|
Net
income (loss)
|
$ | 415,310 | $ | (1,986,624 | ) | $ | 190,616 | |||||
|
Interest
on the 1% Convertible Notes due 2035, net of tax
|
468 | — | 469 | |||||||||
|
Net
income (loss) for diluted net income (loss) per share
|
$ | 415,778 | $ | (1,986,624 | ) | $ | 191,085 | |||||
|
Denominator
for diluted net income (loss) per share:
|
||||||||||||
|
Weighted
average common shares
|
227,435 | 225,292 | 227,744 | |||||||||
|
Incremental
common shares attributable to exercise of outstanding employee stock
options, restricted stock, RSUs, SARs and warrants (assuming proceeds
would be used to purchase common stock)
|
2,512 | — | 6,101 | |||||||||
|
Effect
of dilutive 1% Convertible Notes due 2035
|
2,012 | — | 2,012 | |||||||||
|
Shares
used in computing diluted net income (loss) per share
|
231,959 | 225,292 | 235,857 | |||||||||
|
Diluted
net income (loss) per share
|
$ | 1.79 | $ | (8.82 | ) | $ | 0.81 | |||||
|
Anti-dilutive
shares excluded from net income (loss) per share
calculation
|
47,911 | 54,844 | 40,133 | |||||||||
Basic
earnings per share exclude any dilutive effects of stock options, SARs, RSUs,
warrants and convertible securities. Fiscal years 2009 and 2007
diluted earnings per share include the dilutive effects of stock options, SARs,
RSUs, warrants and the 1% Convertible Notes due 2035. Certain common
stock issuable under stock options, SARs, warrants and the 1% Senior Convertible
Notes due 2013 have been omitted from the diluted net income (loss) per share
calculation because their inclusion is considered anti-dilutive.
Flash
Partners. The Company has a 49.9% ownership interest in Flash
Partners Ltd. (“Flash Partners”), a business venture with Toshiba which owns
50.1%, formed in fiscal year 2004. In the venture, the Company and
Toshiba have collaborated in the development and manufacture of NAND flash
memory products. These NAND flash memory products are manufactured by
Toshiba at the 300-millimeter wafer fabrication facility (“Fab 3”) located in
Yokkaichi, Japan, using the semiconductor manufacturing equipment owned or
leased by Flash Partners. Flash Partners purchases wafers from
Toshiba at cost and then resells those wafers to the Company and Toshiba at cost
plus a markup. The Company accounts for its 49.9% ownership position
in Flash Partners under the equity method of accounting. The Company
is committed to purchase its provided three-month forecast of Flash Partner’s
NAND wafer supply, which generally equals 50% of the venture’s
output. The Company is not able to estimate its total wafer purchase
commitment obligation beyond its rolling three-month purchase commitment because
the price is determined by reference to the future cost of producing the
semiconductor wafers. In addition, the Company is committed to fund
49.9% of Flash Partners’ costs to the extent that Flash Partners’ revenues from
wafer sales to the Company and Toshiba are insufficient to cover these
costs.
As of
January 3, 2010, the Company had notes receivable from Flash Partners of
52.1 billion Japanese yen, or approximately $562.9 million, based upon
the exchange rate at January 3, 2010. These notes are secured by
the equipment purchased by Flash Partners using the note
proceeds. The Company has additional guarantee obligations to Flash
Partners, see “Off-Balance Sheet Liabilities.” At January 3,
2010 and December 28, 2008, the Company had an equity investment in Flash
Partners of $199.1 million and $202.5 million, respectively,
denominated in Japanese yen, offset by $43.9 million and
$48.5 million, respectively, of cumulative translation adjustments recorded
in accumulated OCI. During fiscal year 2009, the Company recorded an
adjustment to its equity in earnings from Flash Partners related to the
difference between the basis in the Company’s equity investment compared to the
historical basis of the assets recorded by Flash Partners of $0.7
million.
Flash
Alliance. The Company has a 49.9% ownership interest in Flash
Alliance Ltd. (“Flash Alliance”), a business venture with Toshiba which owns
50.1%, formed in fiscal year 2006. In the venture, the Company and
Toshiba have collaborated in the development and manufacture of NAND flash
memory products. These NAND flash memory products are manufactured by
Toshiba at its 300 millimeter wafer fabrication facility (“Fab 4”) located in
Yokkaichi, Japan, using the semiconductor manufacturing equipment owned or
leased by Flash Alliance. Flash Alliance purchases wafers from
Toshiba at cost and then resells those wafers to the Company and Toshiba at cost
plus a markup. The Company accounts for its 49.9% ownership position
in Flash Alliance under the equity method of accounting. The Company
is committed to purchase its provided three-month forecast of Flash Alliance’s
NAND wafer supply, which generally equals 50% of the venture’s
output. The Company is not able to estimate its total wafer purchase
commitment obligation beyond its rolling three-month purchase commitment because
the price is determined by reference to the future cost of producing the
semiconductor wafers. In addition, the Company is committed to fund
49.9% of Flash Alliance’s costs to the extent that Flash Alliance’s revenues
from wafer sales to the Company and Toshiba are insufficient to cover these
costs.
As of
January 3, 2010, the Company had notes receivable from Flash Alliance of
48.1 billion Japanese yen, or approximately $520.2 million, based upon
the exchange rate at January 3, 2010. These notes are secured by
the equipment purchased by Flash Alliance using the note
proceeds. The Company has additional guarantee obligations to Flash
Alliance, see “Off-Balance Sheet Liabilities.” At January 3,
2010 and December 28, 2008, the Company had an equity investment in Flash
Alliance of $225.3 million and $215.9 million, respectively,
denominated in Japanese yen, offset by $45.3 million and
$49.7 million, respectively, of cumulative translation adjustments recorded
in accumulated OCI. During fiscal year 2009, the Company recorded an
adjustment to its equity in earnings from Flash Alliance related to the
difference between the basis in the Company’s equity investment compared to the
historical basis of the assets recorded by Flash Alliance of $13.9
million.
FlashVision. In
June 2008, the Company agreed to wind-down its 49.9% ownership interest in
FlashVision Ltd. (“FlashVision”), a business venture with Toshiba which owns
50.1%. In this venture, the Company and Toshiba collaborated in the
development and manufacture of 200-millimeter NAND flash memory
products. However, the Company and Toshiba have determined that
production of NAND flash memory products utilizing 200-millimeter wafers is no
longer cost effective relative to current and projected market prices for NAND
flash memory.
As part
of the ongoing wind-down of FlashVision, Toshiba agreed to purchase certain
assets of FlashVision and has retired the existing master lease agreement
between FlashVision and a consortium of financial institutions, thereby
releasing the Company from its contingent indemnification
obligation. Due to the wind-down qualifying as a reconsideration
event, the Company
re-evaluated whether FlashVision is a variable interest entity and concluded
that FlashVision is no longer a variable interest entity. At
January 3, 2010, the Company had no equity investment in FlashVision and at
December 28, 2008, the Company had an equity investment in FlashVision of
$64.0 million, denominated in Japanese yen, offset by $43.3 million of
cumulative translation adjustments recorded in accumulated OCI. In
fiscal year 2008, the Company received distributions of $102.5 million
relating to its investment in FlashVision.
Flash
Ventures. As a part of the Flash Ventures agreements, the
Company is required to fund direct and common research and development expenses
related to the development of advanced NAND flash memory
technologies. In the fourth quarter of fiscal year 2008, our
requirement to fund common research and development activities ended and final
funding was completed in the second quarter of fiscal year 2009. As
of January 3, 2010 and December 28, 2008, the Company had accrued liabilities
related to these expenses of zero and $4.0 million, respectively. We
continue to participate in other common research and development activities with
Toshiba but are not committed to any minimum funding level. In
addition, in fiscal year 2008, the Company recorded charges of $121 million
in cost of product revenues for adverse purchase commitments associated with
under-utilization of Flash Ventures capacity for the 90-day period subsequent to
December 28, 2008 related to the Company’s non-cancellable orders to Flash
Ventures.
The
Company has guarantee obligations to Flash Ventures, see “Off-Balance Sheet
Liabilities.”
Toshiba
Foundry. The Company has the ability to purchase additional
capacity under a foundry arrangement with Toshiba.
Business Ventures
and Foundry Arrangement with Toshiba. Purchase orders placed
under Flash Ventures and the foundry arrangement with Toshiba for up to three
months are binding and cannot be canceled. These outstanding purchase
commitments are included as part of the total “Noncancelable production purchase
commitments” in the “Contractual Obligations” table below.
Other Silicon
Sources. The Company’s contracts with its other sources of
silicon wafers generally require the Company to provide purchase order
commitments based on nine month rolling forecasts. The purchase
orders placed under these arrangements relating to the first three months of the
nine month forecast are generally binding and cannot be
canceled. These outstanding purchase commitments for other sources of
silicon wafers are included as part of the total “Noncancelable production
purchase commitments” in the “Contractual Obligations” table below.
Subcontractors. In
the normal course of business, the Company’s subcontractors periodically procure
production materials based on the forecast the Company provides to
them. The Company’s agreements with these subcontractors require that
the Company reimburse them for materials that are purchased on the Company’s
behalf in accordance with such forecast. Accordingly, the Company may
be committed to certain costs over and above its open noncancelable purchase
orders with these subcontractors. These commitments for production
materials to subcontractors are included as part of the total “Noncancelable
production purchase commitments” in the “Contractual Obligations” table
below.
Off-Balance
Sheet Liabilities
The
following table details the Company’s portion of the remaining guarantee
obligations under each of Flash Ventures’ master lease facilities in both
Japanese yen and the U.S. dollar equivalent based upon the exchange rate at
January 3, 2010.
|
Master
Lease Agreements by Execution Date
|
Lease
Amounts
|
Expiration
|
||||||||||
|
(Yen
in billions)
|
(Dollars
in thousands)
|
|||||||||||
|
Flash
Partners
|
||||||||||||
|
December 2004
|
¥ | 6.0 | $ | 64,757 | 2010 | |||||||
|
December 2005
|
3.6 | 39,630 | 2011 | |||||||||
|
June
2006
|
5.8 | 62,436 | 2011 | |||||||||
|
September 2006
|
20.2 | 218,878 | 2011 | |||||||||
|
March
2007
|
10.2 | 110,162 | 2012 | |||||||||
|
February
2008
|
4.0 | 42,830 | 2013 | |||||||||
| ¥ | 49.8 | $ | 538,693 | |||||||||
|
Flash
Alliance
|
||||||||||||
|
November
2007
|
¥ | 21.4 | $ | 232,035 | 2013 | |||||||
|
June
2008
|
27.7 | 299,035 | 2013 | |||||||||
| ¥ | 49.1 | $ | 531,070 | |||||||||
|
Total
guarantee obligations
|
¥ | 98.9 | $ | 1,069,763 | ||||||||
The
following table details the breakdown of the Company’s remaining guarantee
obligations between the principal amortization and the purchase option exercise
price at the term of the master lease agreements, in annual installments as of
January 3, 2010 in U.S. dollars based upon the exchange rate at
January 3, 2010.
|
Annual
Installments
|
Payment
of Principal Amortization
|
Purchase
Option Exercise Price at Final Lease Terms
|
Guarantee
Amount
|
|||||||||
|
(In thousands)
|
||||||||||||
|
Year
1
|
$ | 293,922 | $ | 46,776 | $ | 340,698 | ||||||
|
Year
2
|
212,372 | 163,936 | 376,308 | |||||||||
|
Year
3
|
109,227 | 85,582 | 194,809 | |||||||||
|
Year
4
|
32,348 | 125,600 | 157,948 | |||||||||
|
Total
guarantee obligations
|
$ | 647,869 | $ | 421,894 | $ | 1,069,763 | ||||||
Flash
Partners. Flash Partners sells and leases back from a
consortium of financial institutions (“lessors”) a portion of its tools and has
entered into six equipment master lease agreements totaling 300.0 billion
Japanese yen, or approximately $3.24 billion based upon the exchange rate
at January 3, 2010, of which 99.6 billion Japanese yen, or
approximately $1.08 billion based upon the exchange rate at January 3,
2010, was outstanding at January 3, 2010. The Company and
Toshiba have each guaranteed 50%, on a several basis, of Flash Partners’
obligations under the master lease agreements. In addition, these
master lease agreements are secured by the underlying equipment. As
of January 3, 2010, the amount of the Company’s guarantee obligation of the
Flash Partners master lease agreements, which reflects future payments and any
lease adjustments, was 49.8 billion Japanese yen, or approximately
$538.7 million based upon the exchange rate at January 3,
2010. Certain lease payments are due quarterly and certain lease
payments are due semi-annually, and are scheduled to be completed in stages
through fiscal year 2013. At each lease payment date, Flash Partners
has the option of purchasing the tools from the lessors. Flash
Partners is obligated to insure the equipment, maintain the equipment in
accordance with the manufacturers’ recommendations and comply with other
customary terms to protect the leased assets. The fair value of the
Company’s guarantee obligation of Flash Partners’ master lease agreements was
not material at inception of each master lease.
The
master lease agreements contain customary covenants for Japanese lease
facilities. In addition to containing customary events of default
related to Flash Partners that could result in an acceleration of Flash
Partners’ obligations, the master lease agreements contain an acceleration
clause for certain events of default related to the Company as guarantor,
including, among other things, the Company’s failure to maintain a minimum
shareholders’ equity of at least $1.51 billion, and its failure to maintain
a minimum corporate rating of BB- from Standard & Poors (“S&P”) or
Moody’s Corporation (“Moody’s”), or a minimum corporate rating of BB+ from
Rating & Investment Information, Inc. (“R&I”). As of
January 3, 2010, Flash Partners was in compliance with all of its master
lease covenants. While the Company’s S&P credit rating was B, two
levels below the required minimum corporate rating threshold from S&P, the
Company’s R&I credit rating was BBB-, one level above the required minimum
corporate rating threshold from R&I. If R&I were to downgrade
the Company’s credit rating below the minimum corporate rating threshold, Flash
Partners would become non-compliant under its master equipment lease agreements
and would be required to negotiate a resolution to the non-compliance to avoid
acceleration of the obligations under such agreements. Such
resolution could include, among other things, supplementary security to be
supplied by the Company, as guarantor, or increased interest rates or waiver
fees, should the lessors decide they need additional collateral or financial
consideration under the circumstances. If a resolution were
unsuccessful, the Company could be required to pay a portion or the entire
outstanding lease obligations covered by its guarantee under such Flash Partners
master lease agreements.
Flash
Alliance. Flash Alliance sells and leases back from a
consortium of financial institutions (“lessors”) a portion of its tools and has
entered into two equipment master lease agreements totaling 200.0 billion
Japanese yen, or approximately $2.16 billion based upon the exchange rate
at January 3, 2010, of which 98.2 billion Japanese yen, or
approximately $1.06 billion based upon the exchange rate at January 3,
2010, was outstanding as of January 3, 2010. The Company and
Toshiba have each guaranteed 50%, on a several basis, of Flash Alliance’s
obligation under the master lease agreements. In addition, these
master lease agreements are secured by the underlying equipment. As
of January 3, 2010, the amount of the Company’s guarantee obligation of the
Flash Alliance master lease agreements was 49.1 billion Japanese yen, or
approximately $531.1 million based upon the exchange rate at
January 3, 2010. Remaining master lease payments are due
semi-annually and are scheduled to be completed in fiscal year
2013. At each lease payment date, Flash Alliance has the option of
purchasing the tools from the lessors. Flash Alliance is obligated to
insure the equipment, maintain the equipment in accordance with the
manufacturers’ recommendations and comply with other customary terms to protect
the leased assets. The fair value of the Company’s guarantee
obligation of Flash Alliance’s master lease agreements was not material at
inception of each master lease.
The
master lease agreements contain customary covenants for Japanese lease
facilities. In addition to containing customary events of default
related to Flash Alliance that could result in an acceleration of Flash
Alliance’s obligations, the master lease agreements contain an acceleration
clause for certain events of default related to the Company as guarantor,
including, among other things, the Company’s failure to maintain a minimum
shareholders’ equity of at least $1.51 billion, and its failure to maintain
a minimum corporate rating of BB- from S&P or Moody’s or a minimum corporate
rating of BB+ from R&I. As of January 3, 2010, Flash
Alliance was in compliance with all of its master lease
covenants. While the Company’s S&P credit rating was B, two
levels below the required minimum corporate rating threshold from S&P, the
Company’s R&I credit rating was BBB-, one level above the required minimum
corporate rating threshold from R&I. If R&I were to downgrade
the Company’s credit rating below the minimum corporate rating threshold, Flash
Alliance would become non-compliant under its master equipment lease agreements
and would be required to negotiate a resolution to the non-compliance to avoid
acceleration of the obligations under such agreements. Such
resolution could include, among other things, supplementary security to be
supplied by the Company, as guarantor, or increased interest rates or waiver
fees, should the lessors decide they need additional collateral or financial
consideration under the circumstances. If a resolution were
unsuccessful, the Company could be required to pay a portion or the entire
outstanding lease obligations covered by its guarantee under such Flash Alliance
master lease agreements.
FlashVision. FlashVision
had an equipment lease arrangement of approximately 15.0 billion Japanese
yen, or approximately $143 million based upon the exchange rate at May 30,
2008, of which 6.2 billion Japanese yen, or approximately $59 million
based upon the exchange rate at May 30, 2008, was retired by Toshiba on May 30,
2008 thereby releasing the Company of its indemnification agreement with
Toshiba.
Guarantees
Indemnification
Agreements. The Company has agreed to indemnify suppliers and
customers for alleged patent infringement. The scope of such
indemnity varies, but may, in some instances, include indemnification for
damages and expenses, including attorneys’ fees. The Company may
periodically engage in litigation as a result of these indemnification
obligations. The Company’s insurance policies exclude coverage for
third-party claims for patent infringement. Although the liability is
not remote, the nature of the patent infringement indemnification obligations
prevents the Company from making a reasonable estimate of the maximum potential
amount it could be required to pay to its suppliers and
customers. Historically, the Company has not made any significant
indemnification payments under any such agreements. As of
January 3, 2010 and December 28, 2008, no amount had been accrued in
the accompanying Consolidated Financial Statements with respect to these
indemnification guarantees.
As
permitted under Delaware law and the Company’s certificate of incorporation and
bylaws, the Company has agreements, or has assumed agreements in connection with
its acquisitions, whereby it indemnifies certain of its officers, employees, and
each of its directors for certain events or occurrences while the officer,
employee or director is, or was, serving at the Company’s or the acquired
company’s request in such capacity. The term of the indemnification
period is for the officer’s, employee’s or director’s lifetime. The
maximum potential amount of future payments the Company could be required to
make under these indemnification agreements is generally unlimited; however, the
Company has a Director and Officer insurance policy that may reduce its exposure
and enable it to recover all or a portion of any future amounts
paid. As a result of its insurance policy coverage, the Company
believes the estimated fair value of these indemnification agreements is
minimal. The Company has no liabilities recorded for these agreements
as of January 3, 2010 or December 28, 2008, as these liabilities are
not reasonably estimable even though liabilities under these agreements are not
remote.
The
Company and Toshiba have agreed to mutually contribute to, and indemnify each
other and Flash Ventures for environmental remediation costs or liability
resulting from Flash Ventures’ manufacturing operations in certain
circumstances. The Company and Toshiba have also entered into a
Patent Indemnification Agreement under which in many cases the Company will
share in the expenses associated with the defense and cost of settlement
associated with such claims. This agreement provides limited
protection for the Company against third party claims that NAND flash memory
products manufactured and sold by Flash Ventures infringes third party
patents. The Company has not made any indemnification payments under
any such agreements and as of January 3, 2010 and December 28, 2008,
no amounts have been accrued in the accompanying Consolidated Financial
Statements with respect to these indemnification guarantees.
Contractual
Obligations and Off-Balance Sheet Arrangements
The
following tables summarize the Company’s contractual cash obligations,
commitments and off-balance sheet arrangements at January 3, 2010, and the
effect such obligations are expected to have on its liquidity and cash flows in
future periods (in thousands).
Contractual
Obligations.
|
Total
|
1
Year or Less
(Fiscal
2010)
|
2
- 3 Years
(Fiscal
2011
and
2012)
|
4
–5 Years
(Fiscal
2013
and
2014)
|
More
than 5 Years (Beyond
Fiscal
2014)
|
||||||||||||||||
|
Operating
leases
|
$ | 26,922 | $ | 9,003 | $ | 11,207 | $ | 3,904 | $ | 2,808 | ||||||||||
|
Flash
Partners reimbursement for certain fixed costs including
depreciation
|
1,152,558 | (3) | 445,529 | 528,120 | 131,098 | 47,811 | ||||||||||||||
|
Flash
Alliance reimbursement for certain fixed costs including
depreciation
|
1,494,083 | (3) | 494,334 | 698,512 | 240,603 | 60,634 | ||||||||||||||
|
Toshiba
research and development
|
18,878 | (3) | 18,878 |
─
|
─
|
─
|
||||||||||||||
|
Capital
equipment purchase commitments
|
4,084 | 4,084 |
─
|
─
|
─
|
|||||||||||||||
|
Convertible
notes principal and interest (1)
|
1,263,913 | 86,658 | 23,000 | 1,154,255 |
─
|
|||||||||||||||
|
Operating
expense commitments
|
23,287 | 23,272 | 15 |
─
|
─
|
|||||||||||||||
|
Noncancelable
production purchase commitments (2)
|
214,201 | (3) | 214,201 |
─
|
─
|
─
|
||||||||||||||
|
Total
contractual cash obligations
|
$ | 4,197,926 | $ | 1,295,959 | $ | 1,260,854 | $ | 1,529,860 | $ | 111,253 | ||||||||||
Off-Balance
Sheet Arrangements.
|
As
of
January 3,
2010
|
||||
|
Guarantee
of Flash Partners equipment leases (4)
|
$ | 538,693 | ||
|
Guarantee
of Flash Alliance equipment leases (4)
|
531,070 | |||
_________________
|
(1)
|
In
May 2006, the Company issued and sold $1.15 billion in aggregate
principal amount of 1% Senior Convertible Notes due May 15,
2013. The Company will pay cash interest at an annual rate of
1%, payable semi-annually on May 15 and November 15 of each year until
calendar year 2013. In November 2006, through its acquisition
of msystems, the Company assumed msystems’ $75 million in aggregate
principal amount of 1% Convertible Notes due March 15,
2035. The Company will pay cash interest at an annual rate of
1%, payable semi-annually on March 15 and September 15 of each year until
calendar year 2035.
|
|
(2)
|
Includes
Toshiba foundries, Flash Ventures, related party vendors and other silicon
source vendor purchase commitments.
|
|
(3)
|
Includes
amounts denominated in Japanese yen, which are subject to fluctuation in
exchange rates prior to payment and have been translated using the
exchange rate at January 3,
2010.
|
|
(4)
|
The
Company’s guarantee obligation, net of cumulative lease payments, is
98.9 billion Japanese yen, or approximately $1.07 billion based
upon the exchange rate at January 3,
2010.
|
The
Company has excluded $208.1 million of unrecognized tax benefits from the
contractual obligation table above due to the uncertainty with respect to the
timing of associated future cash flows at January 3, 2010. The
Company is unable to make reasonable reliable estimates of the period of cash
settlement with the respective taxing authorities.
The
Company leases many of its office facilities and operating equipment for various
terms under long-term, noncancelable operating lease agreements. The
leases expire at various dates from fiscal year 2010 through fiscal year
2016. Future minimum lease payments at January 3, 2010 are
presented below (in thousands):
|
Fiscal Year:
|
||||
|
2010
|
$ | 9,561 | ||
|
2011
|
7,079 | |||
|
2012
|
5,081 | |||
|
2013
|
3,310 | |||
|
2014
|
2,360 | |||
|
2015
and thereafter
|
2,808 | |||
| 30,199 | ||||
|
Sublease
income to be received in the future under noncancelable
subleases
|
(3,277 | ) | ||
|
Net
operating leases
|
$ | 26,922 | ||
Rent
expense for the years ended January 3, 2010, December 28, 2008 and
December 30, 2007 was $7.9 million, $8.2 million and
$7.7 million, respectively.
Toshiba. The
Company and Toshiba have collaborated in the development and manufacture of NAND
flash memory products. These NAND flash memory products are
manufactured by Toshiba at Toshiba’s Yokkaichi, Japan operations using the
semiconductor manufacturing equipment owned or leased by FlashVision, Flash
Partners and Flash Alliance. See also Note 13, “Commitments,
Contingencies and Guarantees.” The Company purchased NAND flash memory
wafers from FlashVision, Flash Partners, Flash Alliance and Toshiba, made
payments for shared research and development expenses, made loans to
FlashVision, Flash Partners and Flash Alliance and made investments in
FlashVision, Flash Partners and Flash Alliance totaling approximately
$2.11 billion, $2.04 billion and $1.29 billion in the years ended
January 3, 2010, December 28, 2008 and December 30, 2007,
respectively.
The
purchases of NAND flash memory wafers are ultimately reflected as a component of
the Company’s cost of product revenues. During the fiscal years ended
January 3, 2010, December 28, 2008 and December 30, 2007,
the Company had revenue from Toshiba of $74.2 million, $39.7 million
and $26.7 million, respectively. At January 3, 2010 and
December 28, 2008, the Company had no accounts payable balances due to
Toshiba, and accounts receivable balances from Toshiba of zero and
$2.2 million, respectively. At January 3, 2010 and
December 28, 2008, the Company had accrued current liabilities due to
Toshiba for shared research and development expenses of zero and
$4.0 million, respectively.
Flash Ventures
with Toshiba. The Company owns 49.9% of each of the flash
ventures with Toshiba (FlashVision, Flash Partners and Flash Alliance) and
accounts for its ownership position under the equity method of
accounting. The Company’s obligations with respect to Flash Partners
and Flash Alliance master lease agreements, take-or-pay supply arrangements and
research and development cost sharing are described in Note 13, “Commitments,
Contingencies and Guarantees.” Flash Partners and Flash Alliance are
variable interest entities; however the Company is not the primary beneficiary
of either Flash Partners or Flash Alliance because it absorbs less than a
majority of the expected gains and losses of each entity. At
January 3, 2010 and December 28, 2008, the Company had accounts
payable balances due to FlashVision, Flash Partners and Flash Alliance of
$182.1 million and $370.4 million, respectively. For
activity related to the wind-down of FlashVision, see Note 13, “Commitments,
Contingencies and Guarantees.”
The
Company’s maximum reasonably estimable loss exposure (excluding lost profits),
based upon the exchange rate at each respective balance sheet date, as a result
of its involvement with the flash ventures with Toshiba is presented below
(in thousands).
|
January 3,
2010
|
December 28,
2008
|
|||||||
|
Notes
receivable
|
$ | 1,083,172 | $ | 1,119,898 | ||||
|
Equity
investments
|
424,378 | 482,393 | ||||||
|
Operating
lease guarantees
|
1,069,763 | 2,094,977 | ||||||
|
Maximum
loss exposure
|
$ | 2,577,313 | $ | 3,697,268 | ||||
At
January 3, 2010 and December 28, 2008, the Company’s accumulated
deficit included approximately $2.8 million and $5.1 million,
respectively, of undistributed earnings of the flash ventures with
Toshiba.
The
following summarizes the aggregated financial information for FlashVision, Flash
Partners and Flash Alliance as of January 3, 2010 and December 28,
2008 (in thousands).
|
January 3,
2010
|
December 28,
2008
|
|||||||
|
(Unaudited)
|
||||||||
|
Current
assets
|
$ | 794,230 | $ | 1,103,911 | ||||
|
Property,
plant and equipment and other assets
|
3,016,667 | 4,159,457 | ||||||
|
Total
assets
|
$ | 3,810,897 | $ | 5,263,368 | ||||
|
Current
liabilities
|
$ | 661,349 | $ | 1,931,300 | ||||
|
Long-term
liabilities
|
2,166,342 | 2,240,800 | ||||||
The
following summarizes the aggregated financial information for FlashVision, Flash
Partners and Flash Alliance for the fiscal years ended January 3, 2010,
December 28, 2008 and December 30, 2007, respectively (in
thousands). FlashVision’s, Flash Partners’ and Flash Alliance’s
year-ends are March 31, with quarters ending on March 31,
June 30, September 30 and December 31.
|
Twelve
Months Ended
|
||||||||||||
|
|
January 3,
2010
|
December 28,
2008
|
December 30,
2007
|
|||||||||
|
(Unaudited)
|
||||||||||||
|
Net
sales(1)
|
$ | 3,296,364 | $ | 3,945,321 | $ | 2,435,114 | ||||||
|
Gross
profit
|
14,202 | 21,263 | 13,587 | |||||||||
|
Net
income
|
68,455 | 7,222 | 927 | |||||||||
(1) Net sales
represent sales to both the Company and Toshiba.
Solid State
Storage Solutions LLC. During the second quarter of fiscal
year 2007, the Company formed a venture with third parties that will license
intellectual property, S4. S4 qualifies as a variable interest
entity. The Company is considered the primary beneficiary of S4 and
the Company consolidates S4 in its Consolidated Financial
Statements. S4 was financed with $10.2 million of initial
aggregate capital contributions from the partners. In addition,
through January 3, 2010, the Company had loaned $1.7 million to S4
under a revolving line of credit which expires in May 2012. In
July 2007, S4 invested $10.0 million for the acquisition of
intellectual property of which $3.2 million, $3.2 million and
$1.8 million was amortized in fiscal years 2009, 2008 and 2007,
respectively. S4 has an obligation of up to an additional
$32.5 million related to the acquisition of intellectual property should
the venture be profitable.
Tower
Semiconductor. As of December 28, 2008, Tower
Semiconductor Ltd. (“Tower”), one of the Company’s suppliers of wafers for its
controller components, ceased being a related party as the Company’s ownership
was less than 10% of Tower’s outstanding shares. The Company
purchased controller wafers and related non-recurring engineering of
approximately $25.9 million and $65.8 million in the fiscal years
ended December 28, 2008 and December 30, 2007,
respectively. The purchases of controller wafers are ultimately
reflected as a component of the Company’s cost of product
revenues. In fiscal year 2008, the Company recognized impairment
charges of $18.9 million as a result of the other-than-temporary decline in
its investment in Tower ordinary shares which reduced the investment value to
$2.1 million as of December 28, 2008. At December 28,
2008, the Company also had a net receivable from Tower of $0.4 million and
an outstanding loan of $3.0 million to Tower for expansion of Tower’s 0.13
micron logic wafer capacity. The loan to Tower is secured by the
equipment purchased.
Flextronics. On
January 10, 2008, Michael Marks, who serves on the Company’s Board of
Directors, resigned from Flextronics International, Ltd., (“Flextronics”), where
he had held the position of chairman of the Board of Directors. The
activity from December 31, 2007 to January 10, 2008 between
Flextronics and the Company was immaterial. For the fiscal year ended
December 30, 2007, the Company recorded revenues from Flextronics and its
affiliates of $75.5 million. In addition, the Company purchased
from Flextronics and its affiliates $72.6 million of services for card
assembly and testing in the fiscal year ended December 30, 2007, which is
ultimately reflected as a component of the Company’s cost of product
revenues.
Note
15: Stockholders’ Rights Plan
On
September 15, 2003, the Company amended its existing stockholder rights
plan to terminate the rights issued under that rights plan, and the Company
adopted a new rights plan. Under the new rights plan, rights were
distributed as a dividend at the rate of one right for each share of common
stock of the Company held by stockholders of record as of the close of business
on September 25, 2003. In November 2006, the Company
extended the term of the rights plan, such that the rights will expire on
April 28, 2017 unless redeemed or exchanged. Under the new
rights agreement and after giving effect to the Company’s stock dividend
effected on February 18, 2004, each right will, under the circumstances
described below, entitle the registered holder to buy one two-hundredths of a
share of Series A Junior Participating Preferred Stock for
$225.00. The rights will become exercisable only if a person or group
acquires beneficial ownership of 15% or more of the Company’s common stock or
commences a tender offer or exchange offer upon consummation of which such
person or group would beneficially own 15% or more of the Company’s common
stock.
Note
16: Litigation
The flash
memory industry is characterized by significant litigation seeking to enforce
patent and other intellectual property rights. The Company's patent
and other intellectual property rights are primarily responsible for generating
license and royalty revenue. The Company seeks to protect its
intellectual property through patents, copyrights, trademarks, trade secrets,
confidentiality agreements and other methods, and has been and likely will
continue to enforce such rights as appropriate through litigation and related
proceedings. The Company expects that its competitors and others who
hold intellectual property rights related to its industry will pursue similar
strategies. From time-to-time, it has been and may continue to be
necessary to initiate or defend litigation against third
parties. These and other parties could bring suit against the
Company. In each case listed below where the Company is the
defendant, the Company intends to vigorously defend the action. At
this time, the Company does not believe it is reasonably possible that losses
related to the litigation described below have occurred beyond the amounts, if
any, that have been accrued.
msystems
Shareholder Derivative Claim in Israel. On September 11, 2006,
Mr. Rabbi, a shareholder of msystems Ltd. (“msystems”), a company subsequently
acquired by the Company in or about November 2006, filed a derivative action in
Israel and a motion to permit him to file the derivative action against msystems
and four directors of msystems arguing that options were allegedly allocated to
officers and employees of msystems in violation of applicable
law. Mr. Rabbi claimed that the aforementioned actions allegedly
caused damage to msystems. On January 25, 2007, SanDisk IL Ltd.
(“SDIL”), successor in interest to msystems, filed a motion to dismiss the
motion to seek leave to file the derivative action and the derivative action on
the grounds, inter alia, that Mr. Rabbi ceased to be a shareholder of msystems
after the merger between msystems and the Company. On March 12, 2008,
the court granted SDIL’s motion and dismissed the motion to seek leave to file
the derivative action and consequently, the derivative action itself was
dismissed. On May 15, 2008, Mr. Rabbi filed an appeal with the
Supreme Court of Israel. The parties submitted their written summations and the
oral hearing in the Supreme Court is set for March 10, 2010.
ITC Proceeding
Initiated by SanDisk. On October 24, 2007, the Company filed a
complaint under Section 337 of the Tariff Act of 1930 (as amended) (Inv. No.
337-TA-619) titled, “In the matter of flash memory controllers, drives, memory
cards, and media players and products containing same” with the U.S.
International Trade Commission (“ITC”) (hereinafter, “the 619 Investigation”),
naming the following companies as respondents: Phison Electronics
Corp. (“Phison”); Silicon Motion Technology Corp., Silicon Motion, Inc.
(Taiwan), Silicon Motion, Inc. (California), and Silicon Motion International,
Inc. (collectively, “Silicon Motion”); USBest Technology, Inc. dba Afa
Technologies, Inc. (“USBest”); Skymedi Corp. (“Skymedi”); Chipsbrand
Microelectronics (HK) Co., Ltd., Chipsbank Technology (Shenzhen) Co., Ltd., and
Chipsbank Microelectronics Co., Ltd., (collectively, “Chipsbank”); Zotek
Electronic Co., Ltd., dba Zodata Technology Ltd. (collectively, “Zotek”);
Infotech Logistic LLC (“Infotech”); Power Quotient International Co., Ltd., and
PQI Corp. (collectively, “PQI”); Power Quotient International (HK) Co., Ltd.;
Syscom Development Co. Ltd.; PNY Technologies, Inc. (“PNY”); Kingston Technology
Co., Inc., Kingston Technology Corp., Payton Technology Corp., and MemoSun, Inc.
(collectively, “Kingston”); Buffalo, Inc., Melco Holdings, Inc., and Buffalo
Technology (USA), Inc. (collectively, “Buffalo”); Verbatim Corp. (“Verbatim”);
Transcend Information Inc. (Taiwan), Transcend Information Inc. (California),
and Transcend Information Maryland, Inc., (collectively, “Transcend”); Imation
Corp., Imation Enterprises Corp., and Memorex Products, Inc. (collectively,
“Imation”); Add-On Computer Peripherals, Inc. and Add-On Computer Peripherals,
LLC (collectively, “Add-On Computer Peripherals”); Add-On Technology Co.; A-Data
Technology Co., Ltd., and A-Data Technology (USA) Co., Ltd., (collectively,
“A-DATA”); Apacer Technology Inc. and Apacer Memory America, Inc. (collectively,
“Apacer”); Acer, Inc. (“Acer”); Behavior Tech Computer Corp. and Behavior Tech
Computer (USA) Corp. (collectively, “Behavior”); Emprex Technologies
Corp.(“Emprex”); Corsair Memory, Inc. (“Corsair”); Dane-Elec Memory S.A., and
Dane-Elec Corp. USA, (collectively, “Dane-Elec”); Deantusaiocht Dane-Elec TEO;
EDGE Tech Corp. (“EDGE”); Interactive Media Corp, (“Interactive”); Kaser Corp.
(“Kaser”); LG Electronics, Inc., and LG Electronics U.S.A., Inc., (collectively,
“LG”); TSR Silicon Resources Inc. (“TSR”); and Welldone Co.
(“Welldone”). In the complaint, the Company asserted that
respondents’ accused flash memory controllers, drives, memory cards, and media
players infringed the following: U.S. Patent No. 5,719,808 (the “’808 patent”);
U.S. Patent No. 6,763,424 (the “’424 patent”); U.S. Patent No. 6,426,893 (the
“’893 patent”); U.S. Patent No. 6,947,332 (the “’332 patent”); and U.S. Patent
No. 7,137,011 (the “’011 patent”). The Company sought an order
excluding the accused products from entry into the United States as well as a
permanent cease and desist order against the respondents. Since
filing its complaint, the Company terminated the investigation as to the’808
patent, the ’893 patent, and the ’332 patent. After filing its
complaint, the Company reached settlement agreements with Add-On Computer
Peripherals, EDGE, Infotech, Interactive, Kaser, PNY, TSR, Verbatim, Chipsbank,
USBest and Welldone. The investigation was terminated as to these
respondents in light of these settlement agreements. Three of the
remaining respondents – Buffalo, Corsair, and A-Data – were terminated from the
investigation after entering consent orders. The investigation was
also terminated as to Add-On Tech. Co., Behavior, Emprex, and Zotek after these
respondents were found in default. The investigation was also
terminated as to Acer, Payton, Silicon Motion Tech. Corp., and Silicon Motion,
Int’l Inc. The Company also terminated PQI from the investigation as
to the ’011 patent. On July 15, 2008, the ALJ issued a Markman ruling
regarding the ’011 patent, the ’893 patent, the ’332 patent, and the ’424
patent. Beginning October 27, 2008, the ALJ held an evidentiary
hearing. On February 9, 2009, the ALJ extended the target date for
conclusion of the investigation to August 10, 2009. On April 10,
2009, the ALJ issued an Initial Determination, finding that (1) the Respondents
did not infringe either the ’424 patent or the ’011 patent, (2) claim 8 of the
’011 patent was obvious and, thus, invalid over the prior art, and (3) the
Company had a domestic industry in both the ’424 patent and the ’011
patent. The ALJ also denied the Respondents’ patent misuse and patent
exhaustion defenses. On April 14, 2009, the ITC granted the Company’s
request for an extension to file a petition for review. On May 4,
2009, the Company and Respondents filed their respective petitions for review,
which were granted in part pursuant to the ITC’s August 24, 2009 Notice of
Review. In that notice, the ITC advised that it would review the
ALJ’s non-infringement and validity findings with respect to the ’424 patent,
but that it would not review any of the ALJ’s findings concerning the ’011
patent. Accordingly, the ALJ’s findings regarding the ’011 patent
became final as of August 24, 2009. In October 2009, the Commission
issued its Final Determination with respect to the ’424, in which it reversed
certain claim construction findings that were adverse to SanDisk, but affirmed
the ALJ’s overall finding of no violation of Section 337 of the Tariff Act of
1930. The Company has determined not to appeal the Commission’s Final
Determination as it relates to either the ’011 patent or the ’424
patent. These ITC proceedings are now concluded.
Patent
Infringment Litigation Initiated by SanDisk. On October 24,
2007, the Company filed a complaint for patent infringement in the United States
District Court for the Western District of Wisconsin against the following
defendants: Phison, Silicon Motion, Synergistic Sales, Inc. (“Synergistic”),
USBest, Skymedi, Chipsbank, Infotech, Zotek, PQI, PNY, Kingston, Buffalo,
Verbatim, Transcend, Imation, Add-On Computer Peripherals, A-DATA, Apacer,
Behavior, Corsair, Dane-Elec, EDGE, Interactive, LG, TSR and
Welldone. In this action, Case No. 07-C-0607-C (“the ’607 Action”),
the Company asserts that the defendants infringe the ’808 patent, the ’424
patent, the ’893 patent, the ’332 patent and the ’011 patent. That
same day, the Company filed a second complaint for patent infringement in the
same court against the following defendants: Phison, Silicon Motion,
Synergistic, USBest, Skymedi, Zotek, Infotech, PQI, PNY, Kingston, Buffalo,
Verbatim, Transcend, Imation, A-DATA, Apacer, Behavior, and
Dane-Elec. In this action, Case No. 07-C-0605-C (“the ’605 Action”),
the Company asserts that the defendants infringe U.S. Patent No. 6,149,316 (the
“’316 patent”) and U.S. Patent No. 6,757,842 (the “’842 patent”). The
Company seeks damages and injunctive relief in both actions. In light
of settlement agreements, the Company dismissed its claims against Phison,
Silicon Motion, Skymedi, Verbatim, Corsair, Add-On Computer Peripherals, EDGE,
Infotech, Interactive, PNY, TSR and Welldone. The Company’s claims
against Chipsbank, Acer, Behavior, Dane-Elec, LG, PQI, and Synergistic have been
dismissed without prejudice. The Court consolidated the ’605 and ’607
Actions and stayed these actions during the pendency of the 619 Investigation
(described above). On November 13, 2009, the Court lifted the stay
except as to the ’424 patent. On December 14, 2009, the Court advised
the parties that the Court would try the consolidated actions in February 2011
with summary judgment motions due six months before trial. On
December 30, 2009, the Company filed an opposition to USBest’s motion to dismiss
for lack of personal jurisdiction. Several of the remaining
defendants have answered the Company’s complaints by denying infringement and
raising several affirmative defenses and related counterclaims. These
defenses and related counterclaims include, among others, lack of personal
jurisdiction, improper venue, lack of standing, non-infringement, invalidity,
unenforceability, express license, implied license, patent exhaustion, waiver,
laches, and estoppel.
Federal Civil
Antitrust Class Actions. Between August 31, 2007 and December
14, 2007, the Company (along with a number of other manufacturers of flash
memory products) was sued in the Northern District of California, in eight
purported class action complaints. On February 7, 2008, all of the
civil complaints were consolidated into two complaints, one on behalf of direct
purchasers and one on behalf of indirect purchasers, in the Northern District of
California in a purported class action captioned In re Flash Memory Antitrust
Litigation, Civil Case No. C07-0086. Plaintiffs allege the Company
and a number of other manufacturers of flash memory and flash memory products
conspired to fix, raise, maintain, and stabilize the price of NAND flash memory
in violation of state and federal laws. The lawsuits purport to be on
behalf of purchasers of flash memory from January 1, 1999 through the
present. The lawsuits seek an injunction, damages, restitution, fees,
costs, and disgorgement of profits. On May 20, 2009, the Court denied
defendants' motion to dismiss the consolidated direct purchaser complaint and
denied (with limited exceptions for certain state law claims) defendants' motion
to dismiss the consolidated indirect purchaser complaint. Class
certification discovery and briefing was completed in September 2009, and the
plaintiffs’ respective class certification motions have been taken under
submission.
Spansion
Bankruptcy. Spansion, LLC (“Spansion”) and SanDisk IL Ltd.
f/k/a M-Systems Flash Disk Pioneers Ltd. (“SanDisk IL”) are parties to the SSP
Driver Software License Agreement (the “SSP License”) and the ORNAND Driver
Software License Agreement (the “ORNAND License” and, collectively with the New
Collaboration Agreement, the “Agreements”). As set forth in the
Agreements, Spansion was required to make quarterly royalty and support fee
payments for use of SanDisk IL’s patented technology. On March 1,
2009, Spansion filed for protection under chapter 11 of the United States
Bankruptcy Code in the United States Bankruptcy Court for the District of
Delaware (the “Bankruptcy Court”). On May 22, 2009, SanDisk IL filed
a proof of claim asserting a prepetition unsecured claim against Spansion in the
amount of $11,338,260. Subsequently, the parties entered into
Amendment to the New Collaboration Agreement (the “Amendment”) dated as of
January 31, 2010, pursuant to which Spansion (a) assumed the SSP License and New
Collaboration Agreement, (b) rejected the ORNAND License, (c) agreed to pay
SanDisk IL $1,157,065 in order to cure arrearages under the Agreements, and (d)
agreed the allowance of a general unsecured, prepetition claim of $6,166,123 in
connection with the rejection of the ORNAND License (the “Proposed Prepetition
Claim”), comprised of $1,166,123 for prepetition arrearages and $5,000,000 for
rejection damages. The Amendment will not be effective unless and
until approved by the Bankruptcy Court.
Patent
Declaratory Judgment Litigation Initiated by SanDisk. On June
19, 2009, the Company filed a complaint against LSI Corporation (“LSI”) in the
Northern District of California seeking a declaration of non-infringement,
declaration of invalidity and/or unenforceability as to eight LSI patents
relating to digital audio and video technology, and seeking remedies under
various California State laws for misrepresentations made by LSI to the
Company’s customers. The suit, Case No. C09 02737, was filed in
response to threats made by LSI against the Company and certain customers of the
Company. LSI has counterclaimed for infringement of the eight LSI
patents in suit and has accused most of SanDisk’s digital audio and video
players of infringement. On September 18, 2009, the Court granted
LSI’s motion to dismiss SanDisk’s state law claims. The Court has set a date for
the claim construction hearing for March 11, 2010 and a trial date of November
2, 2010.
As part
of the acquisition of msystems Ltd. (hereinafter referred to as “SanDisk IL
Ltd.,” “SDIL,” or “Other Guarantor Subsidiary”) in November 2006, the Company
entered into a supplemental indenture whereby the Company became an additional
obligor and guarantor of the assumed $75 million 1% Convertible Notes due
2035 issued by M-Systems Finance, Inc. (the “Subsidiary Issuer” or “mfinco”) and
guaranteed by SDIL. The Company’s (the “Parent Company”) guarantee is
full and unconditional, and joint and several with SDIL. Both SDIL
and mfinco are wholly-owned subsidiaries of the Company. The
following Condensed Consolidating Financial Statements present separate
information for mfinco as the subsidiary issuer, the Company and SDIL as
guarantors, and the Company’s other combined non-guarantor subsidiaries, and
should be read in conjunction with the Consolidated Financial Statements of the
Company.
These
Condensed Consolidating Financial Statements have been prepared using the equity
method of accounting. Earnings of subsidiaries are reflected in the
Company’s investment in subsidiaries account. The elimination entries
eliminate investments in subsidiaries, related stockholders’ equity and other
intercompany balances and transactions.
|
Condensed
Consolidating Statements of Operations
For
the fiscal year ended January 3, 2010
|
||||||||||||||||||||||||
|
Parent
Company
(1)
|
Subsidiary
Issuer (1)
|
Other
Guarantor Subsidiary (1)
|
Combined
Non-Guarantor Subsidiaries (2)
|
Consolidating
Adjustments
|
Total
Company
|
|||||||||||||||||||
|
(In thousands)
|
||||||||||||||||||||||||
|
Total
revenues
|
$ | 2,026,666 | $ | — | $ | 85,583 | $ | 4,923,009 | $ | (3,468,452 | ) | $ | 3,566,806 | |||||||||||
|
Total
cost of revenues
|
988,270 | — | 9,430 | 4,598,128 | (3,313,648 | ) | 2,282,180 | |||||||||||||||||
|
Gross
profit (loss)
|
1,038,396 | — | 76,153 | 324,881 | (154,804 | ) | 1,284,626 | |||||||||||||||||
|
Total
operating expenses
|
570,147 | — | 71,349 | 280,525 | (156,785 | ) | 765,236 | |||||||||||||||||
|
Operating
income
|
468,249 | — | 4,804 | 44,356 | 1,981 | 519,390 | ||||||||||||||||||
|
Total
other income (expense)
|
2,685 | 10 | (1,779 | ) | 33,948 | (50,453 | ) | (15,589 | ) | |||||||||||||||
|
Income
(loss) before provision for income taxes
|
470,934 | 10 | 3,025 | 78,304 | (48,472 | ) | 503,801 | |||||||||||||||||
|
Provision
for income taxes
|
74,492 | — | 4,156 | 9,843 | — | 88,491 | ||||||||||||||||||
|
Equity
in net income (loss) of consolidated subsidiaries
|
16,244 | — | (8,641 | ) | (11,230 | ) | 3,627 | — | ||||||||||||||||
|
Net
income (loss)
|
$ | 412,686 | $ | 10 | $ | (9,772 | ) | $ | 57,231 | $ | (44,845 | ) | $ | 415,310 | ||||||||||
|
(1)
|
This
represents legal entity results which exclude any subsidiaries required to
be consolidated under GAAP.
|
|
(2)
|
This
represents all other legal
subsidiaries.
|
|
Condensed
Consolidating Statements of Operations
For
the fiscal year ended December 28, 2008
|
||||||||||||||||||||||||
|
Parent
Company
(1)
|
Subsidiary
Issuer (1)
|
Other
Guarantor Subsidiary (1)
|
Combined
Non-Guarantor Subsidiaries (2)
|
Consolidating
Adjustments
|
Total
Company
|
|||||||||||||||||||
|
(In thousands)
|
||||||||||||||||||||||||
|
Total
revenues
|
$ | 1,825,252 | $ | — | $ | 222,089 | $ | 5,125,483 | $ | (3,821,472 | ) | $ | 3,351,352 | |||||||||||
|
Total
cost of revenues
|
1,841,644 | — | 132,897 | 4,918,089 | (3,604,365 | ) | 3,288,265 | |||||||||||||||||
|
Gross
profit (loss)
|
(16,392 | ) | — | 89,192 | 207,394 | (217,107 | ) | 63,087 | ||||||||||||||||
|
Total
operating expenses
|
710,534 | — | 133,642 | 390,523 | 801,868 | 2,036,567 | ||||||||||||||||||
|
Operating
loss
|
(726,926 | ) | — | (44,450 | ) | (183,129 | ) | (1,018,975 | ) | (1,973,480 | ) | |||||||||||||
|
Total
other income (expense)
|
(29,769 | ) | (1 | ) | 8,510 | 47,970 | (5,604 | ) | 21,106 | |||||||||||||||
|
Loss
before provision for income taxes
|
(756,695 | ) | (1 | ) | (35,940 | ) | (135,159 | ) | (1,024,579 | ) | (1,952,374 | ) | ||||||||||||
|
Provision
for income taxes
|
12,372 | — | 7,169 | 14,709 | — | 34,250 | ||||||||||||||||||
|
Equity
in net income (loss) of consolidated subsidiaries
|
(157,340 | ) | — | 18,407 | 40,189 | 98,744 | — | |||||||||||||||||
|
Net
loss
|
$ | (926,407 | ) | $ | (1 | ) | $ | (24,702 | ) | $ | (109,679 | ) | $ | (925,835 | ) | $ | (1,986,624 | ) | ||||||
|
Condensed
Consolidating Statements of Operations
For
the fiscal year ended December 30, 2007
|
||||||||||||||||||||||||
|
Parent
Company
(1)
|
Subsidiary
Issuer (1)
|
Other
Guarantor Subsidiary (1)
|
Combined
Non-Guarantor Subsidiaries (2)
|
Consolidating
Adjustments
|
Total
Company
|
|||||||||||||||||||
|
(In thousands)
|
||||||||||||||||||||||||
|
Total
revenues
|
$ | 2,193,435 | $ | — | $ | 311,441 | $ | 4,993,166 | $ | (3,601,676 | ) | $ | 3,896,366 | |||||||||||
|
Total
cost of revenues
|
1,253,220 | — | 299,885 | 4,601,636 | (3,461,094 | ) | 2,693,647 | |||||||||||||||||
|
Gross
profit (loss)
|
940,215 | — | 11,556 | 391,530 | (140,582 | ) | 1,202,719 | |||||||||||||||||
|
Total
operating expenses
|
513,827 | — | 147,678 | 401,464 | (136,764 | ) | 926,205 | |||||||||||||||||
|
Operating
income (loss)
|
426,388 | — | (136,122 | ) | (9,934 | ) | (3,818 | ) | 276,514 | |||||||||||||||
|
Total
other income (expense)
|
60,733 | 1 | 23,324 | (12,215 | ) | 4,301 | 76,144 | |||||||||||||||||
|
Income
(loss) before provision for income taxes
|
487,121 | 1 | (112,798 | ) | (22,149 | ) | 483 | 352,658 | ||||||||||||||||
|
Provision
for income taxes
|
145,405 | — | 7,539 | 3,895 | (8 | ) | 156,831 | |||||||||||||||||
|
Equity
in net income (loss) of consolidated subsidiaries
|
9,005 | — | (2,816 | ) | 3,836 | (10,025 | ) | — | ||||||||||||||||
|
Net
income (loss)
|
350,721 | 1 | (123,153 | ) | (22,208 | ) | (9,534 | ) | 195,827 | |||||||||||||||
|
Less:
Income attributable to non-controlling interests
|
— | — | 5,211 | — | — | 5,211 | ||||||||||||||||||
|
Net
income (loss) attributable to common stockholders
|
$ | 350,721 | $ | 1 | $ | (128,364 | ) | $ | (22,208 | ) | $ | (9,534 | ) | $ | 190,616 | |||||||||
|
(1)
|
This
represents legal entity results which exclude any subsidiaries required to
be consolidated under GAAP.
|
|
(2)
|
This
represents all other legal
subsidiaries.
|
|
Condensed
Consolidating Balance Sheets
As
of January 3, 2010
|
||||||||||||||||||||||||
|
Parent
Company (1)
|
Subsidiary
Issuer (1)
|
Other
Guarantor Subsidiary (1)
|
Combined
Non-Guarantor Subsidiaries (2)
|
Consolidating
Adjustments
|
Total
Company
|
|||||||||||||||||||
|
(In thousands)
|
||||||||||||||||||||||||
|
ASSETS
|
||||||||||||||||||||||||
|
Current
assets:
|
||||||||||||||||||||||||
|
Cash
and cash equivalents
|
$ | 509,705 | $ | 56 | $ | 19,298 | $ | 571,306 | $ | (1 | ) | $ | 1,100,364 | |||||||||||
|
Short-term
marketable securities
|
788,222 | — | 30,780 | — | — | 819,002 | ||||||||||||||||||
|
Accounts
receivable, net
|
75,965 | — | 1,533 | 156,909 | — | 234,407 | ||||||||||||||||||
|
Inventory
|
55,406 | — | 1 | 542,249 | (1,163 | ) | 596,493 | |||||||||||||||||
|
Other
current assets
|
1,279,069 | — | 268,416 | 969,585 | (2,352,562 | ) | 164,508 | |||||||||||||||||
|
Total
current assets
|
2,708,367 | 56 | 320,028 | 2,240,049 | (2,353,726 | ) | 2,914,774 | |||||||||||||||||
|
Property
and equipment, net
|
142,125 | — | 28,978 | 129,893 | 1 | 300,997 | ||||||||||||||||||
|
Other
non-current assets
|
1,825,962 | 73,711 | 36,098 | 2,813,189 | (1,963,012 | ) | 2,785,948 | |||||||||||||||||
|
Total
assets
|
$ | 4,676,454 | $ | 73,767 | $ | 385,104 | $ | 5,183,131 | $ | (4,316,737 | ) | $ | 6,001,719 | |||||||||||
|
LIABILITIES
|
||||||||||||||||||||||||
|
Current
liabilities:
|
||||||||||||||||||||||||
|
Accounts
payable
|
$ | 43,667 | $ | — | $ | 3,474 | $ | 269,391 | $ | (14 | ) | $ | 316,518 | |||||||||||
|
Convertible
short-term debt
|
— | 75,000 | — | — | — | 75,000 | ||||||||||||||||||
|
Other
current accrued liabilities
|
552,907 | — | 15,811 | 2,337,781 | (2,426,907 | ) | 479,592 | |||||||||||||||||
|
Total
current liabilities
|
596,574 | 75,000 | 19,285 | 2,607,172 | (2,426,921 | ) | 871,110 | |||||||||||||||||
|
Convertible
long-term debt
|
934,722 | — | — | — | — | 934,722 | ||||||||||||||||||
|
Non-current
liabilities
|
241,226 | — | 16,334 | 39,958 | (10,040 | ) | 287,478 | |||||||||||||||||
|
Total
liabilities
|
1,772,522 | 75,000 | 35,619 | 2,647,130 | (2,436,961 | ) | 2,093,310 | |||||||||||||||||
|
EQUITY
|
||||||||||||||||||||||||
|
Stockholders'
equity
|
2,905,974 | (1,233 | ) | 351,374 | 2,536,001 | (1,881,818 | ) | 3,910,298 | ||||||||||||||||
|
Non-controlling
interest
|
(2,042 | ) | — | (1,889 | ) | — | 2,042 | (1,889 | ) | |||||||||||||||
|
Total
equity
|
2,903,932 | (1,233 | ) | 349,485 | 2,536,001 | (1,879,776 | ) | 3,908,409 | ||||||||||||||||
|
Total
liabilities and equity
|
$ | 4,676,454 | $ | 73,767 | $ | 385,104 | $ | 5,183,131 | $ | (4,316,737 | ) | $ | 6,001,719 | |||||||||||
|
(1)
|
This
represents legal entity results which exclude any subsidiaries required to
be consolidated under GAAP.
|
|
(2)
|
This
represents all other legal
subsidiaries.
|
|
Condensed
Consolidating Balance Sheets
As
of December 28, 2008
|
||||||||||||||||||||||||
|
Parent
Company (1)
|
Subsidiary
Issuer (1)
|
Other
Guarantor Subsidiary (1)
|
Combined
Non-Guarantor Subsidiaries (2)
|
Consolidating
Adjustments
|
Total
Company
|
|||||||||||||||||||
|
(In thousands)
|
||||||||||||||||||||||||
|
ASSETS
|
||||||||||||||||||||||||
|
Current
assets:
|
||||||||||||||||||||||||
|
Cash
and cash equivalents
|
$ | 376,052 | $ | 66 | $ | 51,806 | $ | 534,137 | $ | — | $ | 962,061 | ||||||||||||
|
Short-term
marketable securities
|
443,632 | — | 33,664 | — | — | 477,296 | ||||||||||||||||||
|
Accounts
receivable, net
|
76,733 | — | 1,862 | 43,497 | — | 122,092 | ||||||||||||||||||
|
Inventory
|
87,612 | — | 1,573 | 511,740 | (2,674 | ) | 598,251 | |||||||||||||||||
|
Other
current assets
|
1,165,716 | — | 209,861 | 1,424,708 | (2,246,301 | ) | 553,984 | |||||||||||||||||
|
Total
current assets
|
2,149,745 | 66 | 298,766 | 2,514,082 | (2,248,975 | ) | 2,713,684 | |||||||||||||||||
|
Property
and equipment, net
|
205,022 | — | 33,478 | 158,487 | — | 396,987 | ||||||||||||||||||
|
Other
non-current assets
|
2,778,895 | 73,710 | 69,797 | 1,564,731 | (1,665,664 | ) | 2,821,469 | |||||||||||||||||
|
Total
assets
|
$ | 5,133,662 | $ | 73,776 | $ | 402,041 | $ | 4,237,300 | $ | (3,914,639 | ) | $ | 5,932,140 | |||||||||||
|
LIABILITIES
|
||||||||||||||||||||||||
|
Current
liabilities:
|
||||||||||||||||||||||||
|
Accounts
payable
|
$ | 81,014 | $ | — | $ | 3,379 | $ | 526,809 | $ | (211 | ) | $ | 610,991 | |||||||||||
|
Other
current accrued liabilities
|
1,105,212 | 2,166 | 21,567 | 1,841,278 | (2,318,205 | ) | 652,018 | |||||||||||||||||
|
Total
current liabilities
|
1,186,226 | 2,166 | 24,946 | 2,368,087 | (2,318,416 | ) | 1,263,009 | |||||||||||||||||
|
Convertible
long-term debt
|
879,094 | 75,000 | — | — | — | 954,094 | ||||||||||||||||||
|
Non-current
liabilities
|
188,825 | — | 17,963 | 75,964 | (8,436 | ) | 274,316 | |||||||||||||||||
|
Total
liabilities
|
2,254,145 | 77,166 | 42,909 | 2,444,051 | (2,326,852 | ) | 2,491,419 | |||||||||||||||||
|
EQUITY
|
||||||||||||||||||||||||
|
Stockholders’
equity
|
2,879,517 | (3,390 | ) | 358,981 | 1,793,249 | (1,587,787 | ) | 3,440,570 | ||||||||||||||||
|
Non-controlling
interest
|
— | — | 151 | — | — | 151 | ||||||||||||||||||
|
Total
equity
|
2,879,517 | (3,390 | ) | 359,132 | 1,793,249 | (1,587,787 | ) | 3,440,721 | ||||||||||||||||
|
Total
liabilities and equity
|
$ | 5,133,662 | $ | 73,776 | $ | 402,041 | $ | 4,237,300 | $ | (3,914,639 | ) | $ | 5,932,140 | |||||||||||
|
(1)
|
This
represents legal entity results which exclude any subsidiaries required to
be consolidated under GAAP.
|
|
(2)
|
This
represents all other legal
subsidiaries.
|
|
Condensed
Consolidating Statements of Cash Flows
For
the fiscal year ended January 3, 2010
|
||||||||||||||||||||||||
|
Parent Company(1)
|
Subsidiary Issuer(1)
|
Other
Guarantor Subsidiary(1)
|
Combined
Non-Guarantor Subsidiaries (2)
|
Consolidating
Adjustments
|
Total
Company
|
|||||||||||||||||||
|
(In
thousands)
|
||||||||||||||||||||||||
|
Net
cash provided by (used in) operating activities
|
$ | 483,706 | $ | (10 | ) | $ | (36,920 | ) | $ | 41,079 | $ | (1 | ) | $ | 487,854 | |||||||||
|
Net
cash provided by (used in) investing activities
|
(375,327 | ) | — | 4,412 | (3,910 | ) | — | (374,825 | ) | |||||||||||||||
|
Net
cash provided by financing activities
|
20,878 | — | — | — | — | 20,878 | ||||||||||||||||||
|
Effect
of changes in foreign currency exchange rates on cash
|
4,396 | — | — | — | — | 4,396 | ||||||||||||||||||
|
Net
increase (decrease) in cash and cash equivalents
|
133,653 | (10 | ) | (32,508 | ) | 37,169 | (1 | ) | 138,303 | |||||||||||||||
|
Cash
and cash equivalents at beginning of period
|
376,052 | 66 | 51,806 | 534,137 | — | 962,061 | ||||||||||||||||||
|
Cash
and cash equivalents at end of period
|
$ | 509,705 | $ | 56 | $ | 19,298 | $ | 571,306 | $ | (1 | ) | $ | 1,100,364 | |||||||||||
|
Condensed
Consolidating Statements of Cash Flows
For
the fiscal year ended December 28, 2008
|
||||||||||||||||||||||||
|
Parent Company(1)
|
Subsidiary Issuer(1)
|
Other
Guarantor Subsidiary(1)
|
Combined
Non-Guarantor Subsidiaries (2)
|
Consolidating
Adjustments
|
Total
Company
|
|||||||||||||||||||
|
(In
thousands)
|
||||||||||||||||||||||||
|
Net
cash provided by (used in) operating activities
|
$ | (459,599 | ) | $ | (149 | ) | $ | 37,217 | $ | 510,255 | $ | — | $ | 87,724 | ||||||||||
|
Net
cash provided by (used in) investing activities
|
424,352 | — | (75,134 | ) | (319,891 | ) | — | 29,327 | ||||||||||||||||
|
Net
cash provided by (used in) financing activities
|
21,639 | — | (916 | ) | (9,785 | ) | — | 10,938 | ||||||||||||||||
|
Effect
of changes in foreign currency exchange rates on cash
|
323 | — | — | — | — | 323 | ||||||||||||||||||
|
Net
increase (decrease) in cash and cash equivalents
|
(13,285 | ) | (149 | ) | (38,833 | ) | 180,579 | — | 128,312 | |||||||||||||||
|
Cash
and cash equivalents at beginning of period
|
389,337 | 215 | 90,639 | 353,558 | — | 833,749 | ||||||||||||||||||
|
Cash
and cash equivalents at end of period
|
$ | 376,052 | $ | 66 | $ | 51,806 | $ | 534,137 | $ | — | $ | 962,061 | ||||||||||||
_______________
|
(1)
|
This
represents legal entity results which exclude any subsidiaries required to
be consolidated under GAAP.
|
|
(2)
|
This
represents all other legal
subsidiaries.
|
|
Condensed
Consolidating Statements of Cash Flows
For
the fiscal year ended December 30, 2007
|
||||||||||||||||||||||||
|
Parent Company(1)
|
Subsidiary Issuer(1)
|
Other
Guarantor Subsidiary(1)
|
Combined
Non-Guarantor Subsidiaries (2)
|
Consolidating
Adjustments
|
Total
Company
|
|||||||||||||||||||
|
(In
thousands)
|
||||||||||||||||||||||||
|
Net
cash provided by (used in) operating activities
|
$ | 389,524 | $ | 167 | $ | 2,351 | $ | 264,074 | $ | (3,049 | ) | $ | 653,067 | |||||||||||
|
Net
cash provided by (used in) investing activities
|
(983,835 | ) | — | 26,087 | (260,610 | ) | — | (1,218,358 | ) | |||||||||||||||
|
Net
cash provided by (used in) financing activities
|
(180,921 | ) | — | (10,020 | ) | 9,803 | — | (181,138 | ) | |||||||||||||||
|
Effect
of changes in foreign currency exchange rates on cash
|
(904 | ) | — | 382 | — | — | (522 | ) | ||||||||||||||||
|
Net
increase (decrease) in cash and cash equivalents
|
(776,136 | ) | 167 | 18,800 | 13,267 | (3,049 | ) | (746,951 | ) | |||||||||||||||
|
Cash
and cash equivalents at beginning of period
|
1,165,473 | 48 | 71,839 | 340,291 | 3,049 | 1,580,700 | ||||||||||||||||||
|
Cash
and cash equivalents at end of period
|
$ | 389,337 | $ | 215 | $ | 90,639 | $ | 353,558 | $ | — | $ | 833,749 | ||||||||||||
_______________
|
(1)
|
This
represents legal entity results which exclude any subsidiaries required to
be consolidated under GAAP.
|
|
(2)
|
This
represents all other legal
subsidiaries.
|
|
Fiscal
Quarters Ended
|
||||||||||||||||
|
March 29,
2009
|
June
28,
2009
|
September 27,
2009
|
January 3,
2010 (3)
|
|||||||||||||
|
(In
thousands, except per share data)
|
||||||||||||||||
|
2009
|
||||||||||||||||
|
Revenues
|
||||||||||||||||
|
Product
|
$ | 588,099 | $ | 610,432 | $ | 813,811 | $ | 1,141,972 | ||||||||
|
License
and royalty
|
71,372 | 120,141 | 121,360 | 99,619 | ||||||||||||
|
Total
revenues
|
659,471 | 730,573 | 935,171 | 1,241,591 | ||||||||||||
|
Gross
profit (loss)(1)
|
(1,139 | ) | 248,997 | 436,270 | 600,498 | |||||||||||
|
Operating
income (loss)(1)
|
(165,335 | ) | 68,442 | 239,953 | 376,330 | |||||||||||
|
Net
income (loss)
|
$ | (207,995 | ) | $ | 52,507 | $ | 231,293 | $ | 339,505 | |||||||
|
Net
income (loss) per share
|
||||||||||||||||
|
Basic(2)
|
$ | (0.92 | ) | $ | 0.23 | $ | 1.02 | $ | 1.49 | |||||||
|
Diluted(2)
|
$ | (0.92 | ) | $ | 0.23 | $ | 0.99 | $ | 1.45 | |||||||
|
Fiscal
Quarters Ended
|
||||||||||||||||
|
March 30,
2008
|
June
29,
2008
|
September 28,
2008
|
December 28,
2008
|
|||||||||||||
|
(In
thousands, except per share data)
|
||||||||||||||||
|
2008
|
||||||||||||||||
|
Revenues
|
||||||||||||||||
|
Product
|
$ | 724,051 | $ | 687,508 | $ | 689,556 | $ | 742,128 | ||||||||
|
License
and royalty
|
125,916 | 128,503 | 131,941 | 121,749 | ||||||||||||
|
Total
revenues
|
849,967 | 816,011 | 821,497 | 863,877 | ||||||||||||
|
Gross
profit (loss)(1)
|
258,781 | 150,871 | (5,917 | ) | (340,648 | ) | ||||||||||
|
Operating
income (loss)(1)
|
4,912 | (101,232 | ) | (250,193 | ) | (1,626,967 | ) | |||||||||
|
Net
income (loss)
|
$ | 10,960 | $ | (73,754 | ) | $ | (165,899 | ) | $ | (1,757,931 | ) | |||||
|
Net
income (loss) per share
|
||||||||||||||||
|
Basic(2)
|
$ | 0.05 | $ | (0.33 | ) | $ | (0.74 | ) | $ | (7.78 | ) | |||||
|
Diluted(2)
|
$ | 0.05 | $ | (0.33 | ) | $ | (0.74 | ) | $ | (7.78 | ) | |||||
_________________
|
(1)
|
Includes
the following charges related to share-based compensation, amortization of
acquisition-related intangible assets, impairment of goodwill, impairment
of acquisition-related intangible assets, impairment of equity investment
of FlashVision, Flash Partners and Flash Alliance, and amortization of
bond discount. The fourth quarter and fiscal year 2009 include
a one-time cumulative adjustment of $16.2 million to increase
share-based compensation due to the way in which the Company’s third-party
software application incorrectly accounted for estimated forfeitures in
share-based compensation calculations. This cumulative
adjustment relates to the nine months ended September 27, 2009 and the
three years ended December 28, 2008, and is not material for any
prior period or the current period.
|
|
Fiscal
Quarters Ended
|
||||||||||||||||
|
March 29,
2009
|
June
28,
2009
|
September 27,
2009
|
January 3,
2010
|
|||||||||||||
|
(In
thousands)
|
||||||||||||||||
|
Share-based
compensation
|
$ | 16,330 | $ | 22,354 | $ | 19,372 | $ | 37,504 | ||||||||
|
Amortization
of acquisition-related intangible assets
|
3,424 | 3,424 | 3,424 | 3,424 | ||||||||||||
|
Amortization
of bond discount
|
13,220 | 13,452 | 13,704 | 15,252 | ||||||||||||
|
Total
|
$ | 32,974 | $ | 39,230 | $ | 36,500 | $ | 56,180 | ||||||||
|
Fiscal
Quarters Ended
|
||||||||||||||||
|
March 30,
2008
|
June
29,
2008
|
September 28,
2008
|
December 28,
2008
|
|||||||||||||
|
(In
thousands)
|
||||||||||||||||
|
Share-based
compensation
|
$ | 23,226 | $ | 25,108 | $ | 25,551 | $ | 23,914 | ||||||||
|
Impairment
of goodwill
|
— | — | — | 845,453 | ||||||||||||
|
Impairment
of acquisition-related intangible assets
|
— | — | — | 175,785 | ||||||||||||
|
Amortization
of acquisition-related intangible assets
|
19,057 | 19,135 | 19,348 | 14,041 | ||||||||||||
|
Impairment
of equity investment of FlashVision, Flash Partners and Flash
Alliance
|
— | — | — | 93,400 | ||||||||||||
|
Restructuring
and other
|
— | 4,085 | — | 31,382 | ||||||||||||
|
Amortization
of bond discount
|
12,291 | 12,512 | 12,745 | 12,966 | ||||||||||||
|
Total
|
$ | 54,574 | $ | 60,840 | $ | 57,644 | $ | 1,196,941 | ||||||||
_________________
|
(2)
|
Quarterly
earnings per share figures may not total to yearly earnings per share, due
to rounding and fluctuations in the number of options included or omitted
from diluted calculations based on the stock price or option strike
prices.
|
|
(3)
|
The
fourth quarter of fiscal year 2009 consisted of 14 weeks. All
other quarters presented are 13
weeks.
|
SIGNATURES
Pursuant
to the requirements of Section 13 or 15(d) of the Securities Exchange Act of
1934, the Registrant has duly caused this Report to be signed on its behalf by
the undersigned, thereunto duly authorized.
|
SANDISK
CORPORATION
|
|
|
By:
|
/s/
Judy Bruner
|
|
Judy
Bruner
|
|
|
Executive
Vice President, Administration and
|
|
|
Chief
Financial Officer
|
|
|
(On
behalf of the Registrant and as Principal Financial and Accounting
Officer)
|
Dated:
February 25, 2010
POWER
OF ATTORNEY
KNOW ALL
PEOPLE BY THESE PRESENTS, that each person whose signature appears below
constitutes and appoints each of Eli Harari and Judy Bruner, jointly and
severally, his or her attorneys in fact, each with the power of substitution,
for him or her in any and all capacities, to sign any amendments to this Report
on Form 10-K, and to file the same, with exhibits thereto and other documents in
connection therewith, with the Securities and Exchange Commission, hereby
ratifying and confirming all that each of said attorneys in fact, or his or her
substitute or substitutes, may do or cause to be done by virtue
thereof.
Pursuant
to the requirements of the Securities Exchange Act of 1934, as amended, this
Report has been signed below by the following persons on behalf of the
Registrant and in the capacities and on the dates indicated.
|
Signature
|
Title
|
Date
|
|
|
By:
|
/s/ Eli
Harari
|
Chairman
of the Board and Chief Executive Officer
|
February 25, 2010
|
|
(Dr.
Eli Harari)
|
(Principal Executive Officer) | ||
|
By:
|
/s/ Judy
Bruner
|
Executive
Vice President, Administration and Chief Financial Officer
|
February 25, 2010
|
|
(Judy
Bruner)
|
(Principal Financial and Accounting Officer) | ||
|
By:
|
/s/ Irwin
Federman
|
Vice
Chairman of the Board and
|
February 24, 2010
|
|
(Irwin
Federman)
|
Lead Independent Director | ||
|
By:
|
/s/ Kevin
DeNuccio
|
Director
|
February 21, 2010
|
|
(Kevin
DeNuccio)
|
|||
|
By:
|
/s/ Steven J.
Gomo
|
Director
|
February 24, 2010
|
|
(Steven
J. Gomo)
|
|||
|
By:
|
/s/ Eddy W.
Hartenstein
|
Director
|
February 23, 2010
|
|
(Eddy
W. Hartenstein)
|
|||
|
By:
|
/s/ Chenming
Hu
|
Director
|
February 24, 2010
|
|
(Dr.
Chenming Hu)
|
|||
|
By:
|
/s/ Catherine P.
Lego
|
Director
|
February 24, 2010
|
|
(Catherine
P. Lego)
|
|||
|
By:
|
/s/ Michael E.
Marks
|
Director
|
February 22 2010
|
|
(Michael
E. Marks)
|
|||
|
By:
|
/s/ James D.
Meindl
|
Director
|
February 22, 2010
|
|
(James
D. Meindl)
|
|||
INDEX
TO EXHIBITS
|
Exhibit
Number
|
Exhibit Title |
|
3.1
|
Restated
Certificate of Incorporation of the Registrant.(2)
|
|
3.2
|
Certificate
of Amendment of the Restated Certificate of Incorporation of the
Registrant dated December 9, 1999.(3)
|
|
3.3
|
Certificate
of Amendment of the Restated Certificate of Incorporation of the
Registrant dated May 11, 2000.(4)
|
|
3.4
|
Certificate
of Amendment to the Amended Restated Certificate of Incorporation of the
Registrant dated May 26, 2006.(5)
|
|
3.5
|
Amended
and Restated Bylaws of SanDisk Corporation dated August 4,
2009.(6)
|
|
3.6
|
Certificate
of Designations for the Series A Junior Participating Preferred Stock, as
filed with the Delaware Secretary of State on April 24,
1997.(7)
|
|
3.7
|
Amendment
to Certificate of Designations for the Series A Junior Participating
Preferred Stock, as filed with the Delaware Secretary of State on
September 24, 2003.(8)
|
|
3.8
|
Certificate
of Amendment to the Amended and Restated Certificate of Incorporation of
the Registrant dated May 27, 2009.(9)
|
|
4.1
|
Reference
is made to Exhibits 3.1, 3.2, 3.3, 3.4 and 3.8. (2), (3), (4), (5),
(9)
|
|
4.2
|
Rights
Agreement, dated as of September 15, 2003, between the Registrant and
Computershare Trust Company, Inc.(8)
|
|
4.3
|
Amendment
No. 1 to Rights Agreement by and between the Registrant and Computershare
Trust Company, Inc., dated as of November 6, 2006.(10)
|
|
4.4
|
SanDisk
Corporation Form of Indenture (including notes).(11)
|
|
4.5
|
Indenture
(including form of Notes) with respect to the Registrant’s 1.00%
Convertible Senior Notes due 2013 dated as of May 15, 2006 by and between
the Registrant and The Bank of New York.(12)
|
|
10.1
|
Form
of Indemnification Agreement entered into between the Registrant and its
directors and officers.(2)
|
|
10.2
|
License
Agreement between the Registrant and Dr. Eli Harari, dated September 6,
1988.(2)
|
|
10.3
|
SanDisk
Corporation 1995 Stock Option Plan, as Amended and Restated January 2,
2002.(13), (*)
|
|
10.4
|
SanDisk
Corporation 1995 Non-Employee Directors Stock Option Plan, as Amended and
Restated as of January 2, 2004.(14), (*)
|
|
10.5
|
Registration
Rights Agreement, dated as of January 18, 2001, by and between the
Registrant, The Israel Corporation, Alliance Semiconductor Ltd., Macronix
International Co., Ltd. and Quick Logic
Corporation.(15)
|
|
10.6
|
Consolidated
Shareholders Agreement, dated as of January 18, 2001, by and among the
Registrant, The Israel Corporation, Alliance Semiconductor Ltd. and
Macronix International Co., Ltd.(15)
|
|
10.7
|
Agreement,
dated as of September 28, 2006, by and among the Registrant, Bank Leumi Le
Israel B.M., a banking corporation organized under the laws of the State
of Israel, The Israel Corporation Ltd., Alliance Semiconductor Corporation
and Macronix International Co. Ltd.(16)
|
|
10.8
|
Agreement,
dated as of September 28, 2006, by and among the Registrant, Bank Hapoalim
B.M., a banking corporation organized under the laws of the State of
Israel, The Israel Corporation Ltd., Alliance Semiconductor Corporation
and Macronix International Co. Ltd.(16)
|
|
10.9
|
Amendment
No. 3 to Payment Schedule of Series A-5 Additional Purchase Obligations,
Waiver of Series A-5 Conditions, Conversion of Series A-4 Wafer Credits
and Other Provisions, dated as of November 11, 2003, by and between the
Registrant, Tower Semiconductor Ltd. and the other parties
thereto.(17)
|
|
10.10
|
New
Master Agreement, dated as of April 10, 2002, by and between the
Registrant and Toshiba Corporation.(18), (1)
|
|
10.11
|
Amendment
to New Master Agreement, dated and effective as of August 13, 2002 by and
between the Registrant and Toshiba Corporation.(19),
(1)
|
|
10.12
|
New
Operating Agreement, dated as of April 10, 2002, by and between the
Registrant and Toshiba Corporation.(18), (1)
|
|
10.13
|
Indemnification
and Reimbursement Agreement, dated as of April 10, 2002, by and between
the Registrant and Toshiba Corporation.(18), (1)
|
|
10.14
|
Amendment
to Indemnification and Reimbursement Agreement, dated as of May 29, 2002
by and between the Registrant and Toshiba
Corporation.(18)
|
|
10.15
|
Amendment
No. 2 to Indemnification and Reimbursement Agreement, dated as of May 29,
2002 by and between the Registrant and Toshiba
Corporation.(20)
|
|
10.16
|
Form
of Amended and Restated Change of Control Benefits Agreement entered into
by and between the Registrant and its named executive officers.(21),
(*)
|
|
10.17
|
Form
of Option Agreement Amendment.(21), (*)
|
|
10.18
|
Flash
Partners Master Agreement, dated as of September 10, 2004, by and among
the Registrant and the other parties thereto.(22), (1)
|
|
10.19
|
Flash
Alliance Master Agreement, dated as of July 7, 2006, by and among the
Registrant, Toshiba Corporation and SanDisk (Ireland) Limited.(23),
(+)
|
|
10.20
|
Operating
Agreement of Flash Partners Ltd., dated as of September 10, 2004, by and
between SanDisk International Limited and Toshiba Corporation.(22),
(1)
|
|
10.21
|
Operating
Agreement of Flash Alliance, Ltd., dated as of July 7, 2006, by and
between Toshiba Corporation and SanDisk (Ireland) Limited.(23),
(+)
|
|
10.22
|
Mutual
Contribution and Environmental Indemnification Agreement, dated as of
September 10, 2004, by and among the Registrant and the other parties
thereto.(22), (1)
|
|
10.23
|
Flash
Alliance Mutual Contribution and Environmental Indemnification Agreement,
dated as of July 7, 2006, by and between Toshiba Corporation and SanDisk
(Ireland) Limited.(23), (+)
|
|
10.24
|
Patent
Indemnification Agreement, dated as of September 10, 2004 by and among the
Registrant and the other parties thereto.(22), (1)
|
|
10.25
|
Patent
Indemnification Agreement, dated as of July 7, 2006, by and among the
Registrant and the other parties thereto.(23), (+)
|
|
10.26
|
Master
Lease Agreement, dated as of December 24, 2004, by and among Mitsui
Leasing & Development, Ltd., IBJ Leasing Co., Ltd., and Sumisho Lease
Co., Ltd. and Flash Partners Ltd.(24), (1)
|
|
10.27
|
Master
Lease Agreement, dated as of September 22, 2006, by and among Flash
Partners Limited Company, SMBC Leasing Company, Limited, Toshiba Finance
Corporation, Sumisho Lease Co., Ltd., Fuyo General Lease Co., Ltd., Tokyo
Leasing Co., Ltd., STB Leasing Co., Ltd. and IBJ Leasing Co., Ltd.(23),
(+)
|
|
10.28
|
Guarantee
Agreement, dated as of December 24, 2004, by and between the Registrant
and Mitsui Leasing & Development, Ltd.(24)
|
|
10.29
|
Guarantee
Agreement, dated as of September 22, 2006, by and among the Registrant,
SMBC Leasing Company, Limited and Toshiba Finance
Corporation.(23)
|
|
10.30
|
Amended
and Restated SanDisk Corporation 2005 Incentive Plan.(25),
(*)
|
|
10.31
|
SanDisk
Corporation Form of Notice of Grant of Stock Option.(26),
(*)
|
|
10.32
|
SanDisk
Corporation Form of Notice of Grant of Non-Employee Director Automatic
Stock Option (Initial Grant).(26), (*)
|
|
10.33
|
SanDisk
Corporation Form of Notice of Grant of Non-Employee Director Automatic
Stock Option (Annual Grant).(26), (*)
|
|
10.34
|
SanDisk
Corporation Form of Stock Option Agreement.(26), (*)
|
|
10.35
|
SanDisk
Corporation Form of Automatic Stock Option Agreement.(26),
(*)
|
|
10.36
|
SanDisk
Corporation Form of Restricted Stock Unit Issuance Agreement.(27),
(*)
|
|
10.37
|
SanDisk
Corporation Form of Restricted Stock Unit Issuance Agreement (Director
Grant).(26), (*)
|
|
10.38
|
SanDisk
Corporation Form of Restricted Stock Award Agreement.(26),
(*)
|
|
10.39
|
SanDisk
Corporation Form of Restricted Stock Award Agreement (Director
Grant).(26), (*)
|
|
10.40
|
SanDisk
Corporation Form of Performance Stock Unit Issuance Agreement.(28),
(*)
|
|
10.41
|
Guarantee
Agreement between the Registrant, IBJ Leasing Co., Ltd., Sumisho Lease
Co., Ltd., and Toshiba Finance Corporation.(29)
|
|
10.42
|
Guarantee
Agreement, dated as of June 20, 2006, by and between the Registrant, IBJ
Leasing Co., Ltd., Sumisho Lease Co., Ltd. and Toshiba Finance
Corporation.(20)
|
|
10.43
|
Basic
Lease Contract between Flash Partners Yugen Kaisha, IBJ Leasing Co., Ltd.,
Sumisho Lease Co., Ltd., and Toshiba Finance Corporation.(29),
(+)
|
|
10.44
|
Basic
Lease Contract, dated as of June 20, 2006, by and between Flash Partners
Yugen Kaisha, IBJ Leasing Co., Ltd., Sumisho Lease Co., Ltd. and Toshiba
Finance Corporation.(20), (+)
|
|
10.45
|
Sublease
(Building 3), dated as of December 21, 2005 by and between Maxtor
Corporation and the Registrant.(20)
|
|
10.46
|
Sublease
(Building 4), dated as of December 21, 2005 by and between Maxtor
Corporation and the Registrant.(20)
|
|
10.47
|
Sublease
(Building 5), dated as of December 21, 2005 by and between Maxtor
Corporation and the Registrant.(30)
|
|
10.48
|
Sublease
(Building 6), dated as of December 21, 2005 by and between Maxtor
Corporation and the Registrant.(20)
|
|
10.49
|
Confidential
Separation Agreement and General Release of Claims.(27)
|
|
10.50
|
3D
Collaboration Agreement.(31), (1)
|
|
10.51
|
Joint
Venture Restructure Agreement, dated as of January 29, 2009, by and among
the Registrant, SanDisk (Ireland) Limited, SanDisk (Cayman) Limited,
Toshiba Corporation, Flash Partners Limited, and Flash Alliance
Limited.(32)(1)
|
|
10.52
|
Equipment
Purchase Agreement, dated as of January 29, 2009, by and among the
Registrant, SanDisk (Ireland) Limited, SanDisk (Cayman) Limited, Toshiba
Corporation, Flash Partners Limited, and Flash Alliance
Limited.(32)(1)
|
|
12.1
|
Computation
of ratio of earnings to fixed charges.(**)
|
|
21.1
|
Subsidiaries
of the Registrant.(**)
|
|
23.1
|
Consent
of Independent Registered Public Accounting Firm.(**)
|
|
31.1
|
Certification
of Chief Executive Officer Pursuant to Section 302 of the Sarbanes-Oxley
Act of 2002.(**)
|
|
31.2
|
Certification
of Chief Financial Officer Pursuant to Section 302 of the Sarbanes-Oxley
Act of 2002.(**)
|
|
32.1
|
Certification
of Chief Executive Officer Pursuant to 18 U.S.C. Section 1350, as adopted
pursuant to Section 906 of the Sarbanes-Oxley Act of
2002.(**)
|
|
32.2
|
Certification
of Chief Financial Officer Pursuant to 18 U.S.C. Section 1350, as adopted
pursuant to Section 906 of the Sarbanes-Oxley Act of
2002.(**)
|
|
*
|
Indicates
management contract or compensatory plan or
arrangement.
|
|
**
|
Filed
herewith.
|
|
***
|
Furnished
herewith.
|
|
+
|
Confidential
treatment has been requested with respect to certain portions
hereof.
|
|
1.
|
Confidential
treatment granted as to certain portions of these
exhibits.
|
|
2.
|
Previously
filed as an Exhibit to the Registrant’s Registration Statement on Form S-1
(No. 33-96298).
|
|
3.
|
Previously
filed as an Exhibit to the Registrant’s Form 10-Q for the quarter ended
June 30, 2000.
|
|
4.
|
Previously
filed as an Exhibit to the Registrant’s Registration Statement on Form S-3
(No. 333-85686).
|
|
5.
|
Previously
filed as an Exhibit to the Registrant’s Form 8-K dated June 1,
2006.
|
|
6.
|
Previously
filed as an Exhibit to the Registrant’s Form 8-K dated August 4,
2009.
|
|
7.
|
Previously
filed as an Exhibit to the Registrant’s Current Report on Form 8-K/A dated
April 18, 1997.
|
|
8.
|
Previously
filed as an Exhibit to the Registrant’s Registration Statement on Form 8-A
dated September 25, 2003.
|
|
9.
|
Previously
filed as an Exhibit to the Registrant’s Current Report on Form 8-K filed
with the SEC on May 28, 2009.
|
|
10.
|
Previously
filed as an Exhibit to the Registrant’s Form 8-A/A dated November 8,
2006.
|
|
11.
|
Previously
filed as an Exhibit to the Registrant’s Form 8-K dated May 9,
2006.
|
|
12.
|
Previously
filed as an Exhibit to the Registrant’s Form 8-K dated May 15,
2006.
|
|
13.
|
Previously
filed as an Exhibit to the Registrant’s Registration Statement on Form S-8
(No. 333-85320).
|
|
14.
|
Previously
filed as an Exhibit to the Registrant’s Registration Statement on Form S-8
(No. 333-112139).
|
|
15.
|
Previously
filed as an Exhibit to the Registrant’s Schedule 13(d) dated January 26,
2001.
|
|
16.
|
Previously
filed as an Exhibit to the Registrant’s Schedule 13(d)/A dated October 12,
2006.
|
|
17.
|
Previously
filed as an Exhibit to the Registrant’s 2003 Annual Report on Form
10-K.
|
|
18.
|
Previously
filed as an Exhibit to the Registrant’s Form 10-Q for the quarter ended
June 30, 2002.
|
|
19.
|
Previously
filed as an Exhibit to the Registrant’s Form 10-Q for the quarter ended
September 30, 2002.
|
|
20.
|
Previously
filed as an Exhibit to the Registrant’s Form 10-Q for the quarter ended
July 2, 2006.
|
|
21.
|
Previously
filed as an Exhibit to the Registrant’s Form 8-K dated November 12,
2008.
|
|
22.
|
Previously
filed as an Exhibit to the Registrant’s Form 10-Q for the quarter ended
September 26, 2004.
|
|
23.
|
Previously
filed as an Exhibit to the Registrant’s Form 10-Q for the quarter ended
October 1, 2006
|
|
24.
|
Previously
filed as an Exhibit to the Registrant’s 2004 Annual Report on Form
10-K.
|
|
25.
|
Previously
filed as Annex B to the Company’s Proxy Statement filed with the
Commission pursuant to Section 14(a) of the Exchange Act on April 15, 2009
(Commission File No. 000-26734).
|
|
26.
|
Previously
filed as an Exhibit to the Registrant’s Current Report on Form 8-K dated
June 3, 2005.
|
|
27.
|
Previously
filed as an Exhibit to the Registrant’s Form 10-Q for the quarter ended
March 30, 2008.
|
|
28.
|
Previously
filed as an Exhibit to the Registrant's 2008 Annual Report on Form
10-K
|
|
29.
|
Previously
filed as an Exhibit to the Registrant’s 2005 Annual Report on Form
10-K.
|
|
30.
|
Previously
filed as an Exhibit to the Registrant’s 2006 Annual Report on Form
10-K.
|
|
31.
|
Previously
filed as an Exhibit to the Registrant’s Form 8-K dated June 17,
2008.
|
|
32.
|
Previously
filed as an Exhibit to the Registrant’s Form 10-Q for the quarter ended
March 29, 2009.
|
E -
1