Attached files
| file | filename |
|---|---|
| 8-K - 8-K - YADKIN FINANCIAL Corp | v422061_8k.htm |
| EX-99.1 - EXHIBIT 99.1 - YADKIN FINANCIAL Corp | v422061_ex99-1.htm |
Exhibit 99.2

(NYSE: YDKN) Acquisition of NewBridge Bancorp Community Focused High Performing Growth Driven October 13, 2015
Forward Looking Statements Information in this presentation contains forward - looking statements within the meaning of the Private Securities Litigation Ref orm Act of 1995. These statements involve risks and uncertainties that could cause actual results to differ materially, including without limitation, reduced earnings due to larger than expected credit los ses in the sectors of our loan portfolio secured by real estate due to economic factors, including declining real estate values, increasing interest rates, increasing unemployment, or changes in payment be hav ior or other factors; reduced earnings due to larger credit losses because our loans are concentrated by loan type, industry segment, borrower type, or location of the borrower or collateral; the rate of del inquencies and amount of loans charged - off; the adequacy of the level of our allowance for loan losses and the amount of loan loss provisions required in future periods; costs or difficulties related to th e integration of the banks we acquired or may acquire may be greater than expected; results of examinations by our regulatory authorities, including the possibility that the regulatory authorities ma y, among other things, require us to increase our allowance for loan losses or writedown assets; the amount of our loan portfolio collateralized by real estate, and the weakness in the commercial real est ate market; our ability to maintain appropriate levels of capital; adverse changes in asset quality and resulting credit risk - related losses and expenses; increased funding costs due to market illiquidity, increase d competition for funding, and increased regulatory requirements with regard to funding; significant increases in competitive pressure in the banking and financial services industries; changes in political co nditions or the legislative or regulatory environment, including the effect of recent financial reform legislation on the banking industry; general economic conditions, either nationally or regionally and especi all y in our primary service area, becoming less favorable than expected resulting in, among other things, a deterioration in credit quality; our ability to retain our existing customers, including our deposit re lat ionships; changes occurring in business conditions and inflation; changes in monetary and tax policies; ability of borrowers to repay loans; risks associated with a failure in or breach of our operation al or security systems or infrastructure, or those of our third party vendors and other service providers or other third parties, including as a result of cyber attacks, which could disrupt our businesses, result in the disclosure or misuse of confidential or proprietary information, damage our reputation, increase our costs and cause losses; changes in accounting principles, policies or guidelines; changes in the ass ess ment of whether a deferred tax valuation allowance is necessary; our reliance on secondary sources such as FHLB advances, sales of securities and loans, federal funds lines of credit from correspondent b ank s and out - of - market time deposits, to meet our liquidity needs; loss of consumer confidence and economic disruptions resulting from terrorist activities or other military actions; and changes in th e s ecurities markets. Additional factors that could cause actual results to differ materially are discussed in the Company’s filings with the Securities and Exchange Commission ("SEC"), including without limi tat ion its Annual Report on Form 10 - K, its Quarterly Reports on Form 10 - Q, and its Current Reports on Form 8 - K. The forward - looking statements in this presentation speak only as of the date of the presentati on, and the Company does not assume any obligation to update such forward - looking statements. Combined information contained in this presentation are used for illustrative purposes only. Non - GAAP Measures Statements included in this presentation include non - GAAP measures and should be read along with the accompanying tables to the July 23, 2015 presentation and earnings release wh ich provide a reconciliation of non - GAAP measures to GAAP measures. Management believes that these non - GAAP measures provide additional useful information that allows readers to evaluate the ongoing performance of the Company. Non - GAAP measures should not be considered as an alternative to any measure of performance or financial condition as promulgated und er GAAP, and investors should consider the Company's performance and financial condition as reported under GAAP and all other relevant information when ass ess ing the performance or financial condition of the Company. Non - GAAP measures have limitations as analytical tools, and investors should not consider them in isolation or as a substitute for ana lys is of the Company's results or financial condition as reported under GAAP. Important Information 2

Transaction Rationale 3 Low Risk Profile » Experienced management team with a proven track record of integrating acquisitions » Comprehensive due diligence process and thorough review of loan portfolio » Supplemented with experienced 3 rd party vendors » Compatible cultures with familiar customer base Financially Attractive » Positions franchise for top tier financial performance » Enhances business model economies of scale » EPS accretion of approximately 10% » After full realization of expense savings » Minimal dilution to tangible book value » TBV accretive in approximately 2.5 years » IRR in excess of 20% » Strong pro forma capital position Strategically Compelling » Strengthens YDKN’s leading position as the largest community bank in North Carolina » Over $7 billion in assets with #1 market share among community banks » Statewide presence serving North Carolina’s premier markets » Adds significant scale in the Piedmont Triad » Complements existing footprint in Raleigh, Charlotte and Wilmington » Bolsters long - term growth potential » Broadens and deepens competitive strengths

NewBridge Bancorp Meets Acquisition Target Criteria 4 Low Risk to Business Model Materially Additive Financially Market Presence Enhancing P P P

Overview of Transaction Terms 5 Transaction: NewBridge Bancorp merged with and into Yadkin Financial Corporation Acquirer: Yadkin Financial Corporation (NYSE: YDKN) Target: NewBridge Bancorp (NASDAQ: NBBC) Consideration: 0.50x shares of YDKN common stock for each share of NBBC common stock; 100% stock Treatment of Options & RSUs: NBBC options to be rolled into options of YDKN and NBBC RSUs to be rolled into YDKN restricted units at close Transaction Value (1) : $11.40 per share or $456 million Ownership Split: YDKN (61.3%) / NBBC ( 38.7%) Board Composition: YDKN (10) / NBBC (5) Special Dividend: Anticipate special dividend of $0.50 per share to YDKN shareholders prior to close Required Approvals: Customary regulatory and shareholder approvals of both YDKN and NBBC shareholders Expected Closing: Early Q2 2016 (1) Based on YDKN’s closing price of $22.79 as of 10/12/2015
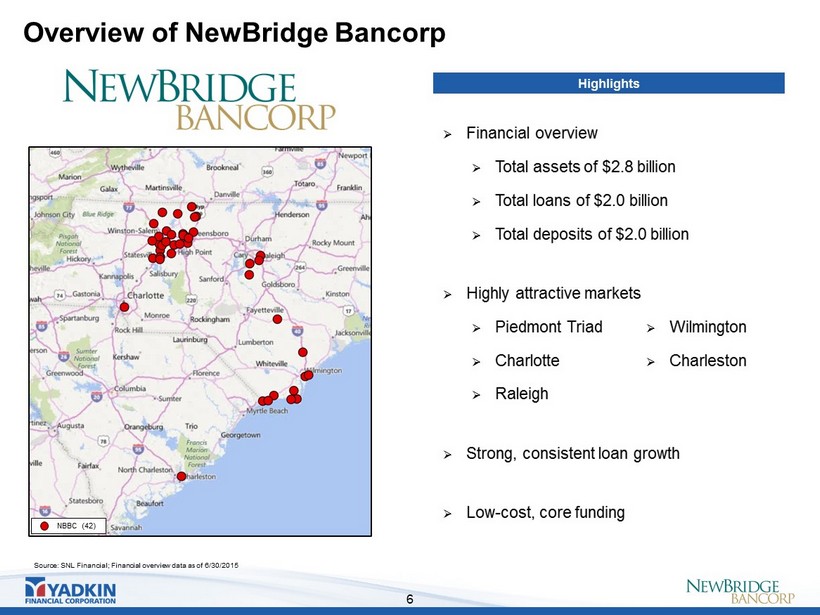
Overview of NewBridge Bancorp 6 Source: SNL Financial; Financial overview data as of 6/30/2015 NBBC (42) » Financial overview » Total assets of $2.8 billion » Total loans of $2.0 billion » Total deposits of $2.0 billion » Highly attractive markets » Piedmont Triad » Charlotte » Raleigh » Strong, consistent loan growth » Low - cost, core funding Highlights » Wilmington » Charleston

$256 $761 $975 $148 $110 $23 $207 $1,476 $366 $784 $1,182 $1,624 Wilmington Charlotte Raleigh- Durham- Chapel Hill Piedmont Triad YDKN NBBC Improved Franchise Positioning 7 Source: SNL Financial Note: Deposit data as of 6/30/2015 (1) Analysis includes Charlotte MSA branches located in South Carolina; Excludes branches with > $5bn in deposits; (2) Includes all North Carolina branches YDKN Pro Forma Deposit Presence in Major Metro Markets ($mm) (2) North Carolina Distribution of Deposits (1) Charlotte 21% Piedmont Triad 15% Raleigh - Durham - Chapel Hill 26% Wilmington 3% Rest of NC 35% 7.1% 0.4% 3.7% 3.5% Deposit Market Share Approximately 75% of pro forma franchise deposits located in major North Carolina markets

Piedmont Triad Market Highlights 8 Sources: Fortune.com, Bizjournals.com/Triad, Piedmont Triad Regional Council Top Universities and Corporate Leaders Headquartered in the Piedmont Triad Piedmont Triad Market Overview » Over 20 colleges and universities and more than 1.6 million residents » Approximately 900,000 jobs in the region » Primary economic drivers include distribution, logistics, bio - technology, health care, transportation, manufacturing, tobacco, textiles, and services industries » 5 Fortune 500 companies headquartered within the region » 3 rd largest CSA in North Carolina, 32 nd in the United States » 5 major interstate highways

Largest Community Bank in North Carolina 9 Sources: SNL Financial; Deposit data as of 6/30/2015 Note: Community Bank defined as an institution with less than or equal to $25 billion in total assets North Carolina Deposit Market Share North Carolina Community Bank Rankings by Deposits Rank Institution (ST) Number of Branches Deposits in Market ($mm) Market Share (%) Pro Forma 108 5,107 1.5 #VALUE! 1 Yadkin Financial Corporation (NC) 67 3,108 0.9 2 BNC Bancorp (NC) 36 2,975 0.9 3 First Bancorp (NC) 75 2,344 0.7 4 NewBridge Bancorp (NC) 41 1,999 0.6 5 CommunityOne Bancorp (NC) 45 1,858 0.5 6 Capital Bank Finl Corp (FL) 51 1,767 0.5 7 Southern BancShares (NC) (NC) 56 1,711 0.5 8 Fidelity BancShares (N.C.) Inc (NC) 57 1,465 0.4 9 HomeTrust Bancshares Inc. (NC) 21 1,247 0.4 10 Paragon Commercial Corp. (NC) 3 1,027 0.3 11 Park Sterling Corporation (NC) 18 920 0.3 12 United Community Banks Inc. (GA) 19 920 0.3 13 Bank of the Ozarks Inc. (AR) 24 876 0.3 14 Peoples Bancorp of NC Inc. (NC) 24 813 0.2 15 First South Bancorp Inc. (NC) 32 774 0.2 Rank Institution (ST) Number of Branches Deposits in Market ($mm) Market Share (%) 1 Bank of America Corp. (NC) 162 167,596 47.9 2 Wells Fargo & Co. (CA) 340 58,494 16.7 3 BB&T Corp. (NC) 359 50,474 14.4 4 First Citizens BancShares Inc. (NC) 250 13,958 4.0 5 PNC Financial Services Group (PA) 148 7,957 2.3 6 SunTrust Banks Inc. (GA) 142 7,314 2.1 Pro Forma 108 5,107 1.5 7 Yadkin Financial Corporation (NC) 67 3,108 0.9 8 Fifth Third Bancorp (OH) 58 3,014 0.9 9 BNC Bancorp (NC) 36 2,975 0.9 10 First Bancorp (NC) 75 2,344 0.7 11 NewBridge Bancorp (NC) 41 1,999 0.6 12 CommunityOne Bancorp (NC) 45 1,858 0.5 13 Capital Bank Finl Corp (FL) 51 1,767 0.5 14 Southern BancShares (NC) (NC) 56 1,711 0.5 15 Fidelity BancShares (N.C.) Inc (NC) 57 1,465 0.4

Overview of Pro Forma Franchise 10 Source: SNL Financial and MapInfo Professional Note: Projected population growth from 2016 to 2021 Note: Community Bank defined as an institution with less than or equal to $25 billion in total assets (1) Figures reflect balance sheet data as of 6/30/2015; Market capitalization based on YDKN stock price of $22.79 as of 10/12 /15 YDKN (70) NBBC (42) YDKN County NBBC County County of Overlap Legend Charlotte Comm. Bank Rank: #2 Deposits: $784mm Market Tot: $216.2bn Pop. Growth: 7.0% Piedmont Triad Comm. Bank Rank: #2 Deposits: $1.6bn Market Tot: $46.3bn Pop. Growth: 3.7% Raleigh / Durham - Chapel Hill Comm. Bank Rank: #1 Deposits: $1.2bn Market Tot: $32.2bn Pop. Growth: 7.8% Wilmington Comm. Bank Rank: #2 Deposits: $366mm Market Tot: $5.1bn Pop. Growth: 6.9% Pro Forma Financial Highlights (1) Branches: 112 Assets: $7.1 billion Loans: $5.0 billion Deposits: $5.2 billion Market Cap: $1.2 billion

1.38x 2.28x Assets: $1bn - $5bn Assets: $5bn - $10bn 10.6% 12.6% Assets: $1bn - $5bn Assets: $5bn - $10bn Benefits of Scale: Improved Profitability & Valuation 11 Source: SNL Financial; Market data as of 10/12/2015 Note: Southeast region includes: AL, AR, FL, GA, MS, NC, SC, TN, VA & WV; Excludes merger targets Assets $5.0bn - $10.0bn # of Banks: 14 Assets $1.0bn - $5.0bn # of Banks: 89 Assets $500mm - $1.0bn # of Banks: 112 Assets < $500mm # of Banks: 872 Assets > $10bn # of Banks: 16 Distribution of Banks in the Southeast Implications of Scale: Profitability & Valuation Median Return on Tangible Common Equity Median Price / Tangible Book Value (x) 67.5% 63.1% Assets: $1bn - $5bn Assets: $5bn - $10bn Median Efficiency Ratio
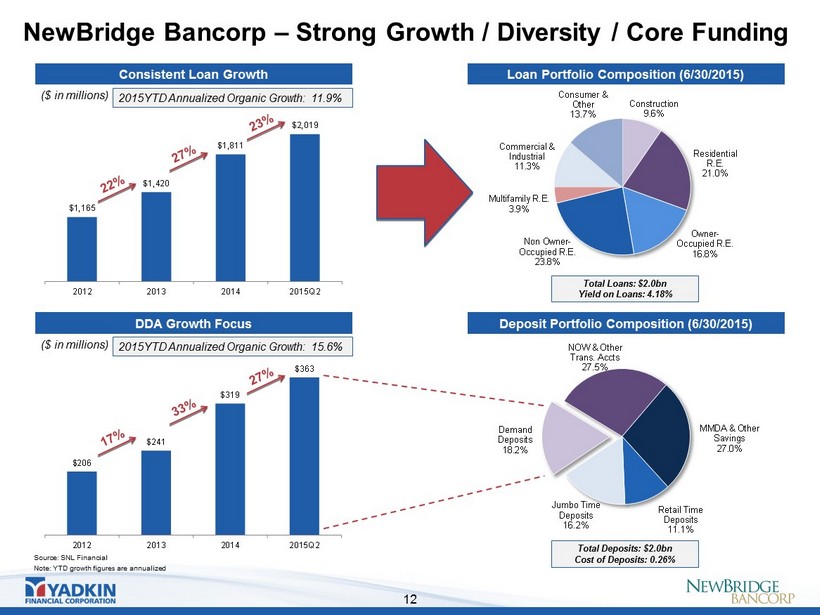
NewBridge Bancorp – Strong Growth / Diversity / Core Funding 12 Source: SNL Financial Note: YTD growth figures are annualized Consistent Loan Growth Loan Portfolio Composition (6/30/2015) $1,165 $1,420 $1,811 $2,019 2012 2013 2014 2015Q2 Construction 9.6% Residential R.E. 21.0% Owner - Occupied R.E. 16.8% Non Owner - Occupied R.E. 23.8% Multifamily R.E. 3.9% Commercial & Industrial 11.3% Consumer & Other 13.7% Total Loans: $2.0bn Yield on Loans: 4.18% DDA Growth Focus Deposit Portfolio Composition (6/30/2015) Demand Deposits 18.2% NOW & Other Trans. Accts 27.5% MMDA & Other Savings 27.0% Retail Time Deposits 11.1% Jumbo Time Deposits 16.2% Total Deposits: $2.0bn Cost of Deposits: 0.26% $206 $241 $319 $363 2012 2013 2014 2015Q2 ($ in millions) ($ in millions) 2015YTD Annualized Organic Growth: 11.9% 2015YTD Annualized Organic Growth: 15.6%

$75,995 $27,891 $19,184 $11,420 $8,855 $28,844 $26,630 $24,550 $22,112 $21,314 71.20% 25.01% 24.50% 10.39% 11.29% -50.00 0.00 50.00 $0 $20,000 $40,000 $60,000 $80,000 2011Y 2012Y 2013Y 2014Y 2015Q2 Nonperforming Assets ($000) Loan Loss Reserves ($000) Classified Asset Ratio (%) NewBridge Bancorp – Improved Asset Quality 13 Sources: SNL Financial Note: Nonperforming assets include nonaccrual loans and leases, renegotiated loans and leases, and foreclosed or repossessed assets , f rom both the held for sale and held for investment portfolios Note: Classified Asset Ratio consists of Classified Loans + OREO / Tier 1 Capital + LLR NPAs / Loans + OREO 6.14% 2.38% 1.34% 0.63% 0.44% Nonperforming Assets vs. Loan Loss Reserves Reserves in excess of NPAs of $12.5 million

Transaction Multiples & Contribution Analysis 14 (1) Based on YDKN’s closing price of $22.79 as of 10/12/2015 (2) Includes nationwide transactions announced since 12/31/2013 with deal values greater than $250 million (3) Includes impact of anticipated special dividend of $0.50 per share to YDKN shareholders YDKN / NBBC Transaction Price per Share $11.40 - 1-Day Market Premium ($8.87) 28.5% 22.4% Price / Current Est. EPS ($0.57) 20.0x 21.6x Price / Next Yr. Est. EPS ($0.68) 16.8x 18.1x Price / Stated Tangible Book Value ($5.79) 1.97x 1.78x Comparable Transactions (2) (1) Contribution Analysis Transaction Multiples Earnings Assets Loans Deposits Tang. Comm. Equity (3) Ownership Contribution Analysis 55.1% 60.9% 59.6% 61.9% 61.7% 61.3% 28.9% 39.1% 40.4% 38.1% 38.3% 38.7% 16.1% Cost Savings
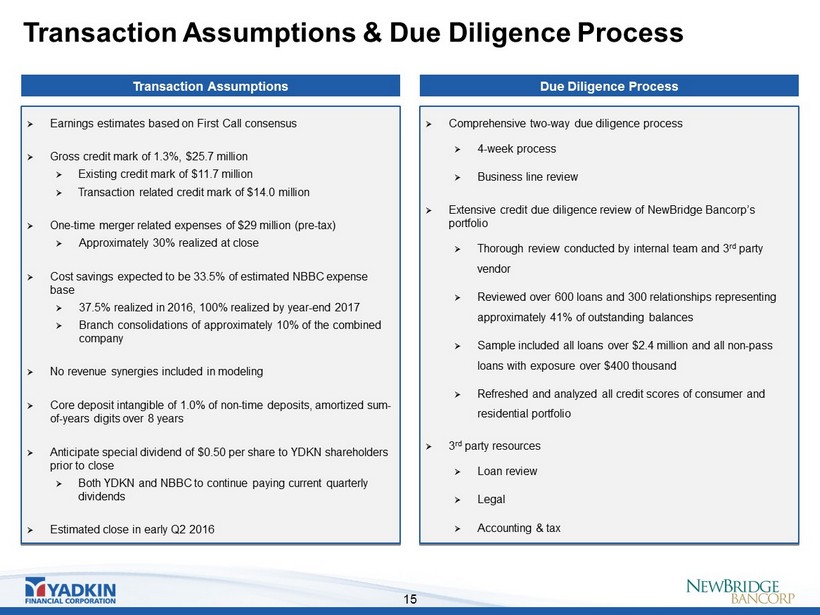
Transaction Assumptions & Due Diligence Process 15 Due Diligence Process » Comprehensive two - way due diligence process » 4 - week process » Business line review » Extensive credit due diligence review of NewBridge Bancorp’s portfolio » Thorough review conducted by internal team and 3 rd party vendor » Reviewed over 600 loans and 300 relationships representing approximately 41% of outstanding balances » Sample included all loans over $2.4 million and all non - pass loans with exposure over $400 thousand » Refreshed and analyzed all credit scores of consumer and residential portfolio » 3 rd party resources » Loan review » Legal » Accounting & tax Transaction Assumptions » Earnings estimates based on First Call consensus » Gross credit mark of 1.3%, $25.7 million » Existing credit mark of $11.7 million » Transaction related credit mark of $14.0 million » One - time merger related expenses of $29 million (pre - tax) » Approximately 30% realized at close » Cost savings expected to be 33.5% of estimated NBBC expense base » 37.5% realized in 2016, 100% realized by year - end 2017 » Branch consolidations of approximately 10% of the combined company » No revenue synergies included in modeling » Core deposit intangible of 1.0% of non - time deposits, amortized sum - of - years digits over 8 years » Anticipate special dividend of $0.50 per share to YDKN shareholders prior to close » Both YDKN and NBBC to continue paying current quarterly dividends » Estimated close in early Q2 2016
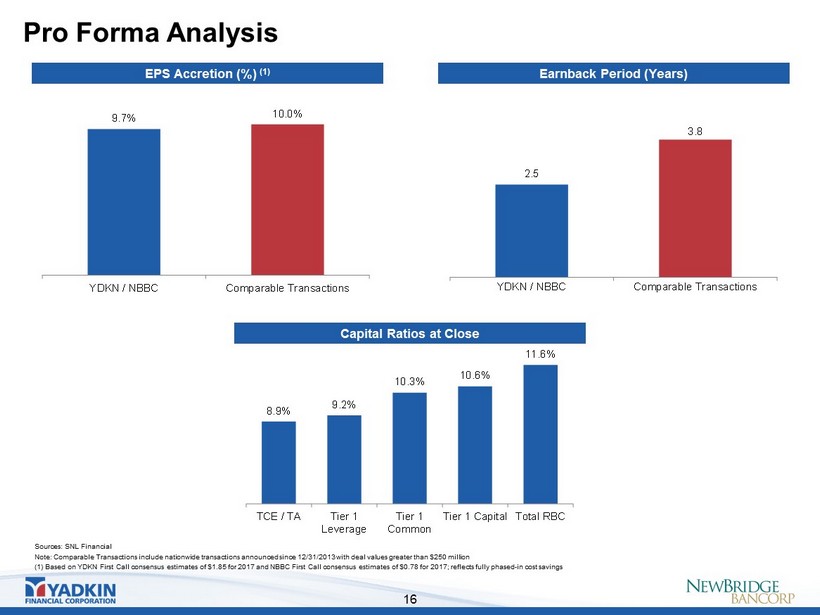
Pro Forma Analysis 16 Sources: SNL Financial Note: Comparable Transactions include nationwide transactions announced since 12/31/2013 with deal values greater than $250 m ill ion (1) Based on YDKN First Call consensus estimates of $1.85 for 2017 and NBBC First Call consensus estimates of $0.78 for 2017; re flects fully phased - in cost savings 9.7% 10.0% YDKN / NBBC Comparable Transactions Earnback Period (Years) 2.5 3.8 YDKN / NBBC Comparable Transactions EPS Accretion (%) (1) Capital Ratios at Close 8.9% 9.2% 10.3% 10.6% 11.6% TCE / TA Tier 1 Leverage Tier 1 Common Tier 1 Capital Total RBC
Summary 17 » Strategically compelling combination of two top performing banks in North Carolina » Strengthens YDKN’s leading position as the largest community bank in North Carolina » Enhances competitive position in major markets » Financially attractive » Significant EPS accretion » IRR in excess of 20% » Minimal dilution to tangible book value earned back over a short period » Low risk, in - market transaction » Creates a valuable regional banking franchise and provides significant shareholder value
Additional Information About the Proposed Transaction and Where to Find It This communication is being made in respect of the proposed transaction involving Yadkin and NewBridge. This material is not a solicitation of any vote or approval of Yadkin’s or NewBridge’s shareholders and is not a substitute for the joint proxy statement/prospectus or any other documents which Yadkin and NewBridge may send t o t heir respective shareholders in connection with the proposed merger. This communication does not constitute an offer to sell or the solicitation of an offer to buy any securities. In connection with the proposed transaction, Yadkin intends to file with the Securities and Exchange Commission (“SEC”) a Reg ist ration Statement on Form S - 4 that will include a joint proxy statement of Yadkin and NewBridge and a prospectus of Yadkin, as well as other relevant documents concerning the proposed transaction. In ves tors and security holders are also urged to carefully review and consider each of Yadkin’s and NewBridge’s public filings with the SEC, including but not limited to their Annual Reports on Form 10 - K, th eir proxy statements, their Current Reports on Form 8 - K and their Quarterly Reports on Form 10 - Q. Both NewBridge and Yadkin will mail the joint proxy statement/prospectus to their respective shareholders. BEFORE MAKING ANY VOTING OR INVESTMENT DECISIONS, INVESTORS AND SHAREHOLDERS OF YADKIN AND NEWBRIDGE ARE URGED TO CAREFULLY READ THE ENTIRE REGISTRATION STATEMENT AND JOINT PR OXY STATEMENT/PROSPECTUS REGARDING THE PROPOSED MERGER WHEN IT BECOMES AVAILABLE AND ANY OTHER RELEVANT DOCUMENTS FILED WITH THE SEC , AS WELL AS ANY AMENDMENTS OR SUPPLEMENTS TO THOSE DOCUMENTS, BECAUSE THEY WILL CONTAIN IMPORTANT INFORMATION ABOUT THE PROPOSED TRANSACTION. In vestors and security holders may obtain a free copy of the proxy statement/prospectus (when available) and other filings containing information ab out Yadkin and NewBridge at the SEC’s website at www.sec.gov. The joint proxy statement/prospectus (when available) and the other filings may also be obtained free of charge at Yadkin’s website at www.Ya dki nbank.com, or at NewBridge’s website at www.newbridgebank.com. Yadkin, NewBridge and certain of their respective directors and executive officers, under the SEC’s rules, may be deemed to b e p articipants in the solicitation of proxies of Yadkin’s and NewBridge’s shareholders in connection with the proposed transaction. Information about the directors and executive officers of Yadkin an d t heir ownership of Yadkin common stock is set forth in the proxy statement for Yadkin’s 2015 Annual Meeting of Shareholders, as filed with the SEC on Schedule 14A on April 10, 2015. Information about the dir ectors and executive officers of NewBridge and their ownership of NewBridge’s common stock is set forth in the proxy statement for NewBridge’s 2015 Annual Meeting of Shareholders, as filed wi th the SEC on a Schedule 14A on April 2, 2015. Additional information regarding the interests of those participants and other persons who may be deemed participants in the transaction may be obta ine d by reading the joint proxy statement/prospectus regarding the proposed transaction when it becomes available. Free copies of this document may be obtained as described in the preceding paragraph. Additional Information About the Merger 18