Attached files
| file | filename |
|---|---|
| EX-99.1 - MEDIA RELEASE - IHS Inc. | exh991-1072015.htm |
| 8-K - 8-K - IHS Inc. | a8k-investordayx1072015.htm |

© 2015 IHS. ALL RIGHTS RESERVED. SUPPLEMENTAL SCHEDULES IHS Investor Day October 7, 2015 OCTOBER 2015 1

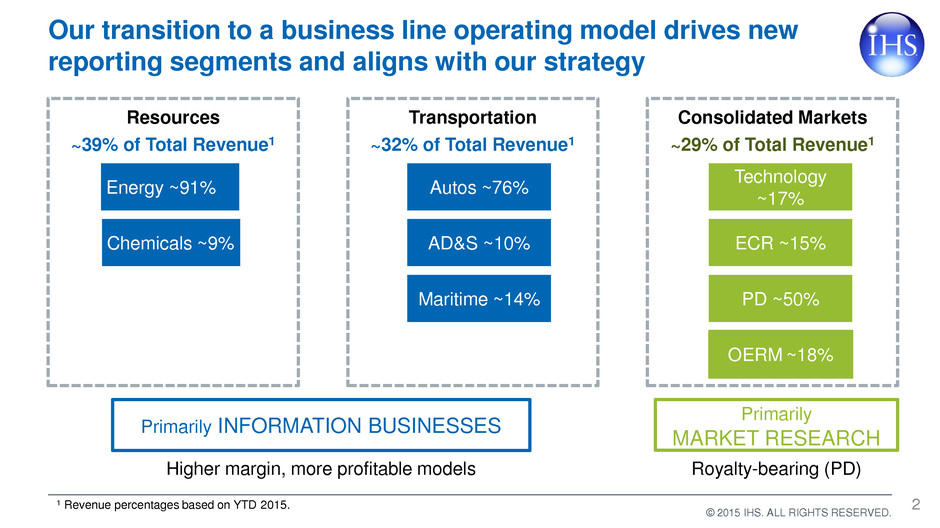
© 2015 IHS. ALL RIGHTS RESERVED. Our transition to a business line operating model drives new reporting segments and aligns with our strategy Resources ~39% of Total Revenue1 Energy ~91% Chemicals ~9% Transportation ~32% of Total Revenue1 Autos ~76% AD&S ~10% Maritime ~14% Consolidated Markets ~29% of Total Revenue1 Technology ~17% ECR ~15% PD ~50% OERM ~18% 1 Revenue percentages based on YTD 2015. Higher margin, more profitable models Primarily INFORMATION BUSINESSES Royalty-bearing (PD) Primarily MARKET RESEARCH 2

Transition to new reporting segments ‒ financial summary Resources Transportation Consolidated Markets & Solutions Total IHS YTD 2015 Revenue $670 $560 $496 $1,726 Subs organic growth % 3% 10% 3% 5% Non-subs organic growth % (26%) 7% (8%) (10%) Total organic growth % (3%) 10% 1% 2% Total organic growth % no change no change 4% 3% Adjusted EBITDA Margin % ~Low 40%s ~Low-Mid 30%s ~Low 20%s 31.5%1 YTD 2014 Revenue $690 $484 $474 $1,648 Subs organic growth % 8% 5% 3% 6% Non-subs organic growth % 1% 1% (1%) 0% Total organic growth % 6% 4% 2% 4% YTD 2015 and YTD 2014 Financial Results 1Adjusted EBITDA margin % includes impact of annualized corporate cost not allocated to reportable segments of approximately $50M 3

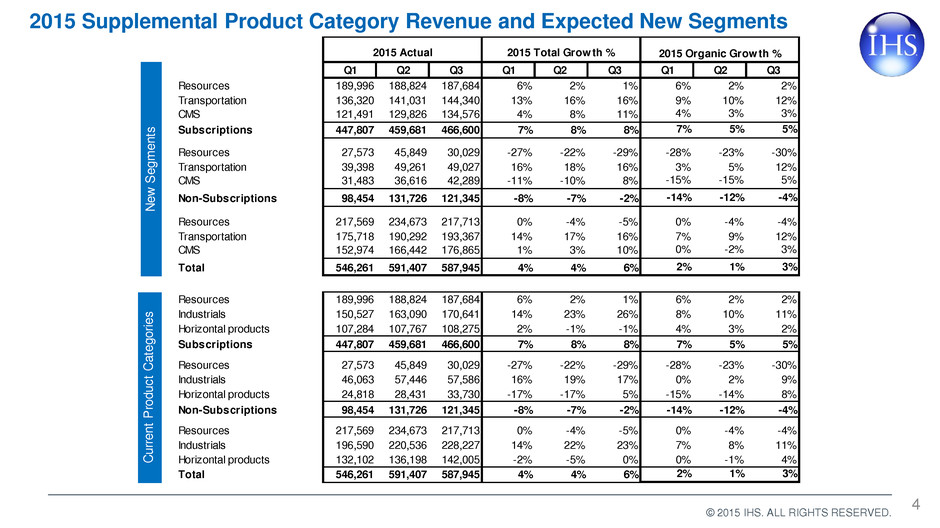
© 2015 IHS. ALL RIGHTS RESERVED. 2015 Supplemental Product Category Revenue and Expected New Segments 4 Q1 Q2 Q3 Q1 Q2 Q3 Q1 Q2 Q3 Resources 189,996 188,824 187,684 6% 2% 1% 6% 2% 2% Transportation 136,320 141,031 144,340 13% 16% 16% 9% 10% 12% CMS 121,491 129,826 134,576 4% 8% 11% 4% 3% 3% Subscriptions 447,807 459,681 466,600 7% 8% 8% 7% 5% 5% Resources 27,573 45,849 30,029 -27% -22% -29% -28% -23% -30% Transportation 39,398 49,261 49,027 16% 18% 16% 3% 5% 12% CMS 31,483 36,616 42,289 -11% -10% 8% -15% -15% 5% Non-Subscriptions 98,454 131,726 121,345 -8% -7% -2% -14% -12% -4% Resources 217,569 234,673 217,713 0% -4% -5% 0% -4% -4% Transportation 175,718 190,292 193,367 14% 17% 16% 7% 9% 12% CMS 152,974 166,442 176,865 1% 3% 10% 0% -2% 3% Total 546,261 591,407 587,945 4% 4% 6% 2% 1% 3% New Se gm ent s 2015 Organic Growth %2015 Actual 2015 Total Growth % Resources 189,996 188,824 187,684 6% 2% 1% 6% 2% 2% Indust ial 150,527 163,090 0,641 14% 23% 26% 8% 10% 11% Horizontal products 107,284 107,767 108,2 5 2% -1% -1% 4% 3% 2% Subscriptions 447,807 459,681 4 6, 00 7% 8% 8% 7% 5% 5% Resources 27,573 45,849 30,029 -27% -22% -29% - 8% -23% - 0% Industrials 46,063 57,446 57,586 16% 19% 17% 0% 2% 9% Horizontal products 24,818 28,431 33,730 -17% -17% 5% -15% -14% 8% Non-Subscriptions 98,454 131,726 121,345 -8% -7% -2% -14% -12% -4% Resources 217,569 234,673 217,713 0% -4% -5% 0% -4% -4% Industrials 196,590 220,536 228,227 14% 22% 23% 7% 8% 11% Horizontal products 132,102 136,198 142,005 -2% -5% 0% 0% -1% 4% Total 546,261 591,407 587,945 4% 4% 6% 2% 1% 3% Curr ent P rodu ct C ateg ories

© 2015 IHS. ALL RIGHTS RESERVED. 5 2014 Supplemental Product Category Revenue and Expected New Segments Q1 Q2 Q3 Q4 FY Q1 Q2 Q3 Q4 FY Q1 Q2 Q3 Q4 FY Resources 179,794 184,734 186,666 191,538 742,732 15% 12% 7% 5% 10% 8% 8% 7% 6% 7% Transportation 120,690 121,315 124,095 130,308 496,409 228% 240% 64% 9% 85% 2% 5% 7% 8% 7% CMS 116,890 120,297 121,367 121,923 480,476 3% 6% 5% 5% 5% 3% 4% 3% 4% 4% Subscriptions 417,374 426,346 432,128 443,769 1,719,617 36% 36% 18% 6% 22% 5% 6% 6% 6% 6% Resources 37,700 59,142 42,441 45,196 184,479 12% 3% -3% -14% -2% 2% 0% 1% -10% -2% Transportation 34,067 41,672 42,419 47,980 166,138 313% 342% 66% 12% 93% -12% 4% 5% 5% 3% CMS 35,317 40,848 39,023 45,372 160,560 7% 9% -15% -2% -1% 8% 9% -15% -1% -1% Non-Subscriptions 107,084 141,662 123,883 138,548 511,177 43% 36% 7% -2% 17% 3% 4% -5% -2% -1% Resources 217,494 243,876 229,107 236,734 927,211 14% 10% 5% 1% 7% 7% 6% 6% 2% 5% Transportation 154,757 162,987 166,514 178,289 662,547 244% 261% 65% 10% 87% -1% 5% 7% 8% 6% CMS 152,208 161,145 160,390 167,294 641,036 4% 6% 0% 3% 3% 4% 5% -2% 3% 2% Total 524,458 568,008 556,011 582,317 2,230,794 37% 36% 16% 4% 21% 5% 6% 3% 4% 4% New Seg men ts 2014 Total Growth %2014 Actuals 2014 Organic % Resources 179,794 184,734 186,666 191,538 742,732 15 12 7 5 10 8% 8% 7% 6% 7% Indust ial 132,158 133,047 135,967 143,041 544,213 175 184 57 9 74 1 5 7 8 6 Horizontal products 105,422 108,565 109,495 109,190 432,672 3 6 5 4 4 3% 4% 3% 4% 4% Sub cripti s 417,374 426,346 432,128 443,769 1,719,617 36% 36% 18% 6% 22% 5% 6% 6% 6% 6% Resources 37,700 59,142 42,441 45,196 184,479 12 3 -3 -14 -2 2% 0% 1% -10% -2% Industrials 39,565 48,299 49,300 55,017 192,181 175 175 52 9 68 -12 -7 4 3 0 Horizontal products 29,819 34,221 32,142 38,335 134,517 11% 16% -17% 0% 1% 12% 16% -18% 1% 1% Non-Subscriptions 107,084 141,662 123,883 138,548 511,177 43% 36% 7% -2% 17% 3% 4% -5% -2% -1% Resources 217,494 243,876 229,107 236,734 927,211 14% 10% 5% 1% 7% 7% 6% 6% 2% 5% Industrials 171,723 181,346 185,267 198,058 736,394 175 182 55 9 72 -2 1 6 7 4 Horizontal products 135,241 142,786 141,637 147,525 567,189 4% 8% -1% 3% 4% 5% 7% -3% 3% 3% Total 524,458 568,008 556,011 582,317 2,230,794 37 36 16 4 21 5 6 3 4 4 Curre nt Pro duct C atego ries
