Attached files
| file | filename |
|---|---|
| 8-K - CURRENT REPORT OF MATERIAL EVENTS OR CORPORATE CHANGES - TIER REIT INC | a15-20514_18k.htm |
Exhibit 99.1
|
|
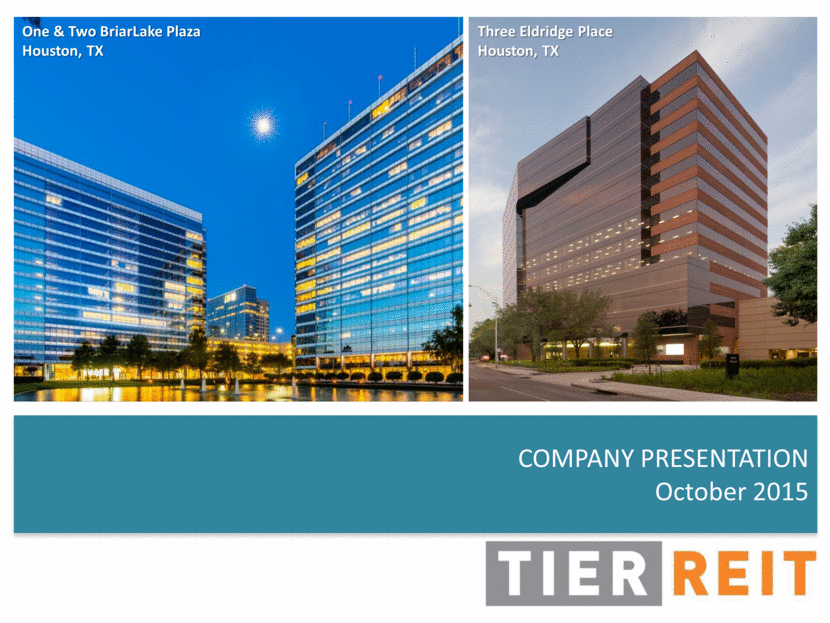
COMPANY PRESENTATION October 2015 One & Two BriarLake Plaza Houston, TX Three Eldridge Place Houston, TX |
|
|
Forward-Looking Statements This presentation contains forward-looking statements, including discussion and analysis of the financial condition of us and our subsidiaries and other matters. These forward-looking statements are not historical facts but are the intent, belief or current expectations of our management based on their knowledge and understanding of our business and industry. Words such as “may,” “anticipates,” “expects,” “intends,” “plans,” “believes,” “seeks,” “estimates,” “would,” “could,” “should,” “objectives,” “strategies,” “goals,” and variations of these words and similar expressions are intended to identify forward-looking statements. We intend that such forward-looking statements be subject to the safe harbor provisions created by Section 27A of the Securities Act of 1933 and Section 21E of the Securities Exchange Act of 1934. These statements are not guarantees of future performance and are subject to risks, uncertainties and other factors, some of which are beyond our control, are difficult to predict and could cause actual results to differ materially from those expressed or forecasted in the forward-looking statements. Forward-looking statements that were true at the time made may ultimately prove to be incorrect or false. We caution you not to place undue reliance on forward-looking statements, which reflect our management's view only as of the date of this presentation. We undertake no obligation to update or revise forward-looking statements to reflect changed assumptions, the occurrence of unanticipated events or changes to future operating results. Factors that could cause actual results to differ materially from any forward-looking statements made in the presentation include but are not limited to: (i) market disruptions and economic conditions experienced by the U.S. economy or real estate industry as a whole and the local economic conditions in the markets in which our properties are located; (ii) our ability to renew expiring leases and lease vacant spaces at favorable rates or at all; (iii) the inability of tenants to continue paying their rent obligations due to bankruptcy, insolvency or a general downturn in their business; (iv) the availability of cash flow from operating activities to fund distributions and capital expenditures; (v) our ability to raise capital in the future by issuing additional equity or debt securities, selling our assets or otherwise to fund our future capital needs; (vi) our ability to strategically acquire or dispose of assets on favorable terms or at all; (vii) our level of debt and the terms and limitations imposed on us by our debt agreements; (viii) our ability to retain our executive officers and other key personnel; (ix) unfavorable changes in laws or regulations impacting our business or our assets; and (x) factors that could affect our ability to qualify as a real estate investment trust. The forward-looking statements should be read in light of these and other risk factors identified in the “Risk Factors” section of our Annual Report on Form 10-K for the year ended December 31, 2014, and Quarterly Report on Form 10-Q for the quarter ended June 30, 2015, as filed with the Securities and Exchange Commission (the “SEC”). The modeling, projections, analyses, and other forward-looking information prepared by CoStar Portfolio Strategy, LLC (“CoStar”) and presented herein are based on financial and other information from public and proprietary sources, as well as various assumptions concerning future events and circumstances that are speculative, uncertain and subject to change without notice. Actual results and events may differ materially from the projections presented. All CoStar materials set forth herein (“CoStar Materials”) speak only as of the date referenced and may have materially changed since such date. CoStar does not purport that the CoStar Materials herein are comprehensive, and, while they are believed to be accurate, the CoStar Materials are not guaranteed to be free from error, omission or misstatement. CoStar has no obligation to update any of the CoStar Materials included in this document. All CoStar Materials are provided “as is,” without any guarantees, representations or warranties of any kind, including implied warranties of merchantability, non-infringement, title and fitness for a particular purpose. To the maximum extent permitted by law, CoStar disclaims any and all liability in the event any CoStar Materials prove to be inaccurate, incomplete or unreliable. CoStar does not sponsor, endorse, offer or promote an investment in the securities of TIER REIT, Inc. You should not construe any of the CoStar Materials as investment, tax, accounting or legal advice. |
|
|
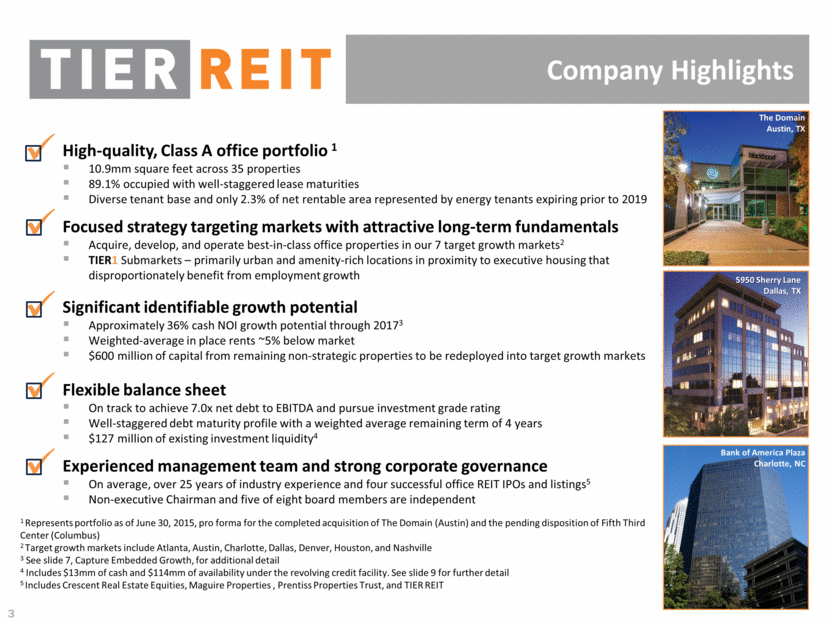
Company Highlights High-quality, Class A office portfolio 1 10.9mm square feet across 35 properties 89.1% occupied with well-staggered lease maturities Diverse tenant base and only 2.3% of net rentable area represented by energy tenants expiring prior to 2019 Focused strategy targeting markets with attractive long-term fundamentals Acquire, develop, and operate best-in-class office properties in our 7 target growth markets2 TIER1 Submarkets – primarily urban and amenity-rich locations in proximity to executive housing that disproportionately benefit from employment growth Significant identifiable growth potential Approximately 36% cash NOI growth potential through 20173 Weighted-average in place rents ~5% below market $600 million of capital from remaining non-strategic properties to be redeployed into target growth markets Flexible balance sheet On track to achieve 7.0x net debt to EBITDA and pursue investment grade rating Well-staggered debt maturity profile with a weighted average remaining term of 4 years $127 million of existing investment liquidity4 Experienced management team and strong corporate governance On average, over 25 years of industry experience and four successful office REIT IPOs and listings5 Non-executive Chairman and five of eight board members are independent Bank of America Plaza Charlotte, NC The Domain Austin, TX Burnett Plaza Fort Worth, TX 1 Represents portfolio as of June 30, 2015, pro forma for the completed acquisition of The Domain (Austin) and the pending disposition of Fifth Third Center (Columbus) 2 Target growth markets include Atlanta, Austin, Charlotte, Dallas, Denver, Houston, and Nashville 3 See slide 7, Capture Embedded Growth, for additional detail 4 Includes $13mm of cash and $114mm of availability under the revolving credit facility. See slide 9 for further detail 5 Includes Crescent Real Estate Equities, Maguire Properties , Prentiss Properties Trust, and TIER REIT 5950 Sherry Lane Dallas, TX |
|
|
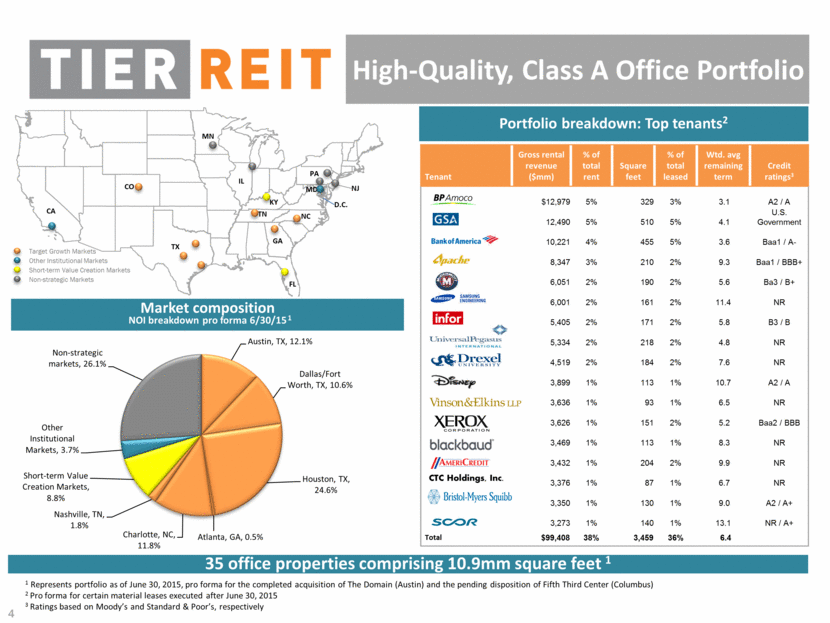
High-Quality, Class A Office Portfolio Portfolio breakdown: Top tenants2 1 Represents portfolio as of June 30, 2015, pro forma for the completed acquisition of The Domain (Austin) and the pending disposition of Fifth Third Center (Columbus) 2 Pro forma for certain material leases executed after June 30, 2015 3 Ratings based on Moody’s and Standard & Poor’s, respectively Tenant Gross rental revenue ($mm) % of total rent Square feet % of total leased Wtd. avg remaining term Credit ratings3 $12,979 5% 329 3% 3.1 A2 / A 12,490 5% 510 5% 4.1 U.S. Government 10,221 4% 455 5% 3.6 Baa1 / A- 8,347 3% 210 2% 9.3 Baa1 / BBB+ 6,051 2% 190 2% 5.6 Ba3 / B+ 6,001 2% 161 2% 11.4 NR 5,405 2% 171 2% 5.8 B3 / B 5,334 2% 218 2% 4.8 NR 4,519 2% 184 2% 7.6 NR 3,899 1% 113 1% 10.7 A2 / A 3,636 1% 93 1% 6.5 NR 3,626 1% 151 2% 5.2 Baa2 / BBB 3,469 1% 113 1% 8.3 NR 3,432 1% 204 2% 9.9 NR CTC Holdings, Inc. 3,376 1% 87 1% 6.7 NR 3,350 1% 130 1% 9.0 A2 / A+ 3,273 1% 140 1% 13.1 NR / A+ Total $99,408 38% 3,459 36% 6.4 MN IL CA FL GA KY MD NC PA TN TX D.C. CO NJ Indicates TIER strategic markets Indicates TIER non-strategic markets (%) indicates percent of NOI as of 3/31/151 35 office properties comprising 10.9mm square feet 1 Target Growth Markets Other Institutional Markets Short-term Value Creation Markets Non-strategic Markets Market composition NOI breakdown pro forma 6/30/15 1 Austin, TX , 12.1% Dallas/Fort Worth, TX , 10.6% Houston, TX, 24.6 % Atlanta, GA , 0.5% Charlotte, NC , 11.8% Nashville, TN , 1.8% Short - term Value Creation Markets , 8.8% Other Institutional Markets , 3.7% Non - strategic markets , 26.1% |
|
|
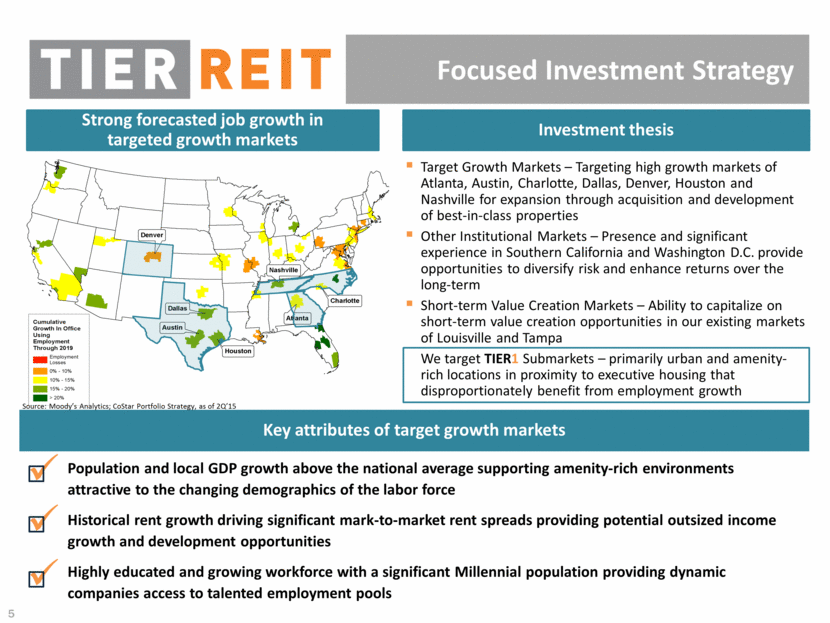
Key attributes of target growth markets Focused Investment Strategy Target Growth Markets – Targeting high growth markets of Atlanta, Austin, Charlotte, Dallas, Denver, Houston and Nashville for expansion through acquisition and development of best-in-class properties Other Institutional Markets – Presence and significant experience in Southern California and Washington D.C. provide opportunities to diversify risk and enhance returns over the long-term Short-term Value Creation Markets – Ability to capitalize on short-term value creation opportunities in our existing markets of Louisville and Tampa We target TIER1 Submarkets – primarily urban and amenity-rich locations in proximity to executive housing that disproportionately benefit from employment growth Population and local GDP growth above the national average supporting amenity-rich environments attractive to the changing demographics of the labor force Historical rent growth driving significant mark-to-market rent spreads providing potential outsized income growth and development opportunities Highly educated and growing workforce with a significant Millennial population providing dynamic companies access to talented employment pools Investment thesis Strong forecasted job growth in targeted growth markets Source: Moody’s Analytics; CoStar Portfolio Strategy, as of 2Q’15 |
|
|
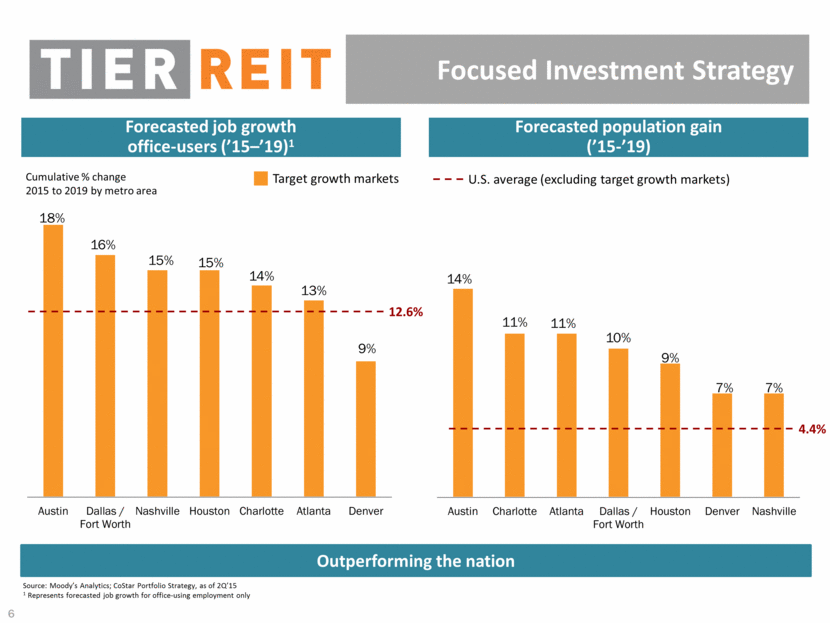
Focused Investment Strategy Forecasted job growth office-users (’15–’19)1 Source: Moody’s Analytics; CoStar Portfolio Strategy, as of 2Q’15 1 Represents forecasted job growth for office-using employment only 12.6% U.S. average (excluding target growth markets) Target growth markets Forecasted population gain (’15-’19) 4.4% Outperforming the nation Cumulative % change 2015 to 2019 by metro area 18% 16% 15% 15% 14% 13% 9% Austin Dallas / Fort Worth Nashville Houston Charlotte Atlanta Denver 14% 11% 11% 10% 9% 7% 7% Austin Charlotte Atlanta Dallas / Fort Worth Houston Denver Nashville |
|
|
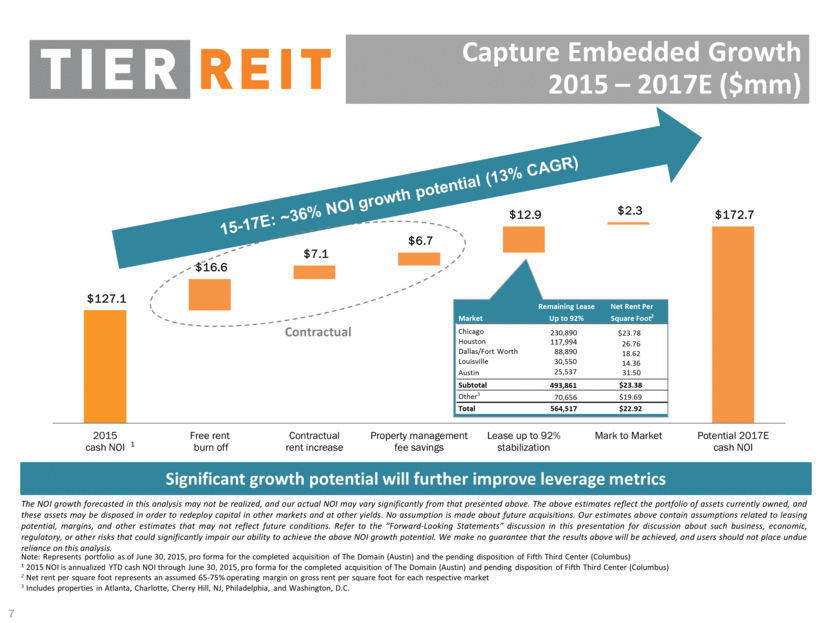
Capture Embedded Growth 2015 – 2017E ($mm) Significant growth potential will further improve leverage metrics 15-17E: ~36% NOI growth potential (13% CAGR) Note: Represents portfolio as of June 30, 2015, pro forma for the completed acquisition of The Domain (Austin) and the pending disposition of Fifth Third Center (Columbus) 1 2015 NOI is annualized YTD cash NOI through June 30, 2015, pro forma for the completed acquisition of The Domain (Austin) and pending disposition of Fifth Third Center (Columbus) 2 Net rent per square foot represents an assumed 65-75% operating margin on gross rent per square foot for each respective market 3 Includes properties in Atlanta, Charlotte, Cherry Hill, NJ, Philadelphia, and Washington, D.C. The NOI growth forecasted in this analysis may not be realized, and our actual NOI may vary significantly from that presented above. The above estimates reflect the portfolio of assets currently owned, and these assets may be disposed in order to redeploy capital in other markets and at other yields. No assumption is made about future acquisitions. Our estimates above contain assumptions related to leasing potential, margins, and other estimates that may not reflect future conditions. Refer to the “Forward-Looking Statements” discussion in this presentation for discussion about such business, economic, regulatory, or other risks that could significantly impair our ability to achieve the above NOI growth potential. We make no guarantee that the results above will be achieved, and users should not place undue reliance on this analysis. 1 Contractual 25,537 Remaining Lease Net Rent Per Market Up to 92% Square Foot 2 Chicago 230,890 $23.78 Houston 117,994 26.76 Dallas/Fort Worth 88,890 18.62 Louisville 30,550 14.36 Subtotal 493,861 $23.38 Other 3 70,656 $19.69 Total 564,517 $22.92 Austin 31.50 25,537 $127.1 $16.6 $7.1 $6.7 $12.9 $2.3 $172.7 2015 cash NOI Free rent burn off Contractual rent increase Property management fee savings Lease up to 92% stabilization Mark to Market Potential 2017E cash NOI |
|
|
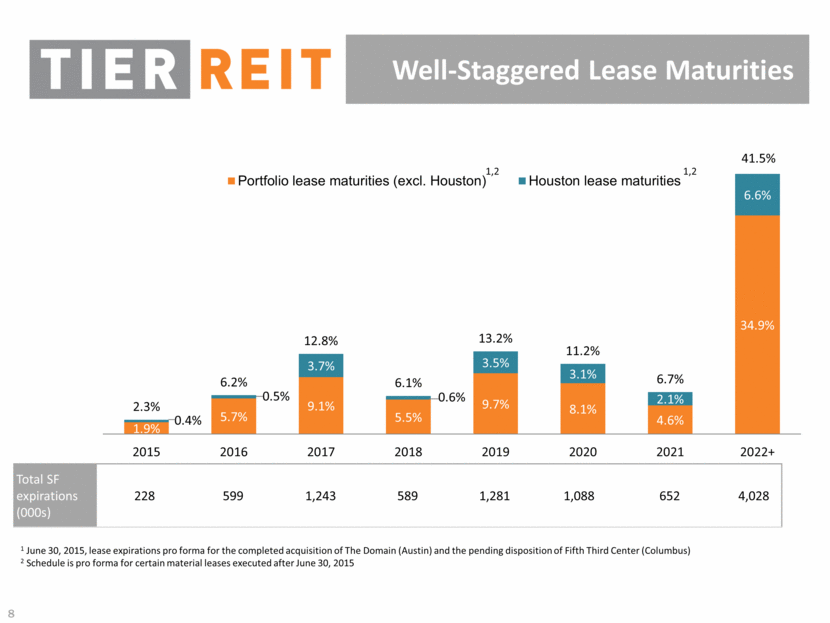
Well-Staggered Lease Maturities Total SF expirations (000s) 228 599 1,243 589 1,281 1,088 652 4,028 1 June 30, 2015, lease expirations pro forma for the completed acquisition of The Domain (Austin) and the pending disposition of Fifth Third Center (Columbus) 2 Schedule is pro forma for certain material leases executed after June 30, 2015 1,2 1,2 41.5% 1.9% 5.7% 9.1% 5.5% 9.7% 8.1% 4.6% 34.9% 0.4% 0.5% 3.7% 0.6% 3.5% 3.1% 2.1% 6.6% 2.3% 6.2% 12.8% 6.1% 13.2% 11.2% 6.7% 2015 2016 2017 2018 2019 2020 2021 2022+ Portfolio lease maturities (excl. Houston) Houston lease maturities |
|
|
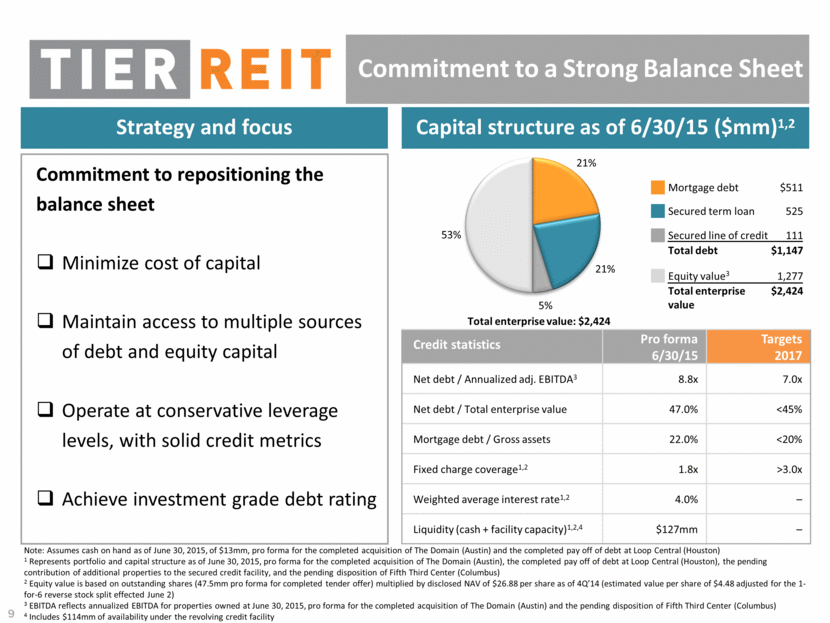
Commitment to a Strong Balance Sheet Strategy and focus Capital structure as of 6/30/15 ($mm)1,2 Commitment to repositioning the balance sheet Minimize cost of capital Maintain access to multiple sources of debt and equity capital Operate at conservative leverage levels, with solid credit metrics Achieve investment grade debt rating Credit statistics Pro forma 6/30/15 Targets 2017 Net debt / Annualized adj. EBITDA3 8.8x 7.0x Net debt / Total enterprise value 47.0% <45% Mortgage debt / Gross assets 22.0% <20% Fixed charge coverage1,2 1.8x >3.0x Weighted average interest rate1,2 4.0% – Liquidity (cash + facility capacity)1,2,4 $127mm – Secured line of credit Secured term loan Mortgage debt Equity value3 Total debt Total enterprise value 1,277 $511 525 111 $1,147 $2,424 Total enterprise value: $2,424 Note: Assumes cash on hand as of June 30, 2015, of $13mm, pro forma for the completed acquisition of The Domain (Austin) and the completed pay off of debt at Loop Central (Houston) 1 Represents portfolio and capital structure as of June 30, 2015, pro forma for the completed acquisition of The Domain (Austin), the completed pay off of debt at Loop Central (Houston), the pending contribution of additional properties to the secured credit facility, and the pending disposition of Fifth Third Center (Columbus) 2 Equity value is based on outstanding shares (47.5mm pro forma for completed tender offer) multiplied by disclosed NAV of $26.88 per share as of 4Q’14 (estimated value per share of $4.48 adjusted for the 1-for-6 reverse stock split effected June 2) 3 EBITDA reflects annualized EBITDA for properties owned at June 30, 2015, pro forma for the completed acquisition of The Domain (Austin) and the pending disposition of Fifth Third Center (Columbus) 4 Includes $114mm of availability under the revolving credit facility 21% 21% 5% 53% |
|
|
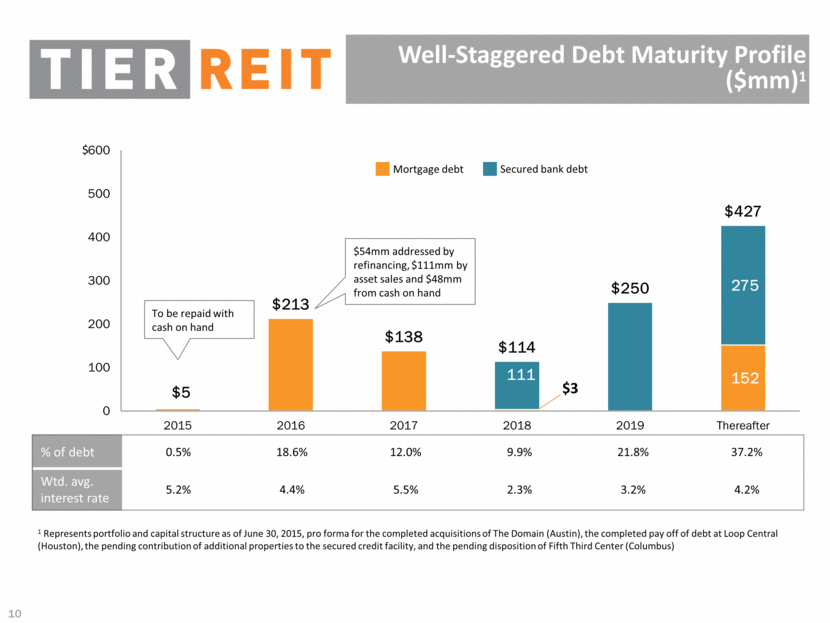
$54mm addressed by refinancing, $111mm by asset sales and $48mm from cash on hand Well-Staggered Debt Maturity Profile ($mm)1 % of debt 0.5% 18.6% 12.0% 9.9% 21.8% 37.2% Wtd. avg. interest rate 5.2% 4.4% 5.5% 2.3% 3.2% 4.2% Mortgage debt Secured bank debt $ 1 Represents portfolio and capital structure as of June 30, 2015, pro forma for the completed acquisitions of The Domain (Austin), the completed pay off of debt at Loop Central (Houston), the pending contribution of additional properties to the secured credit facility, and the pending disposition of Fifth Third Center (Columbus) To be repaid with cash on hand 152 275 $5 $213 $138 $114 $250 $427 0 100 200 300 400 500 600 2015 2016 2017 2018 2019 Thereafter 111 $3 |
|
|
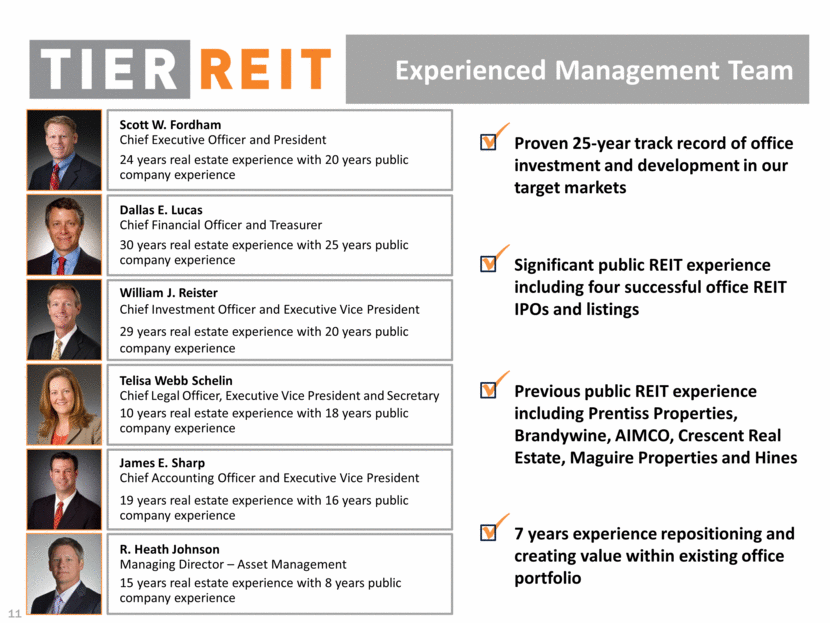
Experienced Management Team Scott W. Fordham Chief Executive Officer and President 24 years real estate experience with 20 years public company experience Dallas E. Lucas Chief Financial Officer and Treasurer 30 years real estate experience with 25 years public company experience William J. Reister Chief Investment Officer and Executive Vice President 29 years real estate experience with 20 years public company experience Telisa Webb Schelin Chief Legal Officer, Executive Vice President and Secretary 10 years real estate experience with 18 years public company experience James E. Sharp Chief Accounting Officer and Executive Vice President 19 years real estate experience with 16 years public company experience Proven 25-year track record of office investment and development in our target markets Significant public REIT experience including four successful office REIT IPOs and listings 7 years experience repositioning and creating value within existing office portfolio Previous public REIT experience including Prentiss Properties, Brandywine, AIMCO, Crescent Real Estate, Maguire Properties and Hines R. Heath Johnson Managing Director – Asset Management 15 years real estate experience with 8 years public company experience |
|
|
Houston Portfolio Discussion |
|
|
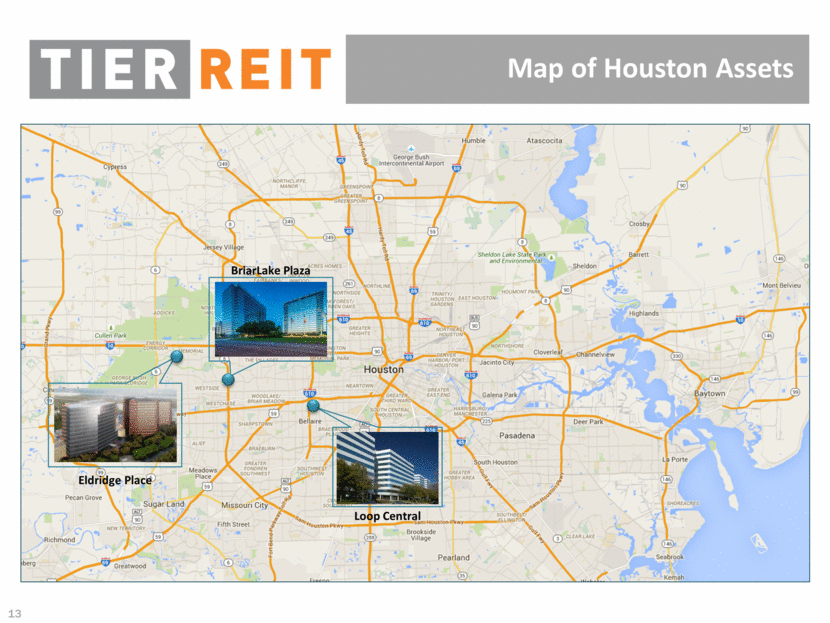
Map of Houston Assets Loop Central BriarLake Plaza Eldridge Place |
|
|
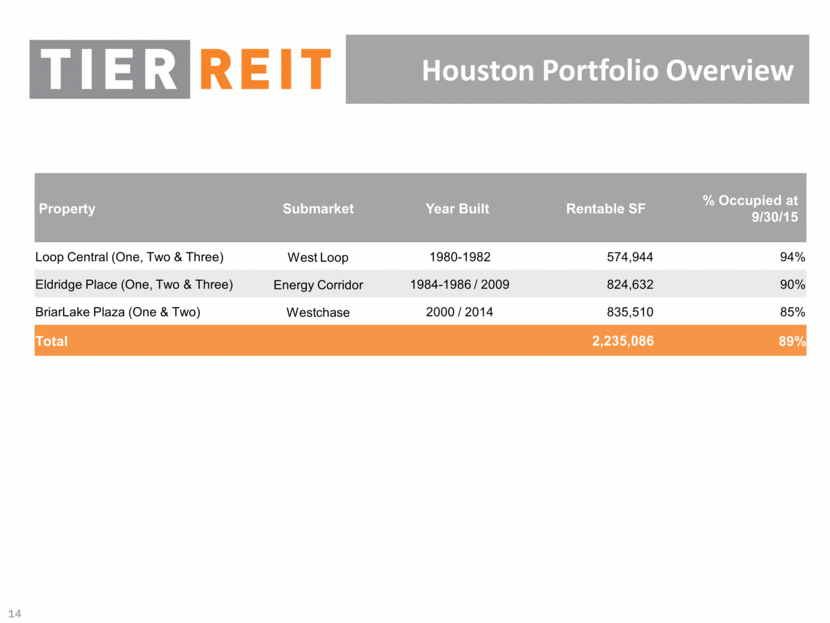
Houston Portfolio Overview Property Submarket Year Built Rentable SF % Occupied at 9/30/15 Loop Central (One, Two & Three) West Loop 1980-1982 574,944 94% Eldridge Place (One, Two & Three) Energy Corridor 1984-1986 / 2009 824,632 90% BriarLake Plaza (One & Two) Westchase 2000 / 2014 835,510 85% Total 2,235,086 89% |
|
|
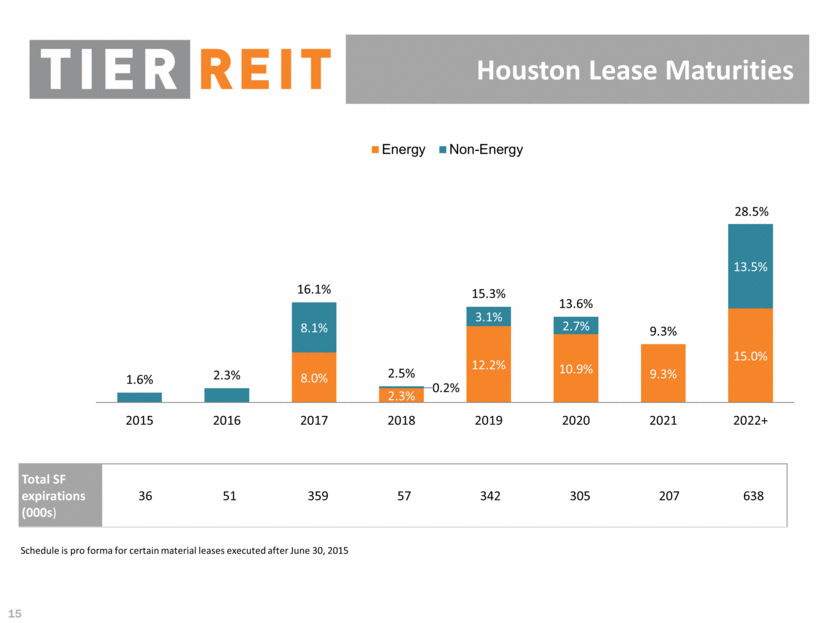
Houston Lease Maturities Total SF expirations (000s) 36 51 359 57 342 305 207 638 Schedule is pro forma for certain material leases executed after June 30, 2015 28.5% 8.0% 2.3% 12.2% 10.9% 9.3% 15.0% 8.1% 0.2% 3.1% 2.7% 13.5% 1.6% 2.3% 16.1% 2.5% 15.3% 13.6% 9.3% 2015 2016 2017 2018 2019 2020 2021 2022+ Energy Non-Energy |
|
|
Loop Central 4828, 4848 & 4888 Loop Central Drive Property Location Loop Central |
|
|
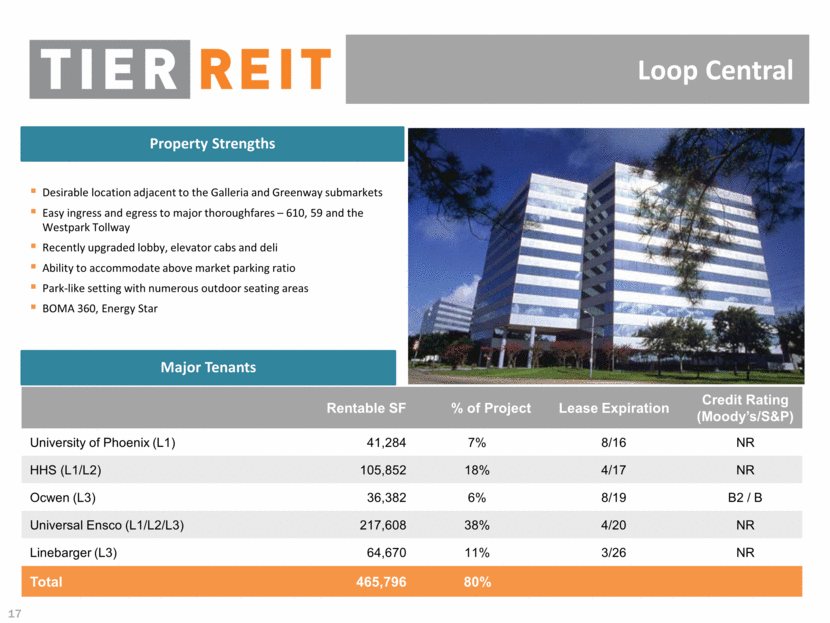
Loop Central Property Strengths Desirable location adjacent to the Galleria and Greenway submarkets Easy ingress and egress to major thoroughfares – 610, 59 and the Westpark Tollway Recently upgraded lobby, elevator cabs and deli Ability to accommodate above market parking ratio Park-like setting with numerous outdoor seating areas BOMA 360, Energy Star Major Tenants Rentable SF % of Project Lease Expiration Credit Rating (Moody’s/S&P) University of Phoenix (L1) 41,284 7% 8/16 NR HHS (L1/L2) 105,852 18% 4/17 NR Ocwen (L3) 36,382 6% 8/19 B2 / B Universal Ensco (L1/L2/L3) 217,608 38% 4/20 NR Linebarger (L3) 64,670 11% 3/26 NR Total 465,796 80% |
|
|
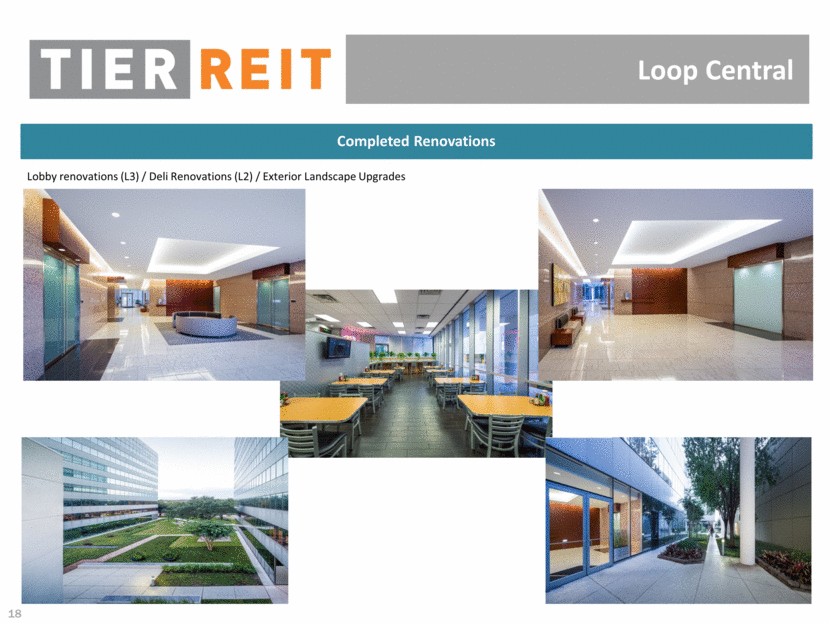
Loop Central Completed Renovations Lobby renovations (L3) / Deli Renovations (L2) / Exterior Landscape Upgrades |
|
|
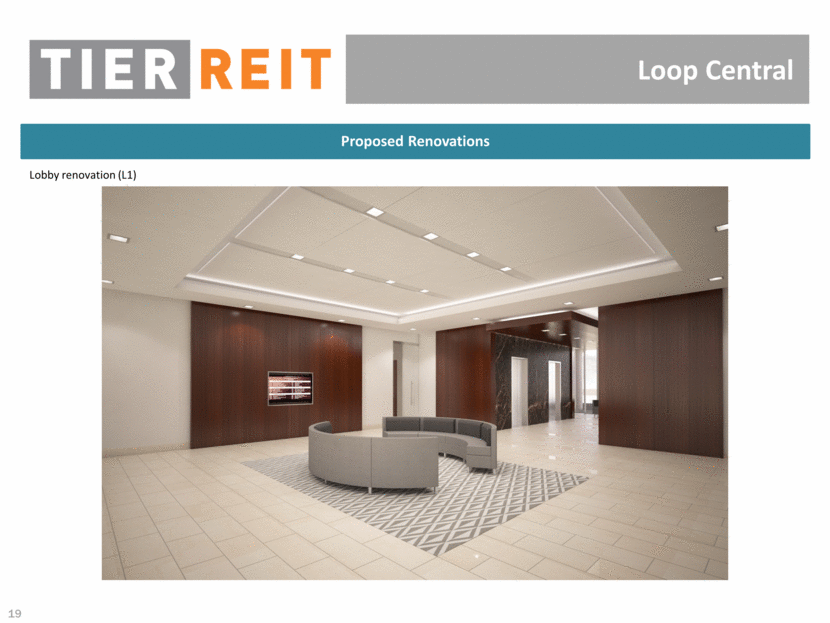
Loop Central Proposed Renovations Lobby renovation (L1) |
|
|
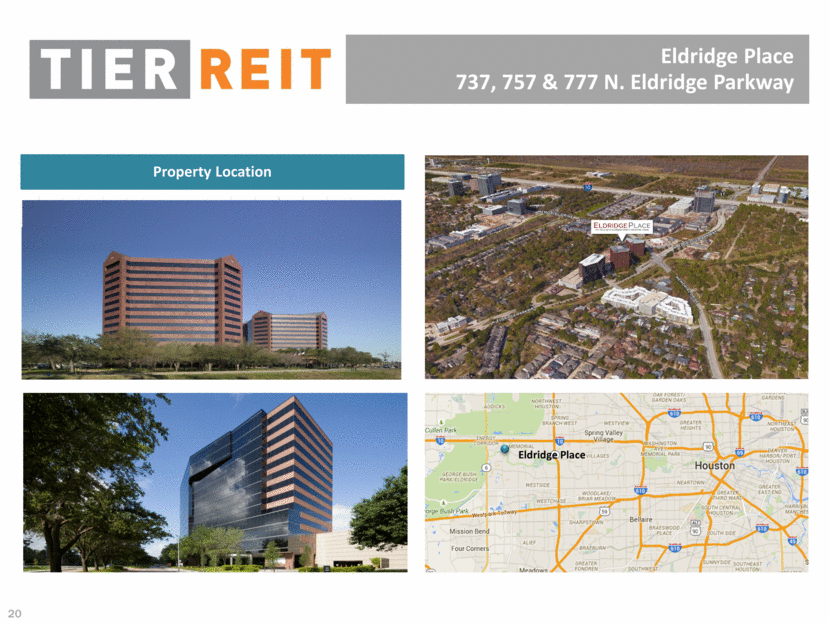
Eldridge Place 737, 757 & 777 N. Eldridge Parkway Property Location Eldridge Place |
|
|
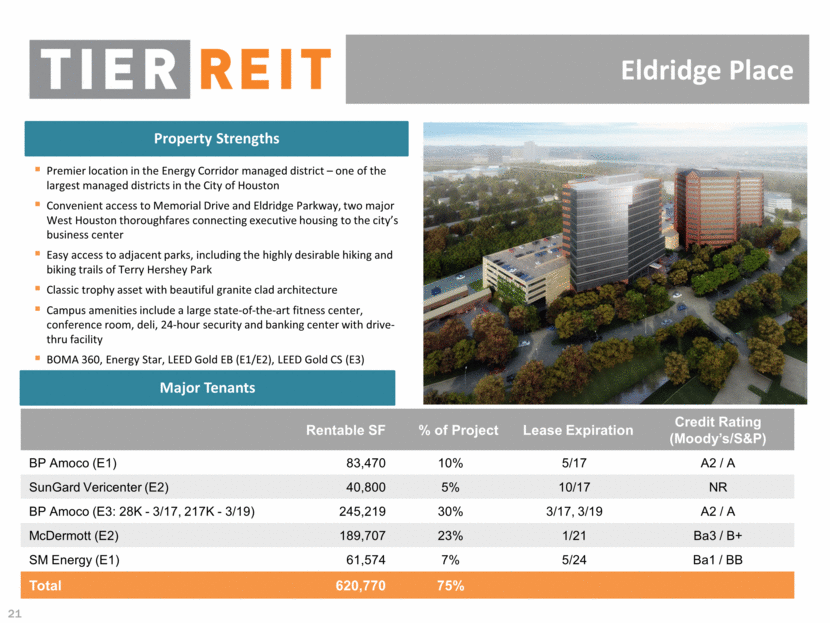
Eldridge Place Property Strengths Premier location in the Energy Corridor managed district – one of the largest managed districts in the City of Houston Convenient access to Memorial Drive and Eldridge Parkway, two major West Houston thoroughfares connecting executive housing to the city’s business center Easy access to adjacent parks, including the highly desirable hiking and biking trails of Terry Hershey Park Classic trophy asset with beautiful granite clad architecture Campus amenities include a large state-of-the-art fitness center, conference room, deli, 24-hour security and banking center with drive-thru facility BOMA 360, Energy Star, LEED Gold EB (E1/E2), LEED Gold CS (E3) Major Tenants Rentable SF % of Project Lease Expiration Credit Rating (Moody’s/S&P) BP Amoco (E1) 83,470 10% 5/17 A2 / A SunGard Vericenter (E2) 40,800 5% 10/17 NR BP Amoco (E3: 28K - 3/17, 217K - 3/19) 245,219 30% 3/17, 3/19 A2 / A McDermott (E2) 189,707 23% 1/21 Ba3 / B+ SM Energy (E1) 61,574 7% 5/24 Ba1 / BB Total 620,770 75% |
|
|
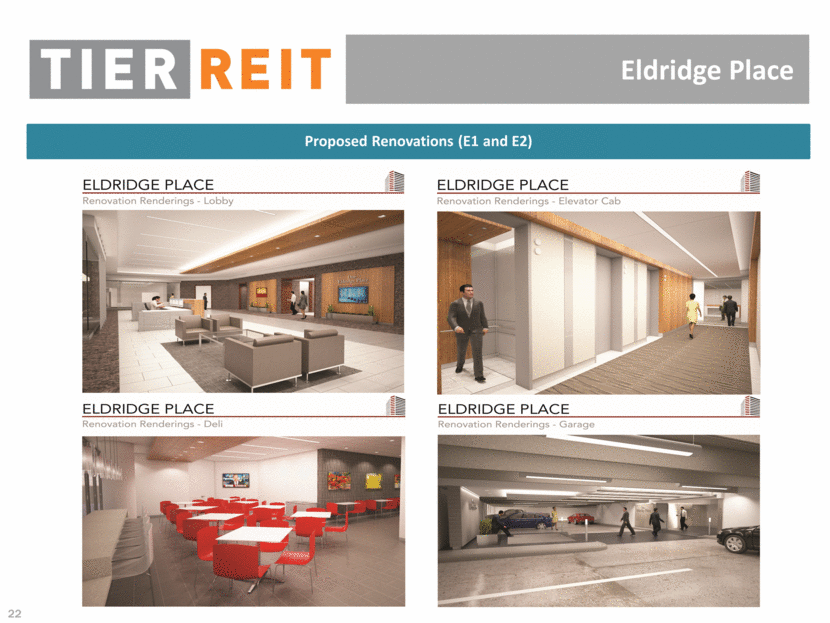
Eldridge Place Proposed Renovations (E1 and E2) |
|
|
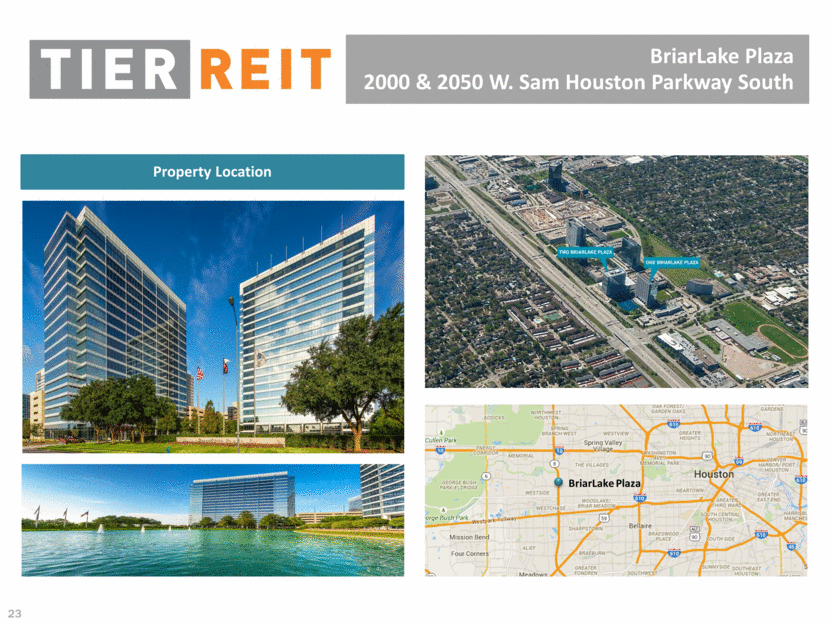
BriarLake Plaza 2000 & 2050 W. Sam Houston Parkway South Property Location BriarLake Plaza |
|
|
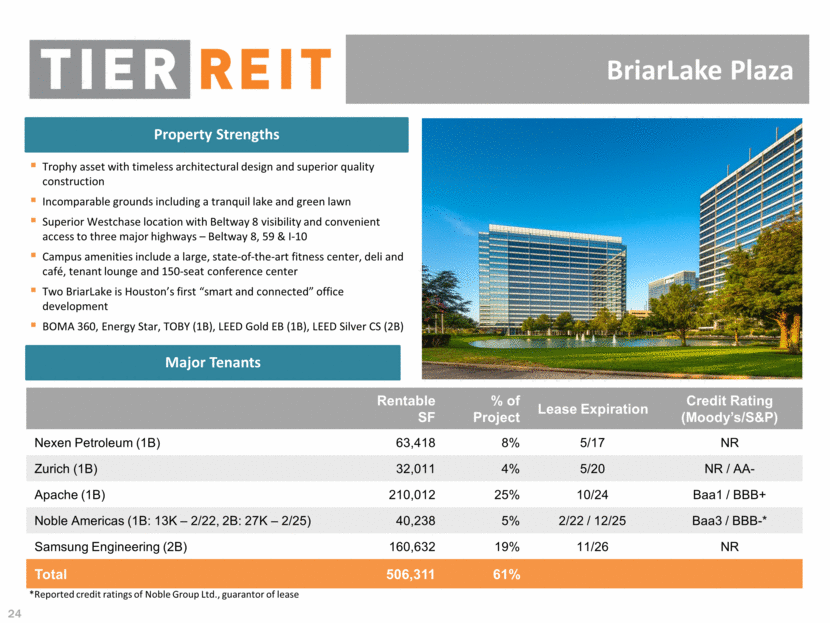
BriarLake Plaza Property Strengths Trophy asset with timeless architectural design and superior quality construction Incomparable grounds including a tranquil lake and green lawn Superior Westchase location with Beltway 8 visibility and convenient access to three major highways – Beltway 8, 59 & I-10 Campus amenities include a large, state-of-the-art fitness center, deli and café, tenant lounge and 150-seat conference center Two BriarLake is Houston’s first “smart and connected” office development BOMA 360, Energy Star, TOBY (1B), LEED Gold EB (1B), LEED Silver CS (2B) Major Tenants Rentable SF % of Project Lease Expiration Credit Rating (Moody’s/S&P) Nexen Petroleum (1B) 63,418 8% 5/17 NR Zurich (1B) 32,011 4% 5/20 NR / AA- Apache (1B) 210,012 25% 10/24 Baa1 / BBB+ Noble Americas (1B: 13K – 2/22, 2B: 27K – 2/25) 40,238 5% 2/22 / 12/25 Baa3 / BBB-* Samsung Engineering (2B) 160,632 19% 11/26 NR Total 506,311 61% *Reported credit ratings of Noble Group Ltd., guarantor of lease |
|
|
[LOGO] |

