Attached files
| file | filename |
|---|---|
| 8-K - 8-K - CENTERPOINT ENERGY INC | d34023d8k.htm |
 Bill
Rogers, EVP & Chief Financial Officer Scott Doyle, SVP Regulatory &
Public Affairs CenterPoint Energy
Electric & Natural Gas Utilities in Texas
September 30, 2015 Exhibit 99.1 |
 investors.centerpointenergy.com
2 Cautionary Statement This presentation contains statements concerning our expectations, beliefs, plans, objectives, goals, strategies, future events
or performance or underlying assumptions (including future dividends) and other statements that are not historical facts. These
statements are “forward-looking statements” within the meaning of the
Private Securities Litigation Reform Act of 1995. You should not place
undue reliance on forward-looking statements. Actual results may differ materially from those expressed or implied by these statements. You can generally identify our forward-looking statements by the words “anticipate,”
“believe,” “continue,” “could,”
“estimate,” “expect,” “forecast,” “goal,” “intend,” “may,” “objective,” “plan,” “potential,” “predict,” “projection,”
“should,” “will,” or other similar words. The
absence of these words, however, does not mean that the statements are not
forward-looking. We have based our forward-looking statements on our management's beliefs and assumptions based on information
currently available to our management at the time the statements are made. We
caution you that assumptions, beliefs, expectations, intentions, and
projections about future events may and often do vary materially from actual results. Therefore, we cannot assure you that actual results will not differ materially from those expressed or implied by our forward-looking
statements. Some of the factors that could cause actual results to differ
from those expressed or implied by our forward-looking statements
include but are not limited to the timing and impact of future regulatory, legislative and IRS decisions, financial market conditions, future market conditions, economic and employment conditions, customer growth and other factors described
in CenterPoint Energy, Inc.’s Form 10-K for the period ended December 31, 2014
under “Risk Factors” and “Management’s
Discussion and Analysis of Financial Condition and Results of Operations - Certain Factors Affecting Future Earnings,” in CenterPoint Energy, Inc.’s Form 10-Q for the quarter ended June 30, 2015 under “Cautionary Statement Regarding Forward-
Looking Information,” “Risk Factors” and “Management’s
Discussion and Analysis of Financial Condition and Results of Operations
of CenterPoint Energy, Inc. and Subsidiaries” and in other filings with the SEC by CenterPoint Energy, which can be found at www.centerpointenergy.com on the Investor Relations page or on the SEC’s website at www.sec.gov.
This presentation contains time sensitive information that is accurate as of the date
hereof. Some of the information in this presentation is unaudited
and may be subject to change. We undertake no obligation to update the information presented herein except as required by law. Investors and others should note that we may announce material information using SEC filings, press releases, public
conference calls, webcasts and the Investors page of our website. In the future,
we will continue to use these channels to distribute material information
about CenterPoint Energy and to communicate important information about CenterPoint Energy, key personnel, corporate initiatives, regulatory updates and other matters. Information that we post on our website could be
deemed material; therefore, we encourage investors, the media, our customers, business
partners and others interested in CenterPoint Energy to review the
information we post on our website. |
 investors.centerpointenergy.com
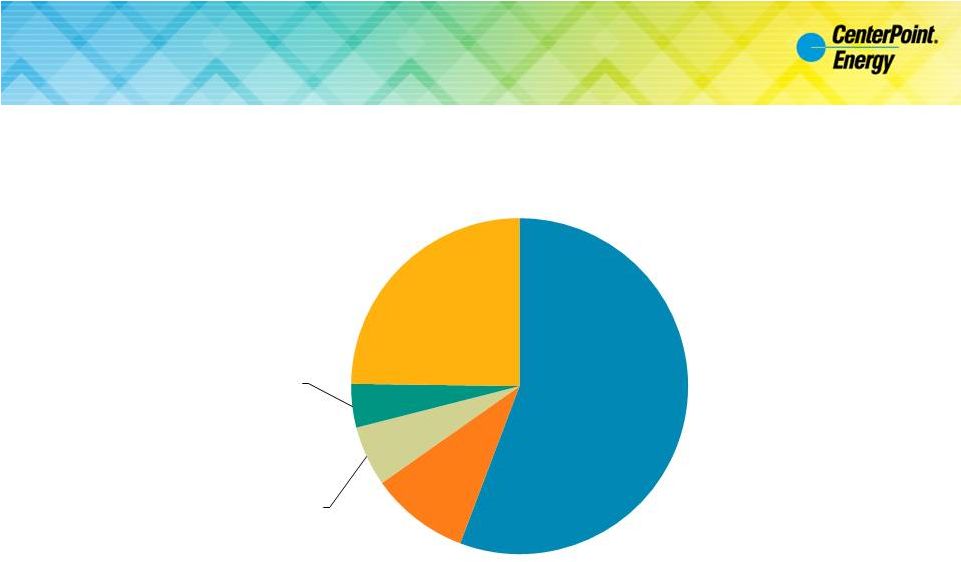
3 2014 Operating Income and Equity in Earnings of Unconsolidated Affiliates 1 2014 10-K, pg. 72, Statement of Consolidated Income, Operating income: $935 million + Equity in earnings of unconsolidated affiliates: $308
million = $1,243 million 2
2014 10-K, pg. 103, Note 9 – Unconsolidated Affiliates, Equity in Earnings of Unconsolidated Affiliates, net, Enable Midstream Partners, LP: $303 million + Southeast Supply Header, LLC: $5 million = $308 million (24.8% of $1,243 million) 3 2014 10-K, pg. 49, Operating Income (Loss) by Business Segment, Energy Services: $52 million (4.1% of $1,243 million)
4 investors.centerpointenergy.com, “Regulatory Information” section, “Natural Gas Utilities” presentation, pgs. 2, 3, 5, 6 - AR Op Income: $40 million, LA Op Income: $13 million, MS Op Income: $8 million, OK Op Income: $7 million; 2014 10-K, pg. 49, Operating Income (Loss) by Business Segment, Other Operations: $1 million, $3
million included for rounding to tie to Natural Gas Distribution
Operating Income = $72 million (5.8% of $1,243 million) 5
investors.centerpointenergy.com, “Regulatory Information” section,
“Natural Gas Utilities” presentation, pg. 4 MN Op Income: $118 million (9.5% of $1,243 million) 6 investors.centerpointenergy.com, “Regulatory Information” section, “Natural Gas Utilities” presentation, pg. 7 TX Op Income:
$98 million; 2014 10-K pg. 49 Operating Income (Loss) by Business
Segment , Electric T&D: $595 million = $693 million (55.8% of $1,243 million) Texas Utilities 55.8% Minnesota 9.5% Arkansas, Louisiana, Oklahoma, Mississippi and Other 5.8% Energy Services 4.1% Midstream Investments 24.8% 2014 Operating Income and Equity in Earnings of Unconsolidated Affiliates Total: $1,243 million 3 4 5 6 2 1 |
 investors.centerpointenergy.com
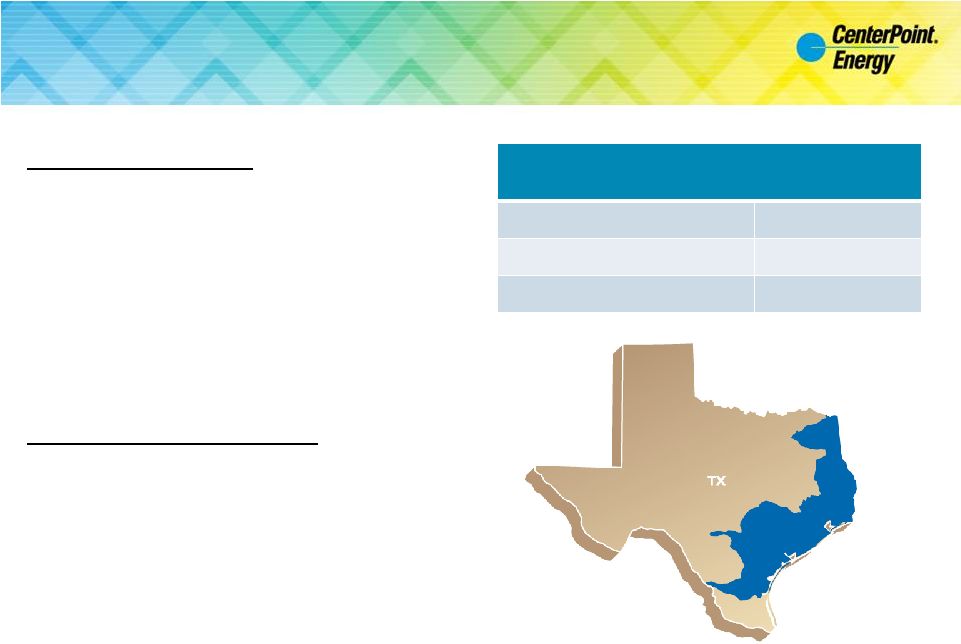
4 Texas Natural Gas Distribution 2014 Key Highlights • Average Rate Base: $815 million • Operating Income: $98 million • Capital Expenditures: $176 million • Miles of Main: 30,986 • Miles of Service: 20,737 Authorized Rate Structure 1,2 • Capital Structure weighted average, 45% Debt / 55% Equity • Authorized weighted average ROE: 10.31% • Authorized weighted average ROR: 8.66% Texas Natural Gas Distribution Customers as of December 31, 2014 Residential 1,546,404 Commercial / Industrial 91,141 Total Customers 1,637,545 1 investors.centerpointenergy.com, “Regulatory Information” section, “Natural Gas Utilities” presentation, pg. 7
2 Blended weighted average of Houston, Texas Coast, South Texas, and Beaumont/East Texas as of March 31, 2015
3 2014 10-K, pg. 5, Natural Gas Distribution customers by state 1 3 |
 investors.centerpointenergy.com
5 Houston Electric Transmission & Distribution 2014 Key Highlights • Average Rate Base: $4,090 million 1 • Operating Income: $477 million 2 • Capital Expenditures: $818 million 3 • 37% Transmission; 59% Distribution • ~55,000 new meters 4 • ERCOT deemed critical the Brazos Valley Connection, an estimated $276-383 million transmission line expected to be in service mid-2018 5 • Authorized ROE: 10% 6 Raising high voltage transmission towers to accommodate new Highway US-99 corridor and serve load growth 1 investors.centerpointenergy.com, “Financial Information” section, “2014 Supplemental Materials” PDF, pg. 9
2 investors.centerpointenergy.com, “Financial Information” section, “2014 Supplemental Materials” PDF, pg. 6
3 investors.centerpointenergy.com, “Financial Information” section, “2014 Supplemental Materials” PDF, pg. 8
4 investors.centerpointenergy.com, “Financial Information” section, “2014 Supplemental Materials” PDF, pg. 3
5 investors.centerpointenergy.com, “Second Quarter 2015 Earnings Call Presentation”, pg. 10
6 investors.centerpointenergy.com, “4 Quarter and Full Year 2014 Earnings Conference Call Transcript”, pg. 17 7 2014 10-K, pg. 50, Electric Transmission & Distribution, Number of metered customers at end of period
Houston Electric Metered Customers as of
December 31, 2014 7 Residential 2,033,027 Total Customers 2,299,247 th |
 investors.centerpointenergy.com
6 Constructive Regulatory Mechanisms in Texas Electric Transmission & Distribution 1 Mechanism Recovers Filing Timeline Distribution Capital Recovery Factor (DCRF) Distribution Capital • Annually in April • Rates effective in September Transmission Cost of Service (TCOS) Transmission Capital • Twice per year • Rates effective ~3 months after filing Energy Efficiency Cost Recovery Factor (EECRF) Energy Efficiency Program Incentive and Expenses • Annually Pension Expense Deferral Pension Expense Variance • Reconciled in future rate case Bad Debt Deferral Bad Debt from Defaults by REPs • Reconciled in future rate case Mechanism Recovers Filing Timeline Gas Reliability Infrastructure Program (GRIP) Capital Investment • Filed annually • Rates effective 60-105 days after filing Pension Expense Deferral Pension Expense Variance • Reconciled in future rate case Texas Natural Gas Distribution 2 1 investors.centerpointenergy.com, “Regulatory Information” section, “Houston Electric” presentation, pg. 2; 2014 10-K, pg.
21, Bad Debt Deferral; 2014 10-K, pg. 44, Pension Expense Deferral
2 investors.centerpointenergy.com, “Regulatory Information” section, “Natural Gas Utilities” presentation, pg. 7
|