Attached files
| file | filename |
|---|---|
| 8-K - FORM 8-K - APX Group Holdings, Inc. | d27979d8k.htm |
| Exhibit 99.1
|

APX Group Holdings, Inc.
Deutsche Bank
Leveraged Finance Conference
September 30, 2015
|
|
preliminary statement
This presentation includes forward-looking statements as defined by the Private Securities Litigation Reform Act of 1995 including statements regarding, among other things, our plans, strategies and prospects, both business and financial. Forward-looking statements convey the Company’s current expectations or forecasts of future events. All statements contained in this presentation other than statements of historical fact are forward-looking statements. These statements are based on the beliefs and assumptions of our management. Although we believe that our plans, intentions and expectations reflected in or suggested by these forward-looking statements are reasonable, we cannot assure you that we will achieve or realize these plans, intentions or expectations. Forward-looking statements are inherently subject to risks, uncertainties and assumptions. These statements may be preceded by, followed by or include the words “believes,” “estimates,” “expects,” “projects,” “forecasts,” “may,” “will,” “should,” “seeks,” “plans,” “scheduled,” “anticipates” or “intends” or similar expressions.
Forward-looking statements are not guarantees of performance. You should not put undue reliance on these statements which speak only as of this date hereof. You should understand that the following important factors, among others, could affect our future results and could cause those results or other outcomes to differ materially from those expressed or implied in our forward-looking statements: (1) risks of the security and home automation industry, including risks of and publicity surrounding the sales, subscriber origination and retention process; (2) the highly competitive nature of the security and home automation industry and product introductions and promotional activity by our competitors; (3) litigation, complaints or adverse publicity; (4) the impact of changes in consumer spending patterns, consumer preferences, local, regional, and national economic conditions, crime, weather, demographic trends and employee availability; (5) adverse publicity and product liability claims; (6) increases and/or decreases in utility and other energy costs, increased costs related to utility or governmental requirements; and (7) cost increases or shortages in security and home automation technology products or components. In addition, the origination and retention of new subscribers will depend on various factors, including, but not limited to, market availability, subscriber interest, the availability of suitable components, the negotiation of acceptable contract terms with subscribers, local permitting, licensing and regulatory compliance, and our ability to manage anticipated expansion and to hire, train and retain personnel, the financial viability of subscribers and general economic conditions. These and other factors that could cause actual results to differ from those implied by the forward-looking statements in this presentation are more fully described in the “Risk Factors” section of our annual report on Form 10-K and subsequent amendment on Form 10-K/A for the year ended December 31, 2014 as such factors may be updated from time to time in our subsequent periodic filings with the SEC. These risk factors should not be construed as exhaustive. We disclaim any obligations to and do not intend to update the above list or to announce publicly the results of any revisions to any of the forward-looking statements to reflect future events or developments. All forward-looking statements attributable to us or persons acting on our behalf are expressly qualified in their entirety by the foregoing cautionary statements. We undertake no obligations to update or revise publicly any forward-looking statements, whether a result of new information, future events, or otherwise.
The estimated third quarter 2015 results included in this presentation are preliminary, unaudited and subject to completion, reflect management’s current views and may change as a result of management’s review of results and other factors, including a wide variety of significant business, economic and competitive risks and uncertainties. Such preliminary results are subject to the closing of the third quarter of 2015 and finalization of accounting procedures (which have yet to be performed) and should not be viewed as a substitute for full quarterly financial statements prepared in accordance with GAAP. We caution you that the third quarter 2015 estimates are forward-looking statements and are not guarantees of future performance or outcomes and that actual results may differ materially from those described in this presentation.
This presentation includes Adjusted EBITDA and Operating Cash Flow, which are supplemental measures that are not required by, or presented in accordance with, accounting principles generally accepted in the United States (“GAAP”). Adjusted EBITDA Operating Cash Flow are not measurements of our financial performance under GAAP and should not be considered as an alternative to net income (loss) or any other measure derived in accordance with GAAP or as alternatives to cash flows from operating activities as a measure of our liquidity. We believe that Adjusted EBITDA and Operating Cash Flow provide useful information about flexibility under our covenants to investors, lenders, financial analysts and rating agencies since these groups have historically used EBITDA-related measures in our industry, along with other measures, to estimate the value of a company, to make informed investment decisions, and to evaluate a company’s ability to meet its debt service requirements. Adjusted EBITDA eliminates the effect of non-cash depreciation of tangible assets and amortization of intangible assets, much of which results from acquisitions accounted for under the purchase method of accounting. Adjusted EBITDA also eliminates the effects of interest rates and changes in capitalization which management believes may not necessarily be indicative of a company’s underlying operating performance. Adjusted EBITDA is also used by us to measure covenant compliance under the indenture governing our senior secured notes, the indenture governing our senior unsecured notes and the credit agreement governing our revolving credit facility. Operating Cash Flow measures available cash for growth by taking Adjusted EBITDA less maintenance capital expenditures. We caution investors that amounts presented in accordance with our definition of Adjusted EBITDA and Operating Cash Flow may not be comparable to similar measures disclosed by other issuers, because not all issuers and analysts calculate Adjusted EBITDA and Operating Cash Flow in the same manner. See the Appendix of this presentation for a reconciliation of Adjusted EBITDA and Operating Cash Flow to net loss for the Company, which we believe is the most closely comparable financial measure calculated in accordance with GAAP. Adjusted EBITDA and Operating Cash Flow should be considered in addition to and not as substitutes for, or superior to, financial measures presented in accordance with GAAP.
2
|
|

executive management team
Chief Financial Officer since November 2013
Prior to joining Vivint, served as Executive Vice President and President of Global Business Services at Alcoa
Spent 12 years at Dell Inc. in various leadership roles including Managing Vice President of Strategic Programs and CFO of the Global Consumer Group
Mark Davies
Chief Financial Officer
[Graphic Appears Here]
Todd Pedersen Alex Dunn Matt Eyring
Chief Executive Officer President Chief Strategy &
Innovation Officer
[Graphic Appears Here]
Bywater Todd Santiago JT Hwang Jefferson Lyman
ting Officer Chief Sales Officer Chief Information Officer Chief Marketing Officer
[Graphic Appears Here]
3
|
|
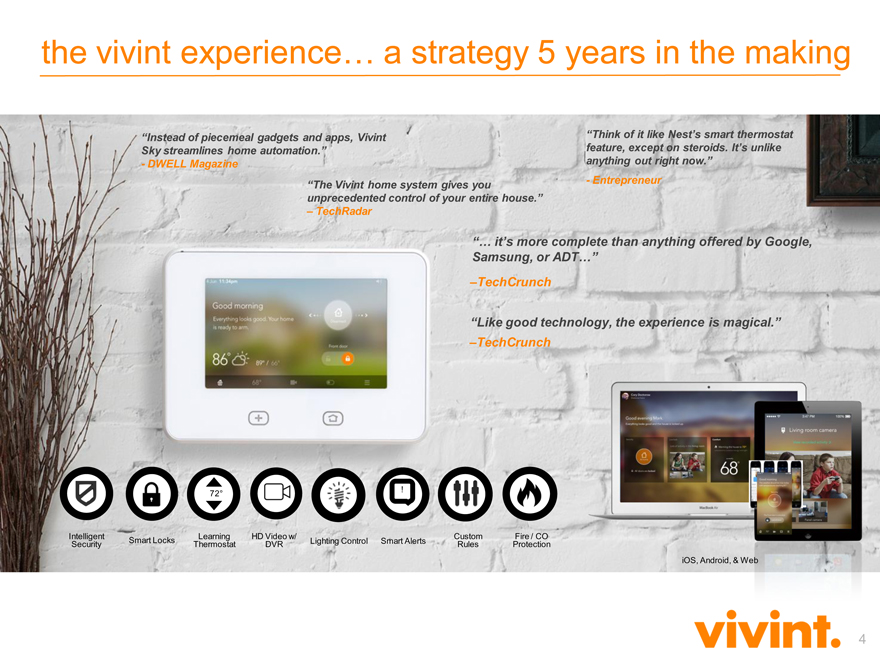
the vivint experience… a strategy 5 years in the making
“Instead of piecemeal gadgets and apps, Vivint Sky streamlines home automation.”
- DWELL Magazine
“The Vivint home system gives you unprecedented control of your entire house.”
– TechRadar
“Think of it like Nest’s smart thermostat feature, except on steroids. It’s unlike anything out right now.”
- Entrepreneur
“… it’s more complete than anything offered by Google,
Samsung, or ADT…”
–TechCrunch
“Like good technology, the experience is magical.”
–TechCrunch
72° !
Intelligent Learning HD Video w/ Custom Fire / CO
Security Smart Locks Thermostat DVR Lighting Control Smart Alerts Rules Protection
iOS, Android, & Web
|
|
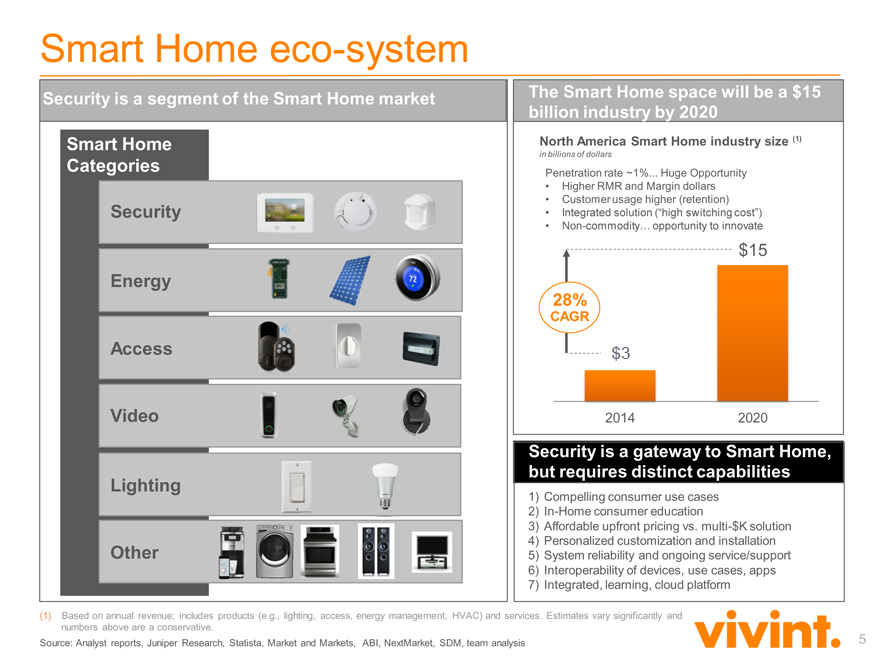
Smart Home eco-system
Security is a segment of the Smart Home market
The Smart Home space will be a $15
billion industry by 2020
Smart Home North America Smart Home industry size (1)
in billions of dollars
Categories Penetration rate ~1% Huge Opportunity
• Higher RMR and Margin dollars
• Customer usage higher (retention)
Security • Integrated solution (“high switching cost”)
• Non-commodity… opportunity to innovate
$15
Energy
28%
CAGR
$3
Access
Video 2014 2020
Security is a gateway to Smart Home,
but requires distinct capabilities
Lighting
1) Compelling consumer use cases
2) In-Home consumer education
3) Affordable upfront pricing vs. multi-$K solution
4) Personalized customization and installation
Other 5) System reliability and ongoing service/support
6) Interoperability of devices, use cases, apps
7) Integrated, learning, cloud platform
Based on annual revenue; includes products (e.g., lighting, access, energy management, HVAC) and services. Estimates vary significantly and numbers above are a conservative.
Source: Analyst reports, Juniper Research, Statista, Market and Markets, ABI, NextMarket, SDM, team analysis
5
|
|
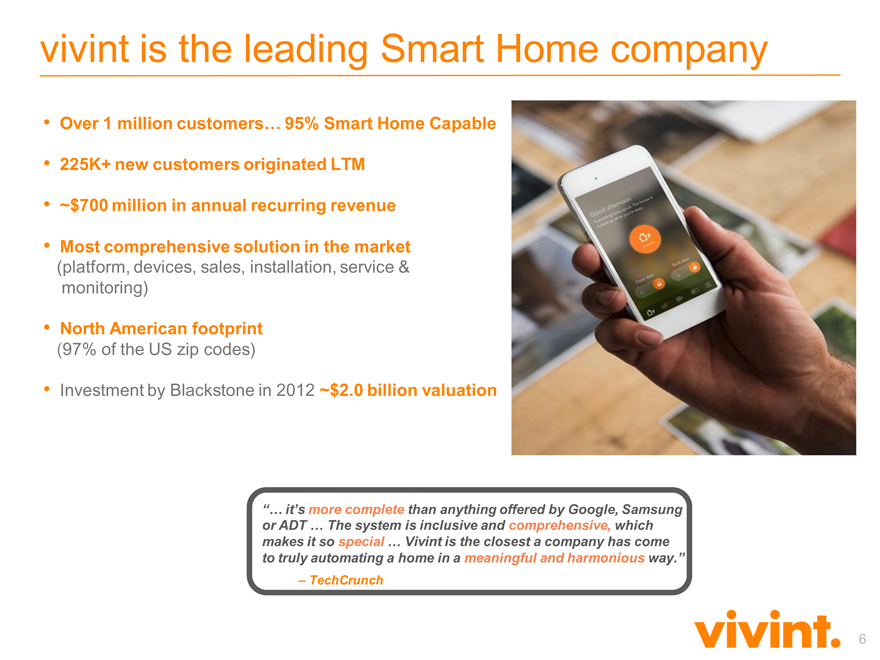
vivint is the leading Smart Home company
Over 1 million customers… 95% Smart Home Capable
225K+ new customers originated LTM
~$700 million in annual recurring revenue
Most comprehensive solution in the market
(platform, devices, sales, installation, service & monitoring)
North American footprint
(97% of the US zip codes)
Investment by Blackstone in 2012 ~$2.0 billion valuation
[Graphic Appears Here]
“… it’s more complete than anything offered by Google, Samsung or ADT … The system is inclusive and comprehensive, which makes it so special … Vivint is the closest a company has come to truly automating a home in a meaningful and harmonious way.”
– TechCrunch
6
|
|
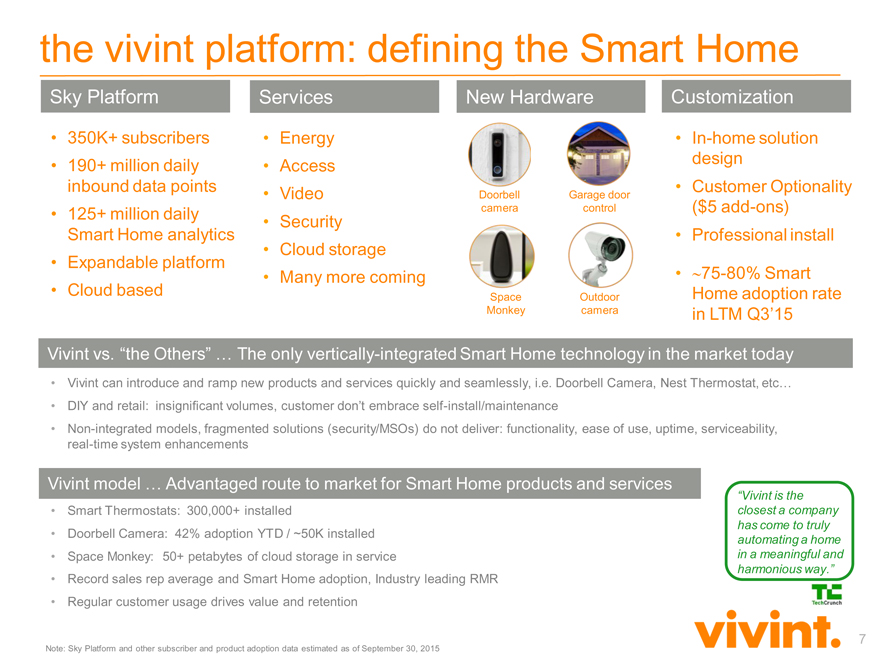
the vivint platform: defining the Smart Home
Sky Platform Services New Hardware Customization
350K+ subscribers Energy In-home solution
190+ million daily Access design
inbound data points • Video Doorbell Garage door • Customer Optionality
125+ million daily camera control($5 add-ons)
• Security
Smart Home analytics • Professional install
• Cloud storage
• Expandable platform • Many more coming • ~75-80% Smart
Cloud based Space Outdoor Home adoption rate
Monkey camera in LTM Q3’15
Vivint vs. “the Others”… The only vertically-integrated Smart Home technology in the market today
Vivint can introduce and ramp new products and services quickly and seamlessly, i.e. Doorbell Camera, Nest Thermostat, etc…
DIY and retail: insignificant volumes, customer don’t embrace self-install/maintenance
Non-integrated models, fragmented solutions (security/MSOs) do not deliver: functionality, ease of use, uptime, serviceability, real-time system enhancements
Vivint model … Advantaged route to market for Smart Home products and services
“Vivint is the
Smart Thermostats: 300,000+ installed closest a company
has come to truly
Doorbell Camera: 42% adoption YTD / ~50K installed automating a home
Space Monkey: 50+ petabytes of cloud storage in service in a meaningful and
harmonious way.”
Record sales rep average and Smart Home adoption, Industry leading RMR
• Regular customer usage drives value and retention
Note: Sky Platform and other subscriber and product adoption data estimated as of September 30, 2015
7
|
|
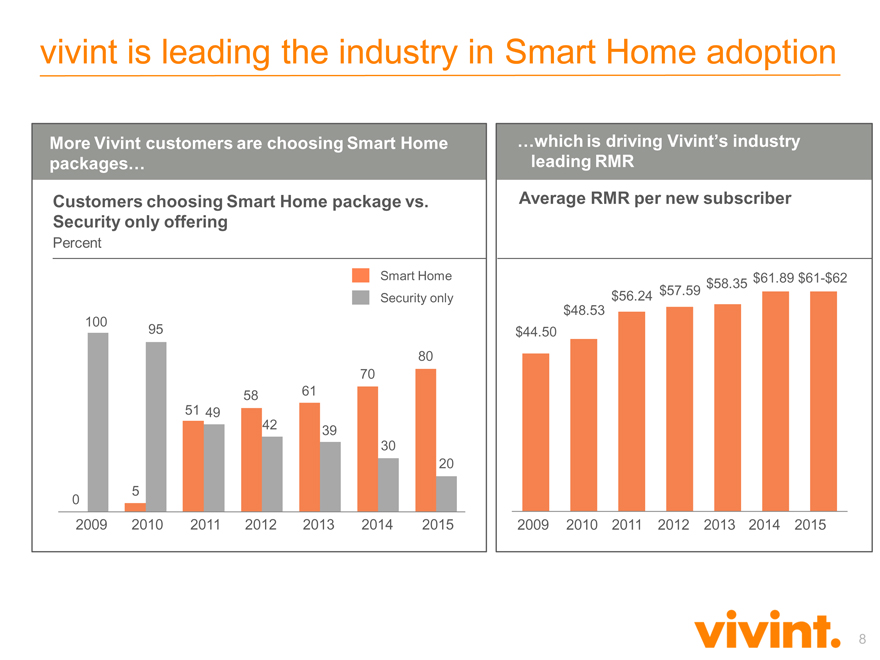
vivint is leading the industry in Smart Home adoption
More Vivint customers are choosing Smart Home …which is driving Vivint’s industry
packages… leading RMR
Customers choosing Smart Home package vs. Average RMR per new subscriber
Security only offering
Percent
Smart Home $58.35 $61.89 $61-$62
Security only $56.24 $57.59
$48.53
100 95 $44.50
80
70
58 61
51 49
42 39
30
20
0 5
2009 2010 2011 2012 2013 2014 2015 2009 2010 2011 2012 2013 2014 2015
8
|
|
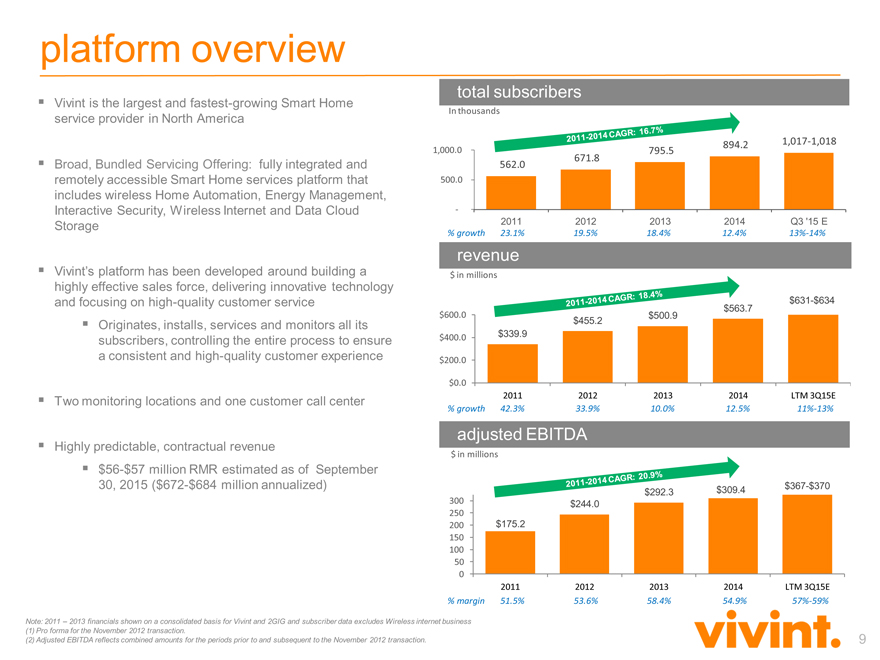
platform overview
Vivint is the largest and fastest-growing Smart Home service provider in North America
Broad, Bundled Servicing Offering: fully integrated and remotely accessible Smart Home services platform that includes wireless Home Automation, Energy Management, Interactive Security, Wireless Internet and Data Cloud Storage
Vivint’s platform has been developed around building a highly effective sales force, delivering innovative technology and focusing on high-quality customer service
Originates, installs, services and monitors all its subscribers, controlling the entire process to ensure a consistent and high-quality customer experience
Two monitoring locations and one customer call center
Highly predictable, contractual revenue
$56-$57 million RMR estimated as of September 30, 2015 ($672-$684 million annualized)
total subscribers
In thousands
894.2 1,017-1,018
1,000.0 795.5
671.8
562.0
500.0
-
2011 2012 2013 2014 Q3 ‘15 E
% growth 23.1% 19.5% 18.4% 12.4% 13%-14%
revenue
$ in millions
$631-$634
$563.7
$600.0 $500.9
$455.2
$400.0 $339.9
$200.0
$0.0
2011 2012 2013 2014 LTM 3Q15E
% growth 42.3% 33.9% 10.0% 12.5% 11%-13%
adjusted EBITDA
$ in millions
$292.3 $309.4 $367-$370
300 $244.0
250
200 $175.2
150
100
50
0
2011 2012 2013 2014 LTM 3Q15E
% margin 51.5% 53.6% 58.4% 54.9% 57%-59%
Note: 2011 – 2013 financials shown on a consolidated basis for Vivint and 2GIG and subscriber data excludes Wireless internet business
(1) Pro forma for the November 2012 transaction.
(2) Adjusted EBITDA reflects combined amounts for the periods prior to and subsequent to the November 2012 transaction. 9
|
|
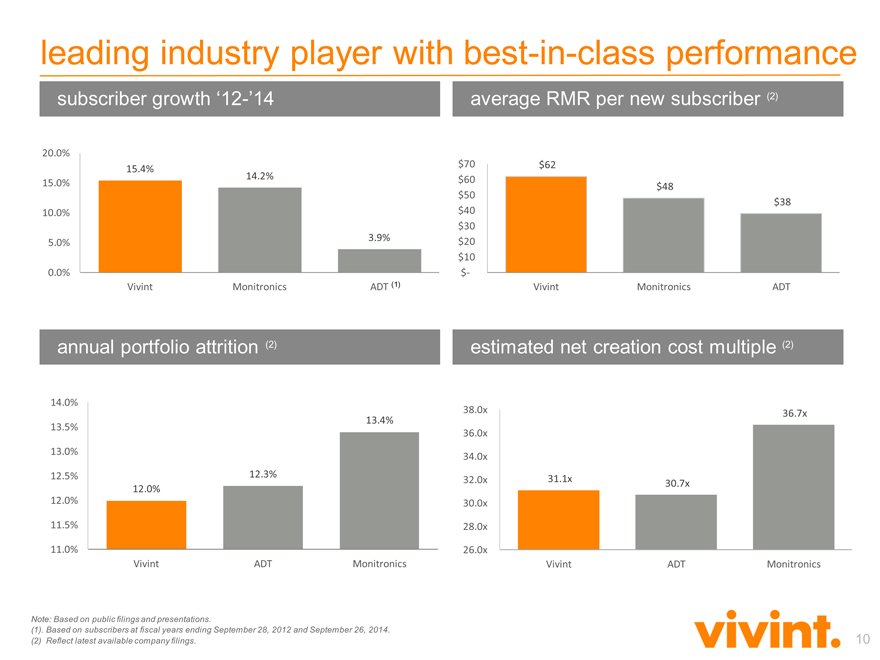
leading industry player with best-in-class performance
subscriber growth ‘12-’14 average RMR per new subscriber(2)
20.0%
15.4% $70 $62
14.2%
15.0% $60 $48
$50
$38
10.0% $40
$30
5.0% 3.9% $20
$10
0.0% $-
Vivint Monitronics ADT (1) Vivint Monitronics ADT
annual portfolio attrition (2) estimated net creation cost multiple (2)
14.0%
38.0x 36.7x
13.4%
13.5% 36.0x
13.0% 34.0x
12.5% 12.3% 32.0x 31.1x 30.7x
12.0%
12.0% 30.0x
11.5% 28.0x
11.0% 26.0x
Vivint ADT Monitronics Vivint ADT Monitronics
Note: Based on public filings and presentations.
(1). Based on subscribers at fiscal years ending September 28, 2012 and September 26, 2014.
(2) Reflect latest available company filings. 10
|
|
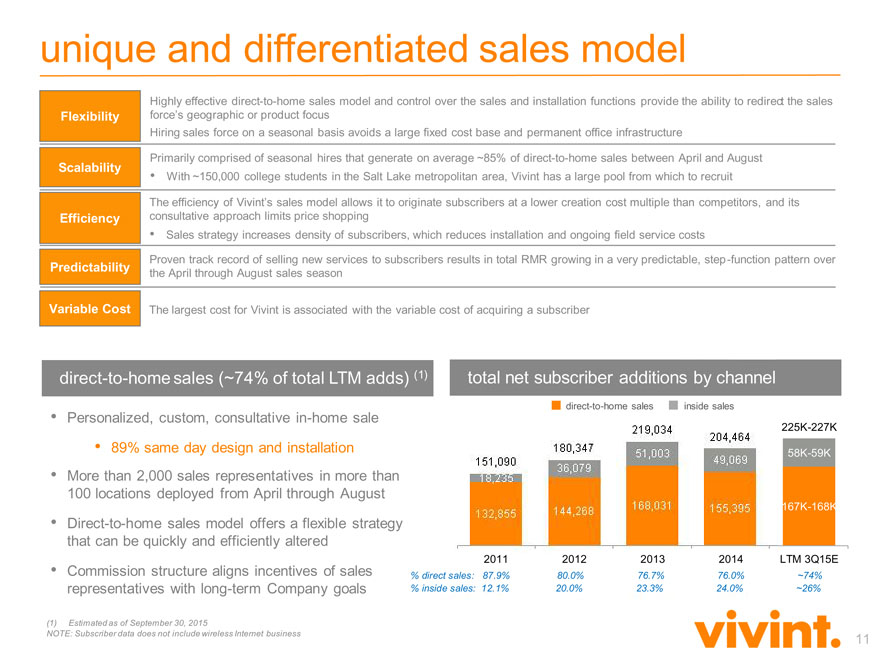
unique and differentiated sales model
Highly effective direct-to-home sales model and control over the sales and installation functions provide the ability to redirect the sales
Flexibility force’s geographic or product focus
Hiring sales force on a seasonal basis avoids a large fixed cost base and permanent office infrastructure
Primarily comprised of seasonal hires that generate on average ~85% of direct-to-home sales between April and August
Scalability • With ~150,000 college students in the Salt Lake metropolitan area, Vivint has a large pool from which to recruit
The efficiency of Vivint’s sales model allows it to originate subscribers at a lower creation cost multiple than competitors, and its
Efficiency consultative approach limits price shopping
• Sales strategy increases density of subscribers, which reduces installation and ongoing field service costs
Proven track record of selling new services to subscribers results in total RMR growing in a very predictable, step -function pattern over
Predictability the April through August sales season
Variable Cost The largest cost for Vivint is associated with the variable cost of acquiring a subscriber
direct-to-home sales (~74% of total LTM adds) (1)
total net subscriber additions by channel
Personalized, custom, consultative in-home sale
89% same day design and installation
More than 2,000 sales representatives in more than 100 locations deployed from April through August
Direct-to-home sales model offers a flexible strategy that can be quickly and efficiently altered
Commission structure aligns incentives of sales representatives with long-term Company goals
direct-to-home sales inside sales
225K-227K
204,464
58K-59K
49,069
151,090 18,235 132,855
180,347 36,079 144,268
219,034 51,003 168,031
155395
167K-168K
2011 2012 2013 2014 LTM 3Q15E
% direct sales: 87.9% 80.0% 76.7% 76.0% ~74%
% inside sales: 12.1% 20.0% 23.3% 24.0% ~26%
(1) Estimated as of September 30, 2015
NOTE: Subscriber data does not include wireless Internet business 11
|
|
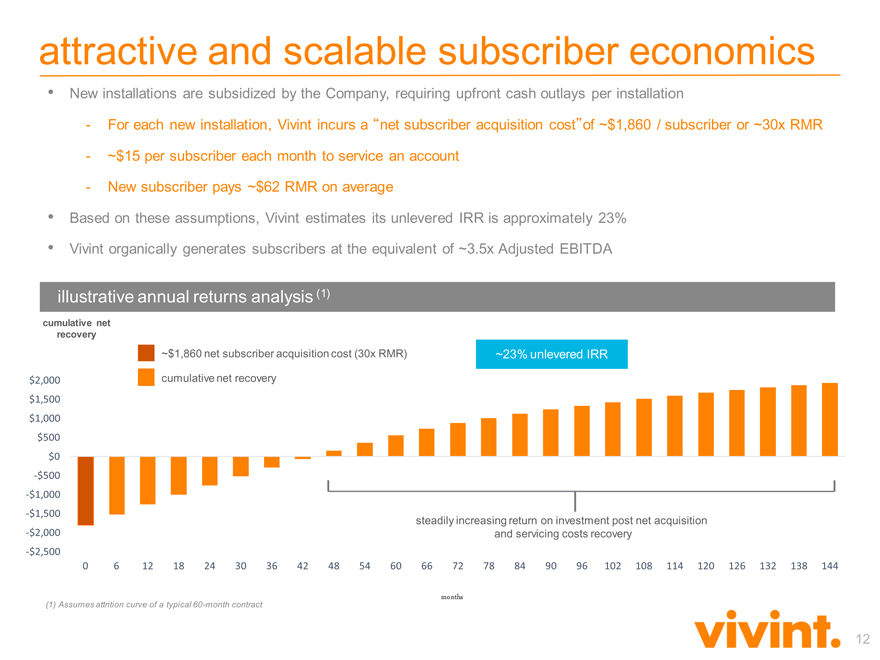
attractive and scalable subscriber economics
New installations are subsidized by the Company, requiring upfront cash outlays per installation
For each new installation, Vivint incurs a “net subscriber acquisition cost“of ~$1,860 / subscriber or ~30x RMR
~$15 per subscriber each month to service an account
New subscriber pays ~$62 RMR on average
Based on these assumptions, Vivint estimates its unlevered IRR is approximately 23%
Vivint organically generates subscribers at the equivalent of ~3.5x Adjusted EBITDA
illustrative annual returns analysis (1)
cumulative net
recovery
~$1,860 net subscriber acquisition cost (30x RMR) ~23% unlevered IRR
$2,000 cumulative net recovery
$1,500
$1,000
$500
$0
-$500
-$1,000
-$1,500
steadily increasing return on investment post net acquisition
-$2,000 and servicing costs recovery
-$2,500
0 6 12 18 24 30 36 42 48 54 60 66 72 78 84 90 96 102 108 114 120 126 132 138 144
months
(1) Assumes attrition curve of a typical 60-month contract
12
|
|
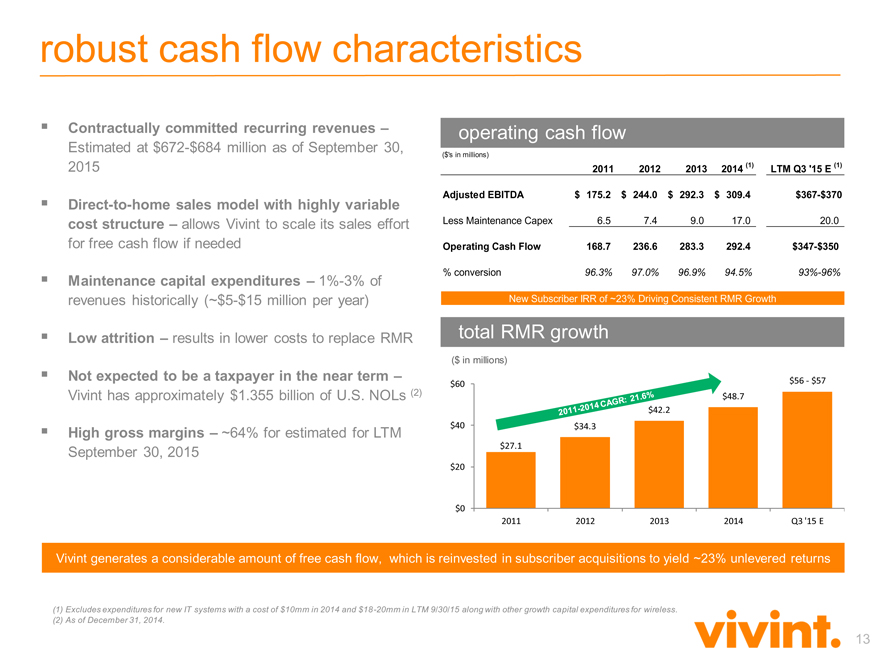
robust cash flow characteristics
Contractually committed recurring revenues –
Estimated at $672-$684 million as of September 30, 2015
Direct-to-home sales model with highly variable cost structure – allows Vivint to scale its sales effort for free cash flow if needed
Maintenance capital expenditures – 1%-3% of revenues historically (~$5-$15 million per year)
Low attrition – results in lower costs to replace RMR
Not expected to be a taxpayer in the near term –
Vivint has approximately $1.355 billion of U.S. NOLs (2)
High gross margins – ~64% for estimated for LTM September 30, 2015
operating cash flow
($‘s in millions)
2011 2012 2013 2014 (1) LTM Q3 ‘15 E (1)
Adjusted EBITDA $ 175.2 $ 244.0 $ 292.3 $ 309.4 $367-$370
Less Maintenance Capex 6.5 7.4 9.0 17.0 20.0
Operating Cash Flow 168.7 236.6 283.3 292.4 $347-$350
% conversion 96.3% 97.0% 96.9% 94.5% 93%-96%
New Subscriber IRR of ~23% Driving Consistent RMR Growth
total RMR growth
($ in millions)
$60 $56—$57
$48.7
$42.2
$40 $34.3
$27.1
$20
$0
2011 2012 2013 2014 Q3 ‘15 E
Vivint generates a considerable amount of free cash flow, which is reinvested in subscriber acquisitions to yield ~23% unlevered returns
Excludes expenditures for new IT systems with a cost of $10mm in 2014 and $18 -20mm in LTM 9/30/15 along with other growth capital expenditures for wireless.
As of December 31, 2014.
13
|
|
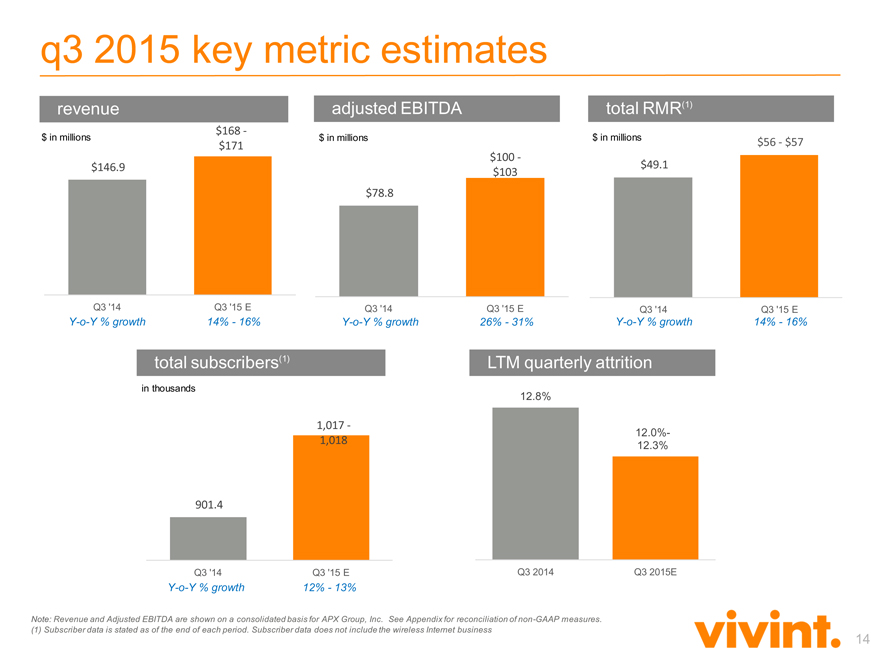
q3 2015 key metric estimates
revenue adjusted EBITDA total RMR(1)
$168 -
$ in millions $ in millions $ in millions
$171 $56—$57
$100 -
$146.9 $49.1
$103
$78.8
Q3 ‘14 Q3 ‘15 E Q3 ‘14 Q3 ‘15 E Q3 ‘14 Q3 ‘15 E
Y-o-Y % growth 14%—16% Y-o-Y % growth 26%—31% Y-o-Y % growth 14%—16%
total subscribers(1) LTM quarterly attrition
in thousands
12.8%
1,017 -
12.0%-
1,018 12.3%
901.4
Q3 ‘14 Q3 ‘15 E Q3 2014 Q3 2015E
Y-o-Y % growth 12%—13%
Note: Revenue and Adjusted EBITDA are shown on a consolidated basis for APX Group, Inc. See Appendix for reconciliation of non-GAAP measures. (1) Subscriber data is stated as of the end of each period. Subscriber data does not include the wireless Internet business
14
|
|
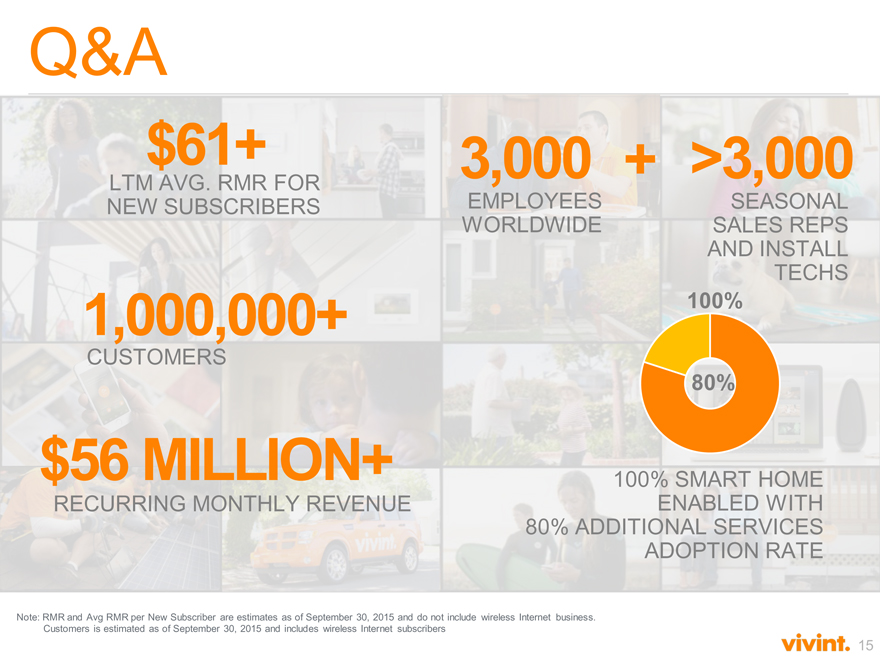
Q&A
$61+ 3,000 + >3,000
LTM AVG. RMR FOR
NEW SUBSCRIBERS EMPLOYEES SEASONAL
WORLDWIDE SALES REPS
AND INSTALL
TECHS
1,000,000+ 100%
CUSTOMERS
80%
$56 MILLION+ 100% SMART HOME
RECURRING MONTHLY REVENUE ENABLED WITH
80% ADDITIONAL SERVICES
ADOPTION RATE
Note: RMR and Avg RMR per New Subscriber are estimates as of September 30, 2015 and do not include wireless Internet business. Customers is estimated as of September 30, 2015 and includes wireless Internet subscribers
15
|
|
Appendix
|
|
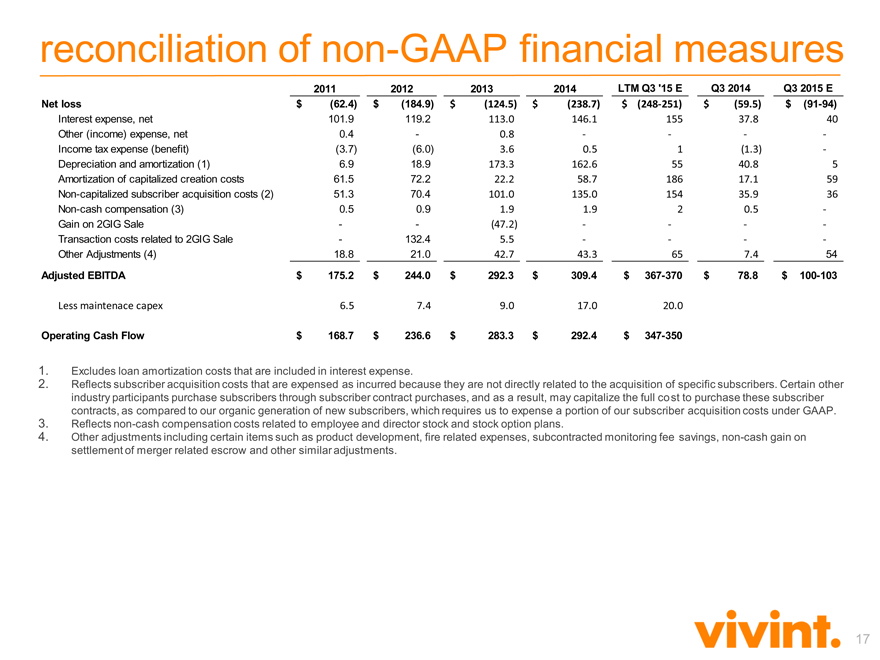
reconciliation of non-GAAP financial measures
2011 2012 2013 2014 LTM Q3 ‘15 E Q3 2014 Q3 2015 E
Net loss $ (62.4) $(184.9) $(124.5) $(238.7) $(248-251) $(59.5) $(91-94)
Interest expense, net 101.9 119.2 113.0 146.1 155 37.8 40
Other (income) expense, net 0.4—0.8 — —
Income tax expense (benefit)(3.7)(6.0) 3.6 0.5 1(1.3) -
Depreciation and amortization (1) 6.9 18.9 173.3 162.6 55 40.8 5
Amortization of capitalized creation costs 61.5 72.2 22.2 58.7 186 17.1 59
Non-capitalized subscriber acquisition costs (2) 51.3 70.4 101.0 135.0 154 35.9 36
Non-cash compensation (3) 0.5 0.9 1.9 1.9 2 0.5 -
Gain on 2GIG Sale —(47.2) — —
Transaction costs related to 2GIG Sale—132.4 5.5 — —
Other Adjustments (4) 18.8 21.0 42.7 43.3 65 7.4 54
Adjusted EBITDA $ 175.2 $ 244.0 $ 292.3 $ 309.4 $ 367-370 $ 78.8 $ 100-103
Less maintenace capex 6.5 7.4 9.0 17.0 20.0
Operating Cash Flow $ 168.7 $ 236.6 $ 283.3 $ 292.4 $ 347-350
Excludes loan amortization costs that are included in interest expense.
Reflects subscriber acquisition costs that are expensed as incurred because they are not directly related to the acquisition of specific subscribers. Certain other industry participants purchase subscribers through subscriber contract purchases, and as a result, may capitalize the full co st to purchase these subscriber contracts, as compared to our organic generation of new subscribers, which requires us to expense a portion of our subscriber acquisition costs under GAAP.
Reflects non-cash compensation costs related to employee and director stock and stock option plans.
Other adjustments including certain items such as product development, fire related expenses, subcontracted monitoring fee savings, non-cash gain on settlement of merger related escrow and other similar adjustments.
17
|
|
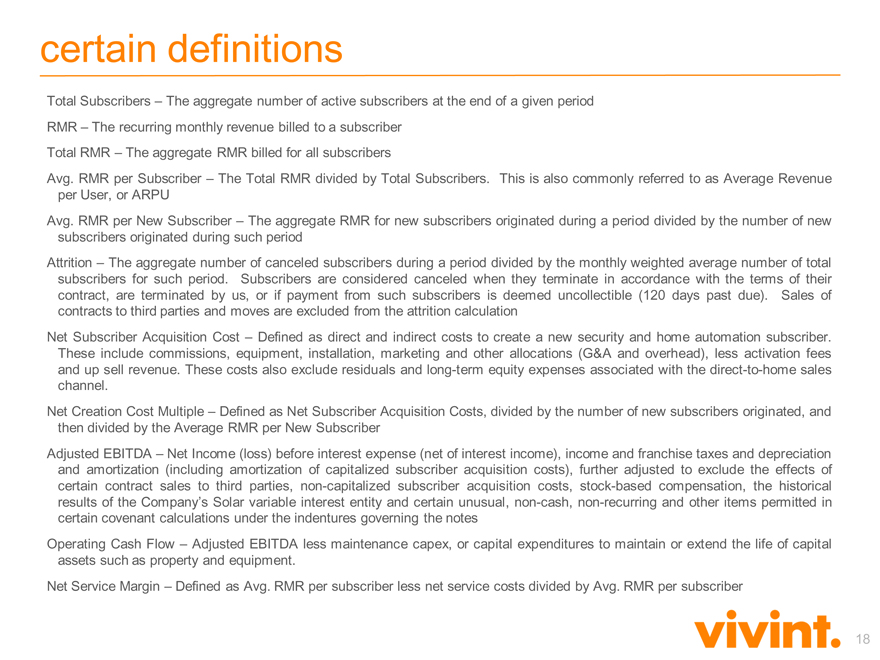
certain definitions
Total Subscribers – The aggregate number of active subscribers at the end of a given period RMR – The recurring monthly revenue billed to a subscriber Total RMR – The aggregate RMR billed for all subscribers
Avg. RMR per Subscriber – The Total RMR divided by Total Subscribers. This is also commonly referred to as Average Revenue per User, or ARPU
Avg. RMR per New Subscriber – The aggregate RMR for new subscribers originated during a period divided by the number of new subscribers originated during such period Attrition – The aggregate number of canceled subscribers during a period divided by the monthly weighted average number of total subscribers for such period. Subscribers are considered canceled when they terminate in accordance with the terms of their contract, are terminated by us, or if payment from such subscribers is deemed uncollectible (120 days past due). Sales of contracts to third parties and moves are excluded from the attrition calculation Net Subscriber Acquisition Cost – Defined as direct and indirect costs to create a new security and home automation subscriber.
These include commissions, equipment, installation, marketing and other allocations (G&A and overhead), less activation fees and up sell revenue. These costs also exclude residuals and long-term equity expenses associated with the direct-to-home sales channel.
Net Creation Cost Multiple – Defined as Net Subscriber Acquisition Costs, divided by the number of new subscribers originated, and then divided by the Average RMR per New Subscriber Adjusted EBITDA – Net Income (loss) before interest expense (net of interest income), income and franchise taxes and depreciation and amortization (including amortization of capitalized subscriber acquisition costs), further adjusted to exclude the effects of certain contract sales to third parties, non-capitalized subscriber acquisition costs, stock-based compensation, the historical results of the Company’s Solar variable interest entity and certain unusual, non-cash, non-recurring and other items permitted in certain covenant calculations under the indentures governing the notes Operating Cash Flow – Adjusted EBITDA less maintenance capex, or capital expenditures to maintain or extend the life of capital assets such as property and equipment.
Net Service Margin – Defined as Avg. RMR per subscriber less net service costs divided by Avg. RMR per subscriber
18