Attached files
| file | filename |
|---|---|
| 8-K - FORM 8-K - Fenix Parts, Inc. | d62464d8k.htm |
 Investor Presentation September 2015 Exhibit 99.1 |
 1 Safe Harbor Statement FORWARD-LOOKING STATEMENTS Certain statements contained in this presentation are “forward-looking statements.” We have based these forward-looking
statements on our current expectations and projections about future
events. However, these forward-looking statements are subject to risks,
uncertainties, assumptions and other factors that may cause our actual results,
performance or achievements to be materially different. Some of these
risks, include, among other things: our lack of combined operating history and our ability to successfully integrate the Founding Companies into one entity; our ability to successfully locate and acquire additional businesses that provide recycled OEM
automotive products and our ability to successfully integrate any
acquired companies with our business; our success in managing our
internal growth; competition from vehicle replacement parts companies, including but
not limited to those that provide recycled parts; our ability to maintain
our relationships with auto body shops, insurers and other customers and with auction companies from which we purchase our salvage vehicles; our compliance and our Founding Companies’ past compliance with environmental laws and regulations
and federal, state and local operating and permit requirements; the known
environmental liabilities at Standard’s Toronto, Ontario facility
associated with groundwater and surface water contamination as a result of historical
releases and a petroleum hydrocarbon spill in November 2010; potential
for significant impairment of goodwill and intangibles; fluctuations in the prices of scrap metal and other metals; changes in the national, provincial or state laws and regulations affecting our business; disruptions in the information technology systems
on which our business relies; and material weaknesses in our internal
control over financial reporting. For a more detailed discussion of these
and risks, see the documents and reports that we have filed with the Securities and Exchange Commission (the “SEC”). Given these risks and uncertainties, you are cautioned not to place undue reliance on our forward-looking statements. Projections and
other forward-looking statements included in this presentation have
been prepared based on assumptions, which we believe to be reasonable,
but not in accordance with GAAP or any guidelines of the SEC. Actual results may vary, perhaps materially. You are strongly cautioned not to place undue reliance on such projections and other forward-looking statements. All written and oral forward-looking
statements attributable to us or to persons acting on our behalf are
expressly qualified in their entirety by these cautionary statements.
Except as required by federal securities laws, we disclaim any intention or obligation
to update or revise any forward-looking statements, whether as a
result of new information, future events or otherwise. Any such forward-looking statements, whether made in this presentation or elsewhere, should be considered in the context of the various disclosures made by us about our businesses including,
without limitation, the risk factors discussed above.
|
 2 A Look Into Fenix Parts |
 3 Presenters • Former Vice President of Stericycle Inc. (NASDAQ:SRCL), a national reverse logistics and regulated waste management company Operational and P/L responsibilities for 150,000 customers generating $500 million in revenue Executed the consolidation and integration strategy of Stericycle – managing or facilitating over 70 different acquisitions ranging in size from $1 million to $200
million • Co-founded American Medical Disposal in 1990, which was acquired by Stericycle in
2001 Professional Executive Management Team With Deep Bench Strength Industry expertise Operations emphasis Distribution and logistics Business development and expansion Integration and systems Public company experience Kent Robertson, Chief Executive Officer • Former Chief Financial Officer of Insurance Auto Auctions, Inc. (IAAI), a leading
provider of salvage vehicle auction services for insurance companies
CFO during IAAI’s rapid growth, expanding from 48 to 150 auction locations
while increasing EBITDA from $20 million to what is now over $200
million Converted diverse systems, business processes into an integrated
platform for growth
•
Previously CFO of Globe and Vistar Auto Glass; merged #2 and #3 in the industry
prior to sale to Safelite
Scott Pettit, Chief Financial Officer |
 4 Why Invest in Fenix Parts? Recycled original equipment is the product of choice in the attractive/desirable automotive replacement parts marketplace (represents a $60B+ opportunity plus the do-it-yourself market) Right Product Offering in Huge Market Clear economic benefits to the consolidation and integration of recyclers of original equipment parts into a highly profitable, scaleable national platform Right Business Model in a Highly Fragmented Segment Consolidation of the industry with a strong second player makes sense for Fenix, the recycling industry and our shareholders. Fenix has a unique opportunity for growth and ability to profitably drive inventory more efficiently through its network to its customers Right Opportunity to Create Shareholder Value Fenix has a proven executive leadership team, management and board committed to creating value for shareholders as it executes on its business plan and creates a premier auto parts recycler Right Management Team to Deliver |
 5 Our $61 Billion Marketplace Key Highlights Do-It-For-Me $165 billion Do-It- Yourself $48 billion Source: Auto Care Association Digital Auto Care Factbook, 24 th Edition 2015; 2014 data is estimated, excludes tires Participate primarily in two repair shop segments Collision ($15 billion) Doors, hoods, trunk lids, etc. Mechanical ($46 billion) Engines, transmissions, etc. Do-It-Yourself Key drivers of market size Vehicles on the road Miles driven Age of vehicles Collision rates Mechanical Parts $46 billion Collision Parts $15 billion Market Opportunity Market Opportunity Do-It- Yourself $48 billion Mechanical Parts $46 billion Labor and Mark Up $104 billion Collision Parts $15 billion |
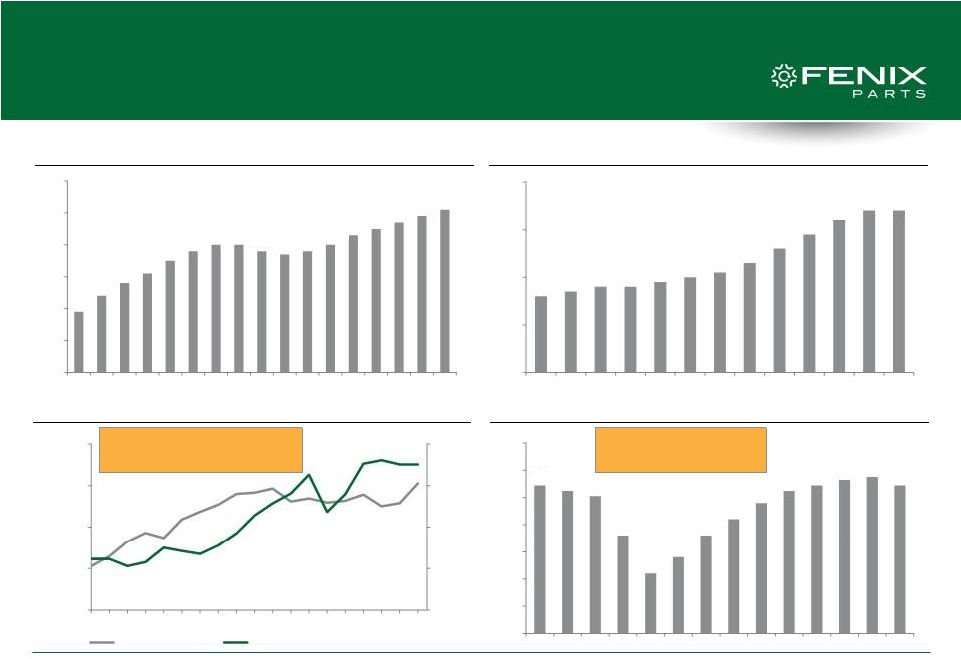 6 U.S. Miles Traveled (millions) / Avg. U.S. Retail Gas Prices U.S. Light Vehicles In Use (millions) Large and Stable Market U.S. Light Vehicle Age U.S. Light Vehicle Sales (millions) Source: AASA, POLK 2014, U.S. Department of Transportation, U.S. Energy Information Administration, Ward’s, Gabelli & Company Estimates • Stable even at high gas prices • Expect growth with lower gas prices • Higher repair rate • Higher parts spend per repair 229 234 238 241 245 248 250 250 248 247 248 250 253 255 257 259 261 210 220 230 240 250 260 270 2002 2004 2006 2008 2010 2012 2014 2016P 2018P 9.6 9.7 9.8 9.8 9.9 10 10.1 10.3 10.6 10.9 11.2 11.4 11.4 8.0 9.0 10.0 11.0 12.0 2002 2003 2004 2005 2006 2007 2008 2009 2010 2011 2012 2013 2014 $0.00 $1.00 $2.00 $3.00 $4.00 175,000 200,000 225,000 250,000 275,000 1996 1999 2002 2005 2008 2011 2014 U.S. Miles Traveled Avg U.S. All Grades Retail Gas Prices 16.9 16.5 16.1 13.2 10.4 11.6 13.2 14.4 15.6 16.5 16.9 17.3 17.5 16.9 6.0 8.0 10.0 12.0 14.0 16.0 18.0 20.0 2005 2007 2009 2011 2013 2015P 2017P |
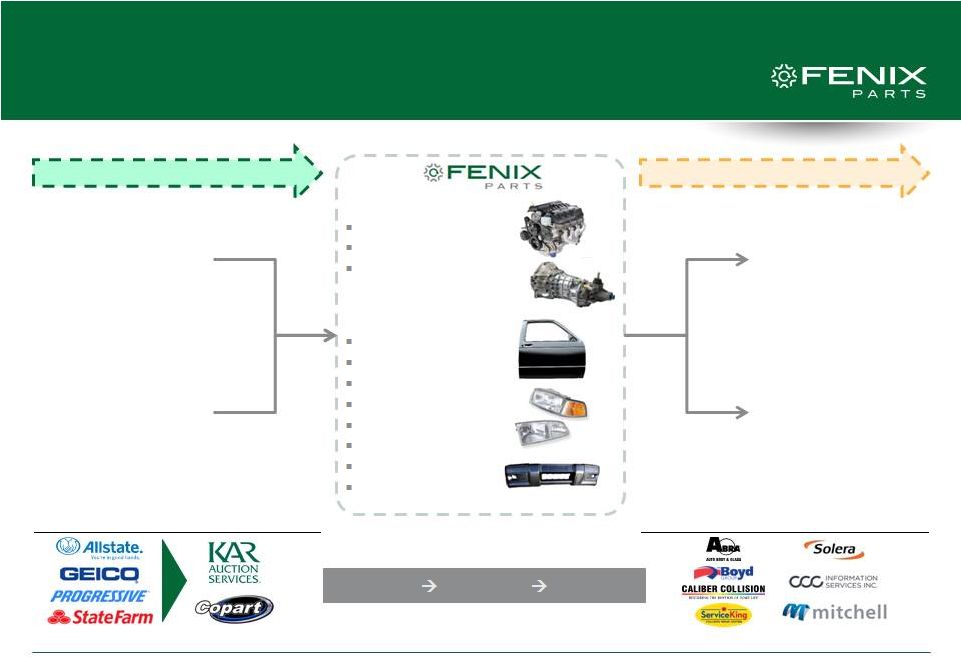 7 Critical Link In The Supply Chain RECYCLED OEM PARTS VEHICLES Mechanical Engines Transmissions Transfer cases Collision Doors Hoods Trunk lids Lights / lamps Fenders Bumpers Wheels / tires Assemblies Auto Auctions Consumers Repair Shops Consumers Buy Cars Dismantle Distribute Established Supply Chain Professionalized Segment Participants Fenix Value-Add |
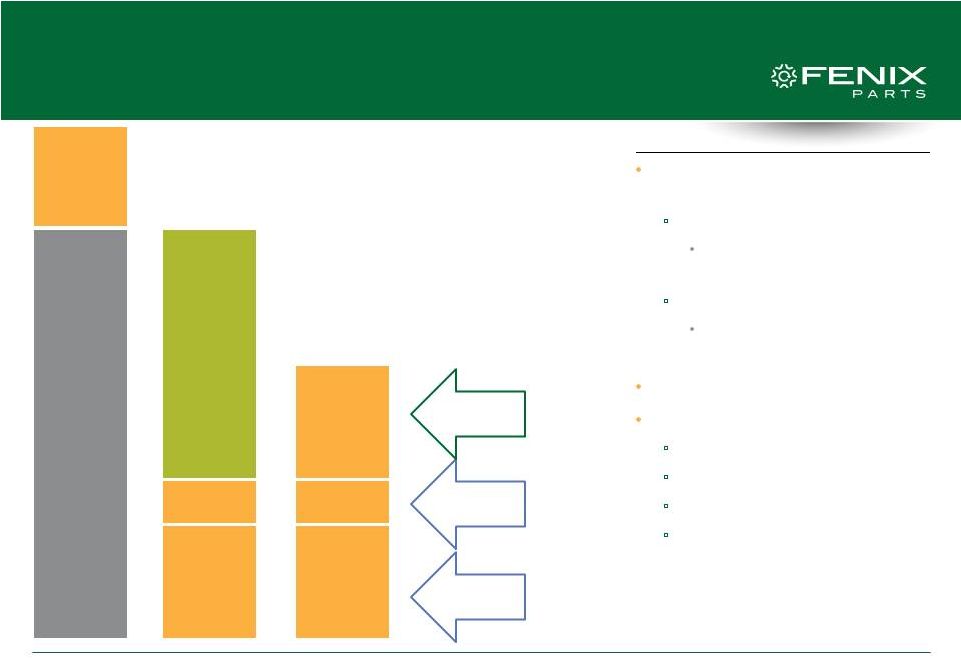
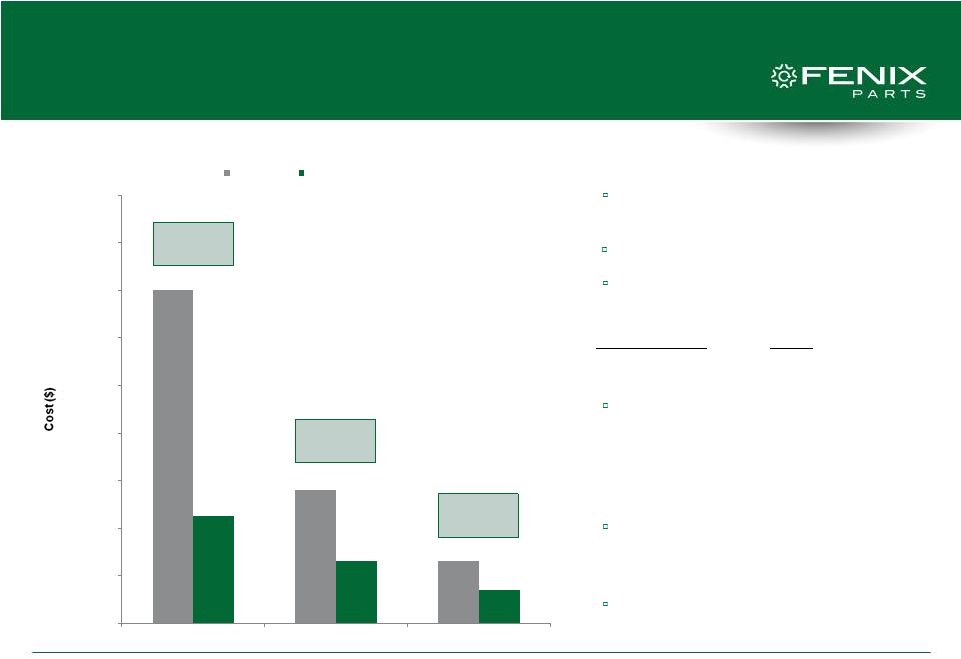 8 $3,500 $1,400 $650 $1,125 $650 $350 -- $500 $1,000 $1,500 $2,000 $2,500 $3,000 $3,500 $4,000 $4,500 Engine Front Door Rear Bumper New OE Recycled OE Recycled OE Parts Are The Parts of Choice ~70% Savings ~50% Savings ~45% Savings • Customers have choices Original Equipment Manufacturer (OEM) Recycled Original Equipment (OE) Aftermarket • Clear cost benefit advantage of Recycled OE versus OEM • Clear advantage to Aftermarket Quality, fit, and performance • Sold as assemblies, reducing cost • Recycled Original Equipment feeds refurbished / remanufactured We sell Recycled OE to make refurbished / remanufactured products We distribute refurbished / remanufactured products Source: Management estimates Illustrative Cost Comparison Analysis: New vs. Recycled OE |
 9 Building On a Strong Foundation • Financially-sound and profitable Founding Companies • Similar operations, with long-standing market presence and historical trade relationships connected through a distribution and logistics network • Stable business platforms for inventory management, purchasing, and supply chain management • Founding Companies include 3 current and former Presidents of the Automotive Recyclers Association (ARA) • 8 individual Founding Companies now go to market under the Fenix umbrella Founding Company Full-Service Locations Self-Service Locations • Binghamton, NY • Pennsburg, PA • Watertown, NY • Binghamton, NY • Elmira, NY • Queensbury, NY • Rahway, NJ • Niagara Falls, NY • Ottawa, Ontario • Port Hope, Ontario • Ottawa, Ontario • Scarborough, Ontario • Jacksonville, FL |
 10 Our Market Advantage Geographic market presence with established customer relationships and premier assets dedicated to the procurement and recycling of original equipment parts Competitive Market Position Coordinated regional approach that provides access to our extensive inventory of recycled original equipment parts for distribution on the same or next day basis Extensive Inventory and Distribution Platform We operate a profitable, scalable business model in a stable, growing industry
in a manner that allows us to drive the "product of choice" more efficiently
through our network to our customers
Attractive Product Offering, Business Model and Industry The management of our Founding Companies have extensive operating experience, longstanding relationships with our diverse customer base and an intimacy with the systems and processes routinely employed within the recycling industry Deep Industry Experience The Fenix leadership team brings operating, distribution/logistics, business development/expansion, integration, systems and public company experience and a history of creating shareholder value Experienced Leadership Team |
 11 Experienced Leadership Team Strong Senior Management Team • Kent Robertson – CEO • Scott Pettit – CFO • Art Golden – COO • John Blaseos – EVP-Supply Chain • David Gold – EVP Independent, Highly-Qualified Board of Directors • Gary Beagell • Steven Dayton • J. Michael McFall • Thomas O’Brien • Clayton Trier Experienced Field Operations • Former owners / managers took leadership roles within field operations Dedicated Business Development Team • Identify and speak with high-quality companies that are owned and operated by strong management teams |
 12 Regional Focus – Building a National Presence • Increase inventory throughput to the hub, drives revenue More parts selection Next day delivery Increase same store sales Optimize inventory levels • Ability to leverage distribution network to increase margin More parts per delivery Lower cost platform because of higher asset utilization • Regional density drives operating efficiencies • Clear opportunity for regional and national expansion Legend Full-Service Location Distribution Hub Self-Service Location Line Haul Market Demand for a Strong Alternative |
 13 Pure-Play North American Recycled OE Organic Growth Acquisition Growth • Overall market • Regional cross-dock / inventory • New customers • Highly fragmented • Benefits of scale • Robust pipeline |
 14 Organic Growth Drivers Favorable industry trends (miles driven, insurance preference) Increased fulfillment rates (procurement, inventory diversity) Customer growth (in-house / outbound effectiveness) Parts trader (market expansion) Managing regional dynamics (pricing, inventory) Entrance to new markets (extending the hub) Leading to a 7-9% organic growth |
 15 Compelling M&A Growth Platform Why is This a Good Consolidation Opportunity? • Highly fragmented market Over 9,000 recycling facilities according to the American Recycling Association, with only 1 company with over a 10% share Majority of companies are sized between $1-10 million in annual revenue • Significant benefits of scale Access to greater inventory for sale (better buying, better inventory), higher parts fulfillment Acquisitions are highly synergistic • Vehicle procurement and tow-in • Product distribution and building route/customer density • Leveraging of fixed overhead costs Why are We the Acquirer of Choice? • Opportunity for acquired businesses to be at the front-end of a robust growth opportunity • Expand and scale acquired businesses in their current marketplace creating long-term growth opportunities for owners and employees • Founding Companies are the leaders in the industry and attract like-minded acquisition targets • Owner-friendly expansion strategy |
 16 Compelling M&A Growth Platform How have We Pre-Wired this M&A Growth? • Dedicated business development team, from identification, to acquisition through integration • Identified hundreds of opportunities that meet our acquisition criteria Currently focused on geographic adjacencies to existing markets Expanding distribution, dismantling, and warehouse / yard capacity • Near- to mid-term acquisition pipeline with targets ranging in size from $3 million to $18 million in revenue • 16+ acquisition candidates under NDA • Fenix has obtained a $55 million credit facility inclusive of a $20 million accordion feature Why Does This Create Value? • Attractive valuation of tuck-in acquisitions creates M&A arbitrage Average revenue of $5-10 million • Drive acquired company improvements at top and bottom line Access to regional hub Maximize benefits of scale Drive revenue to $10-15 million, double EBITDA margin |
 17 Near- to Mid-Term Fenix Acquisition Pipeline ACQUISITION TARGET (1) ANNUAL REVENUE COMPLETED Ocean County Auto Wreckers $8M Q3, 2015 Company A $9M Company B $9M Company C $8M Company D $10M Company E $18M Company F $12M Company G $7M Company H $10M Company I $5M Company J $14M Company K $6M Company L $4M Company M $13M Company N $3M Company O $6M Company P $8M Total Pipeline $150M (1) Excludes additional identified opportunities and expressions of interest |
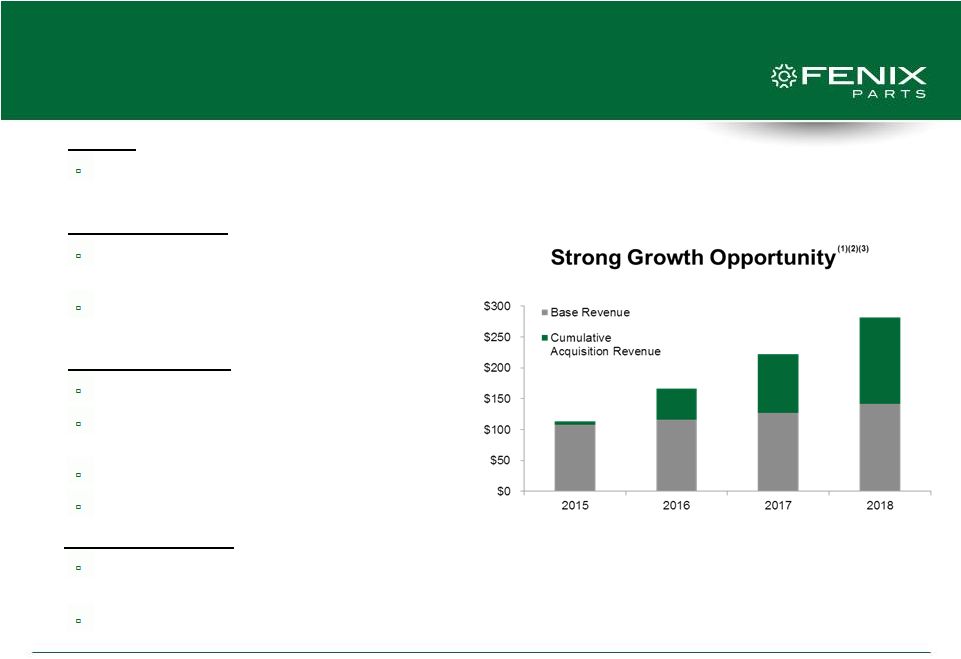 18 Foundation for Growth • Revenue Recycled OEM parts sales and other services (scrap) • Cost of Goods Sold Primarily price paid for vehicles at auction Also includes tow-in, vehicle procurement and dismantling costs • Operating Expenses Facilities, rent and distribution expense Selling expenses for commissioned sales force General and administrative expenses Depreciation and amortization • Growth Assumptions Organic growth: Historical high-single digit Recycled OE parts growth Near- to mid-term acquisition pipeline: $150 million (1) Assumes approximately 7-9% organic growth and 1-3 acquisitions per quarter
(2) Excludes fluctuations in scrap prices and foreign exchange rate (3) The growth projections shown above are solely to illustrate the effect of organic growth and growth through acquisitions that the company
believes to be achievable; however, there can be no assurance that these
levels of revenue will be achieved |
 Capital
Structure •
Strong Liquidity $19 million cash on hand $55 million BMO credit facility ($10 million drawn) • No Net Debt Founding Company acquisitions funded using IPO proceeds • Founding Companies, Management and Board of Directors Significant Shareholders More than 30% combined ownership 19 |
 20 Clear Path for Significant Value Creation • Large Growing Parts Business in Fragmented Market Significant progress on path to national coverage in top-125 MSAs • Well-Defined Process to Scale Operations Regional hubs and distribution drive ability to share inventory, optimize dismantle, vehicle procurement,
tow cost and distribution
•
Robust Pipeline for Future Acquisitions
•
Strong Organic Growth Profile
•
Future Growth Opportunities
Platform enables us to launch new products and service offerings to our
customers •
Highly Skilled Management Team Incented to Create Shareholder Value
|