Attached files
| file | filename |
|---|---|
| 8-K - 8-K - Tri-State Generation & Transmission Association, Inc. | a15-20031_18k.htm |
| EX-99.1 - EX-99.1 - Tri-State Generation & Transmission Association, Inc. | a15-20031_1ex99d1.htm |
Exhibit 99.2
|
|
THE NUMBERS. TRI-STATE GENERATION AND TRANSMISSION ASSOCIATION, INC. TRI-STATE FINANCIALS | 1 |
|
|
Forward-looking statements include statements concerning our plans, objectives, goals, strategies, future events, future revenue or performance, capital expenditures, financing needs, plans or intentions relating to acquisitions, business trends and other information that is not historical information. When used in this presentation, the words “estimates,” “expects,” “anticipates,” “projects,” “plans,” “intends,” “believes” and “forecasts” or future or conditional verbs, such as “will,” “should,” “could” or “may,” and variations of such words or similar expressions, are intended to identify forward-looking statements. These forward-looking statements are subject to a number of risks, uncertainties and assumptions, including those described from time to time in our filings with the Securities and Exchange Commission. All forward-looking statements, including, without limitation, management’s examination of historical operating trends and data, are based upon our current expectations and various assumptions. Our expectations and beliefs are expressed in good faith and we believe there is a reasonable basis for them. However, we cannot assure you that management’s expectations and beliefs will be achieved. There are a number of risks, uncertainties and other important factors that could cause our actual results to differ materially from the forward-looking statements contained in this presentation. 2 | TRI-STATE FINANCIALS |
|
|
IS BETTER. Tri-State is among the largest generation and transmission cooperatives in the country in terms of total assets, annual operating revenue, miles of transmission line owned, energy generation and sales. As a cooperative, everything we do is member-driven and member-focused. Our board of directors is made up of representatives from each of our 44 member systems, and with their guidance and governance, Tri-State continues to work with our members to serve the needs of communities and consumers across the West. TRI-STATE FINANCIALS | 3 OUR DIFFERENT GET TO KNOW US. We are a member-owned cooperative This means we are not driven by profits; we’re driven by the communities we serve. Unlike investor-owned utilities (IOUs), Tri-State has: • No EPS targets.• No high dividend payout ratios. • No ancillary businesses.• No EPS driven M&A activity. Our equity levels Our equity is comprised solely of patronage capital, similar to retained earnings of a for-profit company. We don’t have paid-in capital on common stock. A valuable service Working with our member systems, we provide power to consumers in rural areas that IOUs and municipals have historically ignored. Cooperatives, on average, serve 7.4 consumers per mile of transmission line while IOUs average 34 consumers per mile. Long-term wholesale power contracts Contracts obligate Tri-State’s members to pay all of our costs and expenses, including debt service, associated with owning and operating our power supply business. Our relationships with our members are built to last. Of our 44 member systems, 42 have contracts through 2050 and the remaining two through 2040. |
|
|
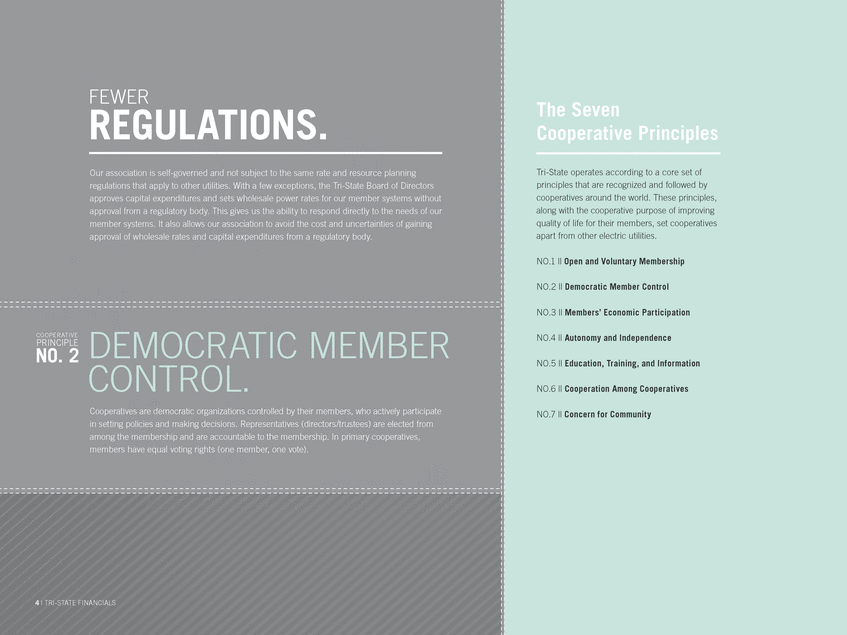
The Seven Cooperative Principles Tri-State operates according to a core set of principles that are recognized and followed by cooperatives around the world. These principles, along with the cooperative purpose of improving quality of life for their members, set cooperatives apart from other electric utilities. NO.1 || Open and Voluntary Membership NO.2 || Democratic Member Control NO.3 || Members’ Economic Participation NO.4 || Autonomy and Independence PRINCIPLE NO. 2 NO.5 || Education, Training, and Information NO.6 || Cooperation Among Cooperatives NO.7 || Concern for Community FEWER REGULATIONS. Our association is self-governed and not subject to the same rate and resource planning regulations that apply to other utilities. With a few exceptions, the Tri-State Board of Directors approves capital expenditures and sets wholesale power rates for our member systems without approval from a regulatory body. This gives us the ability to respond directly to the needs of our member systems. It also allows our association to avoid the cost and uncertainties of gaining approval of wholesale rates and capital expenditures from a regulatory body. C O O PE R ATI V E DEMOCRATIC MEMBER CONTROL. Cooperatives are democratic organizations controlled by their members, who actively participate in setting policies and making decisions. Representatives (directors/trustees) are elected from among the membership and are accountable to the membership. In primary cooperatives, members have equal voting rights (one member, one vote). 4 | TRI-STATE FINANCIALS |
|
|
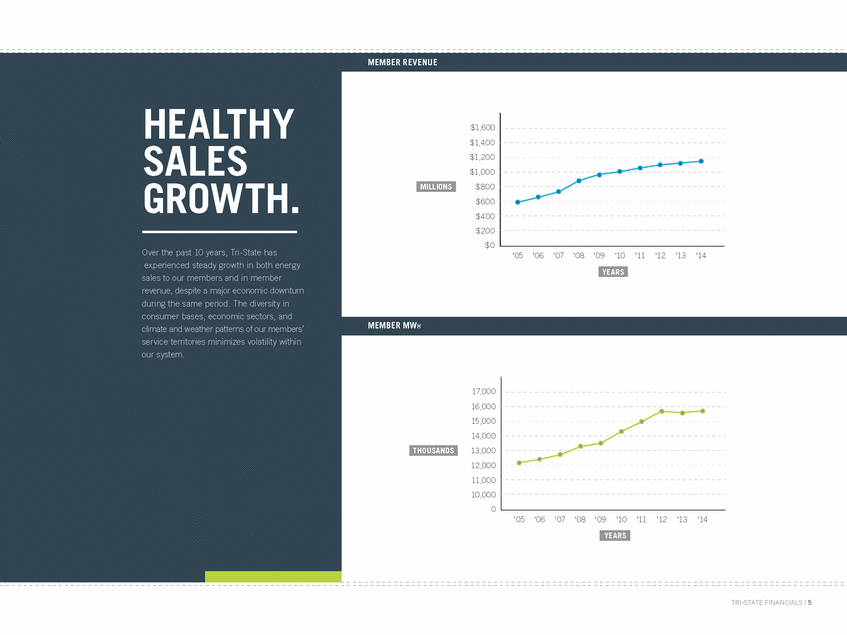
MEMBER REVENUE HEALTHY $1,600 $1,400 $1,200 $1,000 $800 $600 $400 $200 $0 SALES GROWTH. Over the past 10 years, Tri-State has experienced steady growth in both energy sales to our members and in member revenue, despite a major economic downturn during the same period. The diversity in consumer bases, economic sectors, and climate and weather patterns of our members’ service territories minimizes volatility within our system. ‘05 ‘06 ‘07 ‘08 ‘09‘10 ‘11 ‘12 ‘13 ‘14 YEARS MEMBER MWh 17,000 16,000 15,000 14,000 13,000 12,000 11,000 10,000 0 THOUSANDS ‘05 ‘06 ‘07 ‘08 ‘09‘10 ‘11 ‘12 ‘13 ‘14 YEARS TRI-STATE FINANCIALS | 5 MILLIONS |
|
|
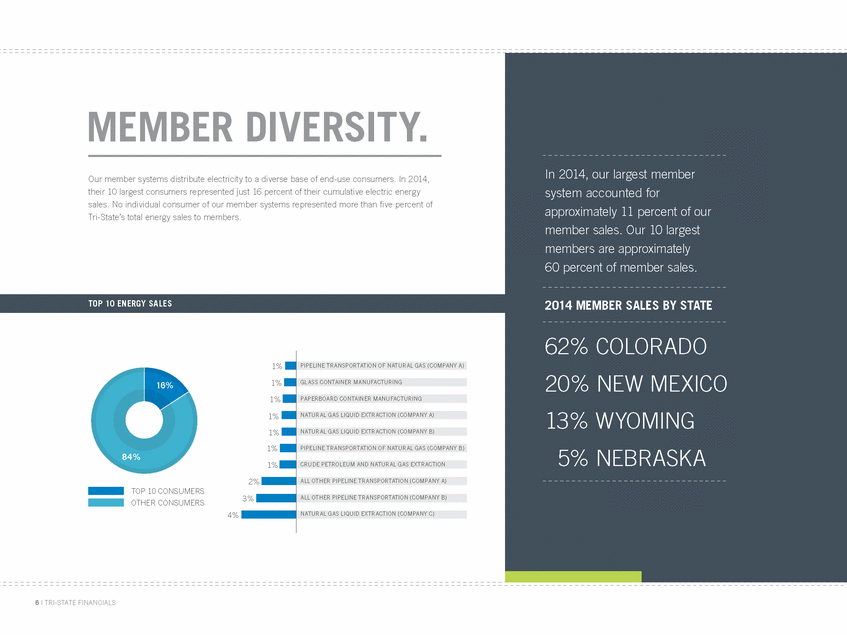
MEMBER DIVERSITY. In 2014, our largest member system accounted for approximately 11 percent of our member sales. Our 10 largest members are approximately 60 percent of member sales. Our member systems distribute electricity to a diverse base of end-use consumers. In 2014, their 10 largest consumers represented just 16 percent of their cumulative electric energy sales. No individual consumer of our member systems represented more than five percent of Tri-State’s total energy sales to members. TOP 10 ENERGY SALES 2014 MEMBER SALES BY STATE 62% 20% 13% 5% COLORADO NEW MEXICO WYOMING NEBRASKA 1% 1% 16% 1% 1% 1% 1% 84% 1% 2% TOP 10 CONSUMERS OTHER CONSUMERS 3% 4% 6 | TRI-STATE FINANCIALS PIPELINE TRANSPORTATION OF NATURAL GAS (COMPANY A) GLASS CONTAINER MANUFACTURING PAPERBOARD CONTAINER MANUFACTURING NATURAL GAS LIQUID EXTRACTION (COMPANY A) NATURAL GAS LIQUID EXTRACTION (COMPANY B) PIPELINE TRANSPORTATION OF NATURAL GAS (COMPANY B) CRUDE PETROLEUM AND NATURAL GAS EXTRACTION ALL OTHER PIPELINE TRANSPORTATION (COMPANY A) ALL OTHER PIPELINE TRANSPORTATION (COMPANY B) NATURAL GAS LIQUID EXTRACTION (COMPANY C) |
|
|
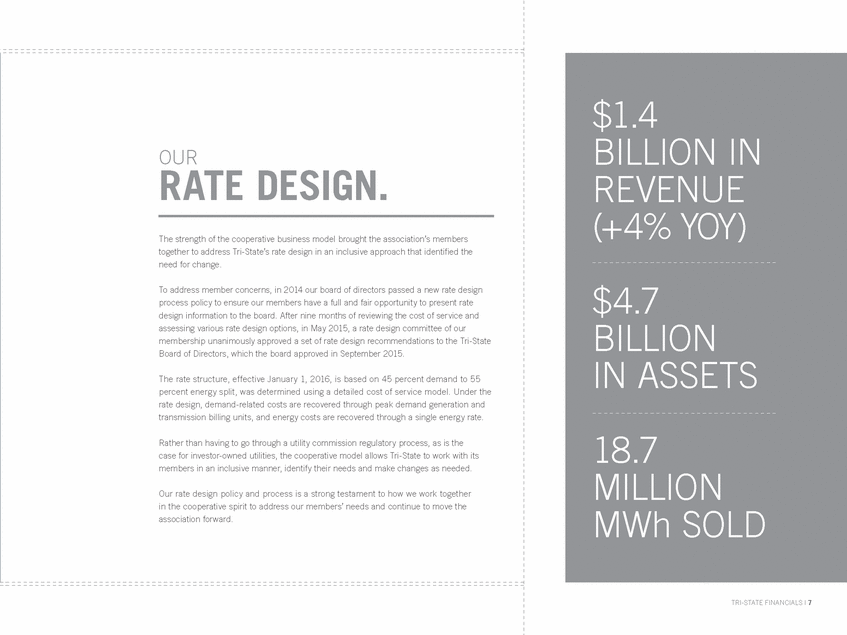
$1.4 BILLION IN REVENUE (+4% YOY) $4.7 BILLION INASSETS 18.7 MILLION MWh SOLD TRI-STATE FINANCIALS | 7 OUR RATE DESIGN. The strength of the cooperative business model brought the association’s members together to address Tri-State’s rate design in an inclusive approach that identified the need for change. To address member concerns, in 2014 our board of directors passed a new rate design process policy to ensure our members have a full and fair opportunity to present rate design information to the board. After nine months of reviewing the cost of service and assessing various rate design options, in May 2015, a rate design committee of our membership unanimously approved a set of rate design recommendations to the Tri-State Board of Directors, which the board approved in September 2015. The rate structure, effective January 1, 2016, is based on 45 percent demand to 55 percent energy split, was determined using a detailed cost of service model. Under the rate design, demand-related costs are recovered through peak demand generation and transmission billing units, and energy costs are recovered through a single energy rate. Rather than having to go through a utility commission regulatory process, as is the case for investor-owned utilities, the cooperative model allows Tri-State to work with its members in an inclusive manner, identify their needs and make changes as needed. Our rate design policy and process is a strong testament to how we work together in the cooperative spirit to address our members’ needs and continue to move the association forward. |
|
|
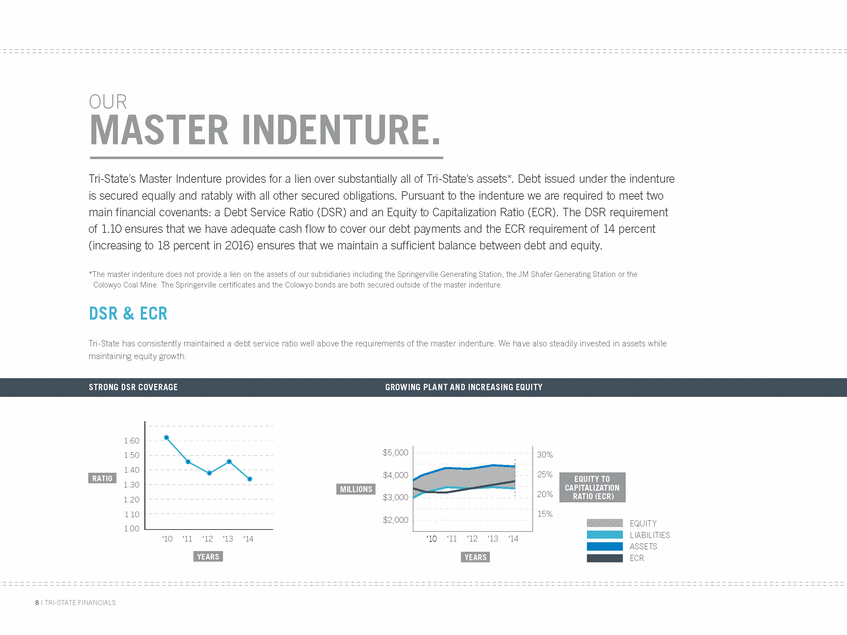
OUR MASTER INDENTURE. Tri-State’s Master Indenture provides for a lien over substantially all of Tri-State’s assets*. Debt issued under the indenture is secured equally and ratably with all other secured obligations. Pursuant to the indenture we are required to meet two main financial covenants: a Debt Service Ratio (DSR) and an Equity to Capitalization Ratio (ECR). The DSR requirement of 1.10 ensures that we have adequate cash flow to cover our debt payments and the ECR requirement of 14 percent (increasing to 18 percent in 2016) ensures that we maintain a sufficient balance between debt and equity. *The master indenture does not provide a lien on the assets of our subsidiaries including the Springerville Generating Station, the JM Shafer Generating Station or the Colowyo Coal Mine. The Springerville certificates and the Colowyo bonds are both secured outside of the master indenture. DSR & ECR Tri-State has consistently maintained a debt service ratio well above the requirements of the master indenture. We have also steadily invested in assets while maintaining equity growth. STRONG DSR COVERAGE GROWING PLANT AND INCREASING EQUITY 1.60 1.50 1.40 1.30 1.20 1.10 1.00 $5,000 30% 25% $4,000 RATIO 20% $3,000 15% $2,000 EQUITY LIABILITIES ASSETS ECR ‘10‘11 ‘12‘13‘14 ‘10‘11‘12‘13‘14 YEARS 8 | TRI-STATE FINANCIALS YEARS MILLIONS EQUITY TO CAPITALIZATION RATIO (ECR) |
|
|
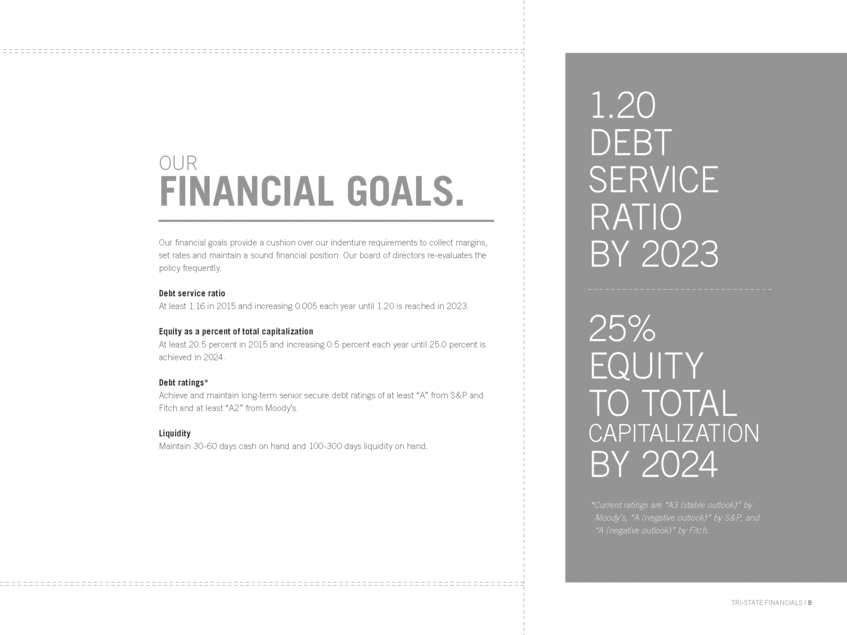
1.20 DEBT SERVICE RATIO BY 2023 25% EQUITY TO TOTAL CAPITALIZATION BY 2024 *Current ratings are “A3 (stable outlook)” by Moody’s, “A (negative outlook)” by S&P, and “A (negative outlook)” by Fitch. TRI-STATE FINANCIALS | 9 OUR FINANCIAL GOALS. Our financial goals provide a cushion over our indenture requirements to collect margins, set rates and maintain a sound financial position. Our board of directors re-evaluates the policy frequently. Debt service ratio At least 1.16 in 2015 and increasing 0.005 each year until 1.20 is reached in 2023. Equity as a percent of total capitalization At least 20.5 percent in 2015 and increasing 0.5 percent each year until 25.0 percent is achieved in 2024. Debt ratings* Achieve and maintain long-term senior secure debt ratings of at least “A” from S&P and Fitch and at least “A2” from Moody’s. Liquidity Maintain 30-60 days cash on hand and 100-300 days liquidity on hand. |
|
|
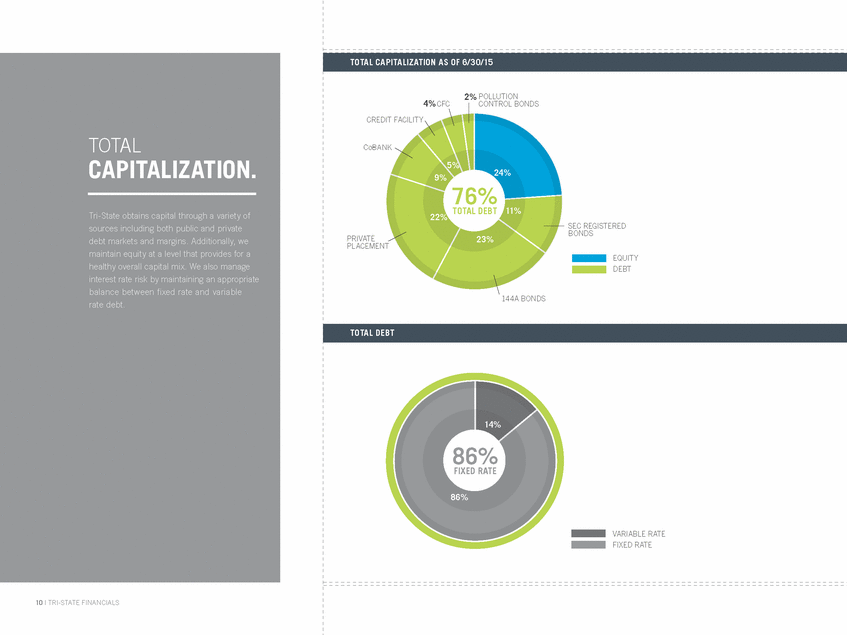
4% 2% POLLUTION TOTAL CAPITALIZATION. Tri-State obtains capital through a variety of sources including both public and private debt markets and margins. Additionally, we maintain equity at a level that provides for a healthy overall capital mix. We also manage interest rate risk by maintaining an appropriate balance between fixed rate and variable rate debt. PLACEMENT 2% 2% 4% 4% FIXED RATE DEEQBUTITY VFAIXREIADBRLAETREATE 10 | TRI-STATE FINANCIALS TOTAL CAPITALIZATION AS OF 6/30/15 2% 4% CFCCONTROL BONDS CREDIT FACILITY CoBANK 5% % 76% 22 TOTAL DEBT 11% SEC REGISTERED BONDS PRIVATE23% EQUITY DEBTEQUITY DEBT 144A BONDS TOTAL DEBT 14% 86% 86% EQUITY VARIABLE RATE DEBTFIXED RATE |
|
|
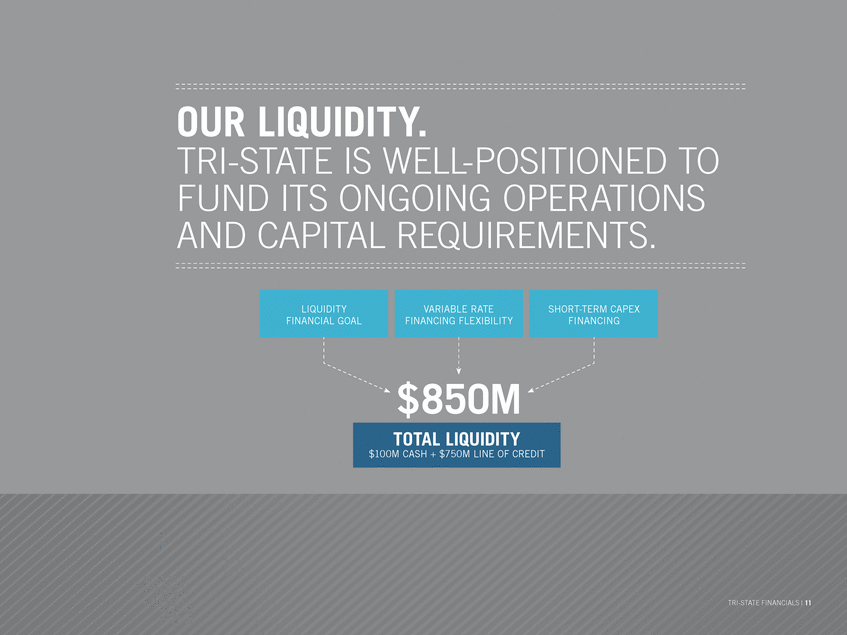
OUR LIQUIDITY. TRI-STATE ISWELL-POSITIONED TO FUND ITSONGOINGOPERATIONS AND CAPITAL REQUIREMENTS. $850M TRI-STATE FINANCIALS | 11 TOTAL LIQUIDITY $100M CASH + $750M LINE OF CREDIT SHORT-TERM CAPEX FINANCING LIQUIDITY FINANCIAL GOAL VARIABLE RATE FINANCING FLEXIBILITY |
|
|
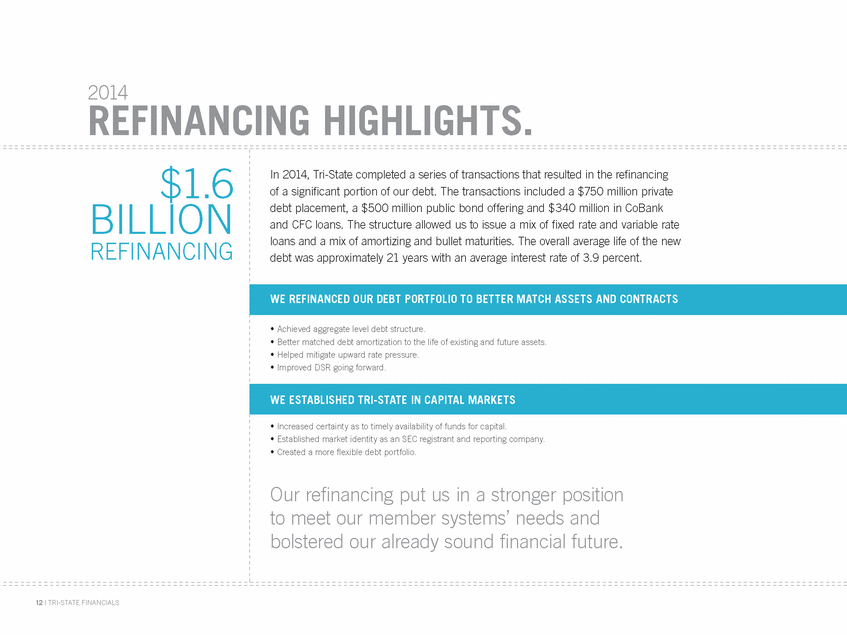
2014 REFINANCING HIGHLIGHTS. of a significant portion of our debt. The transactions included a $750 million private debt placement, a $500 million public bond offering and $340 million in CoBank debt was approximately 21 years with an average interest rate of 3.9 percent. 12 | TRI-STATE FINANCIALS $1.6 BILLION REFINANCING In 2014, Tri-State completed a series of transactions that resulted in the refinancing and CFC loans. The structure allowed us to issue a mix of fixed rate and variable rate loans and a mix of amortizing and bullet maturities. The overall average life of the new WE REFINANCED OUR DEBT PORTFOLIO TO BETTER MATCH ASSETS AND CONTRACTS • Achieved aggregate level debt structure. • Better matched debt amortization to the life of existing and future assets. • Helped mitigate upward rate pressure. • Improved DSR going forward. WE ESTABLISHED TRI-STATE IN CAPITAL MARKETS • Increased certainty as to timely availability of funds for capital. • Established market identity as an SEC registrant and reporting company. • Created a more flexible debt portfolio. Our refinancing put us in a stronger position to meet our member systems’ needs and bolstered our already sound financial future. |
|
|
THE ROAD AHEAD. Tri-State anticipates financing through a variety of sources, giving us flexibility around how we structure our debt portfolio in relation to interest rate risk, maturity profile and amortization structure. OUR MAJOR FINANCING SOURCES With our commitment to the cooperative business model and to serving our member systems, Tri-State stands apart from other utilities. Our recent refinancing, along with our liquidity and healthy sales growth, highlight the association’s strong financial position and readiness to meet future obligations and challenges. For investor inquires, please contact us at investorrelations@tristategt.org TRI-STATE FINANCIALS | 13 CREDIT FACILITY CFC CoBANK SEC REGISTERED 144A BONDS PRIVATE PLACEMENT |

