Attached files
| file | filename |
|---|---|
| 8-K - FORM 8-K - LAYNE CHRISTENSEN CO | d78758d8k.htm |
 September 2015 LAYNE CHRISTENSEN D.A. Davidson 14 th Annual Engineering & Construction Conference Exhibit 99.1 Exhibit 99.1 |
 Safe
Harbor 2
This presentation may contain forward-looking statements within the meaning of the Private Securities Litigation Reform Act of 1995. Such statements may include, but are not limited to, statements of plans and objectives, statements of future economic performance and statements of assumptions underlying such statements, and statements of management's intentions, hopes, beliefs, expectations or predictions of the future. Forward-looking statements can often be identified by the use of forward-looking terminology, such as "should," "intend," "continue," "believe," "may," "hope," "anticipate," "goal," "forecast," "plan," "estimate" and similar words or phrases. Such statements are based on current expectations and are subject to certain risks, uncertainties and assumptions, including but not limited to: estimates and assumptions regarding our strategic direction and business strategy, our ability to implement our restructuring plan for our Africa operations, the extent and timing of a recovery in the mining industry, prevailing prices for various commodities, longer term weather patterns, unanticipated slowdowns in the our major markets, the seasonality of our business, the availability of credit, the risks and uncertainties normally incident to our construction industries, the impact of competition, the effectiveness of operational changes expected to reduce operating expenses and increase efficiency, productivity and profitability, the availability of equity or debt capital needed for our business, worldwide economic and political conditions and foreign currency fluctuations that may affect our results of operations. Should one or more of these risks or uncertainties materialize, or should underlying assumptions prove incorrect, actual results may vary materially and adversely from those anticipated, estimated or projected. These forward-looking statements are made as of the date of this filing, and we assume no obligation to update such forward-looking statements or to update the reasons why actual results could differ materially from those anticipated in such forward-looking statements. |
 Layne
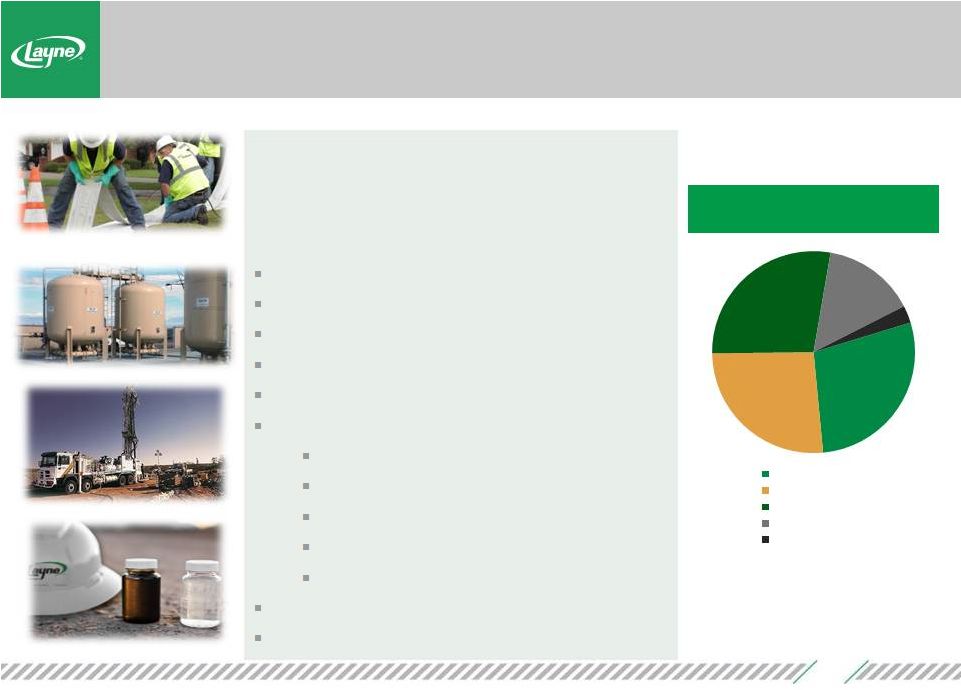
Overview NASDAQ:
LAYN Headquarters: The Woodlands, Texas Shares Outstanding (1) : 19.7 million Stock price (2) : $7.48 Market capitalization (2) : $148.0 million 5 business segments: Water Resources Inliner Heavy Civil Energy Services Mineral Services 130+ years of experience 50,000+ wells installed 3 % Revenues TTM Q2 FY 2016 by Business Segment Total Revenue: $727.8 million 28.2% 26.3% 27.9% 14.8% 2.8% Water Resources Inliner Heavy Civil Mineral Services Energy Services (1) As of 8/28/15 (2) As of 9/8/15 A leading global water management and services company, providing responsible, integrated solutions to address the world’s toughest water, mineral and energy challenges |
 Solid
Credentials 4 |
 Business Platforms 5 WATER MANAGEMENT, INFRASTRUCTURE REHABILITATION & MAINTENANCE HEAVY CIVIL CONSTRUCTION MINERAL SERVICES • Water Sourcing • Well & Pump Maintenance • Water Treatment Technologies • Water Transfer • Water Storage • Cured-In-Place Pipe Rehabilitation • Treatment Plant Construction • Renewable Energy • Sewer Systems • Water Supply • Intake and Pumping Structures • Water Transmission & Distribution • Exploration Drilling • Specialty Drilling • Mine Dewatering • Borehole Services |
 Water
is a Large and Growing Industry 6
Layne participates in large market segments and holds position of #1 in U.S. water well
drilling and #2 in U.S. wastewater pipeline trenchless rehabilitation
services Projected Spend on U.S. Water and Wastewater
Infrastructure US$ billions
(1) Projected U.S. Water Infrastructure Needs (3) $60 $70 $80 $90 $100 $110 $120 $130 (1) EPA (2) EPA and ASCE (3) Marketline Outlook June 2013 Estimated U.S. Spending Needs by Function (%) (2) Wastewater Water Supply 59% 20% 12% 9% Transmission Treatment Water Storage Other 75% 17% 8% Pipes Treatment Plants Stormwater $36.2 $41.7 $35.0 $39.2 $38.9 YoY Growth Wastewater Water Supply 2015 2014 2018 2017 2016 |
 Broad
Presence in Water Ecosystem 7
Source: MGI Resource provision to all sectors Groundwater well drilling Multi-purpose dams / reservoirs Desalination plants Horizontal collector wells Availability and utilization monitoring Irrigation distribution System development System rehabilitation On-farm use On-farm, irrigation technology Water management practices Treated water distribution Urban network transmission and distribution Infrastructure maintenance Water main pipeline rehabilitation Water quality and efficiency monitoring Sanitation services Wastewater treatment Sewer network construction Sewer pipeline rehabilitation Water reuse and recycling Injection well drilling Industrial services Water treatment Wastewater treatment Water reuse and recycling Quality and efficiency monitoring technologies Items in green and bold are current
Layne offerings |
 Solutions Lifecycle 8 |
 Business Segments Energy Services Water Resources Heavy Civil Inliner Mineral Services Revenues: $205.4 Million #1: U.S.
water well drilling Revenues: $203.0 Million Top 5 in U.S. sewer repair & construction Revenues: $191.5 Million #2: U.S.
trenchless pipeline rehab Revenues: $107.9 Million #3 in Mineral
Exploration Revenues: $20.1 Million Serving oil & gas clients for drilling and production • Supply system development • Sourcing • Drilling • Repair & installation • Water treatment • Water & wastewater treatment • Pipeline installation • Intake and pumping structures • Biogas facilities • Proprietary cured- in-place pipe (CIPP) for pipeline and infrastructure rehabilitation • All phases of core drilling and extracting samples • Identifying base and precious mineral deposits • Mine dewatering and water management • Complete end- to-end water management solutions for oil & gas clients 9 Note: All revenues are for trailing twelve months ended July 31, 2015 |
 Select
Customers Water Resources
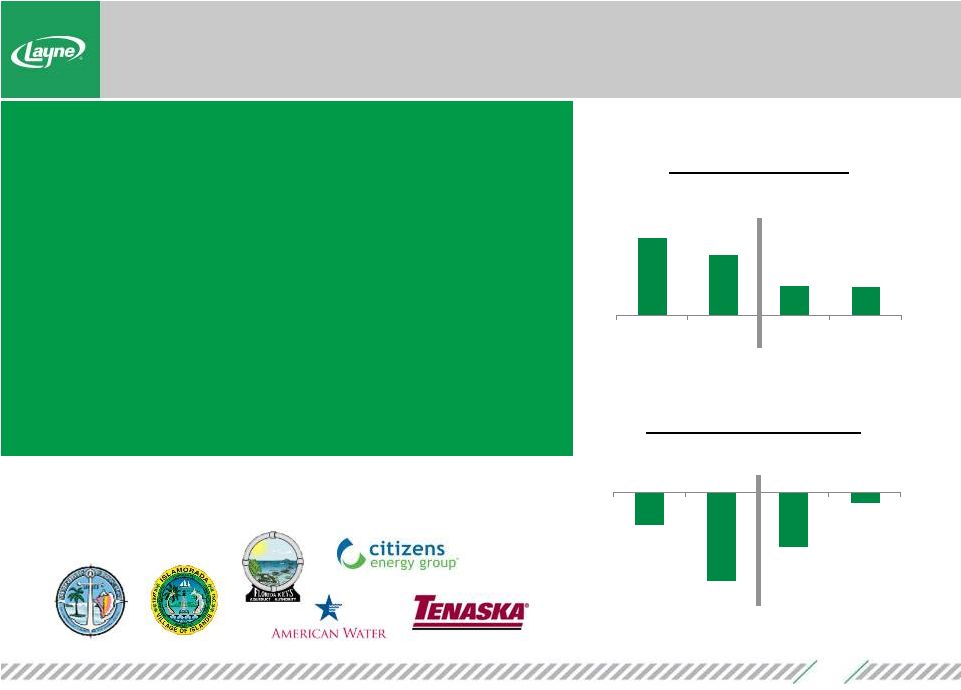
10 Pre-Tax Income ($ in Millions) • MARKET ENVIRONMENT: Increasing demand driven by population growth in water-challenged regions, aging water infrastructure and need for water treatment • CORE MARKETS • Municipal • Industrial • Agribusiness • GROWTH FOCUS • Geographic expansion • Water treatment and monitoring • Expansion of aftermarket portfolio $175.9 $196.2 $96.6 $105.7 FY14 FY15 6M'15 6M'16 Revenues ($ in Millions) $1.0 $14.4 $7.0 $8.3 FY14 FY15 6M'15 6M'16 |
 Inliner • MARKET ENVIRONMENT: Significant aging infrastructure across U.S.; Environmental and water loss issues and government mandate to address those issues • CORE MARKETS • Municipalities • Utilities • GROWTH FOCUS • Expanded installation / curing methods • Technology to drive productivity • 11 Pre-Tax Income ($ in Millions) $148.4 $175.0 $73.3 $89.8 FY14 FY15 6M'15 6M'16 Revenues ($ in Millions) $17.7 $22.9 $8.6 $10.4 FY14 FY15 6M'15 6M'16 Select Customers Geographic expansion - West, Northeast and New England |
 Heavy
Civil •
MARKET ENVIRONMENT: Significant pent-up demand for
water infrastructure; Increased demand for water treatment to
reduce discharge • CORE MARKETS • Industrial • Municipalities • Utilities • Biogas • GROWTH FOCUS • Refocus from traditional fixed price contracts to negotiated or alternative delivery contracts • Geographic refocus on areas of traditional strength • Enhanced risk management 12 Pre-Tax (Loss) ($ in Millions) $267.2 $207.0 $102.6 $98.5 FY14 FY15 6M'15 6M'16 Revenues ($ in Millions) $(7.8) $(21.5) $(13.2) $(2.5) FY14 FY15 6M'15 6M'16 Select Customers |
 Energy
Services •
MARKET ENVIRONMENT: Increasing demand for water
management in spite of current commodity price environment
• CORE MARKETS • Upstream oil and gas drilling and production • GROWTH FOCUS • Increase share and scope with existing customers • Exploit water treatment opportunities • Permian Basin and Eagle Ford 13 Pre-Tax Loss ($ in Millions) $6.3 $20.2 $7.5 $7.4 FY14 FY15 6M'15 6M'16 Revenues ($ in Millions) $(3.2) $(3.7) $(1.6) $(1.8) (1) FY14 FY15 6M'15 6M'16 (1) Excludes $4.6 million of impairment charges in Q2 FY 2016 Select Customers |
 Minerals Services • MARKET ENVIRONMENT: Deeply cyclical market; current soft market conditions and low global demand although longer-term mining industry fundamentals remain positive • CORE MARKETS • Junior mining companies • Mining and mineral processing companies • GROWTH FOCUS • Increase focus on core markets (e.g. North and South America) • Mine water management solutions • Technology to drive safety and productivity 14 Pre-Tax Loss ($ in Millions) $173.0 $120.2 $61.5 $49.1 FY14 FY15 6M'15 6M'16 Revenues ($ in Millions) $(9.5) $(14.9) $(4.9) $(4.8) (1) FY14 FY15 6M'15 6M'16 (1) Excludes $11.7 million of restructuring costs in Q2 FY 2016 Select Customers |
 Strategic Transformation Underway
15 Strategic Review Strategic Review Business Performance Improvement Grow Grow Q1 FY 2016 Current Focus FY 2017 • Sold Geoconstruction business segment • Announced Minerals Services segment exit from Africa • Significantly improved balance sheet and bolstered liquidity • Cost efficiencies • Procurement savings • Enhanced working capital management • Pricing and margin improvements Strategic focus to reshape Layne around our core offerings and capabilities, leveraging the 130+ years of experience to build a more successful managed services company |
 Investment Highlights
16 • A leading global water management, infrastructure rehabilitation and mineral services company with 130+ years of experience and a proven track record of success • Leadership positions in large markets with favorable long-term growth dynamics • #1 position in Water Resources • #2 position in Inliner • #3 position in Mineral Services • New management team focused on strategic transformation and value creation • Strategic focus on Layne’s core strengths • Business performance improvement initiatives |
 Appendix 17 |
 Financial Information
18 (in thousands, except per share data) 2015 2014 2015 2014 Revenues 176,317 $
184,100
$
350,588 $
342,745
$
Cost of revenues (exclusive of depreciation and amortization,
and impairment charges shown
below) (151,249)
(155,218) (294,480)
(293,012) Selling, general and administrative
expenses (exclusive of
depreciation and amortization shown below)
(28,829)
(26,097) (58,075)
(57,253) Depreciation and amortization
(8,254)
(11,437) (16,989)
(22,256) Impairment charges
(4,598)
— (4,598) —
Restructuring costs (4,361) (1,328)
(4,551) (1,328)
Equity in losses of affiliates (1,486) (212)
(1,593) (278)
Gain on extinguishment of debt — — 4,236 —
Interest expense (4,295) (3,025)
(8,147) (7,074)
Other income, net 252 751
1,293 611
Loss from continuing operations before income taxes
(26,503)
(12,466) (32,316)
(37,845) Income tax benefit
(expense) 2,993
(213) 2,232
(1,969) Net loss from continuing
operations (23,510)
(12,679) (30,084)
(39,814) Net income (loss) from discontinued
operations 5,356
(42,280) 5,372
(41,897) Net loss
(18,154)
(54,959) (24,712)
(81,711) Net income attributable to
noncontrolling interests
-
(69) - (1,045) Net loss attributable to
Layne Christensen (18,154)
$
(55,028) $
(24,712)
$
(82,756) $
Earnings per share information
attributable to Layne Christensen
shareholders:
Loss per share from continuing operations - basic
and diluted (1.19)
$
(0.65) $
(1.53)
$
(2.08) $
Earnings (loss) per
share from discontinued operations - basic and diluted 0.26 (2.16)
0.27 (2.14)
Loss per share attributable to Layne Christensen - basic and diluted
(0.93)
$
(2.81) $
(1.26)
$
(4.22) $
Weighted average shares
outstanding - basic and dilutive
19,744
19,629 19,690
19,627 (unaudited)
(unaudited)
Three Months
Six Months
Ended July 31,
Ended July 31, |
 Financial Information, continued
19 (in thousands) 2015 2014 2015 2014 Revenues Water Resources 53,852 $
53,431
$
105,667 $
96,557
$
Inliner 41,790 39,837
89,810 73,320
Heavy Civil 51,195 53,170
98,522 102,588
Mineral Services 25,821 31,971
49,127 61,459
Energy Services 3,620 4,717
7,411 7,545
Other 4,197 4,957
8,450 8,900
Intersegment eliminations (4,158) (3,983)
(8,399) (7,624)
Total revenues 176,317 $
184,100
$
350,588 $
342,745
$
Equity in losses of affiliates Mineral Services (1,486) $
(212)
$
(1,593) $
(278)
$
Income (loss) from continuing operations before income
taxes
Water Resources
4,554
$
5,134 $
8,338
$
6,959 $
Inliner
5,040
3,726 10,402
8,569 Heavy
Civil (961)
(4,637) (2,543)
(13,217) Mineral Services
(14,137)
(1,144) (16,458)
(4,943) Energy
Services (5,416)
(836) (6,384)
(1,562) Other
(137)
41 228 161
Unallocated corporate expenses (11,151) (11,725)
(21,988) (26,738)
Gain on extinguishment of debt — — 4,236 —
Interest expense (4,295) (3,025)
(8,147) (7,074)
Total loss from continuing operations before income taxes (26,503) $
(12,466)
$
(32,316) $
(37,845)
$
Three Months Six Months Ended July 31, Ended July 31, |
 Contacts Jack Lascar/Ken Dennard 713-529-6600 layn@dennardlascar.com www.dennardlascar.com 20 Michael J. Caliel, CEO 281-475-2691 Mike.Caliel@layne.com J. Michael Anderson, CFO 281-475-2691 Michael.Anderson@layne.com |