Attached files
| file | filename |
|---|---|
| 8-K - 8-K - American Homes 4 Rent | a0915investorpresentationf.htm |
September 2015 │ Investor Presentation
Forward-Looking Statements The information in this presentation has been prepared solely for informational purposes. “We,” “AMH,” “AH4R,” “the Company,” “the REIT,” “our” and “us” refer to American Homes 4 Rent, a Maryland real estate investment trust, and its subsidiaries taken as a whole. Various statements contained in this presentation, including those that express a belief, expectation or intention, as well as those that are not statements of historical fact, are forward-looking statements. These forward-looking statements may include projections and estimates concerning the timing and success of our strategies, plans or intentions. Forward-looking statements are generally accompanied by words such as “estimate,” “project,” “predict,” “believe,” “expect,” “intend,” “anticipate,” “potential,” “plan,” “goal” or other words that convey the uncertainty of future events or outcomes. We have based these forward-looking statements on our current expectations and assumptions about future events. These assumptions include, among others, our projections and expectations regarding: market trends in the single-family home rental industry and in the local markets where we operate, our ability to institutionalize a historically fragmented business model, our business strengths, our ideal tenant profile, the quality and location of our properties in attractive neighborhoods, the scale advantage of our national platform and the superiority of our operational infrastructure, the effectiveness of our investment philosophy and diversified acquisition strategy, our ability to create a cash flow opportunity with attractive current yields and upside from increasing rents and cost efficiencies and our understanding of our competition and general economic, demographic and real estate conditions that may impact our business. While we consider these expectations and assumptions to be reasonable, they are inherently subject to significant business, economic, competitive, regulatory and other risks, contingencies and uncertainties, most of which are difficult to predict and many of which are beyond our control and could cause actual results to differ materially from any future results, performance or achievements expressed or implied by these forward-looking statements. Investors should not place undue reliance on these forward-looking statements, which speak only as of the date of this presentation. We undertake no obligation to update any forward-looking statements to conform to actual results or changes in our expectations, unless required by applicable law. For a further description of the risks and uncertainties that could cause actual results to differ from those expressed in these forward-looking statements, as well as risks relating to the business of the Company in general, see the “Risk Factors” disclosed in the Company’s Annual Report for the year ended December 31, 2014 and the Company’s subsequent filings with the Securities and Exchange Commission.
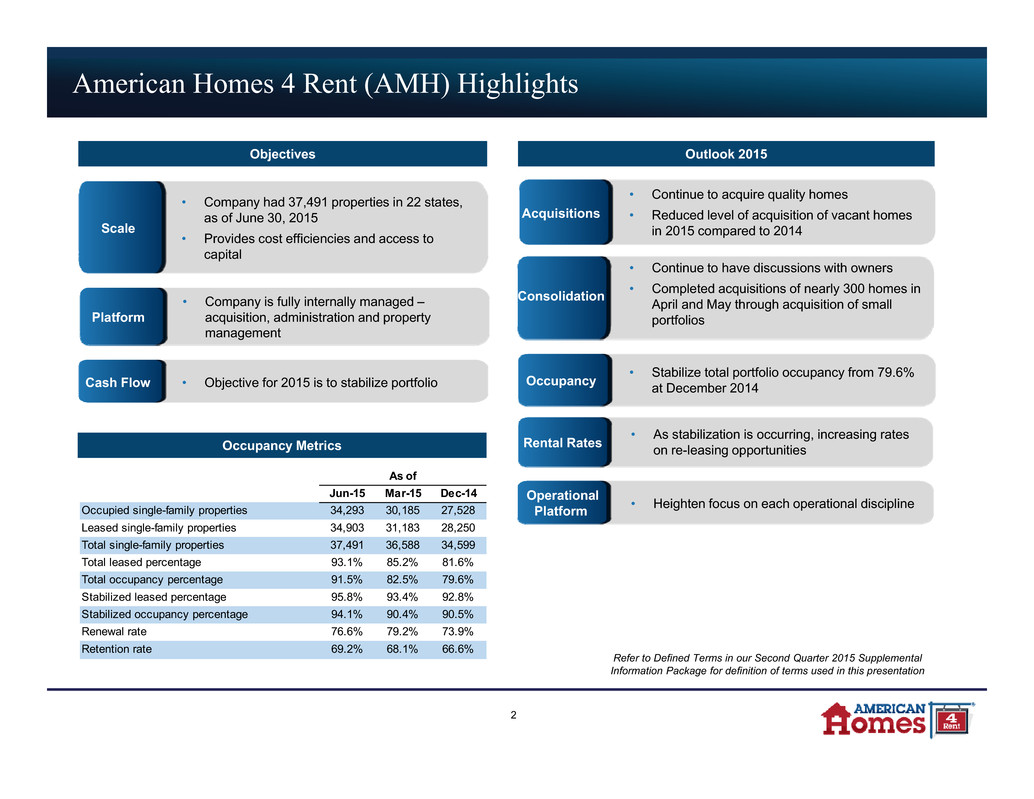
Cash Flow • Objective for 2015 is to stabilize portfolio Platform • Company is fully internally managed – acquisition, administration and property management Scale • Company had 37,491 properties in 22 states, as of June 30, 2015 • Provides cost efficiencies and access to capital Operational Platform • Heighten focus on each operational discipline Acquisitions • Continue to acquire quality homes • Reduced level of acquisition of vacant homes in 2015 compared to 2014 Rental Rates • As stabilization is occurring, increasing rates on re-leasing opportunities Occupancy • Stabilize total portfolio occupancy from 79.6% at December 2014 Consolidation • Continue to have discussions with owners • Completed acquisitions of nearly 300 homes in April and May through acquisition of small portfolios American Homes 4 Rent (AMH) Highlights 2 Objectives Outlook 2015 Occupancy Metrics Refer to Defined Terms in our Second Quarter 2015 Supplemental Information Package for definition of terms used in this presentation Jun-15 Mar-15 Dec-14 Occupied single-family properties 34,293 30,185 27,528 Leased single-family properties 34,903 31,183 28,250 Total single-family properties 37,491 36,588 34,599 Total leased percentage 93.1% 85.2% 81.6% Total occupancy percentage 91.5% 82.5% 79.6% Stabilized leased percentage 95.8% 93.4% 92.8% Stabilized occupancy percentage 94.1% 90.4% 90.5% Renewal rate 76.6% 79.2% 73.9% Retention rate 69.2% 68.1% 66.6% As of
SFR Industry Overview
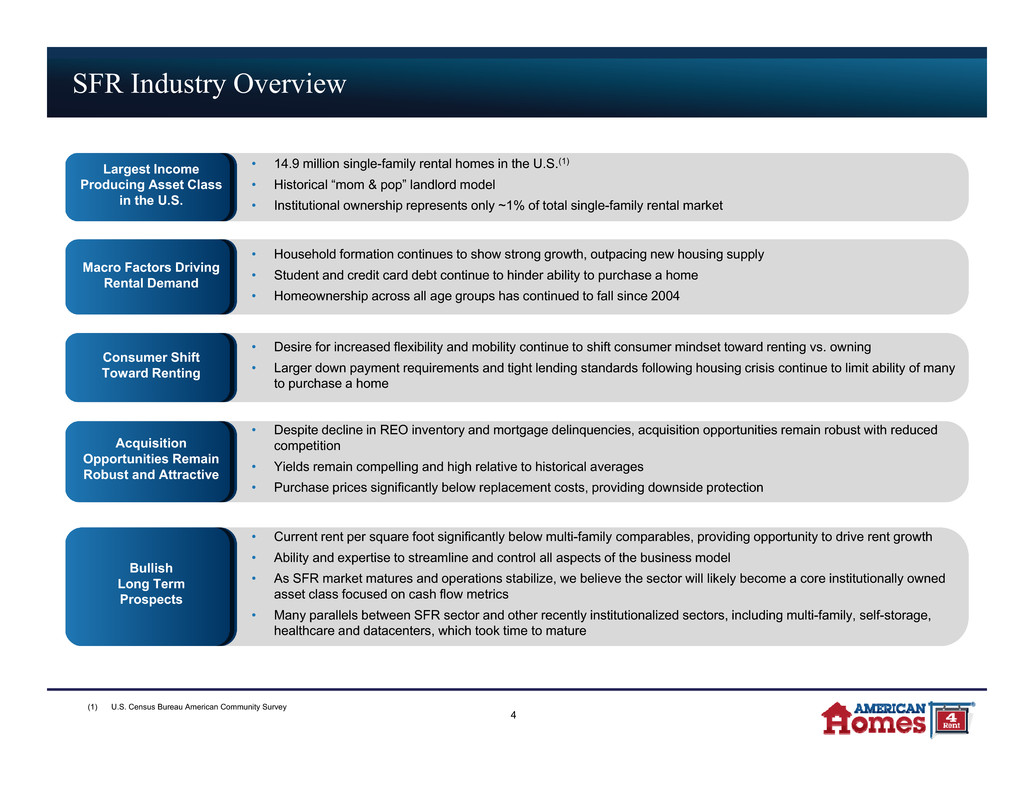
Largest Income Producing Asset Class in the U.S. • 14.9 million single-family rental homes in the U.S.(1) • Historical “mom & pop” landlord model • Institutional ownership represents only ~1% of total single-family rental market Macro Factors Driving Rental Demand • Household formation continues to show strong growth, outpacing new housing supply • Student and credit card debt continue to hinder ability to purchase a home • Homeownership across all age groups has continued to fall since 2004 Consumer Shift Toward Renting • Desire for increased flexibility and mobility continue to shift consumer mindset toward renting vs. owning • Larger down payment requirements and tight lending standards following housing crisis continue to limit ability of many to purchase a home Acquisition Opportunities Remain Robust and Attractive • Despite decline in REO inventory and mortgage delinquencies, acquisition opportunities remain robust with reduced competition • Yields remain compelling and high relative to historical averages • Purchase prices significantly below replacement costs, providing downside protection Bullish Long Term Prospects • Current rent per square foot significantly below multi-family comparables, providing opportunity to drive rent growth • Ability and expertise to streamline and control all aspects of the business model • As SFR market matures and operations stabilize, we believe the sector will likely become a core institutionally owned asset class focused on cash flow metrics • Many parallels between SFR sector and other recently institutionalized sectors, including multi-family, self-storage, healthcare and datacenters, which took time to mature SFR Industry Overview (1) U.S. Census Bureau American Community Survey 4
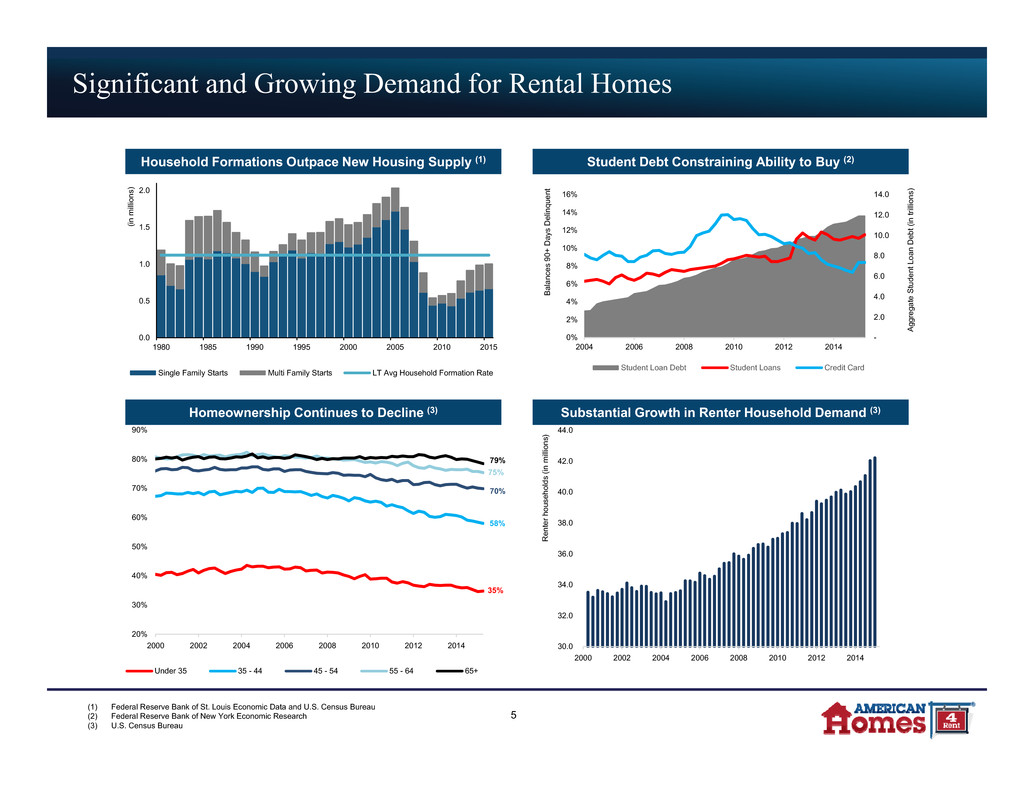
Significant and Growing Demand for Rental Homes Household Formations Outpace New Housing Supply (1) Student Debt Constraining Ability to Buy (2) Homeownership Continues to Decline (3) Substantial Growth in Renter Household Demand (3) (1) Federal Reserve Bank of St. Louis Economic Data and U.S. Census Bureau (2) Federal Reserve Bank of New York Economic Research (3) U.S. Census Bureau 5 0.0 0.5 1.0 1.5 2.0 1980 1985 1990 1995 2000 2005 2010 2015 ( i n m i l l i o n s ) Single Family Starts Multi Family Starts LT Avg Household Formation Rate 79% 75% 70% 58% 35% - 2.0 4.0 6.0 8.0 10.0 12.0 14.0 0% 2% 4% 6% 8% 10% 12% 14% 16% 2004 2006 2008 2010 2012 2014 A g g r e g a t e S t u d e n t L o a n D e b t ( i n t r i l l i o n s ) B a l a n c e s 9 0 + D a y s D e l i n q u e n t Student Loan Debt Student Loans Credit Card 20% 30% 40% 50% 60% 70% 80% 90% 2000 2002 2004 2006 2008 2010 2012 2014 Under 35 35 - 44 45 - 54 55 - 64 65+ 30.0 32.0 34.0 36.0 38.0 40.0 42.0 44.0 2000 2002 2004 2006 2008 2010 2012 2014 R e n t e r h o u s e h o l d s ( i n m i l l i o n s )
Institutional SFR Overview
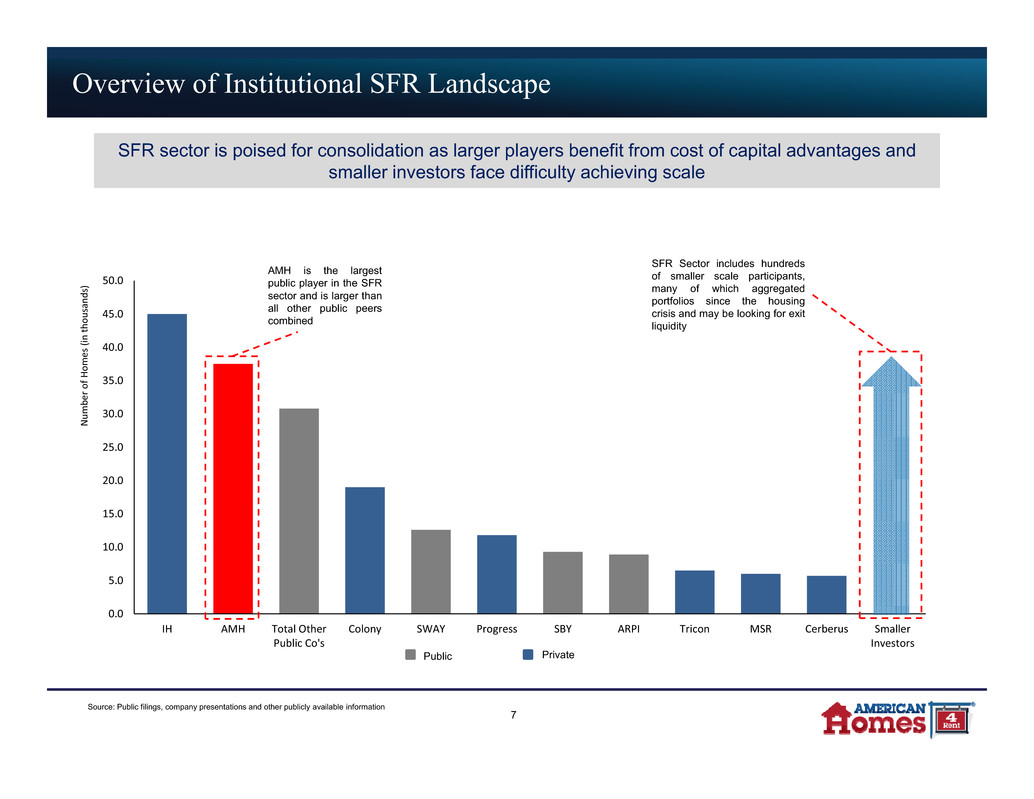
0.0 5.0 10.0 15.0 20.0 25.0 30.0 35.0 40.0 45.0 50.0 IH AMH Total Other Public Co's Colony SWAY Progress SBY ARPI Tricon MSR Cerberus Smaller Investors Overview of Institutional SFR Landscape SFR sector is poised for consolidation as larger players benefit from cost of capital advantages and smaller investors face difficulty achieving scale AMH is the largest public player in the SFR sector and is larger than all other public peers combined SFR Sector includes hundreds of smaller scale participants, many of which aggregated portfolios since the housing crisis and may be looking for exit liquidity Source: Public filings, company presentations and other publicly available information 7 Public Private N u m b e r o f H o m e s ( i n t h o u s a n d s )
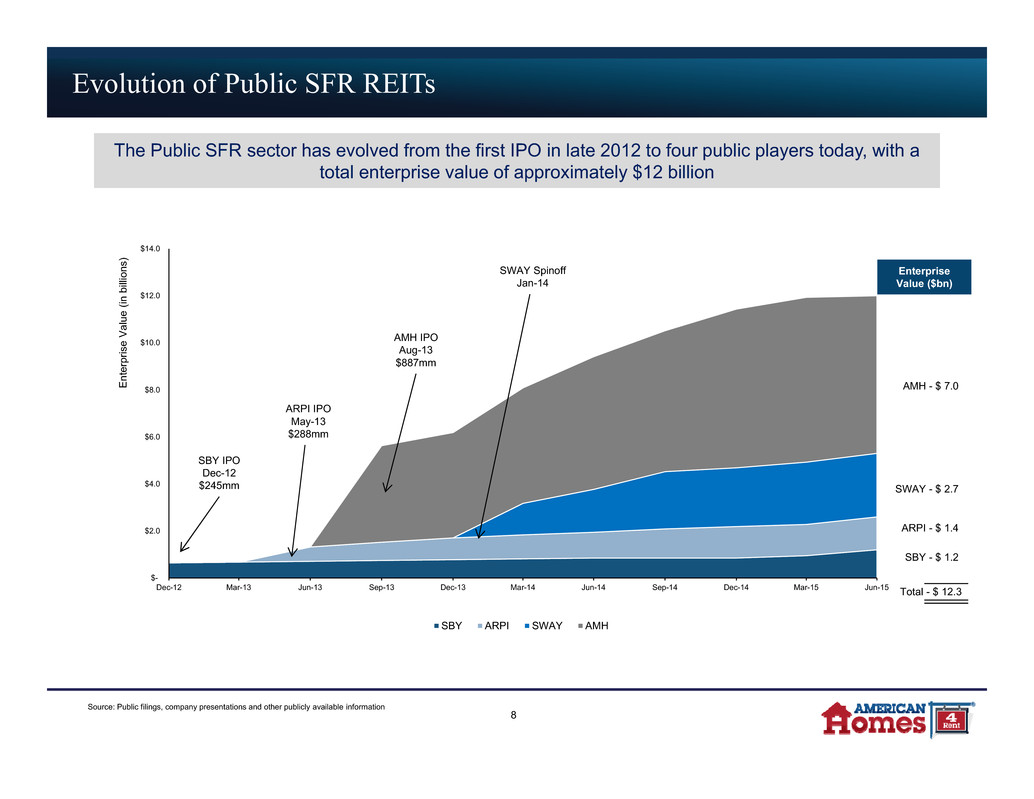
$- $2.0 $4.0 $6.0 $8.0 $10.0 $12.0 $14.0 Dec-12 Mar-13 Jun-13 Sep-13 Dec-13 Mar-14 Jun-14 Sep-14 Dec-14 Mar-15 Jun-15 SBY ARPI SWAY AMH Evolution of Public SFR REITs The Public SFR sector has evolved from the first IPO in late 2012 to four public players today, with a total enterprise value of approximately $12 billion SBY IPO Dec-12 $245mm ARPI IPO May-13 $288mm AMH IPO Aug-13 $887mm SWAY Spinoff Jan-14 E n t e r p r i s e V a l u e ( i n b i l l i o n s ) 8 Source: Public filings, company presentations and other publicly available information Enterprise Value ($bn) AMH - $ 7.0 SWAY - $ 2.7 ARPI - $ 1.4 SBY - $ 1.2 Total - $ 12.3
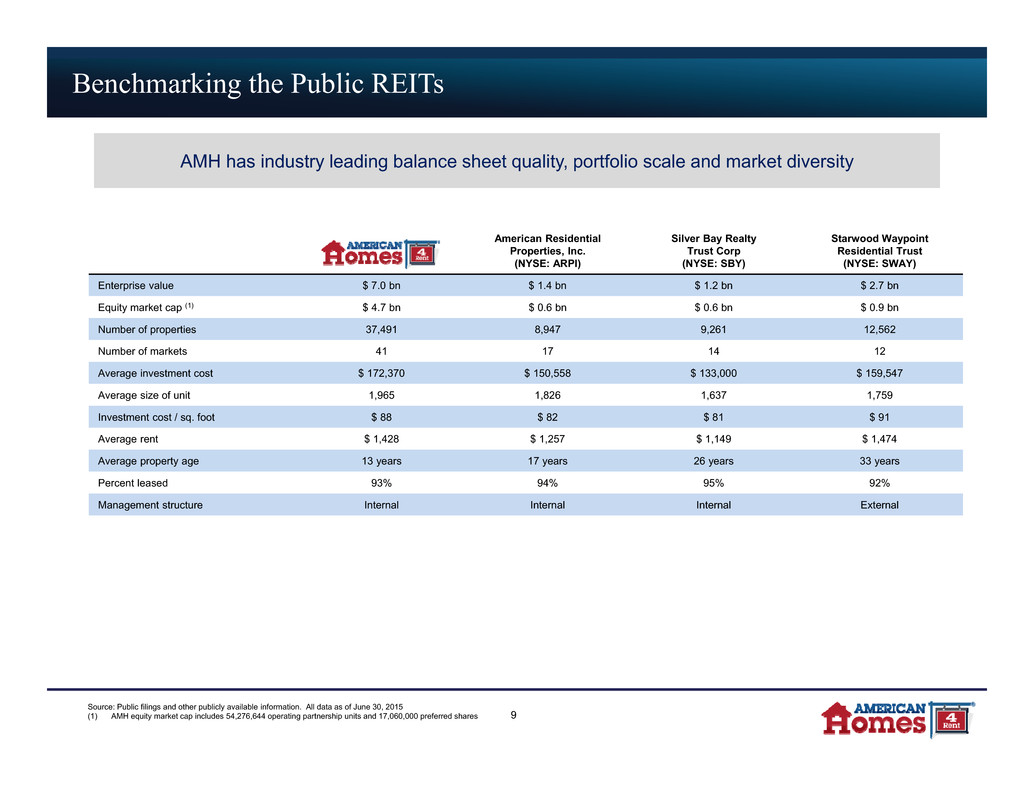
Benchmarking the Public REITs American Residential Properties, Inc. (NYSE: ARPI) Silver Bay Realty Trust Corp (NYSE: SBY) Starwood Waypoint Residential Trust (NYSE: SWAY) Enterprise value $ 7.0 bn $ 1.4 bn $ 1.2 bn $ 2.7 bn Equity market cap (1) $ 4.7 bn $ 0.6 bn $ 0.6 bn $ 0.9 bn Number of properties 37,491 8,947 9,261 12,562 Number of markets 41 17 14 12 Average investment cost $ 172,370 $ 150,558 $ 133,000 $ 159,547 Average size of unit 1,965 1,826 1,637 1,759 Investment cost / sq. foot $ 88 $ 82 $ 81 $ 91 Average rent $ 1,428 $ 1,257 $ 1,149 $ 1,474 Average property age 13 years 17 years 26 years 33 years Percent leased 93% 94% 95% 92% Management structure Internal Internal Internal External Source: Public filings and other publicly available information. All data as of June 30, 2015 (1) AMH equity market cap includes 54,276,644 operating partnership units and 17,060,000 preferred shares 9 AMH has industry leading balance sheet quality, portfolio scale and market diversity
AMH – Overview
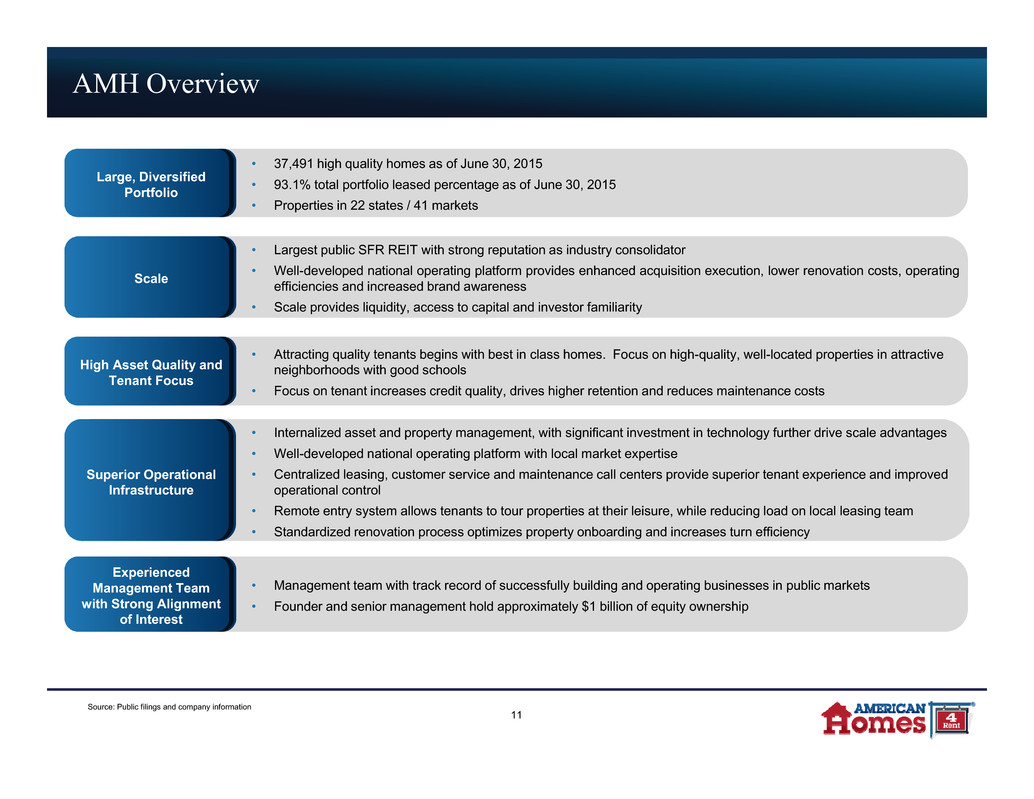
Large, Diversified Portfolio • 37,491 high quality homes as of June 30, 2015 • 93.1% total portfolio leased percentage as of June 30, 2015 • Properties in 22 states / 41 markets Scale • Largest public SFR REIT with strong reputation as industry consolidator • Well-developed national operating platform provides enhanced acquisition execution, lower renovation costs, operating efficiencies and increased brand awareness • Scale provides liquidity, access to capital and investor familiarity High Asset Quality and Tenant Focus • Attracting quality tenants begins with best in class homes. Focus on high-quality, well-located properties in attractive neighborhoods with good schools • Focus on tenant increases credit quality, drives higher retention and reduces maintenance costs Superior Operational Infrastructure • Internalized asset and property management, with significant investment in technology further drive scale advantages • Well-developed national operating platform with local market expertise • Centralized leasing, customer service and maintenance call centers provide superior tenant experience and improved operational control • Remote entry system allows tenants to tour properties at their leisure, while reducing load on local leasing team • Standardized renovation process optimizes property onboarding and increases turn efficiency Experienced Management Team with Strong Alignment of Interest • Management team with track record of successfully building and operating businesses in public markets • Founder and senior management hold approximately $1 billion of equity ownership AMH Overview Source: Public filings and company information 11
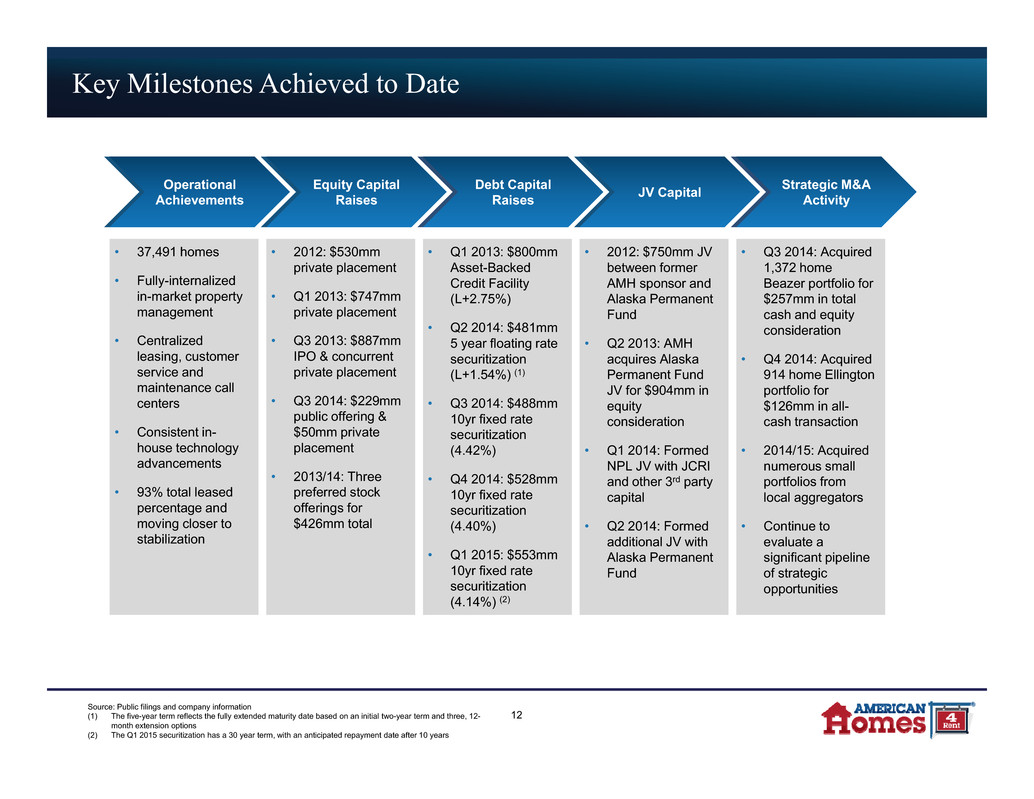
Key Milestones Achieved to Date Operational Achievements Equity Capital Raises Debt Capital Raises JV Capital Strategic M&A Activity • 37,491 homes • Fully-internalized in-market property management • Centralized leasing, customer service and maintenance call centers • Consistent in- house technology advancements • 93% total leased percentage and moving closer to stabilization • 2012: $530mm private placement • Q1 2013: $747mm private placement • Q3 2013: $887mm IPO & concurrent private placement • Q3 2014: $229mm public offering & $50mm private placement • 2013/14: Three preferred stock offerings for $426mm total • Q1 2013: $800mm Asset-Backed Credit Facility (L+2.75%) • Q2 2014: $481mm 5 year floating rate securitization (L+1.54%) (1) • Q3 2014: $488mm 10yr fixed rate securitization (4.42%) • Q4 2014: $528mm 10yr fixed rate securitization (4.40%) • Q1 2015: $553mm 10yr fixed rate securitization (4.14%) (2) • 2012: $750mm JV between former AMH sponsor and Alaska Permanent Fund • Q2 2013: AMH acquires Alaska Permanent Fund JV for $904mm in equity consideration • Q1 2014: Formed NPL JV with JCRI and other 3rd party capital • Q2 2014: Formed additional JV with Alaska Permanent Fund • Q3 2014: Acquired 1,372 home Beazer portfolio for $257mm in total cash and equity consideration • Q4 2014: Acquired 914 home Ellington portfolio for $126mm in all- cash transaction • 2014/15: Acquired numerous small portfolios from local aggregators • Continue to evaluate a significant pipeline of strategic opportunities 12 Source: Public filings and company information (1) The five-year term reflects the fully extended maturity date based on an initial two-year term and three, 12- month extension options (2) The Q1 2015 securitization has a 30 year term, with an anticipated repayment date after 10 years
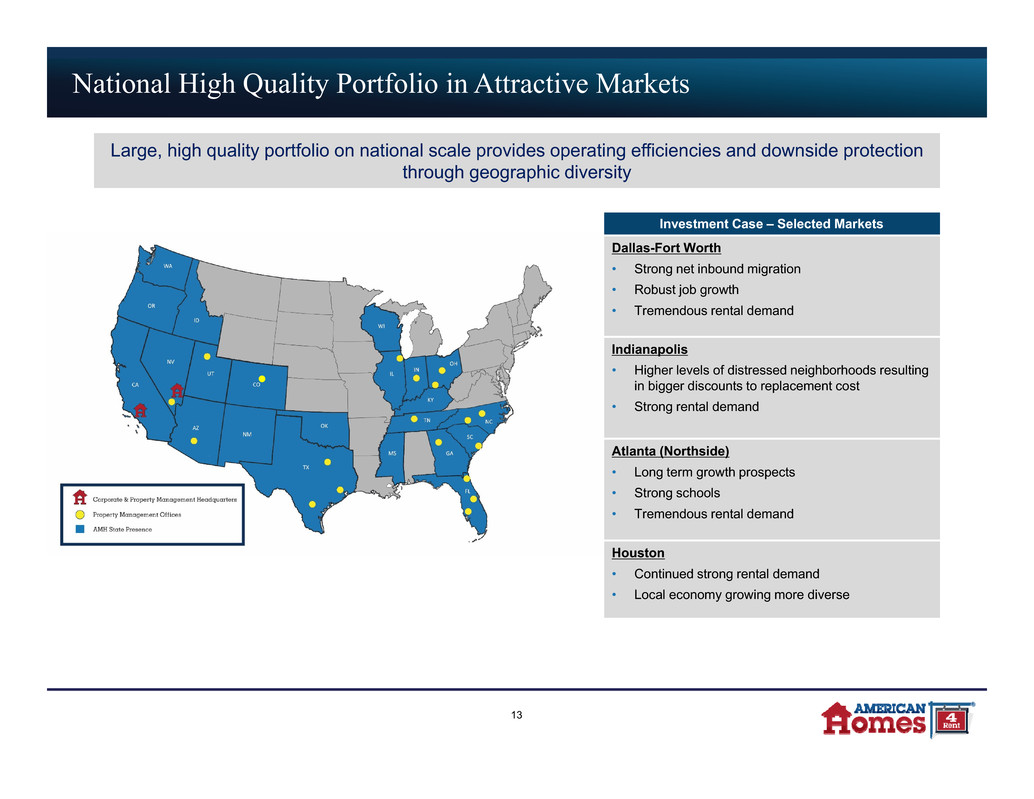
National High Quality Portfolio in Attractive Markets Investment Case – Selected Markets Dallas-Fort Worth • Strong net inbound migration • Robust job growth • Tremendous rental demand Indianapolis • Higher levels of distressed neighborhoods resulting in bigger discounts to replacement cost • Strong rental demand Atlanta (Northside) • Long term growth prospects • Strong schools • Tremendous rental demand Houston • Continued strong rental demand • Local economy growing more diverse Large, high quality portfolio on national scale provides operating efficiencies and downside protection through geographic diversity 13
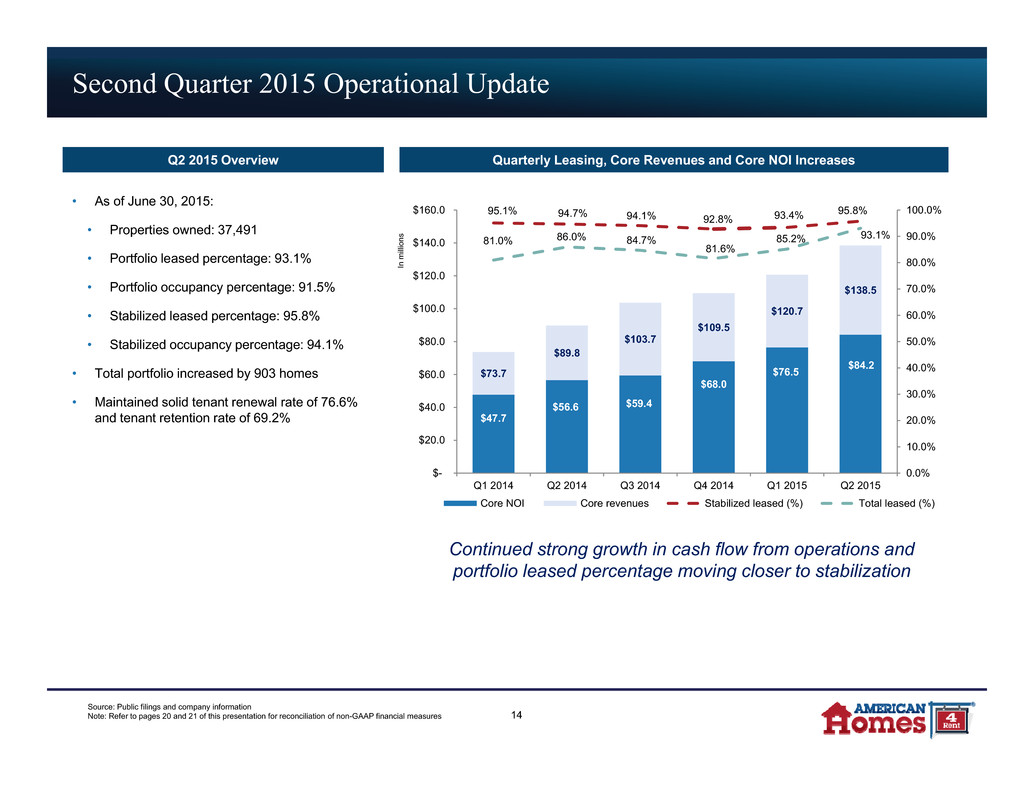
Second Quarter 2015 Operational Update Quarterly Leasing, Core Revenues and Core NOI IncreasesQ2 2015 Overview • As of June 30, 2015: • Properties owned: 37,491 • Portfolio leased percentage: 93.1% • Portfolio occupancy percentage: 91.5% • Stabilized leased percentage: 95.8% • Stabilized occupancy percentage: 94.1% • Total portfolio increased by 903 homes • Maintained solid tenant renewal rate of 76.6% and tenant retention rate of 69.2% Continued strong growth in cash flow from operations and portfolio leased percentage moving closer to stabilization 14 Source: Public filings and company information Note: Refer to pages 20 and 21 of this presentation for reconciliation of non-GAAP financial measures I n m i l l i o n s $47.7 $56.6 $59.4 $68.0 $76.5 $84.2 $73.7 $89.8 $103.7 $109.5 $120.7 $138.5 95.1% 94.7% 94.1% 92.8% 93.4% 95.8% 81.0% 86.0% 84.7% 81.6% 85.2% 93.1% 0.0% 10.0% 20.0% 30.0% 40.0% 50.0% 60.0% 70.0% 80.0% 90.0% 100.0% $- $20.0 $40.0 $60.0 $80.0 $100.0 $120.0 $140.0 $160.0 Q1 2014 Q2 2014 Q3 2014 Q4 2014 Q1 2015 Q2 2015 Core NOI Core revenues Stabilized leased (%) Total leased (%)
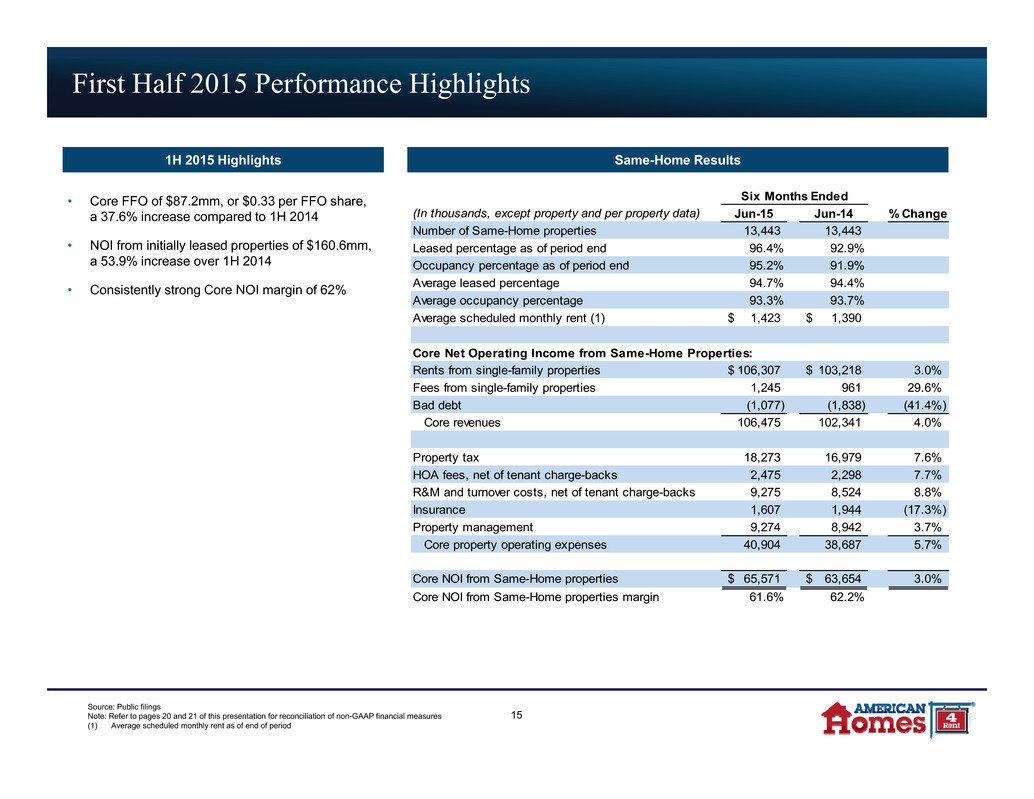
First Half 2015 Performance Highlights Same-Home Results1H 2015 Highlights • Core FFO of $87.2mm, or $0.33 per FFO share, a 37.6% increase compared to 1H 2014 • NOI from initially leased properties of $160.6mm, a 53.9% increase over 1H 2014 • Consistently strong Core NOI margin of 62% Source: Public filings Note: Refer to pages 20 and 21 of this presentation for reconciliation of non-GAAP financial measures (1) Average scheduled monthly rent as of end of period 15 (In thousands, except property and per property data) Jun-15 Jun-14 % Change Number of Same-Home properties 13,443 13,443 Leased percentage as of period end 96.4% 92.9% Occupancy percentage as of period end 95.2% 91.9% Average leased percentage 94.7% 94.4% Average occupancy percentage 93.3% 93.7% Average scheduled monthly rent (1) 1,423$ 1,390$ Core Net Operating Income from Same-Home Properties: Rents from single-family properties 106,307$ 103,218$ 3.0% Fees from single-family properties 1,245 961 29.6% Bad debt (1,077) (1,838) (41.4%) Core revenues 106,475 102,341 4.0% Property tax 18,273 16,979 7.6% HOA fees, net of tenant charge-backs 2,475 2,298 7.7% R&M and turnover costs, net of tenant charge-backs 9,275 8,524 8.8% Insurance 1,607 1,944 (17.3%) Property management 9,274 8,942 3.7% 40,904 38,687 5.7% Core NOI from Same-Home properties 65,571$ 63,654$ 3.0% 61.6% 62.2% Six Months Ended Core property operating expenses Core NOI from Same-Home properties margin
AMH – Best in Class Operations
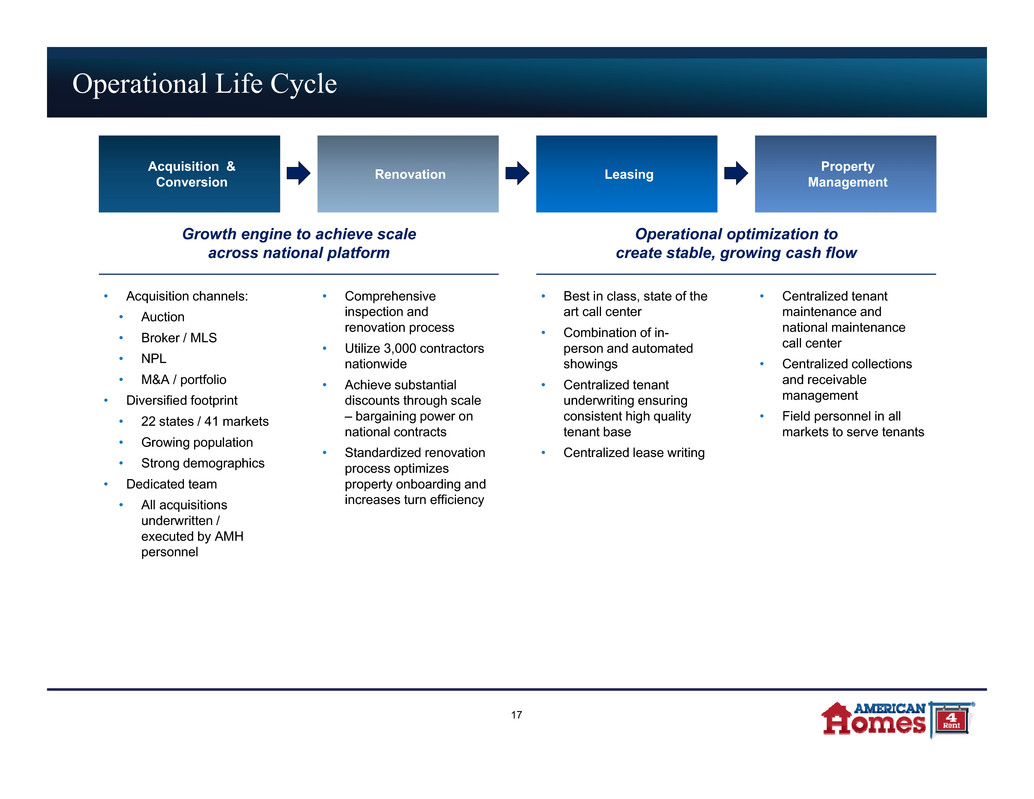
Operational Life Cycle Acquisition & Conversion Renovation Leasing Property Management • Acquisition channels: • Auction • Broker / MLS • NPL • M&A / portfolio • Diversified footprint • 22 states / 41 markets • Growing population • Strong demographics • Dedicated team • All acquisitions underwritten / executed by AMH personnel • Comprehensive inspection and renovation process • Utilize 3,000 contractors nationwide • Achieve substantial discounts through scale – bargaining power on national contracts • Standardized renovation process optimizes property onboarding and increases turn efficiency • Best in class, state of the art call center • Combination of in- person and automated showings • Centralized tenant underwriting ensuring consistent high quality tenant base • Centralized lease writing • Centralized tenant maintenance and national maintenance call center • Centralized collections and receivable management • Field personnel in all markets to serve tenants Growth engine to achieve scale across national platform Operational optimization to create stable, growing cash flow 17
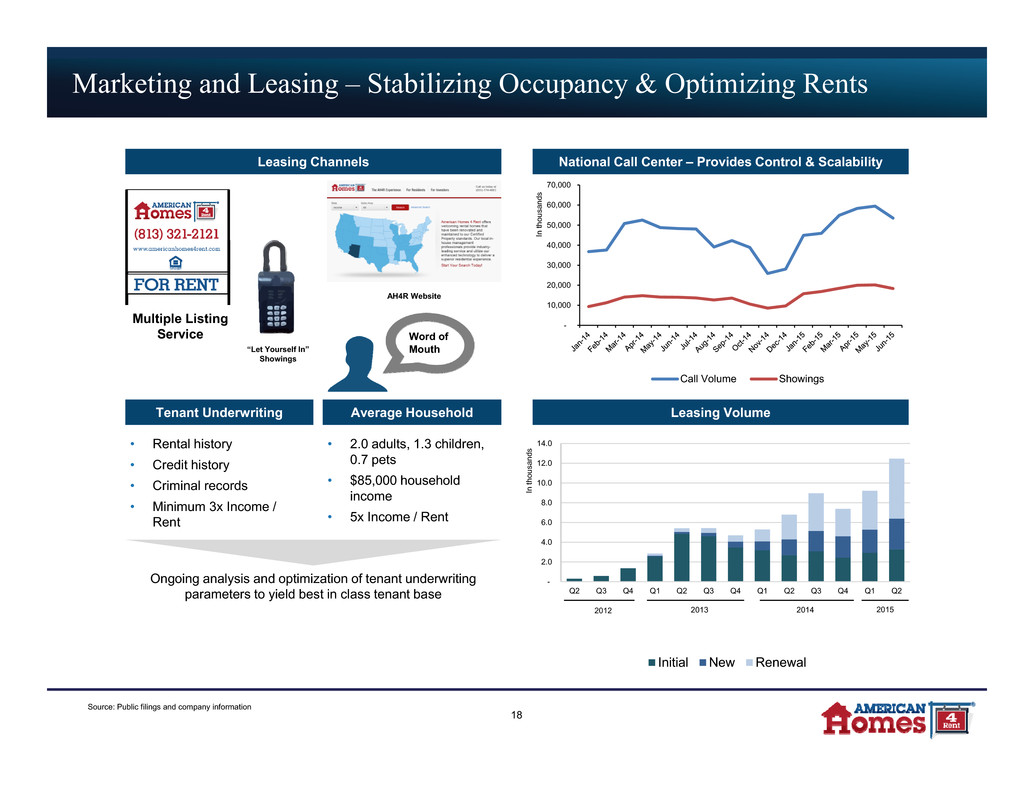
- 2.0 4.0 6.0 8.0 10.0 12.0 14.0 Q2 Q3 Q4 Q1 Q2 Q3 Q4 Q1 Q2 Q3 Q4 Q1 Q2 Initial New Renewal Marketing and Leasing – Stabilizing Occupancy & Optimizing Rents Leasing Channels National Call Center – Provides Control & Scalability Tenant Underwriting Leasing Volume “Let Yourself In” Showings AH4R Website Multiple Listing Service Average Household • Rental history • Credit history • Criminal records • Minimum 3x Income / Rent • 2.0 adults, 1.3 children, 0.7 pets • $85,000 household income • 5x Income / Rent Ongoing analysis and optimization of tenant underwriting parameters to yield best in class tenant base 18 Source: Public filings and company information 2015201420132012 Word of Mouth I n t h o u s a n d s - 10,000 20,000 30,000 40,000 50,000 60,000 70,000 Call Volume Showings I n t h o u s a n d s
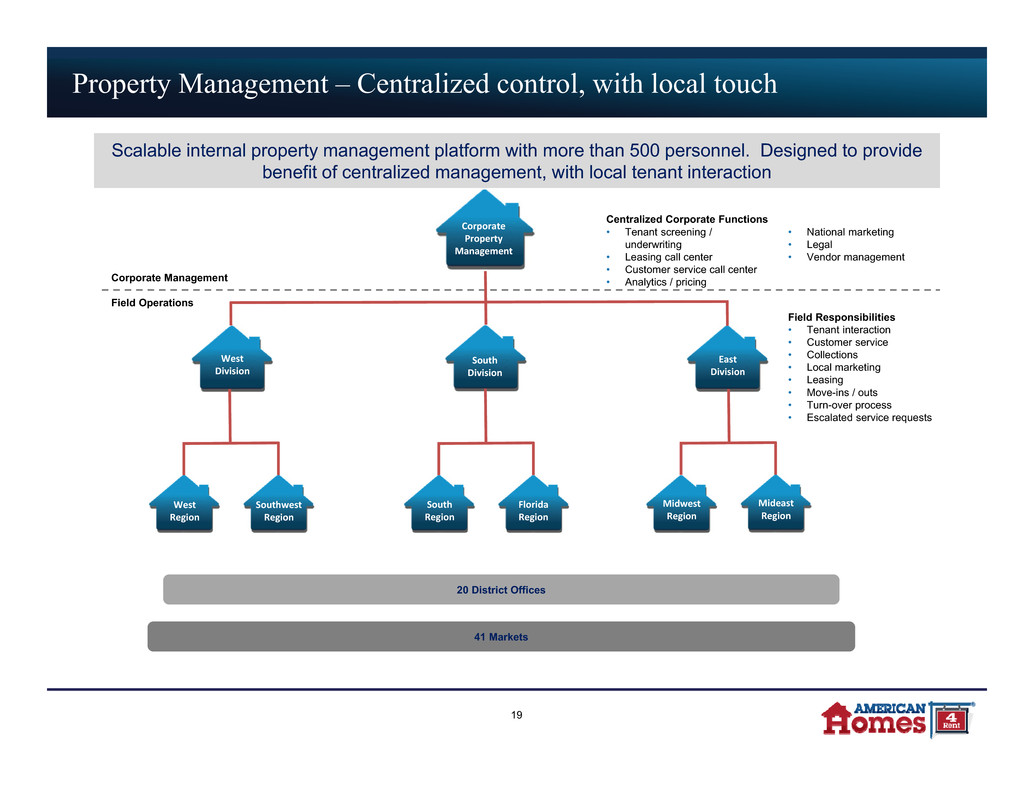
Property Management – Centralized control, with local touch 20 District Offices 41 Markets Centralized Corporate Functions • Tenant screening / underwriting • Leasing call center • Customer service call center • Analytics / pricing Scalable internal property management platform with more than 500 personnel. Designed to provide benefit of centralized management, with local tenant interaction Field Responsibilities • Tenant interaction • Customer service • Collections • Local marketing • Leasing • Move-ins / outs • Turn-over process • Escalated service requests 19 • National marketing • Legal • Vendor management Corporate Management Field Operations Corporate Property Management West Division South Division East Division West Region Southwest Region South Region Florida Region Midwest Region Mideast Region
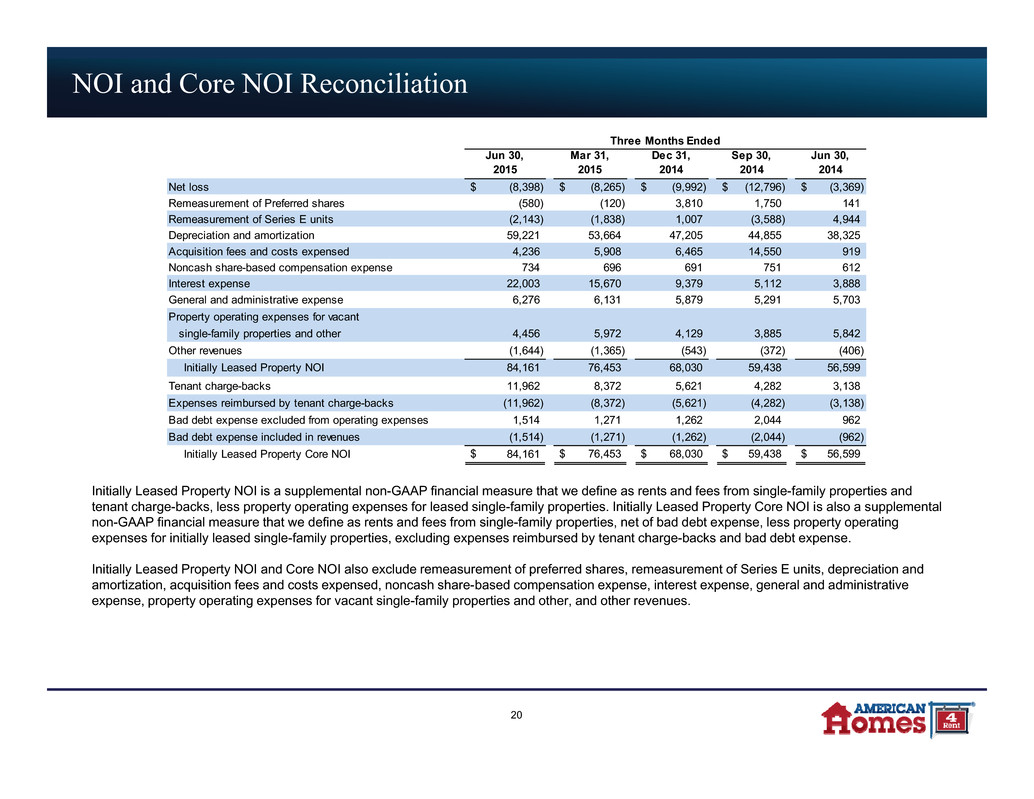
NOI and Core NOI Reconciliation 20 Initially Leased Property NOI is a supplemental non-GAAP financial measure that we define as rents and fees from single-family properties and tenant charge-backs, less property operating expenses for leased single-family properties. Initially Leased Property Core NOI is also a supplemental non-GAAP financial measure that we define as rents and fees from single-family properties, net of bad debt expense, less property operating expenses for initially leased single-family properties, excluding expenses reimbursed by tenant charge-backs and bad debt expense. Initially Leased Property NOI and Core NOI also exclude remeasurement of preferred shares, remeasurement of Series E units, depreciation and amortization, acquisition fees and costs expensed, noncash share-based compensation expense, interest expense, general and administrative expense, property operating expenses for vacant single-family properties and other, and other revenues. Jun 30, 2015 Mar 31, 2015 Dec 31, 2014 Sep 30, 2014 Jun 30, 2014 Net loss (8,398)$ (8,265)$ (9,992)$ (12,796)$ (3,369)$ Remeasurement of Preferred shares (580) (120) 3,810 1,750 141 Remeasurement of Series E units (2,143) (1,838) 1,007 (3,588) 4,944 Depreciation and amortization 59,221 53,664 47,205 44,855 38,325 Acquisition fees and costs expensed 4,236 5,908 6,465 14,550 919 Noncash share-based compensation expense 734 696 691 751 612 Interest expense 22,003 15,670 9,379 5,112 3,888 General and administrative expense 6,276 6,131 5,879 5,291 5,703 Property operating expenses for vacant single-family properties and other 4,456 5,972 4,129 3,885 5,842 Other revenues (1,644) (1,365) (543) (372) (406) Initially Leased Property NOI 84,161 76,453 68,030 59,438 56,599 Tenant charge-backs 11,962 8,372 5,621 4,282 3,138 Expenses reimbursed by tenant charge-backs (11,962) (8,372) (5,621) (4,282) (3,138) Bad debt expense excluded from operating expenses 1,514 1,271 1,262 2,044 962 Bad debt expense included in revenues (1,514) (1,271) (1,262) (2,044) (962) Initially Leased Property Core NOI 84,161$ 76,453$ 68,030$ 59,438$ 56,599$ Three Months Ended
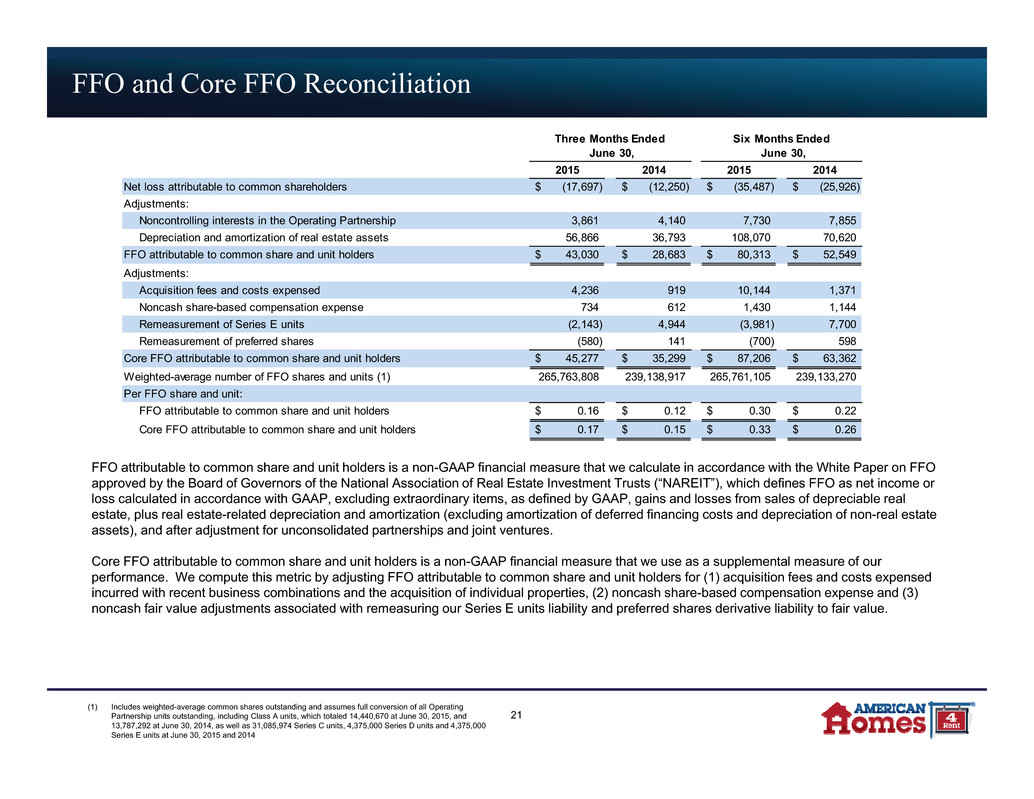
FFO and Core FFO Reconciliation 21 2015 2014 2015 2014 Net loss attributable to common shareholders (17,697)$ (12,250)$ (35,487)$ (25,926)$ Adjustments: Noncontrolling interests in the Operating Partnership 3,861 4,140 7,730 7,855 Depreciation and amortization of real estate assets 56,866 36,793 108,070 70,620 FFO attributable to common share and unit holders 43,030$ 28,683$ 80,313$ 52,549$ Adjustments: Acquisition fees and costs expensed 4,236 919 10,144 1,371 Noncash share-based compensation expense 734 612 1,430 1,144 Remeasurement of Series E units (2,143) 4,944 (3,981) 7,700 Remeasurement of preferred shares (580) 141 (700) 598 Core FFO attributable to common share and unit holders 45,277$ 35,299$ 87,206$ 63,362$ Weighted-average number of FFO shares and units (1) 265,763,808 239,138,917 265,761,105 239,133,270 Per FFO share and unit: FFO attributable to common share and unit holders 0.16$ 0.12$ 0.30$ 0.22$ Core FFO attributable to common share and unit holders 0.17$ 0.15$ 0.33$ 0.26$ Three Months Ended June 30, Six Months Ended June 30, FFO attributable to common share and unit holders is a non-GAAP financial measure that we calculate in accordance with the White Paper on FFO approved by the Board of Governors of the National Association of Real Estate Investment Trusts (“NAREIT”), which defines FFO as net income or loss calculated in accordance with GAAP, excluding extraordinary items, as defined by GAAP, gains and losses from sales of depreciable real estate, plus real estate-related depreciation and amortization (excluding amortization of deferred financing costs and depreciation of non-real estate assets), and after adjustment for unconsolidated partnerships and joint ventures. Core FFO attributable to common share and unit holders is a non-GAAP financial measure that we use as a supplemental measure of our performance. We compute this metric by adjusting FFO attributable to common share and unit holders for (1) acquisition fees and costs expensed incurred with recent business combinations and the acquisition of individual properties, (2) noncash share-based compensation expense and (3) noncash fair value adjustments associated with remeasuring our Series E units liability and preferred shares derivative liability to fair value. (1) Includes weighted-average common shares outstanding and assumes full conversion of all Operating Partnership units outstanding, including Class A units, which totaled 14,440,670 at June 30, 2015, and 13,787,292 at June 30, 2014, as well as 31,085,974 Series C units, 4,375,000 Series D units and 4,375,000 Series E units at June 30, 2015 and 2014
